The GeoCLIM software for gridding & analyzing precipitation & temperature. Tamuka Magadzire, FEWS NET Regional Scientist for Southern Africa
|
|
|
- Elaine Kellie Simmons
- 6 years ago
- Views:
Transcription


1 The GeoCLIM software for gridding & analyzing precipitation & temperature Tamuka Magadzire, FEWS NET Regional Scientist for Southern Africa
2 Outline What is GeoCLIM GeoCLIM Development Team GeoCLIM: objectives and functionality Current Status


3 What is GeoCLIM? 1. Geospatial climate datamanagement and analysis software tool developed to meet EAC PREPARED user needs. 2. Addresses the issue of climate observational data gaps over time and geographical locations. 3. Leverages on available field and satellite observations. PLANNING FOR RESILIENCE BUILDING IN EAST AFRICA THROUGH POLICY, ADAPTATION, RESEARCH AND ECONOMIC DEVELOPMENT
4 What is GeoCLIM? A spatial analysis tool designed for climatological analysis of historical rainfall and temperature data. Provides scientists and non-scientists with an array of accessible analysis and decision support tools for disciplines such as climate-smart agricultural development. Facilitates filling-in of observational gaps (rainfall and temp) using a blend of field observational networks and readily available satellite data.
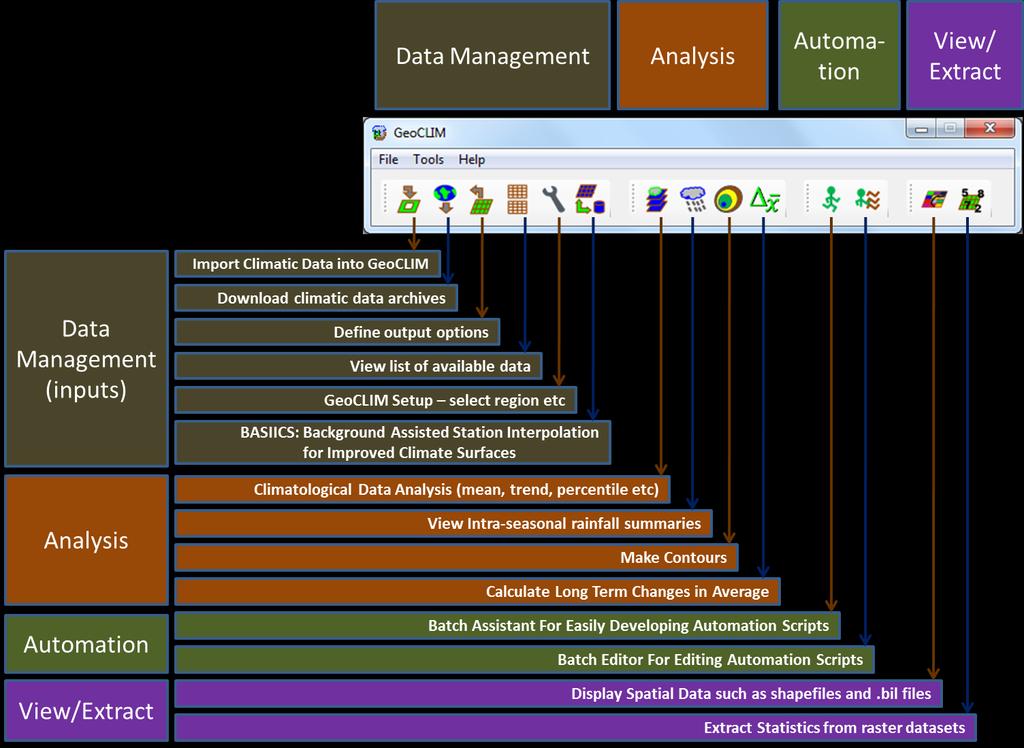
5 What is GeoCLIM GeoCLIM tools allow user to: blend station data (e.g. rain gauge) with gridded satellite data (e.g. CHIRPS) to create more accurate datasets, analyze historical climate data (e.g. calculate seasonal trends) create visual representations of climate data, create scripts (batch files) to quickly and efficiently analyze similar batches of climate data, Create and edit shapefiles and raster files, and extract statistics from raster datasets to create time series.
6

7 GeoCLIM Developers FEWS NET/ PREPARED/ ICPAC/ UCSB CHG/ USGS UCSB-CHG/USGS-FEWSNET Team PREPARED Climate Change Advisory Team
8 2 Main GeoCLIM objectives Gridding of climatic datasets Climatological data analysis Especially climate trends Identify areas getting hotter/cooler Identify areas getting dryer/wetter
9 Obj 1: Gridding of datasets Combines satellite-based estimates with local station data For rainfall: CHIRPS (1981-present + rain gauge data For temperature: Long-term average + temperature with station temperature. Offer option for simple interpolation with no background

10 Gridding options 3 modules related to gridding data


11 Blending CHIRPS + Raingauge datasets (IDW-based)
12 BASIICS Analysis: Typical outcomes Usually observe: Increased R-squared Decreased bias Decreased RMSE Decreased MAE Regr Slope 1 Regr Intercept 0


13 RFE2.0 Dek15, 2008 IRE2.0?? RFE2.0 Dek17, 2008 IRE2.0
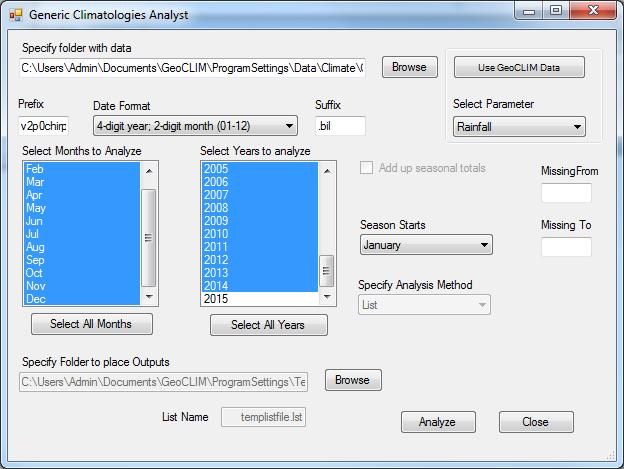
14 Obj 2: Climatological data analysis To assist the PREPARED and Global Climate Change activities, GeoCLIM analytical focus was on understanding How climate has been trending over the last 30+ years Current climate conditions


15 Rainfall Comparing average rainfall for minus

16 Climatological analysis Analysis of different variables
17 Climatological analysis Understanding climate from different perspectives
18 For example What is the average rainfall
19 For example What is the average rainfall
20 For example How variable is the rainfall
21 For example How variable is the rainfall (cv=stddev/mean)
22 For example What is the frequency with which we get less than 300mm of seasonal rainfall
23 For example What is the frequency with which we get less than 300mm of seasonal rainfall

24 For example What are the limits within which I can expect my lower, middle and upper tercile rainfall for relating to the seasonal forecast:
25 For example What are the limits within which I can expect my lower, middle and upper tercile rainfall for relating to the seasonal forecast: Below Normal Range (1 st to 33 rd Percentile)
26 For example What are the limits within which I can expect my lower, middle and upper tercile rainfall for relating to the seasonal forecast: Normal Range (33 rd to 67 th Percentile)
27 For example What are the limits within which I can expect my lower, middle and upper tercile rainfall for relating to the seasonal forecast: Above Normal Range (67 th to 99 th Percentile)
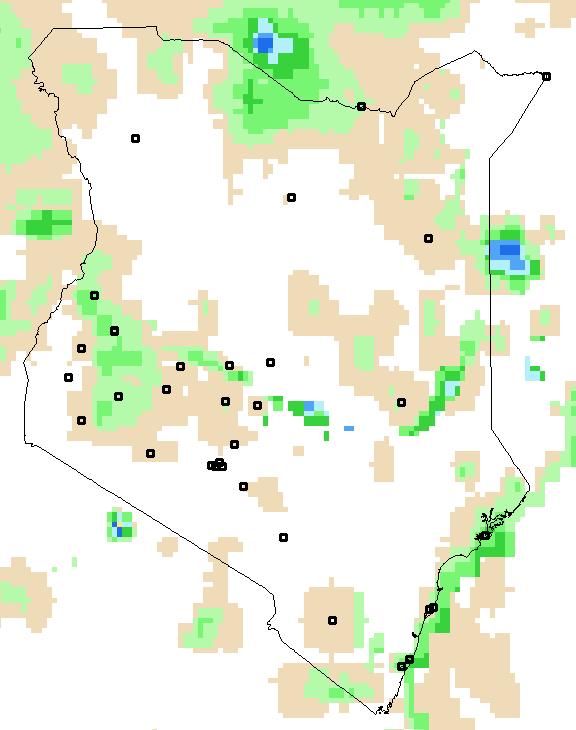
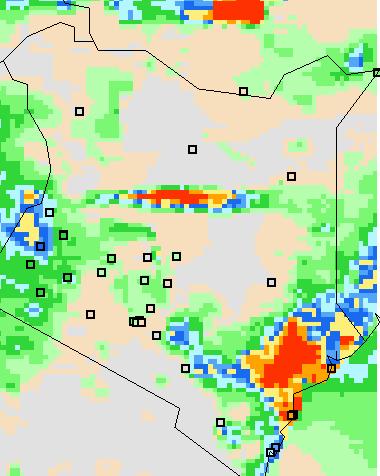
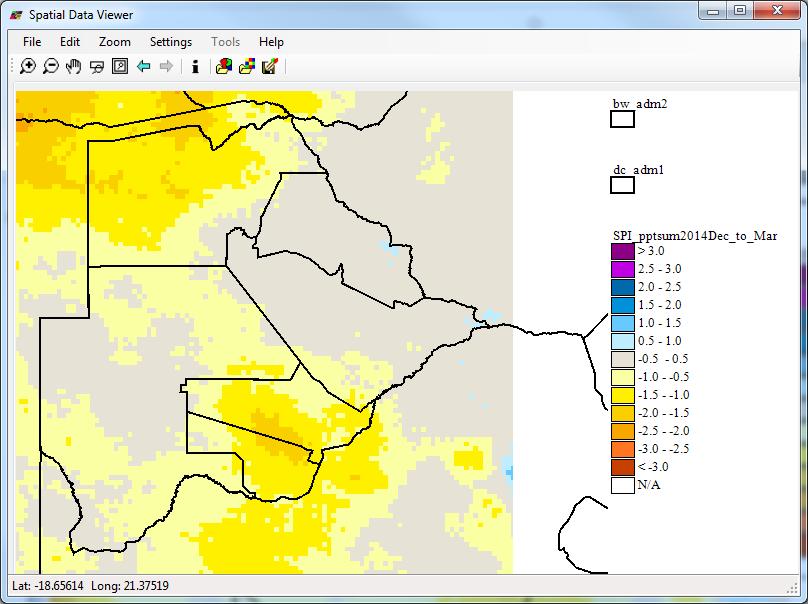
28 For example What is the seasonal rainfall for season expressed as SPI
29 For example What is the seasonal rainfall for season expressed as SPI
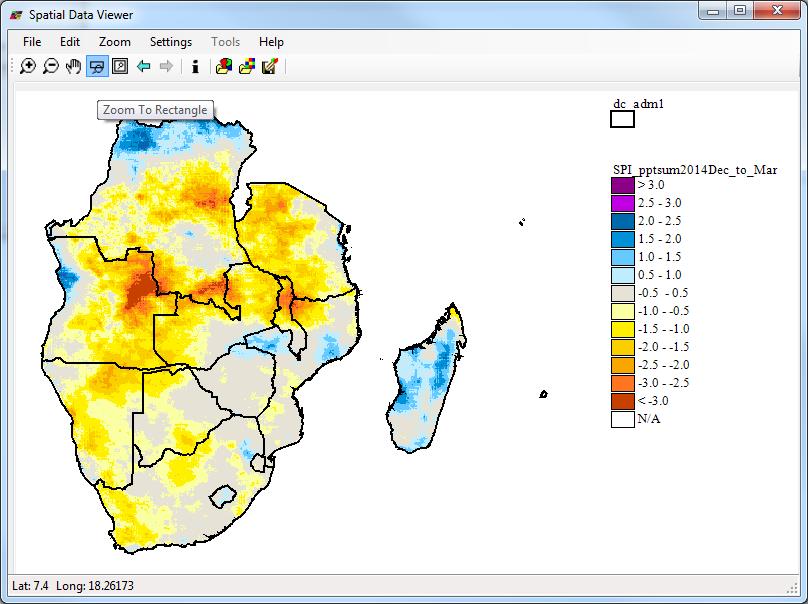
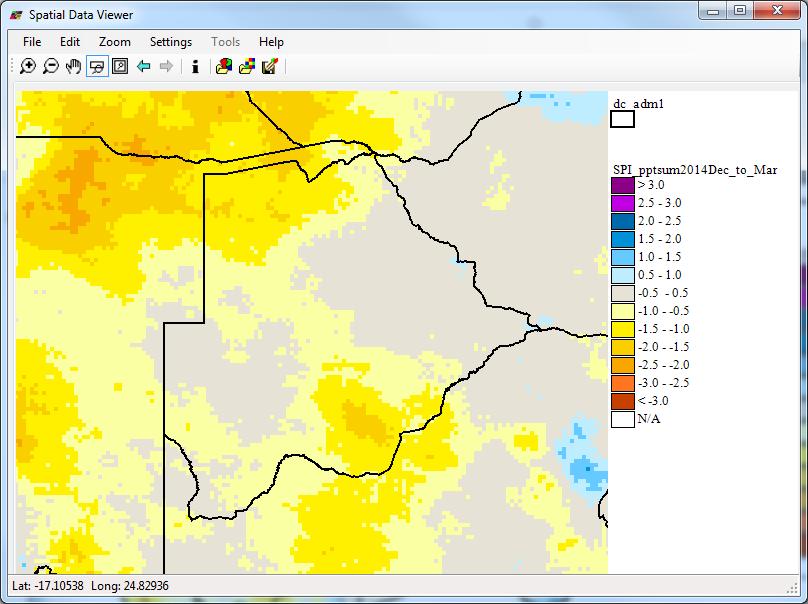
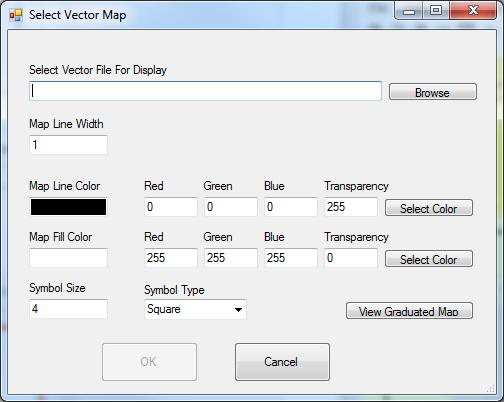
30 Useful GIS-type functions Generic mapping of raster datasets and shapefiles Extracting polygon statistics from raster datasets Raster contouring Windowing grids Masking Reclassifying grids Scripting/automation
31
32
33
34
35
36
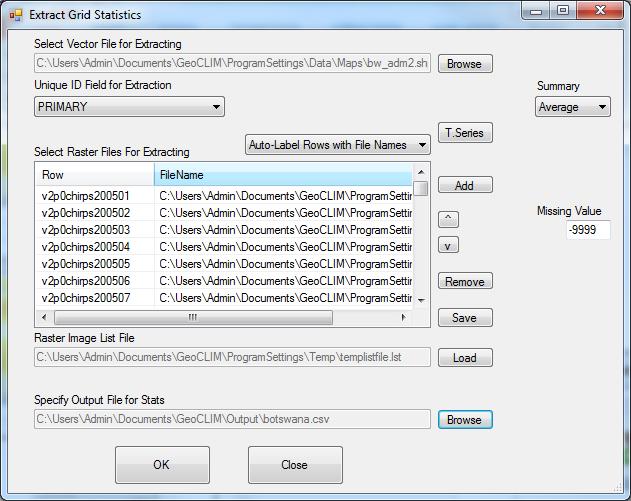
37 Extract statistics
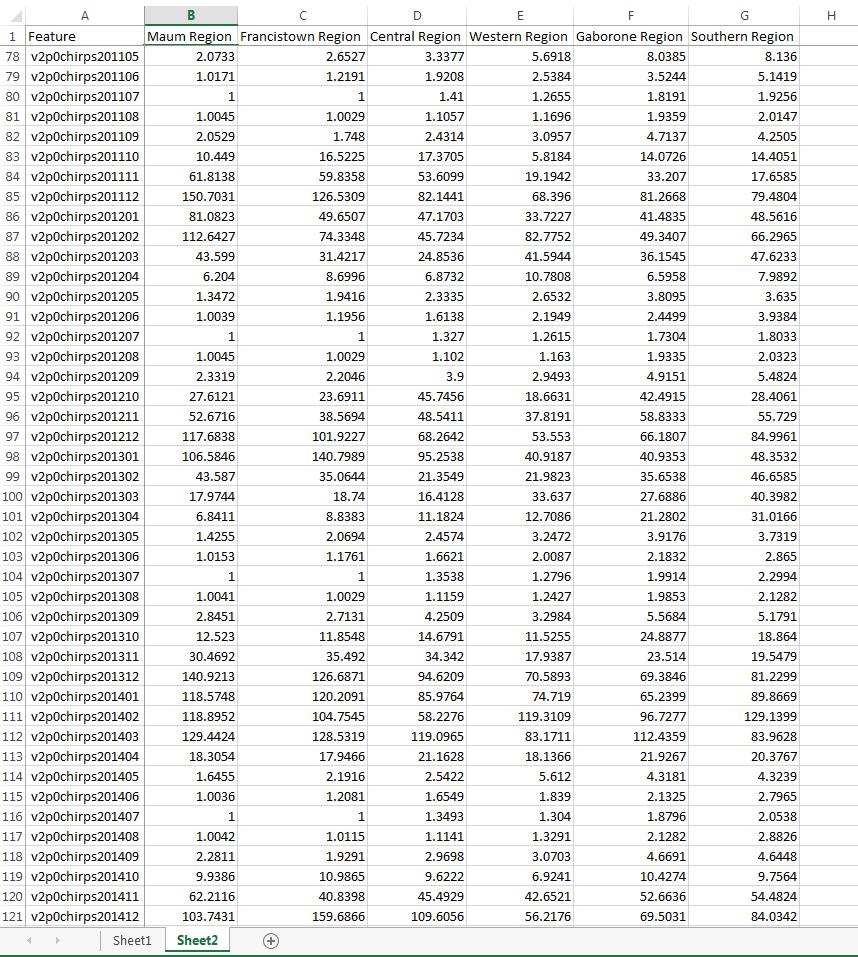
38 Extract Statistics

39 GeoCLIM Capacity Building Resources Resources for capacity building include Online Video tutorials Online PDF tutorials Comprehensive user manual Training powerpoints Training has been provided at ICPAC and several East African countries, SADC training workshops and in Botswana
40 Conclusions GeoCLIM is available as a stand-alone package for installation on your computer (download or memory stick) You can obtain the CHIRPS archive (download or memory stick) and use it with GeoCLIM In GeoCLIM, you can merge your station database with CHIRPS to make your own accurate gridded rainfall data time series You can analyze your gridded rainfall data time series to calculate long term rainfall trends, statistical parameters, SPI etc
41 Merci Obrigado Thank you
Climate Prediction Center National Centers for Environmental Prediction
 NOAA s Climate Prediction Center Climate Monitoring Tool Wassila M. Thiaw and CPC International Team Climate Prediction Center National Centers for Environmental Prediction CPC International Team Vadlamani
Intraseasonal Characteristics of Rainfall for Eastern Africa Community (EAC) Hotspots: Onset and Cessation dates. In support of;
 Hotspots: Onset and Cessation dates. In support of;") Intraseasonal Characteristics of Rainfall for Eastern Africa Community (EAC) Hotspots: Onset and Cessation dates In support of; Planning for Resilience in East Africa through Policy, Adaptation, Research
Intraseasonal Characteristics of Rainfall for Eastern Africa Community (EAC) Hotspots: Onset and Cessation dates In support of; Planning for Resilience in East Africa through Policy, Adaptation, Research
Current and Future Plans. R. Srinivasan
 Current and Future Plans R. Srinivasan Contents 1 The ArcSWAT Interface 2 VizSWAT: Output Visualization 3 User online support 4 MapWindows SWAT interface 5 ArcGIS SWAT/APEX interfaces 6 Radar Rainfall
Leon Creek Watershed October 17-18, 1998 Rainfall Analysis Examination of USGS Gauge Helotes Creek at Helotes, Texas
 Leon Creek Watershed October 17-18, 1998 Rainfall Analysis Examination of USGS Gauge 8181400 Helotes Creek at Helotes, Texas Terrance Jackson MSCE Candidate University of Texas San Antonio Abstract The
An Overview of USAID / FEWS-NET Activities at CPC
 An Overview of USAID / FEWS-NET Activities at CPC Nick Novella 12, Wassila Thiaw 2, Tom Di Liberto 12, Vadlamani Kumar 12 Nicholas.Novella@noaa.gov 1 Wyle Information Systems, CPC/NCEP/NWS/NOAA 1 Climate
GeoCLIM: CLIMATE DATA GRIDDING AND ANALYSIS TOOL NATIONAL TRAINING WORKSHOP KENYA REPORT
 GeoCLIM: CLIMATE DATA GRIDDING AND ANALYSIS TOOL NATIONAL TRAINING WORKSHOP KENYA REPORT 3-8 MARCH 2014, IMTR KMD, NAIROBI PREPARED PROJECT PREFACE This training workshop was held at IGAD Climate Prediction
GeoWEPP Tutorial Appendix
 GeoWEPP Tutorial Appendix Chris S. Renschler University at Buffalo - The State University of New York Department of Geography, 116 Wilkeson Quad Buffalo, New York 14261, USA Prepared for use at the WEPP/GeoWEPP
Bentley Map Advancing GIS for the World s Infrastructure
 Bentley Map Advancing GIS for the World s Infrastructure Presentation Overview Why would you need Bentley Map? What is Bentley Map? Where is Bentley Map Used? Why would you need Bentley Map? Because your
GIS at the Midwestern Regional Climate Center: A peek behind the curtain. Zoe Zaloudek, Geospatial Application Developer
 GIS at the Midwestern Regional Climate Center: A peek behind the curtain Zoe Zaloudek, Geospatial Application Developer CPASW, May 2018 What is the MRCC? GIS-based Maps and Products Regional Mesonet Program
Transactions on Information and Communications Technologies vol 18, 1998 WIT Press, ISSN
 STREAM, spatial tools for river basins, environment and analysis of management options Menno Schepel Resource Analysis, Zuiderstraat 110, 2611 SJDelft, the Netherlands; e-mail: menno.schepel@resource.nl
GIS Boot Camp for Education June th, 2011 Day 1. Instructor: Sabah Jabbouri Phone: (253) x 4854 Office: TC 136
 x 4854 Office: TC 136") GIS Boot Camp for Education June 27-30 th, 2011 Day 1 Instructor: Sabah Jabbouri Phone: (253) 833-9111 x 4854 Office: TC 136 Email: sjabbouri@greenriver.edu http://www.instruction.greenriver.edu/gis/ Summer
GIS Boot Camp for Education June 27-30 th, 2011 Day 1 Instructor: Sabah Jabbouri Phone: (253) 833-9111 x 4854 Office: TC 136 Email: sjabbouri@greenriver.edu http://www.instruction.greenriver.edu/gis/ Summer
Z A M B E Z I W A T E R R E S O U R C E S I N F O R M A T I O N S Y S T E M ( Z A M W I S )
") Z A M B E Z I W A T E R R E S O U R C E S I N F O R M A T I O N S Y S T E M ( Z A M W I S ) Angola Botswana Malawi Mozambique Namibia Tanzania Zambia Zimbabwe Win-win cooperation/ Cooperacao, ganhas tu,
Z A M B E Z I W A T E R R E S O U R C E S I N F O R M A T I O N S Y S T E M ( Z A M W I S ) Angola Botswana Malawi Mozambique Namibia Tanzania Zambia Zimbabwe Win-win cooperation/ Cooperacao, ganhas tu,
WMO Priorities and Perspectives on IPWG
 WMO Priorities and Perspectives on IPWG Stephan Bojinski WMO Space Programme IPWG-6, São José dos Campos, Brazil, 15-19 October 2012 1. Introduction to WMO Extended Abstract The World Meteorological Organization
Gridding of precipitation and air temperature observations in Belgium. Michel Journée Royal Meteorological Institute of Belgium (RMI)
") Gridding of precipitation and air temperature observations in Belgium Michel Journée Royal Meteorological Institute of Belgium (RMI) Gridding of meteorological data A variety of hydrologic, ecological,
Gridding of precipitation and air temperature observations in Belgium Michel Journée Royal Meteorological Institute of Belgium (RMI) Gridding of meteorological data A variety of hydrologic, ecological,
Regional Flash Flood Guidance and Early Warning System
 WMO Training for Trainers Workshop on Integrated approach to flash flood and flood risk management 24-28 October 2010 Kathmandu, Nepal Regional Flash Flood Guidance and Early Warning System Dr. W. E. Grabs
QGIS FLO-2D Integration
 EPiC Series in Engineering Volume 3, 2018, Pages 1575 1583 Engineering HIC 2018. 13th International Conference on Hydroinformatics Karen O Brien, BSc. 1, Noemi Gonzalez-Ramirez, Ph. D. 1 and Fernando Nardi,
SADA General Information
 SADA General Information Windows--based freeware designed to integrate scientific models with decision and cost analysis frameworks in a seamless, easy to use environment. Visualization/GIS Custom Analysis
These modules are covered with a brief information and practical in ArcGIS Software and open source software also like QGIS, ILWIS.
 Online GIS Training and training modules covered are: 1. ArcGIS, Analysis, Fundamentals and Implementation 2. ArcGIS Web Data Sharing 3. ArcGIS for Desktop 4. ArcGIS for Server These modules are covered
GIS Visualization: A Library s Pursuit Towards Creative and Innovative Research
 GIS Visualization: A Library s Pursuit Towards Creative and Innovative Research Justin B. Sorensen J. Willard Marriott Library University of Utah justin.sorensen@utah.edu Abstract As emerging technologies
Instituto de Pesquisas Meteorológicas - IPMet Universidade Estadual Paulista - Unesp
 IPMET WEB GIS APPLICATION FOR SEVERE WEATHER ALERT AND DECISION SUPPORT Jaqueline Murakami Kokitsu Instituto de Pesquisas Meteorológicas - IPMet Universidade Estadual Paulista - Unesp IPMet/Unesp Meteorological
INTRODUCTION TO GEOGRAPHIC INFORMATION SYSTEM By Reshma H. Patil
 INTRODUCTION TO GEOGRAPHIC INFORMATION SYSTEM By Reshma H. Patil ABSTRACT:- The geographical information system (GIS) is Computer system for capturing, storing, querying analyzing, and displaying geospatial
Time Series Analysis with SAR & Optical Satellite Data
 Time Series Analysis with SAR & Optical Satellite Data Thomas Bahr ESRI European User Conference Thursday October 2015 harris.com Motivation Changes in land surface characteristics mirror a multitude of
G EOSPAT I A L ERDAS IMAGINE. The world s most widely-used software package for creating information from geospatial data
 G EOSPAT I A L ERDAS IMAGINE The world s most widely-used software package for creating information from geospatial data ERDAS IMAGINE Geographic imaging professionals need to process vast amounts of
Using Geographic Information Systems and Remote Sensing Technology to Analyze Land Use Change in Harbin, China from 2005 to 2015
 Using Geographic Information Systems and Remote Sensing Technology to Analyze Land Use Change in Harbin, China from 2005 to 2015 Yi Zhu Department of Resource Analysis, Saint Mary s University of Minnesota,
Raster Analysis: An Example
 Raster Analysis: An Example Fires (1 or 4) Slope (1-4) + Geology (1-4) Erosion Ranking (3-12) 1 Typical Raster Model Types: Suitability Modeling: Where is optimum location? Distance Modeling: What is the
Among various open-source GIS programs, QGIS can be the best suitable option which can be used across partners for reasons outlined below.
 Comparison of Geographic Information Systems (GIS) software As of January 2018, WHO has reached an agreement with ESRI (an international supplier of GIS software) for an unlimited use of ArcGIS Desktop
Evaluating the uncertainty in gridded rainfall datasets over Eastern Africa for assessing the model performance and understanding climate change
 Evaluating the uncertainty in gridded rainfall datasets over Eastern Africa for assessing the model performance and understanding climate change In Support of: Planning for Resilience in East Africa through
Implementation of CLIMAP and GIS for Mapping the Climatic Dataset of Northern Iraq
 Implementation of CLIMAP and GIS for Mapping the Climatic Dataset of Northern Iraq Sabah Hussein Ali University of Mosul/Remote sensing Center KEYWORDS: CLIMAP, GIS, DEM, Climatic, IRAQ ABSTRACT The main
Forecast Predictions of Winds, Waves and Storm Surge during Hurricane Arthur (2014)
") Forecast Predictions of Winds, Waves and Storm Surge during Hurricane Arthur (2014) R Cyriac 1, JC Dietrich 1, JG Fleming 2, BO Blanton 3, RA Luettich Jr 4, C Kaiser 5 1 Dept. of Civil, Construction, and
Forecast Predictions of Winds, Waves and Storm Surge during Hurricane Arthur (2014) R Cyriac 1, JC Dietrich 1, JG Fleming 2, BO Blanton 3, RA Luettich Jr 4, C Kaiser 5 1 Dept. of Civil, Construction, and
EUROPA CHALLENGE 2016
 EUROPA CHALLENGE 2016 http://eurochallenge.como.polimi.it/ Solutions For Sustainable Cities! The Europa Challenge has always had Europe's INSPIRE Directive to guide project development. This year we continue
USDA s Operational GIS & related processes for International Weather & Crop Assessements
 USDA s Operational GIS & related processes for International Weather & Crop Assessements International Workshop on Agromet and GIS Applications for Agricultural Decision Making Jeju, South Korea December
What is PRECIS and what can it do?
 PRECIS: Facilitating capacity building and technology transfer to enable climate change mitigation and adaptation activities worldwide Joseph Intsiful, UNFCCC NWP Meeting, Mexico City 4-7 March 2008 Content:
WMO Climate Information Services System
 World Meteorological Organization Working together in weather, climate and water WMO Climate Information Services System Peer Hechler WMO WMO www.wmo.int Aim of talk To elaborate on some relevant global
SAWIDRA Southern Africa
 SAWIDRA Southern Africa Presenter: Thembani Moitlhobogi Assistant Database and IT Expert SADC Climate Services Centre 13 th EUMETSAT Forum in Africa 24-28 September 2018, Abidjan, Cote d Ivoire Context
Comparison of satellite rainfall estimates with raingauge data for Africa
 Comparison of satellite rainfall estimates with raingauge data for Africa David Grimes TAMSAT Acknowledgements Ross Maidment Teo Chee Kiat Gulilat Tefera Diro TAMSAT = Tropical Applications of Meteorology
Raster Analysis; A Yellowstone Example 3/29/2018
 Fires (1 or 4) Typical Raster Model Types: Raster Analysis: An Example Suitability Modeling: Where is optimum location? Distance Modeling: What is the most efficient path from A to B? + Slope (1-4) Geology
Esri and GIS Education
 Esri and GIS Education Organizations Esri Users 1,200 National Government Agencies 11,500 States & Regional Agencies 30,800 Cities & Local Governments 32,000 Businesses 8,500 Utilities 12,600 NGOs 11,000
Raster Analysis; A Yellowstone Example 10/24/2013. M. Helper GEO327G/386G, UT Austin 2. M. Helper GEO327G/386G, UT Austin 4
 + Fires (1 or 4) Slope (1-4) Geology (1-4) Erosion Ranking (3-12) Raster Analysis: An Example Typical Raster Model Types: Suitability Modeling: Where is optimum location? Distance Modeling: What is the
Analyzing the Earth Using Remote Sensing
 Analyzing the Earth Using Remote Sensing Instructors: Dr. Brian Vant- Hull: Steinman 185, 212-650- 8514 brianvh@ce.ccny.cuny.edu Ms. Hannah Aizenman: NAC 7/311, 212-650- 6295 haizenman@ccny.cuny.edu Dr.
Climpact2 and PRECIS
 Climpact2 and PRECIS WMO Workshop on Enhancing Climate Indices for Sector-specific Applications in the South Asia region Indian Institute of Tropical Meteorology Pune, India, 3-7 October 2016 David Hein-Griggs
Transboundary water management with Remote Sensing. Oluf Jessen DHI Head of Projects, Water Resources Technical overview
 Transboundary water management with Remote Sensing Oluf Jessen DHI Head of Projects, Water Resources Technical overview ozj@dhigroup.com Transboundary water management Water management across national
Performing Advanced Cartography with Esri Production Mapping
 Esri International User Conference San Diego, California Technical Workshops July 25, 2012 Performing Advanced Cartography with Esri Production Mapping Tania Pal & Madhura Phaterpekar Agenda Outline generic
SuperPack North America
 SuperPack North America Speedwell SuperPack makes available an unprecedented range of quality historical weather data, and weather data feeds for a single annual fee. SuperPack dramatically simplifies
Land Cover Data Processing Land cover data source Description and documentation Download Use Use
 Land Cover Data Processing This document provides a step by step procedure on how to build the land cover data required by EnSim. The steps provided here my be long and there may be short cuts (like using
A PROTOTYPE FOR THE APPLICATION OF CLIMATE INFORMATION TO IMPROVE HIGHWAY AND INFRASTRUCTURE PLANNING IN THE COASTAL REGIONS OF LAKE VICTORIA
 A PROTOTYPE FOR THE APPLICATION OF CLIMATE INFORMATION TO IMPROVE HIGHWAY AND INFRASTRUCTURE PLANNING IN THE COASTAL REGIONS OF LAKE VICTORIA Kara Smith October 26, 2016 Lake Victoria Levels Sudden increase
Available data and products for Agricultural purpose at the National Meteorological Agency of Ethiopia
 Available data and products for Agricultural purpose at the National Meteorological Agency of Ethiopia NSF-PIRE KICKOFF CONFERENCE, JULY 11-12 DELANO HOTEL, BAHIR DAR By Melesse Lemma National Meteorological
TOOLS AND DATA NEEDS FOR FORECASTING AND EARLY WARNING
 TOOLS AND DATA NEEDS FOR FORECASTING AND EARLY WARNING Professor Richard Samson Odingo Department of Geography and Environmental Studies University of Nairobi, Kenya THE NEED FOR ADEQUATE DATA AND APPROPRIATE
Data Aggregation with InfraWorks and ArcGIS for Visualization, Analysis, and Planning
 Data Aggregation with InfraWorks and ArcGIS for Visualization, Analysis, and Planning Stephen Brockwell President, Brockwell IT Consulting, Inc. Join the conversation #AU2017 KEYWORD Class Summary Silos
Raster Analysis: An Example
 Raster Analysis: An Example Fires (1 or 4) Slope (1-4) + Geology (1-4) Erosion Ranking (3-12) 11/8/2016 GEO327G/386G, UT Austin 1 Typical Raster Model Types: Suitability Modeling: Where is optimum location?
GEOGRAPHICAL INFORMATION SYSTEMS. GIS Foundation Capacity Building Course. Introduction
 GEOGRAPHICAL INFORMATION SYSTEMS. GIS Foundation Capacity Building Course. Introduction In recent times digital mapping has become part and parcel of our daily lives with experience from Google Maps on
African requirements for SDI standardization Antony Cooper Operating Unit Fellow Built Environment CSIR PO Box 395, Pretoria, 0001, South Africa
 ISO/TC 211 workshop on spatial data infrastructures (SDIs) African requirements for SDI standardization Antony Cooper Operating Unit Fellow Built Environment CSIR PO Box 395, Pretoria, 0001, South Africa
HIRES 2017 Syllabus. Instructors:
 HIRES 2017 Syllabus Instructors: Dr. Brian Vant-Hull: Steinman 185, 212-650-8514, brianvh@ce.ccny.cuny.edu Ms. Hannah Aizenman: NAC 7/311, 212-650-6295, haizenman@ccny.cuny.edu Dr. Tarendra Lakhankar:
Display and analysis of weather data from NCDC using ArcGIS
 Display and analysis of weather data from NCDC using ArcGIS Helen M. Cox Associate Professor Geography Department California State University, Northridge and Stephen Krug Graduate Student Geography Department
Model verification and tools. C. Zingerle ZAMG
 Model verification and tools C. Zingerle ZAMG Why verify? The three most important reasons to verify forecasts are: to monitor forecast quality - how accurate are the forecasts and are they improving over
An Online Platform for Sustainable Water Management for Ontario Sod Producers
 An Online Platform for Sustainable Water Management for Ontario Sod Producers 2014 Season Update Kyle McFadden January 30, 2015 Overview In 2014, 26 weather stations in four configurations were installed
National Weather Service Flood Forecast Needs: Improved Rainfall Estimates
 National Weather Service Flood Forecast Needs: Improved Rainfall Estimates Weather Forecast Offices Cleveland and Northern Indiana Ohio River Forecast Center Presenter: Sarah Jamison, Service Hydrologist
PRECIS: Facilitating capacity building and climate vulnerability studies and applications in Africa
 PRECIS: Facilitating capacity building and climate vulnerability studies and applications in Africa Richard Jones Presentation to Met Africa group, Reading University 15.10.2007 Crown copyright Page 1
Software requirements * :
 Title: Product Type: Developer: Target audience: Format: Software requirements * : Using GRACE to evaluate change in Greenland s ice sheet Part I: Download, import and map GRACE data Part II: View and
Leveraging Your Geo-spatial Data Investments with Quantum GIS: an Open Source Geographic Information System
 Leveraging Your Geo-spatial Data Investments with Quantum GIS: an Open Source Geographic Information System Donald L. Schrupp Colorado Division of Wildlife (Retired) Danny Lewis Texas Parks and Wildlife
Demonstrative presentation of AIM/Impact model
 APEIS Capacity Building Workshop on Integrated Environmental Assessment in the Asia Pacific Region October 2002 Demonstrative presentation of AIM/Impact model Mr. Kiyoshi Takahashi, NIES, Japan Dr. Yasuaki
Using the EartH2Observe data portal to analyse drought indicators. Lesson 4: Using Python Notebook to access and process data
 Using the EartH2Observe data portal to analyse drought indicators Lesson 4: Using Python Notebook to access and process data Preface In this fourth lesson you will again work with the Water Cycle Integrator
International Desks: African Training Desk and Projects
 The Climate Prediction Center International Desks: African Training Desk and Projects Wassila M. Thiaw Team Leader Climate Prediction Center National Centers for Environmental Predictions 1 African Desk
Seasonal-Scale Drought Forecasting in Africa and the Middle East
 Seasonal-Scale Drought Forecasting in Africa and the Middle East Kristi R. Arsenault (SAIC, Inc; NASA/GSFC) Shrad Shukla (UCSB), Christa Peters-Lidard (NASA/GSFC) and Collaborators GEWEX MEETING, MAY 9,
Section 2.2 RAINFALL DATABASE S.D. Lynch and R.E. Schulze
 Section 2.2 RAINFALL DATABASE S.D. Lynch and R.E. Schulze Background to the Rainfall Database The rainfall database described in this Section derives from a WRC project the final report of which was titled
The North American Drought Monitor - The Canadian Perspective -
 The North American Drought Monitor - The Canadian Perspective - Trevor Hadwen National Agroclimate Information Service AAFC-PFRA, Regina Canmore, Alberta March 16-18, 2008 Background The NADM is a cooperative
GIS APPLICATIONS IN SOIL SURVEY UPDATES
 GIS APPLICATIONS IN SOIL SURVEY UPDATES ABSTRACT Recent computer hardware and GIS software developments provide new methods that can be used to update existing digital soil surveys. Multi-perspective visualization
Display data in a map-like format so that geographic patterns and interrelationships are visible
 Vilmaliz Rodríguez Guzmán M.S. Student, Department of Geology University of Puerto Rico at Mayagüez Remote Sensing and Geographic Information Systems (GIS) Reference: James B. Campbell. Introduction to
DEVELOPMENT OF A FORECAST EARLY WARNING SYSTEM ethekwini Municipality, Durban, RSA. Clint Chrystal, Natasha Ramdass, Mlondi Hlongwae
 DEVELOPMENT OF A FORECAST EARLY WARNING SYSTEM ethekwini Municipality, Durban, RSA Clint Chrystal, Natasha Ramdass, Mlondi Hlongwae LOCATION DETAILS AND BOUNDARIES ethekwini Municipal Area = 2297 km 2
Met Éireann Climatological Note No. 15 Long-term rainfall averages for Ireland,
 Met Éireann Climatological Note No. 15 Long-term rainfall averages for Ireland, 1981-2010 Séamus Walsh Glasnevin Hill, Dublin 9 2016 Disclaimer Although every effort has been made to ensure the accuracy
Progress in Operational Quantitative Precipitation Estimation in the Czech Republic
 Progress in Operational Quantitative Precipitation Estimation in the Czech Republic Petr Novák 1 and Hana Kyznarová 1 1 Czech Hydrometeorological Institute,Na Sabatce 17, 143 06 Praha, Czech Republic (Dated:
GIS Tools, Data, & Methods in the Weekly US Drought Monitor
 GIS Tools, Data, & Methods in the Weekly US Drought Monitor International Workshop on Agromet and GIS Applications for Agricultural Decision Making Jeju, South Korea December 5, 2016 Eric Luebehusen USDA/OCE/WAOB
WeatherHawk Weather Station Protocol
 WeatherHawk Weather Station Protocol Purpose To log atmosphere data using a WeatherHawk TM weather station Overview A weather station is setup to measure and record atmospheric measurements at 15 minute
Satellite And Weather Information (SAWIDRA)/RARS
/RARS") Satellite And Weather Information for Disaster Resilience in Africa (SAWIDRA)/RARS Benjamin Lamptey, PhD ACMAD bllamptey@gmail.com EU funding and overall context 1. EUR 80 million Intra ACP Programme Building
Satellite And Weather Information for Disaster Resilience in Africa (SAWIDRA)/RARS Benjamin Lamptey, PhD ACMAD bllamptey@gmail.com EU funding and overall context 1. EUR 80 million Intra ACP Programme Building
Scripting and Geoprocessing for Raster Analysis Multiyear Crop Analysis
 Authors: David T. Hansen and Barbara Simpson Scripting and Geoprocessing for Raster Analysis Multiyear Crop Analysis Presented by David T. Hansen and Barbara Simpson at the ESRI User Conference, 2012,
Web GIS Based Disaster Portal Project ESRI INDIA
 Web GIS Based Disaster Portal Project ESRI INDIA Contents Requirements Overview Product Technology Used KSNDMC Application Architecture Tool Developed Benefits for the End User Problems faced during implementation
Data Creation and Editing
 11.520:A Workshop on Geographical Information Systems 1.188: Urban Planning and Social Science Laboratory Data Creation and Editing Based in part on notes by Prof. Joseph Ferreira and Michael Flaxman Lulu
Richard R. Heim Jr. Michael J. Brewer
 Linking GDIS Data Sets Using the NIDIS Drought Portal Richard R. Heim Jr. Michael J. Brewer NOAA/NESDIS/ Asheville, North Carolina International Global Drought Information System Workshop: Next Steps Caltech
Amita Mehta and Ana Prados
 Building Capacity in Utilizing NASA Remote Sensing Observations in SWAT for Water Resources and Agricultural Management Applications Amita Mehta and Ana Prados NASA - University of Maryland Baltimore County
Curriculum Vitae of Gregory John Husak
 PROFESSIONAL POSITIONS Curriculum Vitae of Gregory John Husak Department of Geography University of California Santa Barbara, CA 93106 Phone: 805.893.8322 email: husak@geog.ucsb.edu 2006-Present Assistant
Operational Monsoon Monitoring at NCEP
 Operational Monsoon Monitoring at NCEP Wassila M. Thiaw Climate Prediction Center National Centers for Environmental Predictions Operational Monsoon Monitoring at NCEP Wassila M. Thiaw Climate Prediction
GSDI: Towards a Spatially Enabled Society
 GSDI: Towards a Spatially Enabled Society Dr. David J. Coleman, President Global Spatial Data Infrastructure Association UN Regional Cartographic Conference for the Americas, United Nations, New York,
CWMS Modeling for Real-Time Water Management
 Hydrologic Engineering Center Training Course on CWMS Modeling for Real-Time Water Management August 2018 Davis, California The Corps Water Management System (CWMS) is a software and hardware system to
FAO GAEZ Data Portal
 FAO GAEZ Data Portal www.fao.org/nr/gaez Renato Cumani Environment Officer Land and Water Division Natural Resources Management and Environment Department Food and Agriculture Organization of the UN October
Abstract: Contents. Literature review. 2 Methodology.. 2 Applications, results and discussion.. 2 Conclusions 12. Introduction
 Abstract: Landfill is one of the primary methods for municipal solid waste disposal. In order to reduce the environmental damage and to protect the public health and welfare, choosing the site for landfill
Introduction to Geographic Information Systems (GIS): Environmental Science Focus
: Environmental Science Focus") Introduction to Geographic Information Systems (GIS): Environmental Science Focus September 9, 2013 We will begin at 9:10 AM. Login info: Username:!cnrguest Password: gocal_bears Instructor: Domain: CAMPUS
Introduction to Geographic Information Systems (GIS): Environmental Science Focus September 9, 2013 We will begin at 9:10 AM. Login info: Username:!cnrguest Password: gocal_bears Instructor: Domain: CAMPUS
Tonga Country Report
 Tonga Country Report Tonga Meteorological Services Ph. (676)35355 email: metstaff@met.gov.to Joint Meeting of RA II WIGOS Project and RA V TT-SU Jakarta, Indonesia / 11 October 2018 BMKG Headquarter Outline
Watershed Modeling With DEMs
 Watershed Modeling With DEMs Lesson 6 6-1 Objectives Use DEMs for watershed delineation. Explain the relationship between DEMs and feature objects. Use WMS to compute geometric basin data from a delineated
Data Aggregation with InfraWorks and ArcGIS for Visualization, Analysis, and Planning
 CI125230 Data Aggregation with InfraWorks and ArcGIS for Visualization, Analysis, and Planning Stephen Brockwell Brockwell IT Consulting Inc. Sean Kinahan Brockwell IT Consulting Inc. Learning Objectives
Geography 38/42:376 GIS II. Topic 1: Spatial Data Representation and an Introduction to Geodatabases. The Nature of Geographic Data
 Geography 38/42:376 GIS II Topic 1: Spatial Data Representation and an Introduction to Geodatabases Chapters 3 & 4: Chang (Chapter 4: DeMers) The Nature of Geographic Data Features or phenomena occur as
REQUIREMENTS FOR WEATHER RADAR DATA. Review of the current and likely future hydrological requirements for Weather Radar data
 WORLD METEOROLOGICAL ORGANIZATION COMMISSION FOR BASIC SYSTEMS OPEN PROGRAMME AREA GROUP ON INTEGRATED OBSERVING SYSTEMS WORKSHOP ON RADAR DATA EXCHANGE EXETER, UK, 24-26 APRIL 2013 CBS/OPAG-IOS/WxR_EXCHANGE/2.3
Watershed Analysis of the Blue Ridge Mountains in Northwestern Virginia
 Watershed Analysis of the Blue Ridge Mountains in Northwestern Virginia Mason Fredericks December 6, 2018 Purpose The Blue Ridge Mountain range is one of the most popular mountain ranges in the United
High Speed / Commuter Rail Suitability Analysis For Central And Southern Arizona
 High Speed / Commuter Rail Suitability Analysis For Central And Southern Arizona Item Type Reports (Electronic) Authors Deveney, Matthew R. Publisher The University of Arizona. Rights Copyright is held
Space Application in Support of Land Management for SDG Implementation
 Space Application in Support of Land Management for SDG Implementation Regional Expert Workshop on Land Accounting for SDG Monitoring and Reporting 26 September 2017 Space Application Section Information
Geog 210C Spring 2011 Lab 6. Geostatistics in ArcMap
 Geog 210C Spring 2011 Lab 6. Geostatistics in ArcMap Overview In this lab you will think critically about the functionality of spatial interpolation, improve your kriging skills, and learn how to use several
Newcastle City Council - Migration to QGIS and Open Source GIS
 Newcastle City Council - Migration to QGIS and Open Source GIS Brian Williams & Saber Razmjooei 13 April 2016 Outline I Why Open Source? Rational What we did How we did it Benefits Discussion Points QGIS
EC/FAO Programme on Information Systems to Improve Food Security Decision-Making in the European Neighbourhood Policy (ENP) East Area
 East Area") EC/FAO Programme on Information Systems to Improve Food Security Decision-Making in the European Neighbourhood Policy (ENP) East Area Training on introduction of Geographic Information System (GIS) to
EC/FAO Programme on Information Systems to Improve Food Security Decision-Making in the European Neighbourhood Policy (ENP) East Area Training on introduction of Geographic Information System (GIS) to
Evaluating Physical, Chemical, and Biological Impacts from the Savannah Harbor Expansion Project Cooperative Agreement Number W912HZ
 Evaluating Physical, Chemical, and Biological Impacts from the Savannah Harbor Expansion Project Cooperative Agreement Number W912HZ-13-2-0013 FY 2016 - First Quarterly Report January 1, 2016 Submitted
What is one-month forecast guidance?
 What is one-month forecast guidance? Kohshiro DEHARA (dehara@met.kishou.go.jp) Forecast Unit Climate Prediction Division Japan Meteorological Agency Outline 1. Introduction 2. Purposes of using guidance
![)UDQFR54XHQWLQ(DQG'tD]'HOJDGR&](/thumbs/95/125846872.jpg ")UDQFR54XHQWLQ(DQG'tD]'HOJDGR&") &21&(37,21$1',03/(0(17$7,212)$1+
&21&(37,21$1',03/(0(17$7,212)$1+ Keynote Address. Development of Multi-Hazard Early Warning System in Indonesia by Prof. Armi Susandi, PhD
 Keynote Address Development of Multi-Hazard Early Warning System in Indonesia by Prof. Armi Susandi, PhD Professor of Meteorology, Bandung Institute of Technology, Indonesia. Dr. Susandi is an expert in