Storm and Runoff Calculation Standard Review Snowmelt and Climate Change
|
|
|
- Stephanie Richards
- 6 years ago
- Views:
Transcription
1 Storm and Runoff Calculation Standard Review Snowmelt and Climate Change Presented by Don Moss, M.Eng., P.Eng. and Jim Hartman, P.Eng. Greenland International Consulting Ltd.


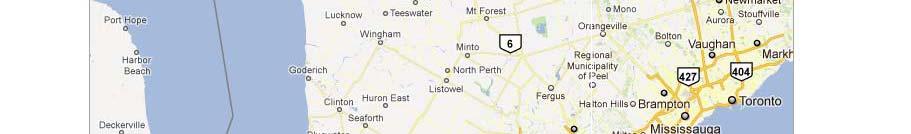
2 Map from Google Maps


3 TOBM is a four season resort town situated on Georgian Bay at the gateway to the Bruce Peninsula. TOBM is in the path of the prevailing snow squalls resulting in significant annual snow fall amounts. TOBM has unique drainage challenges, steep slopes and five ski resorts that have snow making capabilities. photo provided by Blue Mountain Resorts
4 In the Town s recent review of it s municipal standards, a review of potential impacts from climate change was to be considered because of it s unique watershed drainage. Although there is not presently a major impact from the ski slopes on the Town s infrastructure could this change in the future? What type of changes could be expected?
5 Interim Measures Typically Being Applied in Municipalities Overview of Findings from Federal/Provincial Investigations Data Sources Available to TOBM
6 In advance of Federal or Provincial directives, other municipalities that have decided to factor in some potential impact due to climate change have included features such as: 15% increase in rainfall intensities; 15% increase in storage volumes; Adjustments to hydrology model parameters; and, Requesting additional i freeboard for lower return period events.
7 A 20 mm 0.5 hr. typical rainfall event will increase 1.05 mm/decade. d Temperature warming 1.8 to 3.4 C by the year Peak rainfall intensities increasing 2.4% with each incremental degree of warming. Trends toward more extreme weather events, with shorter durations (convective T-storms). As weather patterns change there will be a trend for warmer temperatures and extreme rainfall earlier in the year (Spring).


8 Environment Canada Climate Normals for Owen Sound Weather Station Annual Snowfall Accumulation of cm Daily and Hourly Rainfall Records Temperature Records Snow Making accounts for approx. 10 to 15% of SWE annually photo provided by Blue Mountain Resorts


9 Overall, there are five ski resorts drain to the Town s municipal infrastructure photo provided by Blue Mountain Resorts


10 photo provided by Blue Mountain Resorts Largest snowmaking system in Canada


11 As the weather patterns begin to change to show more extremes, rainfall events and warmer temperatures will potentially be more prevalent earlier in the spring. As such, accounting for a potential impact due to climate change can be achieved by determining the impact from a rain-on-snow event. Will this phenomena be complicated by local snow making capabilities? photo provided by Blue Mountain Resorts
12 Snow Melt - Temperature Relationships Snow Pack Development Snow Pack Land Use Relationships Rain-on-Snow Relationships
13 Most Common Method Applied Melt (mm/day) = K (coefficient ) X (T Ta) Ta is the threshold temperature that causes the ice in the base of the snow pack to begin to melt (typically around 2 C). This value has been as high as 5 C for early spring. Ti is the air temperature in C. Melt is measured using the surface area of the contributing watershed. K Coefficient ranges from 3.9 to 5.55 mm (snow water equivalent (SWE)) / C/day with an average rate of 4.1 (Other areas similar latitude)
14 Up to 5% of the snow pack weight in external water can be absorbed b without t any release (referred to as ripe snow); and Snowmelt begins when liquid water equivalent exceeds 15% of total snow pack SWE 80 calories of heat to melt one (1) gram of water. Snow packs in ski areas have been measured to change in density from 400 to 700 kg/m³ (mid season to end of season)
15 The melt equation K coefficient can also be adjusted by the type of land use Open space a= Forest a= Ski slope a= Rango and Martinec
16 Sample Test Area For a 20 ha ski area watershed 40% forest and 60% ski slope warm day in late March or early April (7 C average temperature over full day) with average temperature of 5 C above the threshold temperature (2 C). Melt = (0.358 X 4.1 X X 4.1 X 0.60) X (7 C-2 C) = mm/day or 3,374 m³/day or 39 l/sec
17 The latent heat from rain on a snow pack releases 7.5 times the weight of the water being applied. A 51.2 mm rainfall event can reduce the entire snow pack accumulated through the winter months for TOBM Equivalent summer rainfall event 5 year 6 hour event 50 year 1 hour event Based on Owen Sound records


18 Review of the raw hourly data from Owen Sound station Table 1: Return Period April Rainfall Volumes 6 Hr 1 Hr Rainfall Rainfall (mm) (mm)
19 The magnitude of the April rainfall event volumes are 45.8% of the volumes from the summer rainfall events for the 6 hour 5 year event and 1 hour 50 year events. S l T A Sample Test Area For a 20 ha ski area watershed Melt = 20.0 ha X [(165.8) mm mm of rain] = 22,548 m³/6 hrs = 1.74 m³/sec The 5 year 6 hr event would have a peak flow rate as high as 1.74 m³/sec in early April. A similar analysis with the 1 hour rainfall volume shows the 5 year event peak flow rate would be as high as 4.46 m³/sec. (Summer Q 25 = 4.32 m³/sec)
20 Even though the rainfall event in April is less than ½ the summer rainfall event for the 5 year storm when applied to a ripe snow pack it can generate a larger runoff than the 25 year summer event By 2050 a 3 year April event will generate the same runoff as the present day 25 year summer event
 = 74,120 m³ for the 100 year event (rain on snow")

21 The typical 20 ha example would generate a 6 hour volume of: = 37,570 m³ for the 5 year event (rain on snow volume) = 74,120 m³ for the 100 year event (rain on snow volume) Traditional 100 year predevelopment release rate requires 73,440 m³ Facility sizing should consider the volume required from a rain-on-snow event ent as well
22 In areas that receive runoff from ski slopes or heavy snow accumulation: The 25 year summer rainfall event should be considered d to replace the traditional 5 year event design for municipal servicing. Minimum culvert size based on the 25 year summer event should be considered. The spring rain-on-snow event runoff volume should be compared with the post-to to predevelopment volume to be controlled for a summer event. All subject to benefit : cost analysis.
23 Climate change can expect to increase spring rainfall volumes by 4.2 mm by 2050, over the next40years(105mmperdecade); (1.05 The rain-on-snow event should be considered for introduction into the municipal standards for areas that receive drainage from ski slopes or areas of significant snow accumulation; and, The Regulatory (Regional) storm will still govern watercourse floodplain conditions and SWM facility emergency overflow outlet designs.


24 Consider the cost:benefit of incorporating the findings and trends presented herein into municipal criteria.
Bill Kappel. Doug Hultstrand. Applied Weather Associates
 Cool-Season PMP/PMF Meteorological Time Series for Snow Melt Calculations Bill Kappel Senior Meteorologist/Vice President Doug Hultstrand Hydrometeorologist Applied Weather Associates www.appliedweatherassociates.com
Regional Climate Change: Current Impacts and Perspectives Greater Lake Nipissing Stewardship Council Annual Meeting Wednesday April 16, 2014
 Regional Climate Change: Current Impacts and Perspectives Greater Lake Nipissing Stewardship Council Annual Meeting Wednesday April 16, 2014 Speaker: Peter Bullock, Stantec Consulting Information Source:
Basic Hydrologic Science Course Understanding the Hydrologic Cycle Section Six: Snowpack and Snowmelt Produced by The COMET Program
 Basic Hydrologic Science Course Understanding the Hydrologic Cycle Section Six: Snowpack and Snowmelt Produced by The COMET Program Snow and ice are critical parts of the hydrologic cycle, especially at
Lake Tahoe Watershed Model. Lessons Learned through the Model Development Process
 Lake Tahoe Watershed Model Lessons Learned through the Model Development Process Presentation Outline Discussion of Project Objectives Model Configuration/Special Considerations Data and Research Integration
RELATIVE IMPORTANCE OF GLACIER CONTRIBUTIONS TO STREAMFLOW IN A CHANGING CLIMATE
 Proceedings of the Second IASTED International Conference WATER RESOURCE MANAGEMENT August 20-22, 2007, Honolulu, Hawaii, USA ISGN Hardcopy: 978-0-88986-679-9 CD: 978-0-88-986-680-5 RELATIVE IMPORTANCE
9. PROBABLE MAXIMUM PRECIPITATION AND PROBABLE MAXIMUM FLOOD
 9. PROBABLE MAXIMUM PRECIPITATION AND PROBABLE MAXIMUM FLOOD 9.1. Introduction Due to the size of Watana Dam and the economic importance of the Project to the Railbelt, the Probable Maximum Flood (PMF)
Preliminary Runoff Outlook February 2018
 Preliminary Runoff Outlook February 2018 Prepared by: Flow Forecasting & Operations Planning Water Security Agency General Overview The Water Security Agency (WSA) is preparing for 2018 spring runoff including
Impacts of snowpack accumulation and summer weather on alpine glacier hydrology
 Impacts of snowpack accumulation and summer weather on alpine glacier hydrology Caroline Aubry-Wake, Dhiraj Pradhananga, John W. Pomeroy GEWEX 8 th Open Science Meeting, Canmore AB, May 3-11 2018 Canadian
Snow Melt with the Land Climate Boundary Condition
 Snow Melt with the Land Climate Boundary Condition GEO-SLOPE International Ltd. www.geo-slope.com 1200, 700-6th Ave SW, Calgary, AB, Canada T2P 0T8 Main: +1 403 269 2002 Fax: +1 888 463 2239 Introduction
Summary of the 2017 Spring Flood
 Ottawa River Regulation Planning Board Commission de planification de la régularisation de la rivière des Outaouais The main cause of the exceptional 2017 spring flooding can be described easily in just
CLIMATE READY BOSTON. Climate Projections Consensus ADAPTED FROM THE BOSTON RESEARCH ADVISORY GROUP REPORT MAY 2016
 CLIMATE READY BOSTON Sasaki Steering Committee Meeting, March 28 nd, 2016 Climate Projections Consensus ADAPTED FROM THE BOSTON RESEARCH ADVISORY GROUP REPORT MAY 2016 WHAT S IN STORE FOR BOSTON S CLIMATE?
A SURVEY OF HYDROCLIMATE, FLOODING, AND RUNOFF IN THE RED RIVER BASIN PRIOR TO 1870
 A SURVEY OF HYDROCLIMATE, FLOODING, AND RUNOFF IN THE RED RIVER BASIN PRIOR TO 1870 W. F. RANNIE (UNIVERSITY OF WINNIPEG) Prepared for the Geological Survey of Canada September, 1998 TABLE OF CONTENTS
What are the consequences of melting pack ice?
 The Hydrosphere s Cryosphere: A-Pack Ice: (Sea Ice) They are large sheets of ice found in the oceans around Antarctica and in the Arctic Ocean. Smaller ones are called ice floes. Example 1: What are the
Presented by Larry Rundquist Alaska-Pacific River Forecast Center Anchorage, Alaska April 14, 2009
 Presented by Larry Rundquist Alaska-Pacific River Forecast Center Anchorage, Alaska April 14, 2009 Presentation Outline Who we are Breakup characteristics Climate and weather influences 2009 breakup outlook
Changing Climate. An Engineering challenge for today and the future. Milwaukee School of Engineering December 2, 2015
 Changing Climate An Engineering challenge for today and the future David S. Liebl UW- Madison, EPD; UW-Extension; Wisconsin Initiative on Climate change Impacts Milwaukee School of Engineering December
The following information is provided for your use in describing climate and water supply conditions in the West as of April 1, 2003.
 Natural Resources Conservation Service National Water and Climate Center 101 SW Main Street, Suite 1600 Portland, OR 97204-3224 Date: April 8, 2003 Subject: April 1, 2003 Western Snowpack Conditions and
Climate change projections for Ontario: an updated synthesis for policymakers and planners
 Ministry of Natural Resources and Forestry Climate change projections for Ontario: an updated synthesis for policymakers and planners Shannon Fera and Adam Hogg Ontario Ministry of Natural Resources and
SNOW AS POTENTIAL FLOOD THREAT
 SNOW AS POTENTIAL FLOOD THREAT DANIELA KYSELOVÁ, KATEŘINA HRUŠKOVÁ, ZORA SNOPKOVÁ Slovak hydrometeorological institute, Zelená 5, 974 04 Banská Bystrica, Slovakia In the physical-geographic conditions
Climate Change and Stormwater. Daniel Brown, Research Associate, GLISA
 Climate Change and Stormwater Daniel Brown, Research Associate, GLISA Global Trends and Regional Trends Global trends are more certain than regional trends. Natural variability plays a larger role at the
The Importance of Snowmelt Runoff Modeling for Sustainable Development and Disaster Prevention
 The Importance of Snowmelt Runoff Modeling for Sustainable Development and Disaster Prevention Muzafar Malikov Space Research Centre Academy of Sciences Republic of Uzbekistan Water H 2 O Gas - Water Vapor
Flood Risk Assessment
 Flood Risk Assessment February 14, 2008 Larry Schick Army Corps of Engineers Seattle District Meteorologist General Assessment As promised, La Nina caused an active winter with above to much above normal
Climate also has a large influence on how local ecosystems have evolved and how we interact with them.
 The Mississippi River in a Changing Climate By Paul Lehman, P.Eng., General Manager Mississippi Valley Conservation (This article originally appeared in the Mississippi Lakes Association s 212 Mississippi
Hydrologic Forecast Centre Manitoba Infrastructure, Winnipeg, Manitoba. FEBRUARY OUTLOOK REPORT FOR MANITOBA February 23, 2018
 Page 1 of 17 Hydrologic Forecast Centre Manitoba Infrastructure, Winnipeg, Manitoba FEBRUARY OUTLOOK REPORT FOR MANITOBA February 23, 2018 Overview The February Outlook Report prepared by the Hydrologic
MET 3102-U01 PHYSICAL CLIMATOLOGY (ID 17901) Lecture 14
 Lecture 14") MET 3102-U01 PHYSICAL CLIMATOLOGY (ID 17901) Lecture 14 The hydrologic cycle evaporation vapor transport precipitation precipitation evaporation runoff Evaporation, precipitation, etc. in cm Vapor transported
MET 3102-U01 PHYSICAL CLIMATOLOGY (ID 17901) Lecture 14 The hydrologic cycle evaporation vapor transport precipitation precipitation evaporation runoff Evaporation, precipitation, etc. in cm Vapor transported
January 2011 Calendar Year Runoff Forecast
 January 2011 Calendar Year Runoff Forecast 2010 Runoff Year Calendar Year 2010 was the third highest year of runoff in the Missouri River Basin above Sioux City with 38.8 MAF, behind 1978 and 1997 which
HyMet Company. Streamflow and Energy Generation Forecasting Model Columbia River Basin
 HyMet Company Streamflow and Energy Generation Forecasting Model Columbia River Basin HyMet Inc. Courthouse Square 19001 Vashon Hwy SW Suite 201 Vashon Island, WA 98070 Phone: 206-463-1610 Columbia River
David R. Vallee Hydrologist-in-Charge NOAA/NWS Northeast River Forecast Center
 David R. Vallee Hydrologist-in-Charge NOAA/NWS Northeast River Forecast Center Record flooding along the Shawsheen River during the 2006 Mother s Day Floods Calibrate and implement a variety of hydrologic
Land Surface: Snow Emanuel Dutra
 Land Surface: Snow Emanuel Dutra emanuel.dutra@ecmwf.int Slide 1 Parameterizations training course 2015, Land-surface: Snow ECMWF Outline Snow in the climate system, an overview: Observations; Modeling;
Black Gore Creek 2013 Sediment Source Monitoring and TMDL Sediment Budget
 Black Gore Creek 2013 Sediment Source Monitoring and TMDL Sediment Budget Prepared for: Prepared By: - I. Introduction The Black Gore Creek Total Maximum Daily Load (TMDL) was developed in collaboration
Hydrologic Forecast Centre Manitoba Infrastructure, Winnipeg, Manitoba. MARCH OUTLOOK REPORT FOR MANITOBA March 23, 2018
 Page 1 of 21 Hydrologic Forecast Centre Manitoba Infrastructure, Winnipeg, Manitoba MARCH OUTLOOK REPORT FOR MANITOBA March 23, 2018 Overview The March Outlook Report prepared by the Hydrologic Forecast
2015 Fall Conditions Report
 2015 Fall Conditions Report Prepared by: Hydrologic Forecast Centre Date: December 21 st, 2015 Table of Contents Table of Figures... ii EXECUTIVE SUMMARY... 1 BACKGROUND... 2 SUMMER AND FALL PRECIPITATION...
SEA ICE AND GLOBAL WARMING
 jkjk SEA ICE AND GLOBAL WARMING Lesson plan for grades K- 3 By: Laura Sanders, Environmental Science Institute, March 2011 Length of lesson: two 30- minute class periods SOURCES AND RESOURCES: Atmospheric
Coupling Climate to Clouds, Precipitation and Snow
 Coupling Climate to Clouds, Precipitation and Snow Alan K. Betts akbetts@aol.com http://alanbetts.com Co-authors: Ray Desjardins, Devon Worth Agriculture and Agri-Food Canada Shusen Wang and Junhua Li
Will a warmer world change Queensland s rainfall?
 Will a warmer world change Queensland s rainfall? Nicholas P. Klingaman National Centre for Atmospheric Science-Climate Walker Institute for Climate System Research University of Reading The Walker-QCCCE
Results of Intensity-Duration- Frequency Analysis for Precipitation and Runoff under Changing Climate
 Results of Intensity-Duration- Frequency Analysis for Precipitation and Runoff under Changing Climate Supporting Casco Bay Region Climate Change Adaptation RRAP Eugene Yan, Alissa Jared, Julia Pierce,
Glacier (and ice sheet) Mass Balance
 Mass Balance") Glacier (and ice sheet) Mass Balance The long-term average position of the highest (late summer) firn line is termed the Equilibrium Line Altitude (ELA) Firn is old snow How an ice sheet works (roughly):
Glacier (and ice sheet) Mass Balance The long-term average position of the highest (late summer) firn line is termed the Equilibrium Line Altitude (ELA) Firn is old snow How an ice sheet works (roughly):
Sediment Deposition LET THE RIVER RUN T E A C H E R. Activity Overview. Activity at a Glance. Time Required. Level of Complexity.
 Activity at a Glance Grade: 6 9 Subject: Science Category: Physical Science, Earth Science Topic: Deposition, River Systems Time Required Two 45-minute periods Level of Complexity Medium Materials* TI-73
2017 January Conditions Report Manitoba Hydrologic Forecasting and Coordination Branch Manitoba Infrastructure
 2017 January Conditions Report Manitoba Hydrologic Forecasting and Coordination Branch Manitoba Infrastructure 1/30/2017 Page 1 of 22 Hydrologic Forecast Centre Manitoba Infrastructure and Transportation
2016 Fall Conditions Report
 2016 Fall Conditions Report Prepared by: Hydrologic Forecast Centre Date: December 13, 2016 Table of Contents TABLE OF FIGURES... ii EXECUTIVE SUMMARY... 1 BACKGROUND... 5 SUMMER AND FALL PRECIPITATION...
Tropical Moist Rainforest
 Tropical or Lowlatitude Climates: Controlled by equatorial tropical air masses Tropical Moist Rainforest Rainfall is heavy in all months - more than 250 cm. (100 in.). Common temperatures of 27 C (80 F)
Central Asia Regional Flash Flood Guidance System 4-6 October Hydrologic Research Center A Nonprofit, Public-Benefit Corporation
 http://www.hrcwater.org Central Asia Regional Flash Flood Guidance System 4-6 October 2016 Hydrologic Research Center A Nonprofit, Public-Benefit Corporation FFGS Snow Components Snow Accumulation and
Climate Change Projections for Newfoundland and Labrador Implications for Our Economy. NEIA Conference October 10 th 2013.
 Climate Change Projections for Newfoundland and Labrador Implications for Our Economy NEIA Conference October 10 th 2013 Jackie Janes, ADM Overview To provide a high-level overview of the climate change
Great Lakes Update. Volume 199: 2017 Annual Summary. Background
 Great Lakes Update Volume 199: 2017 Annual Summary Background The U.S. Army Corps of Engineers (USACE) tracks and forecasts the water levels of each of the Great Lakes. This report is primarily focused
Operational Perspectives on Hydrologic Model Data Assimilation
 Operational Perspectives on Hydrologic Model Data Assimilation Rob Hartman Hydrologist in Charge NOAA / National Weather Service California-Nevada River Forecast Center Sacramento, CA USA Outline Operational
Meteorology. Circle the letter that corresponds to the correct answer
 Chapter 3 Worksheet 1 Meteorology Name: Circle the letter that corresponds to the correct answer 1) If the maximum temperature for a particular day is 26 C and the minimum temperature is 14 C, the daily
2016 Irrigated Crop Production Update
 2016 Irrigated Crop Production Update Mapping Climate Trends and Weather Extremes Across Alberta for the Period 1950-2010 Stefan W. Kienzle Department of Geography University of Lethbridge, Alberta, Canada
1 What Is Climate? TAKE A LOOK 2. Explain Why do areas near the equator tend to have high temperatures?
 CHAPTER 17 1 What Is Climate? SECTION Climate BEFORE YOU READ After you read this section, you should be able to answer these questions: What is climate? What factors affect climate? How do climates differ
1 City of Edmonton Quesnell Bridge, Roads and Associated Structures Assessment
 1 City of Edmonton Quesnell Bridge, Roads and Associated Structures Assessment 1.1 Background Within the First National Engineering Vulnerability Assessment, the Public Infrastructure Engineering Vulnerability
Feasibility of Over-Summer Snow Storage in Craftsbury, VT
 Feasibility of Over-Summer Snow Storage in Craftsbury, VT Hannah Weiss, Paul Bierman, Yves Dubief, Scott Hamshaw Image: http://ais.wetter.de/masters/514430/switzerland-snowfarming.jpg Introduction Warming
Indicator Trends for Canadian Climate Changes during the Last 60 to 140 Years
 Indicator Trends for Canadian Climate Changes during the Last 60 to 140 Years Presented to CPANS, Edmonton Luncheon Forum by Kurt Hansen, P. Eng. President, Green Inc., Calgary, Alberta greeninc@telus.net
1 What Is Climate? TAKE A LOOK 2. Explain Why do areas near the equator tend to have high temperatures?
 CHAPTER 17 1 What Is Climate? SECTION Climate BEFORE YOU READ After you read this section, you should be able to answer these questions: What is climate? What factors affect climate? How do climates differ
Snowcover interaction with climate, topography & vegetation in mountain catchments
 Snowcover interaction with climate, topography & vegetation in mountain catchments DANNY MARKS Northwest Watershed Research Center USDA-Agricultural Agricultural Research Service Boise, Idaho USA RCEW
Minor Winter Flooding Event in northwestern Pennsylvania January 2017
 1. Overview Minor Winter Flooding Event in northwestern Pennsylvania 12-13 January 2017 By Richard H. Grumm National Weather Service State College, PA A combination of snow melt, frozen ground, and areas
APPENDIX B Hydrologic Model Spring Event
 Jock River Flood Risk Mapping (within the City of Ottawa) Hydrology Report July 2004 PageB1 APPENDIX B Hydrologic Model Spring Event Snowmelt+Rainfall Calibration and Validation Results Design Events Explanation
Impacts of the April 2013 Mean trough over central North America
 Impacts of the April 2013 Mean trough over central North America By Richard H. Grumm National Weather Service State College, PA Abstract: The mean 500 hpa flow over North America featured a trough over
Lecture 8: Snow Hydrology
 GEOG415 Lecture 8: Snow Hydrology 8-1 Snow as water resource Snowfall on the mountain ranges is an important source of water in rivers. monthly pcp (mm) 100 50 0 Calgary L. Louise 1 2 3 4 5 6 7 8 9 10
TABLE OF CONTENTS LIST OF TABLES. Page
 TABLE OF CONTENTS Page 11.0 EFFECTS OF THE ENVIRONMENT ON THE PROJECT... 11-1 11.1 Weather Conditions... 11-1 11.2 Flooding... 11-2 11.3 Forest Fires... 11-2 11.4 Permafrost and Subsidence Risk... 11-3
3) What is the difference between latitude and longitude and what is their affect on local and world weather and climate?
 What is the difference between latitude and longitude and what is their affect on local and world weather and climate?") www.discoveryeducation.com 1) Describe the difference between climate and weather citing an example of each. Describe how water (ocean, lake, river) has a local effect on weather and climate and provide
www.discoveryeducation.com 1) Describe the difference between climate and weather citing an example of each. Describe how water (ocean, lake, river) has a local effect on weather and climate and provide
Winter of 2017 Historical Perspective
 Winter of 2017 Historical Perspective By George Lamson May 17, 2017 Now that we have all survived the winter of 2017 on Donner Summit, it is time to see how this winter stacks up to those of the past.
2017 Fall Conditions Report
 2017 Fall Conditions Report Prepared by: Hydrologic Forecast Centre Date: November 15, 2017 Table of Contents TABLE OF FIGURES... ii EXECUTIVE SUMMARY... 1 BACKGROUND... 4 SUMMER AND FALL PRECIPITATION...
Souris River Basin Spring Runoff Outlook As of March 15, 2018
 Souris River Basin Spring Runoff Outlook As of March 15, 2018 Prepared by: Flow Forecasting & Operations Planning Water Security Agency Basin Conditions Summer rainfall in 2017 in the Saskatchewan portion
Climate Change in Newfoundland & Labrador
 Climate Change in Newfoundland & Labrador Impacts and Adaptation Newleef Conference 08 October 2015 Met-Ocean Services The Team 55 personnel; 24/7 operational weather forecast desk; Equipment technician
Location Latitude Longitude Durham, NH
 Name: Date: Weather to Climate Investigation: Snow **These are example answers using the Durham, NH dataset. Answers from students using Boise and Little Rock datasets will differ. Guiding Questions: What
Technical Notes: Magnitude and Return Period of 2004 Hurricane Rainfall in Florida
 Journal of Floodplain Management Floodplain Management Association NOV. 2005 Vol. 5, No. 1 Glenn Tootle 1 Thomas Mirti 2 Thomas Piechota 3 Technical Notes: Magnitude and Return Period of 2004 Hurricane
Which map shows the stream drainage pattern that most likely formed on the surface of this volcano? A) B)
 B)") 1. When snow cover on the land melts, the water will most likely become surface runoff if the land surface is A) frozen B) porous C) grass covered D) unconsolidated gravel Base your answers to questions
1. When snow cover on the land melts, the water will most likely become surface runoff if the land surface is A) frozen B) porous C) grass covered D) unconsolidated gravel Base your answers to questions
Operational MRCC Tools Useful and Usable by the National Weather Service
 Operational MRCC Tools Useful and Usable by the National Weather Service Vegetation Impact Program (VIP): Frost / Freeze Project Beth Hall Accumulated Winter Season Severity Index (AWSSI) Steve Hilberg
1. GLACIER METEOROLOGY - ENERGY BALANCE
 Summer School in Glaciology McCarthy, Alaska, 5-15 June 2018 Regine Hock Geophysical Institute, University of Alaska, Fairbanks 1. GLACIER METEOROLOGY - ENERGY BALANCE Ice and snow melt at 0 C, but this
Jennifer Jacobs, Bryan Carignan, and Carrie Vuyovich. Environmental Research Group University of New Hampshire
 Jennifer Jacobs, Bryan Carignan, and Carrie Vuyovich Environmental Research Group University of New Hampshire New Hampshire Water Conference March 21, 2014 Funding Provided By: NASA 1 Precipitation is
Laboratory Exercise #7 - Introduction to Atmospheric Science: The Seasons and Daily Weather
 Laboratory Exercise #7 - Introduction to Atmospheric Science: The Seasons and Daily Weather page - Section A - Introduction: This lab consists of questions dealing with atmospheric science. We beginning
Local Climate Change Impacts for Central Illinois
 Local Climate Change Impacts for Central Illinois Molly Woloszyn Extension Climatologist Midwestern Regional Climate Center & Illinois-Indiana Sea Grant Urbana Sustainability Advisory Commission February
Susanna Glaze, Bobby Creel, and Christopher Brown New Mexico State University AWRA Spring Specialty Conference 4-6 May 2009 Anchorage, Alaska
 Susanna Glaze, Bobby Creel, and Christopher Brown New Mexico State University 2009 AWRA Spring Specialty Conference 4-6 May 2009 Anchorage, Alaska Outline Introduction to general water resources issues
Study 16.5 Probable Maximum Flood (PMF)
") Initial Study Report Meeting Study 16.5 Probable Maximum Flood (PMF) March 30, 2016 Prepared by 3/30/2016 1 Study 16.5 Status ISR documents (ISR Part D Overview): Status: Initial Study Report: Parts A,
Initial Study Report Meeting Study 16.5 Probable Maximum Flood (PMF) March 30, 2016 Prepared by 3/30/2016 1 Study 16.5 Status ISR documents (ISR Part D Overview): Status: Initial Study Report: Parts A,
CFCAS project: Assessment of Water Resources Risk and Vulnerability to Changing Climatic Conditions. Project Report II.
 CFCAS project: Assessment of Water Resources Risk and Vulnerability to Changing Climatic Conditions Project Report II. January 2004 Prepared by and CFCAS Project Team: University of Western Ontario Slobodan
Snowmelt runoff forecasts in Colorado with remote sensing
 Hydrology in Mountainous Regions. I - Hydrologjcal Measurements; the Water Cycle (Proceedings of two Lausanne Symposia, August 1990). IAHS Publ. no. 193, 1990. Snowmelt runoff forecasts in Colorado with
Study 16.5 Probable Maximum Flood (PMF)
") Initial Study Report Meeting Study 16.5 Probable Maximum Flood (PMF) October 22, 2014 Prepared by 10/22/2014 1 Study 16.5 Objectives Develop a site-specific PMP to be used for the derivation of the PMF
Initial Study Report Meeting Study 16.5 Probable Maximum Flood (PMF) October 22, 2014 Prepared by 10/22/2014 1 Study 16.5 Objectives Develop a site-specific PMP to be used for the derivation of the PMF
CLIMATE. UNIT TWO March 2019
 CLIMATE UNIT TWO March 2019 OUTCOME 9.2.1Demonstrate an understanding of the basic features of Canada s landscape and climate. identify and locate major climatic regions of Canada explain the characteristics
The elevations on the interior plateau generally vary between 300 and 650 meters with
 11 2. HYDROLOGICAL SETTING 2.1 Physical Features and Relief Labrador is bounded in the east by the Labrador Sea (Atlantic Ocean), in the west by the watershed divide, and in the south, for the most part,
Understanding Weather and Climate Risk. Matthew Perry Sharing an Uncertain World Conference The Geological Society, 13 July 2017
 Understanding Weather and Climate Risk Matthew Perry Sharing an Uncertain World Conference The Geological Society, 13 July 2017 What is risk in a weather and climate context? Hazard: something with the
Flooding in Western North Carolina: Some Spatial, Hydrologic, and Seasonal Characteristics CAUTION!! Outline. Basic Flood Facts.
 Flooding in Western North Carolina: Some Spatial, Hydrologic, and Seasonal Characteristics J. Greg Dobson CAUTION!! National Environmental Modeling and Analysis Center RENCI at UNC-Asheville Engagement
Three main areas of work:
 Task 2: Climate Information 1 Task 2: Climate Information Three main areas of work: Collect historical and projected weather and climate data Conduct storm surge and wave modeling, sea-level rise (SLR)
Talk Overview. Concepts. Climatology. Monitoring. Applications
 Atmospheric Rivers Talk Overview Concepts Climatology Monitoring Applications Satellite View Where is the storm? Where is the impact? Atmospheric Rivers Plume or fire hose of tropical moisture Heavy precipitation
2011 National Seasonal Assessment Workshop for the Eastern, Southern, & Southwest Geographic Areas
 2011 National Seasonal Assessment Workshop for the Eastern, Southern, & Southwest Geographic Areas On January 11-13, 2011, wildland fire, weather, and climate met virtually for the ninth annual National
ESTIMATING SNOWMELT CONTRIBUTION FROM THE GANGOTRI GLACIER CATCHMENT INTO THE BHAGIRATHI RIVER, INDIA ABSTRACT INTRODUCTION
 ESTIMATING SNOWMELT CONTRIBUTION FROM THE GANGOTRI GLACIER CATCHMENT INTO THE BHAGIRATHI RIVER, INDIA Rodney M. Chai 1, Leigh A. Stearns 2, C. J. van der Veen 1 ABSTRACT The Bhagirathi River emerges from
Oregon Water Conditions Report May 1, 2017
 Oregon Water Conditions Report May 1, 2017 Mountain snowpack in the higher elevations has continued to increase over the last two weeks. Statewide, most low and mid elevation snow has melted so the basin
Climate change in the U.S. Northeast
 Climate change in the U.S. Northeast By U.S. Environmental Protection Agency, adapted by Newsela staff on 04.10.17 Word Count 1,109 Killington Ski Resort is located in Vermont. As temperatures increase
A summary of the weather year based on data from the Zumwalt weather station
 ZUMWALT PRAIRIE WEATHER 2016 A summary of the weather year based on data from the Zumwalt weather station Figure 1. An unusual summer storm on July 10, 2016 brought the second-largest precipitation day
The Hydrologic Cycle
 The Hydrologic Cycle Monthly precipitation for the central Arctic Ocean based on data from the Russian North Pole manned camps with daily bias adjustments. Raw precipitation totals are shown along with
Studying snow cover in European Russia with the use of remote sensing methods
 40 Remote Sensing and GIS for Hydrology and Water Resources (IAHS Publ. 368, 2015) (Proceedings RSHS14 and ICGRHWE14, Guangzhou, China, August 2014). Studying snow cover in European Russia with the use
Disentangling Impacts of Climate & Land Use Changes on the Quantity & Quality of River Flows in Southern Ontario
 Disentangling Impacts of Climate & Land Use Changes on the Quantity & Quality of River Flows in Southern Ontario by Trevor Dickinson & Ramesh Rudra, Water Resources Engineering University of Guelph Acknowledgements
Effects of forest cover and environmental variables on snow accumulation and melt
 Effects of forest cover and environmental variables on snow accumulation and melt Mariana Dobre, William J. Elliot, Joan Q. Wu, Timothy E. Link, Ina S. Miller Abstract The goal of this study was to assess
The Pennsylvania Observer
 The Pennsylvania Observer April 2, 2009 March 2009 Pennsylvania Weather Recap Prepared by Curt Harpster For the month of March the saying, In like a lion and out like a lamb really fit the pattern quite
Climatic Change Implications for Hydrologic Systems in the Sierra Nevada
 Climatic Change Implications for Hydrologic Systems in the Sierra Nevada Part Two: The HSPF Model: Basis For Watershed Yield Calculator Part two presents an an overview of why the hydrologic yield calculator
Weather to Climate Investigation: Snow
 Name: Date: Weather to Climate Investigation: Snow Guiding Questions: What are the historical and current weather patterns or events for a location in the United States? What are the long-term weather
CLIMATE RESILIENCE FOR ALBERTA MUNICIPALITIES CLIMATE PROJECTIONS NORTHERN ALBERTA. Dr. Mel Reasoner Reasoner Environmental Consulting
 CLIMATE RESILIENCE FOR ALBERTA MUNICIPALITIES CLIMATE PROJECTIONS NORTHERN ALBERTA Dr. Mel Reasoner Reasoner Environmental Consulting Probability of occurrence Increase in Mean Temperature & Variance Less
Ellen L. Mecray NOAA Regional Climate Services Director, Eastern Region Taunton, MA
 Ellen L. Mecray NOAA Regional Climate Services Director, Eastern Region Taunton, MA Regions of the US National Climate Assessment What we Observe: Climate changes and impacts Increasing temperature Increasingly
Evaluating extreme flood characteristics of small mountainous basins of the Black Sea coastal area, Northern Caucasus
 Proc. IAHS, 7, 161 165, 215 proc-iahs.net/7/161/215/ doi:1.5194/piahs-7-161-215 Author(s) 215. CC Attribution. License. Evaluating extreme flood characteristics of small mountainous basins of the Black
CLIMATE RESILIENCE FOR ALBERTA MUNICIPALITIES CLIMATE PROJECTIONS SOUTHERN ALBERTA. Dr. Mel Reasoner Reasoner Environmental Consulting
 CLIMATE RESILIENCE FOR ALBERTA MUNICIPALITIES CLIMATE PROJECTIONS SOUTHERN ALBERTA Dr. Mel Reasoner Reasoner Environmental Consulting Probability of occurrence Increase in Mean Temperature & Variance Less
Weather Systems Study Guide:
 Weather Systems Study Guide: 1. Draw a diagram of Earth s water cycle and label each part. 2. Explain how the water cycle works. 3. What happens in the troposphere and stratosphere? Atmosphere Level What
Climate Change in the Northeast
 Climate Change in the Northeast Dr. Alan K. Betts Atmospheric Research, Pittsford, VT 05763 akbetts@aol.com http://alanbetts.com NNECAPA Stowe, VT September 11, 2014 Outline Science of climate change Global
2015: A YEAR IN REVIEW F.S. ANSLOW
 2015: A YEAR IN REVIEW F.S. ANSLOW 1 INTRODUCTION Recently, three of the major centres for global climate monitoring determined with high confidence that 2015 was the warmest year on record, globally.