Recent Analysis and Improvements of the Statistical Water Supply Forecasts for the Upper Klamath Lake Basin, Oregon and California, USA
|
|
|
- Paul Moore
- 5 years ago
- Views:
Transcription

1 Recent Analysis and Improvements of the Statistical Water Supply Forecasts for the Upper Klamath Lake Basin, Oregon and California, USA Jolyne Lea and David Garen, USDA/NRCS, Adam Kennedy, Portland State University, and John Risley, USGS WORKSHOP ON MANAGEMENT OF NATURAL AND ENVIRONMENTAL RESOURCES FOR SUSTAINABLE AGRICULURAL DEVELOPMENT
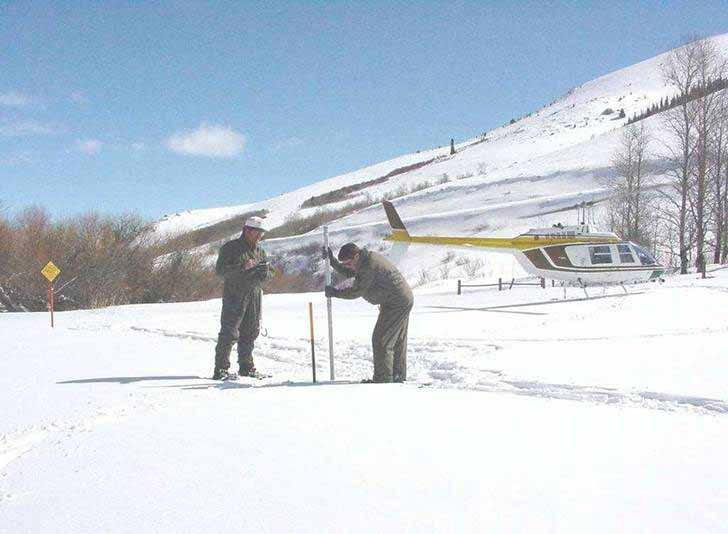
2 USDA NRCS Snow Survey and Water Supply Forecasting The Snow Survey and Water Supply forecasting program began in the early 19s. This was an effort to predict spring and summer water supplies from the winter snowpack. Early snow surveys were done in the Sierra Nevada and Cascade mountains and engineers determined the relationship between snowpack and streamflow using graphical and regression techniques.
3

4 Surprise Lakes SNOTEL site. A remote climate and snow station.
5 History of Forecasting USDA Natural Resources Conservation Service (NRCS) formerly the Soil Conservation Service (SCS) has been forecasting water supplies in the Klamath Basin since the 193s. We also forecast at 75 other stream gage stations. Due to the seasonal nature of precipitation in the Western US, forecasts were initialized to determine the amount of streamflow runoff an area would have from the snowpack water content, or snow water equivalent (SWE). Forecasts in the West have traditionally been requested and used by water managers for irrigation, power generation, municipal use and more.
6 What are Statistical Water Supply Forecasts? A water supply forecast has traditionally been a volume of water expected into a lake, reservoir or past a stream gage in a multi-month time step or season. Statistical Forecasts are also made for annual events such as peak flow and date, and recession (low flow) date and stage height. Seasonal Water Supply Forecasts are used for water management decision making for irrigation, municipal use, wildlife and fish, hydropower, and recreation. And is often an input into daily water management models.
7 Klamath Basin Competing Water Needs The Klamath Basin forecasts have been provided to the Bureau of Reclamation and PacifiCorp Hydropower Company for many years. In the 199s, Suckers in Upper Klamath Lake were determined to be endangered species (USFWS). Coho in the Klamath River was listed as threatened (NOAA). Water management plans were developed to improve these fish populations. In 21, the 5 th driest year on record, there was very limited water for the irrigation, power and endangered fish needs. Based on the April 1 water supply forecast, to comply with the endangered species laws, no irrigation water would be available for the farmers in the Bureau of Reclamation Project, though others farmers in the area were able to irrigate. This decision caused many protests throughout the local, state and national agricultural community and received the President of the United State s attention. The resulting Federal funds were used for emergency well drilling, loans and disaster declarations.
8 Impacts to Klamath Basin Water Supply Forecasting Funding for many water conservation projects. Increased funding for hydrologic gages and climate data collection. Study on the accuracy of the statistical Water Supply Forecasts and ways to improve them. Project Funding for improved forecast models. Increased education of the many stakeholders on water supply forecasts.
9


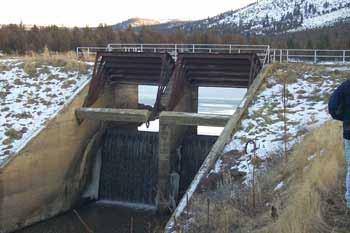
10 Photos courtesy of the Bureau of Reclamation.


11 Threatened and Endangered Fish Coho Salmon Photo: NOAA Shortnose and Lost River Suckers

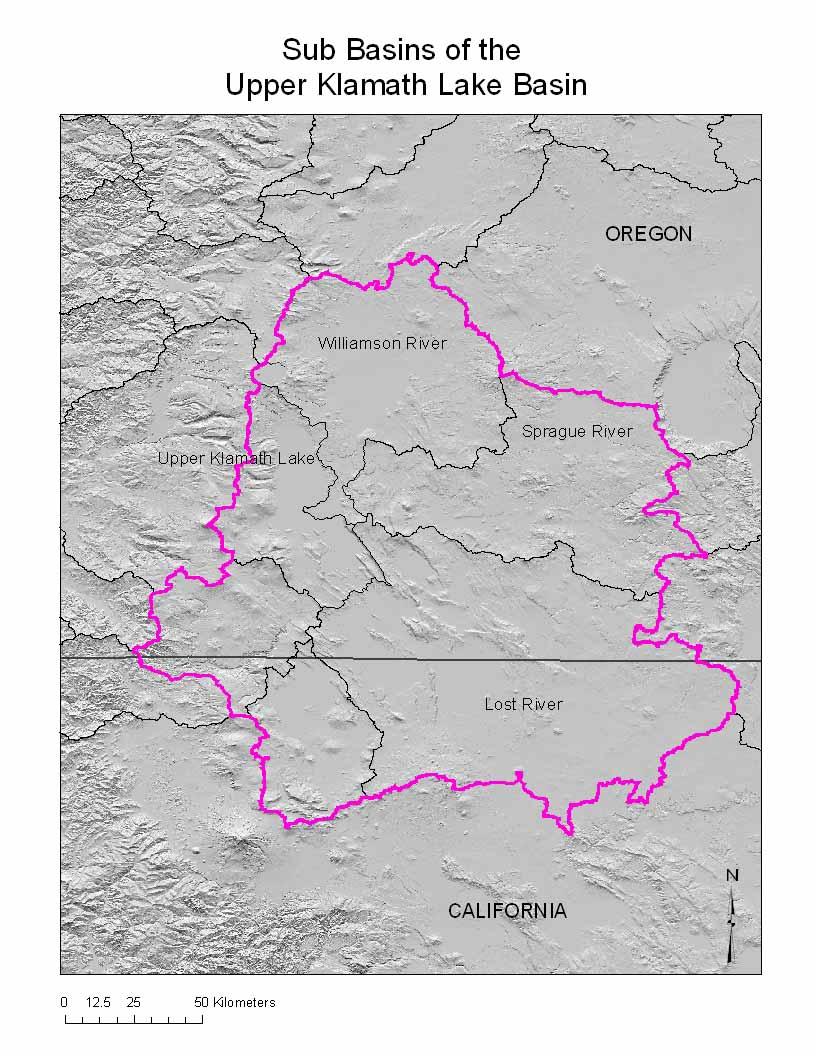
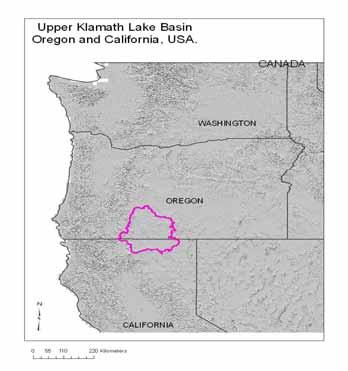
12 Klamath Basin Forecast Locations

13 Klamath Basin Forecast Data 5 - USGS Stream gages 19 - SNOTEL 2 - Enhanced SNOTEL 6 - Snow Courses 4 - Aerial Markers 1 - SCAN Site 5 - NWS COOP stations BOR Agrimet stations and others.
14 Water Supply Forecast Frequency and Periods Issued monthly, January through June. Mid- month updates December 15 June 15. Forecasted periods are Feb- Jul, Mar- Jul, Apr- Sept, May- Sept, Jun- Sept. The forecast periods developed based on user need, and the US Bureau of Reclamation relies primarily on Apr- Sept. volumes. Other forecasts periods have been requested by a hydropower utility, PacifiCorp.
15 Water Supply Forecast Statistical Model Calibration Linear regression of monthly hydroclimatic input variables (SWE, PRCP, groundwater, etc.) against observed streamflow volume. Regression coefficients are calculated between selected station input variables and observed streamflow volumes.
16 Water Supply Statistical Model Principal Components statistical model used since the early 199s by Dr. David Garen. This technique takes into account the intercorrelation among predictor variables. Jackknife testing for calibration fit. An iterative test where each year in turn is removed and then modeled with the remaining years. 2 to 4 years of data for optimum statistical fit.
17 Water Supply Forecast Equation Variables Data is required to be operationally available by the 3 rd working day of the month. Snow water equivalent (SWE) Snow courses/aerial markers. SNOTEL sites NWS and SNOTEL Precipitation (fall and spring). USGS and BOR Streamflow data and diversion data Reservoir Inflow Data Well level data Temperature Trans-Niño Index (TNI).
18 Water Supply Forecast Process Only long term observed data are used. No future conditions are included, e.g. no future snow or spring and summer precipitation are assumed. Each forecast month is treated independently, Jan, Feb, Mar, Apr, May. No memory of previous forecast. Implicit with the predictor variables carried throughout the year. Produces statistically representative probability distributions of forecast volume based on calibrations.
19 Forecast Improvements The updating of forecasts is ongoing. Additional years of data and variables have been researched and incorporated with improved correlations. Additional statistical routines were explored (artificial neural network). To date, they have not provided a significantly improved statistical model for forecasting in the Klamath Basin.
20 USGS Artificial Neural Network Models A flexible mathematical structure capable of describing complex nonlinear relationships between input and output data sets that are typically found in natural systems
![Hidden layer feed forward ANN h j = tanh [ X i 1 w ij + 1 b j ] i where h j is the computed output from hidden layer node, j is the hidden-layer node index, tanh is the hyperbolic tangent, i is the](/docs-images/89/100166710/images/21-1.jpg "input layer node index, X i is the input variable, 1 w ij is the hidden layer weight, and 1 b j is hidden-layer bias Y = h j 2 w j + 2 b j where Y is the output variable 2 w j is the output layer")
21 Hidden layer feed forward ANN h j = tanh [ X i 1 w ij + 1 b j ] i where h j is the computed output from hidden layer node, j is the hidden-layer node index, tanh is the hyperbolic tangent, i is the input layer node index, X i is the input variable, 1 w ij is the hidden layer weight, and 1 b j is hidden-layer bias Y = h j 2 w j + 2 b j where Y is the output variable 2 w j is the output layer weights, and 2 b is the output layer bias.
22 New Variables Improved Accuracy Variables limited to current climate (post 1977 climate shift) New Variables added: Groundwater components: Spring flow data at Fall River. Well level data. Mean monthly temperature from Crater Lake N.P. Areal mean monthly precipitation Trans Niño Index.
23 Well and Spring Data Groundwater a big component in the basin hydrology due to its volcanic nature. Well data not affected by pumping. Spring data from US Geological Survey Oregon Water Resources Dept. Stream gage.
24 State of Oregon Well locations Long Term Observation Well location
25 Preliminary Water-Table Map of the Upper Klamath Basin
26 Principal Ground-Water Discharge Areas m3/s m3/s m3/s m3/s About 71 m3/s of ground - water discharge has been identified, 51 m3/s is to the lake and its tributaries.
27 Upper Klamath Basin Annual Precipitation (The principal source of ground- water recharge) > 127 mm mm mm < 38 mm Total average precipitation: about 12 m 3 /yr
28 Water-table elevation fluctuations follow a pattern similar to the cumulative departure from average precipitation. 3 Depth to water, in meters Depth to Water in Well 36S/14E-25BCB Cumulatuve Departure from Average Precipitation at Crater Lake Cumulative departure from average, in millimeters
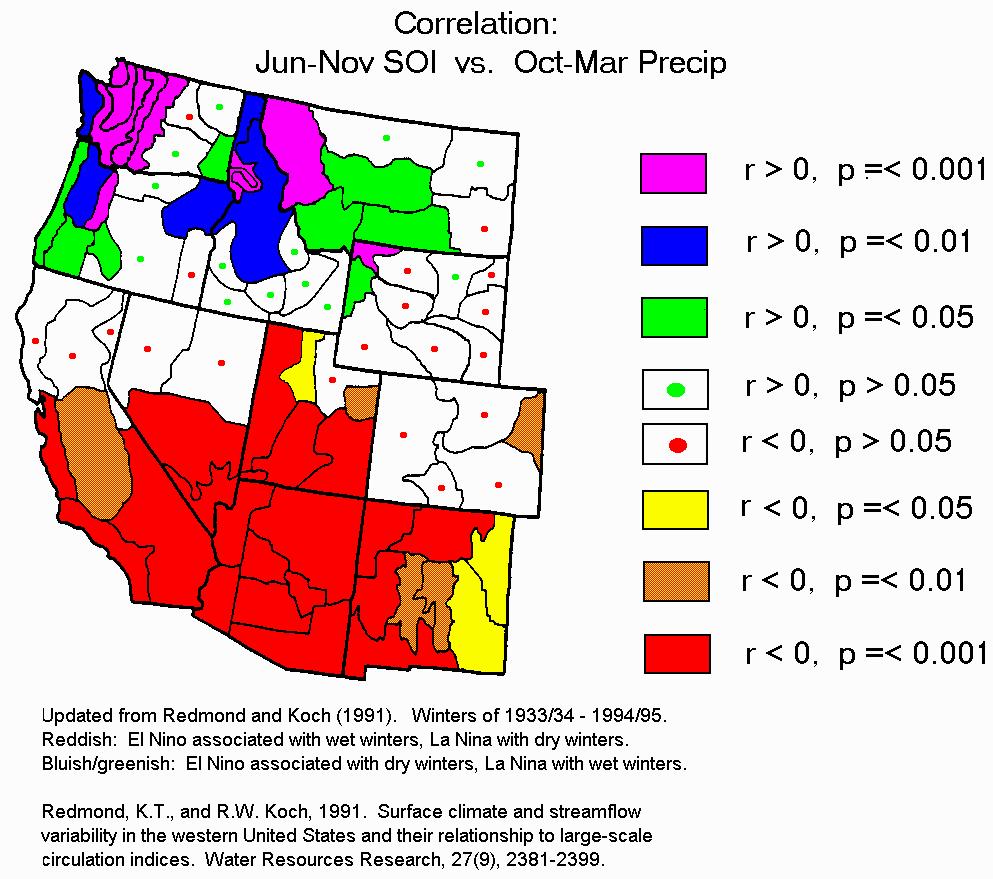
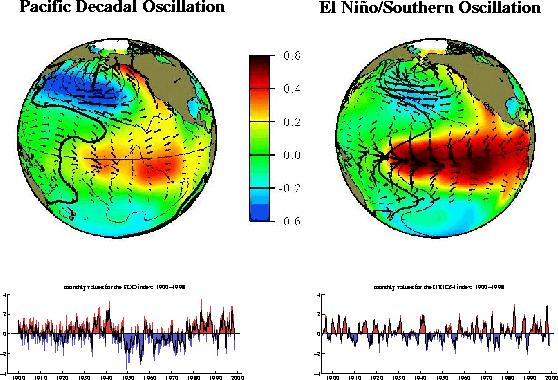
29 Climate Indices Standard Southern Oscillation Index (SOI) not correlated well. Pacific Decadal Oscillation (PDO) not correlated well. Trans-Niño Index (TNI) - Since 1977, a good correlation between this index and the Klamath Basin.
30
 anomalies for the warm")

31 Winter sea surface temperature, wind pattern (arrows), and sea level pressure (contour) anomalies for the warm (left) and cool (right) phase of the Pacific Decadal Oscillation. (Courtesy of Nate Mantua, JISAO Univ. of Washington.)
32 Trans-Niño Index (TNI) The TNI is the standardized equatorial sea surface temperature (SST) gradient between Niño 1+2 and Niño 4 regions (Trenberth, 2).
33 Mean Areal Precipitation PRISM Derived Mean Areal Precipitation and temperature. Used 5 to 6 SNOTEL and NWS COOP stations.

34 Mean Areal Precipitation Obtain monthly gridded base data from Oregon Climate Service s ftp site. Define area of interest with a zonal grid. Employ automated script for multi-step processing of base layers. Gridded data available at:

35 Mean Areal Precipitation Upper Klamath Lake Williamson Sprague Arithmetic Average Processing March 23 Sprague = mm Williamson = mm UKL = mm
36
37
38 Temperature and Groundwater Variables Standard Error Improvement
39 No Improvement is shown in the Sprague R. 45 Sprague River Standard Error Improvement with Temperature and Groundwater Jacknife Standard Error (1 3 m 3 ) JAN FEB MA R A PR MAY JUN avg NEW SE + NEW SE - Old SE+ Old SE -
40 Williamson River Improvement with Groundwater 7 Williamson River Standard Error Improvement with Temperature and Groundwater Jacknife Standard Error (1 3 m 3 ) JAN FEB MAR APR MAY JUN avg NEW SE + NEW SE - Old SE+ Old SE -
41 Upper Klamath Lake Improvement with Temperature 9 Upper Klamath Lake Inflow Standard Error Improvement with temperature and Groundwater Jacknife Standard Error (1 3 m 3 ) JAN FEB MAR APR MAY JUN avg NEW SE + NEW SE - Old SE+ Old SE -
42 TNI and Areal Precipitation Standard Error Improvement
43 The Sprague River forecast with TNI reduces forecast uncertainty Jackknife Standard Error (1 6 m 3 ) JSE w/ TNI JSE w/o TNI r-val. w/ TNI r-val. w/o TNI Jackknife r-value 2 January Febuary March April May.65 Forecast Month
44 The Upper Williamson with TNI reduces early season forecast uncertainty. Jackknife Standard Error (1 6 m 3 ) JSE w/ TNI JSE w/o TNI r-val. w/ TNI r-val. w/o TNI Jackknife r-value 5.75 January Febuary March April May Forecast Month
45 Forecast Improvement Results TNI alone provided great improvement in early season accuracy. Crater Lake temperatures provided improvements in the Upper Klamath Lake late season forecasts. Well data and spring data improved overall accuracy in some forecasts.

46 Additional Variables Under Consideration. Soil Moisture data from SNOTEL when more years of data are available. Additional Spring Temperature data from SNOTEL sites. Other climate variables. GIS data Applying PRISM Mean Areal Precipitation to additional forecast points. Total Basin SWE from NWS NOHRSC.

47 March 24 Continued difficulty in forecasting the chaotic component
48 Forecast Limitations. Statistical forecasts do not provide daily products. Limit to how far in advance forecasts can be made with current science and data.
49 Future Statistical procedures will continue to be utilized to forecast water supplies in the Western US. Provide fairly accurate seasonal volume forecasts. Use monthly and sub-monthly quality controlled data. Optimal for limited program resources. Limited by available long term data.

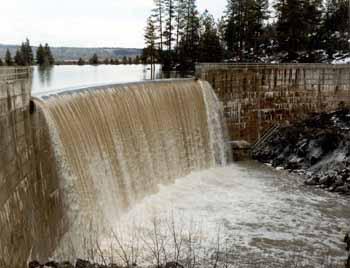
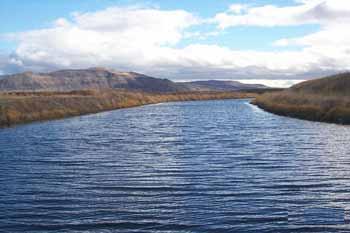
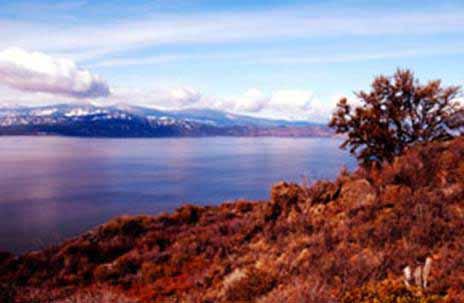
50 Upper Klamath Lake Reservoir is a principal source of water for the Klamath project. The reservoir has a capacity of 1,76,829,66 cubic meters and is operated by Pacific Corp., subject to Klamath Project rights. Upper Klamath Lake (photo courtesy of the Oregon Department of Environmental Quality)
51

52 Crater Lake - Crater Lake National Park.
53 TNI = (Niño 1+2 N - Niño 4 N ) S,N where N indicates normalized and S smoothed Regression of global SST anomalies with TNI for in C. Values exceeding.1 C are hatched and less than -.1 C are stippled. The contours are ±.5 C, ±.1 C, ±.15 C, etc.
. A low pass spline fit is given to highlight interdecadal variations.")
54 Fig. 1. Time series of SSTs from Niño 3.4 (N3.4 top), and TNI (bottom) from 1871 to 2. Both time series are normalized by the standard deviation s, as given. In the top panel, shading is included to show where thesholds of ±.4 C are exceeded, indicating ENSO events (see Trenberth, 1997). A low pass spline fit is given to highlight interdecadal variations.
55


56 Pacific Decadal Oscillation (PDO) PDO reflects slow decadal variability in the North Pacific Ocean PDO Index = Coastal SST - mid ocean SST In the Pacific Northwest: Positive PDO--warm and dry periods Negative PDO--cool and wet periods Positive PDO Phase Sea-surface Temperatures

57 PDO has no correlation with Klamath Basin Precipitation or Streamflow La Nina/PDO combined influences on past US Precipitation, from Gershunov, Barnett, and Cayan 1999 (EOS)
58 TNI Computations (revised for operational use) Obtain Niño 1+2 and Niño 4 area average monthly SST series. Compute monthly means over the complete period of record ( ). Standardize both series by subtracting the monthly means and dividing by the standard deviation of the complete period of record. Subtract standardized Niño 4 from standardized Niño 1+2 to obtain monthly TNI series. Perform correlations with the variables of interest to identify months which contain the predictive signal. Compute a multi- month TNI by averaging months well correlated to selected variables. Divide multi- month TNI by its respective multi- month standard deviation. TNI=(Niño 1+2 std - Niño 4 std ) avg Revised from: Trenberth and Stepaniak, 21
Climate Variability. Eric Salathé. Climate Impacts Group & Department of Atmospheric Sciences University of Washington. Thanks to Nathan Mantua
 Climate Variability Eric Salathé Climate Impacts Group & Department of Atmospheric Sciences University of Washington Thanks to Nathan Mantua Northwest Climate: the mean Factors that influence local/regional
accumulations. The annual maximum SWE and the rate of snowpack accumulation and
 Exploratory analysis of snowpack in Washington State Nian She and Daniel Basketfield Seattle Public Utilities, Seattle, Washington Abstract. Snow water equivalent (SWE) is used to measure seasonal snowpack
An Analysis of Statistical Methods for Seasonal Flow Forecasting in the Upper Klamath River Basin of Oregon and California
 In cooperation with the Bureau of Reclamation and Natural Resources Conservation Service An Analysis of Statistical Methods for Seasonal Flow ing in the Upper Klamath River Basin of Oregon and California
Modeling of peak inflow dates for a snowmelt dominated basin Evan Heisman. CVEN 6833: Advanced Data Analysis Fall 2012 Prof. Balaji Rajagopalan
 Modeling of peak inflow dates for a snowmelt dominated basin Evan Heisman CVEN 6833: Advanced Data Analysis Fall 2012 Prof. Balaji Rajagopalan The Dworshak reservoir, a project operated by the Army Corps
A Report on a Statistical Model to Forecast Seasonal Inflows to Cowichan Lake
 A Report on a Statistical Model to Forecast Seasonal Inflows to Cowichan Lake Prepared by: Allan Chapman, MSc, PGeo Hydrologist, Chapman Geoscience Ltd., and Former Head, BC River Forecast Centre Victoria
Oregon Water Conditions Report April 17, 2017
 Oregon Water Conditions Report April 17, 2017 Mountain snowpack continues to maintain significant levels for mid-april. By late March, statewide snowpack had declined to 118 percent of normal after starting
Drought and Future Water for Southern New Mexico
 Drought and Future Water for Southern New Mexico David S. Gutzler University of New Mexico gutzler@unm.edu * The big drought of 2018 * Longer term challenges for water supply * Forecasting streamflow Elephant
WSWC/NOAA Workshops on S2S Precipitation Forecasting
 WSWC/NOAA Workshops on S2S Precipitation Forecasting San Diego, May 2015 Salt Lake City at NWS Western Region HQ, October 2015 Las Vegas at Colorado River Water Users Association, December 2015 College
Weather and Climate Summary and Forecast Winter
 Weather and Climate Summary and Forecast Winter 2016-17 Gregory V. Jones Southern Oregon University February 7, 2017 What a difference from last year at this time. Temperatures in January and February
Oregon Water Conditions Report May 1, 2017
 Oregon Water Conditions Report May 1, 2017 Mountain snowpack in the higher elevations has continued to increase over the last two weeks. Statewide, most low and mid elevation snow has melted so the basin
NIDIS Intermountain West Regional Drought Early Warning System February 7, 2017
 NIDIS Drought and Water Assessment NIDIS Intermountain West Regional Drought Early Warning System February 7, 2017 Precipitation The images above use daily precipitation statistics from NWS COOP, CoCoRaHS,
Upper Missouri River Basin February 2018 Calendar Year Runoff Forecast February 6, 2018
 Upper Missouri River Basin February 2018 Calendar Year Runoff Forecast February 6, 2018 Calendar Year Runoff Forecast Explanation and Purpose of Forecast U.S. Army Corps of Engineers, Northwestern Division
Presentation Overview. Southwestern Climate: Past, present and future. Global Energy Balance. What is climate?
 Southwestern Climate: Past, present and future Mike Crimmins Climate Science Extension Specialist Dept. of Soil, Water, & Env. Science & Arizona Cooperative Extension The University of Arizona Presentation
Precipitation. Standardized Precipitation Index. NIDIS Intermountain West Regional Drought Early Warning System January 3, 2017
 1/3/2017 NIDIS Drought and Water Assessment NIDIS Intermountain West Regional Drought Early Warning System January 3, 2017 Precipitation The images above use daily precipitation statistics from NWS COOP,
NIDIS Intermountain West Drought Early Warning System January 15, 2019
 NIDIS Drought and Water Assessment NIDIS Intermountain West Drought Early Warning System January 15, 2019 Precipitation The images above use daily precipitation statistics from NWS COOP, CoCoRaHS, and
Missouri River Basin Water Management
 Missouri River Basin Water Management US Army Corps of Engineers Missouri River Navigator s Meeting February 12, 2014 Bill Doan, P.E. Missouri River Basin Water Management US Army Corps of Engineers BUILDING
Forecast Challenges for the Colorado Basin River Forecast Center
 Forecast Challenges for the Colorado Basin River Forecast Center John Lhotak, Development and Operations Hydrologist Improving Sub-Seasonal to Seasonal (S2S) Workshop May 16th, 2018 1 River Forecast Centers
Missouri River Flood Task Force River Management Working Group Improving Accuracy of Runoff Forecasts
 Missouri River Flood Task Force River Management Working Group Improving Accuracy of Runoff Forecasts Kevin Grode, P.E. Reservoir Regulation Team Lead Missouri River Basin Water Management Northwestern
Quenching the Valley s thirst: The connection between Sierra Nevada snowpack & regional water supply
 Quenching the Valley s thirst: The connection between Sierra Nevada snowpack & regional water supply Roger Bales, UC Merced Snow conditions Snow & climate change Research directions Sierra Nevada snow
Flood Risk Assessment
 Flood Risk Assessment February 14, 2008 Larry Schick Army Corps of Engineers Seattle District Meteorologist General Assessment As promised, La Nina caused an active winter with above to much above normal
NIDIS Intermountain West Drought Early Warning System November 21, 2017
 NIDIS Drought and Water Assessment NIDIS Intermountain West Drought Early Warning System November 21, 2017 Precipitation The images above use daily precipitation statistics from NWS COOP, CoCoRaHS, and
Colorado s 2003 Moisture Outlook
 Colorado s 2003 Moisture Outlook Nolan Doesken and Roger Pielke, Sr. Colorado Climate Center Prepared by Tara Green and Odie Bliss http://climate.atmos.colostate.edu How we got into this drought! Fort
Sierra Weather and Climate Update
 Sierra Weather and Climate Update 2014-15 Kelly Redmond Western Regional Climate Center Desert Research Institute Reno Nevada Yosemite Hydroclimate Workshop Yosemite Valley, 2015 October 8-9 Percent of
HyMet Company. Streamflow and Energy Generation Forecasting Model Columbia River Basin
 HyMet Company Streamflow and Energy Generation Forecasting Model Columbia River Basin HyMet Inc. Courthouse Square 19001 Vashon Hwy SW Suite 201 Vashon Island, WA 98070 Phone: 206-463-1610 Columbia River
Monthly Long Range Weather Commentary Issued: February 15, 2015 Steven A. Root, CCM, President/CEO
 Monthly Long Range Weather Commentary Issued: February 15, 2015 Steven A. Root, CCM, President/CEO sroot@weatherbank.com JANUARY 2015 Climate Highlights The Month in Review During January, the average
March 1, 2003 Western Snowpack Conditions and Water Supply Forecasts
 Natural Resources Conservation Service National Water and Climate Center 101 SW Main Street, Suite 1600 Portland, OR 97204-3224 Date: March 17, 2003 Subject: March 1, 2003 Western Snowpack Conditions and
Inflow Forecasting for Hydro Catchments. Ross Woods and Alistair McKerchar NIWA Christchurch
 Inflow Forecasting for Hydro Catchments Ross Woods and Alistair McKerchar NIWA Christchurch Inflows Water flowing into hydro storages Usually measured by monitoring the levels and outflows from hydro storages
2003 Moisture Outlook
 2003 Moisture Outlook Nolan Doesken and Roger Pielke, Sr. Colorado Climate Center Prepared by Tara Green and Odie Bliss http://climate.atmos.colostate.edu Through 1999 Through 1999 Fort Collins Total Water
A Review of the 2007 Water Year in Colorado
 A Review of the 2007 Water Year in Colorado Nolan Doesken Colorado Climate Center, CSU Mike Gillespie Snow Survey Division, USDA, NRCS Presented at the 28 th Annual AGU Hydrology Days, March 26, 2008,
NIDIS Intermountain West Drought Early Warning System December 18, 2018
 NIDIS Intermountain West Drought Early Warning System December 18, 2018 Precipitation The images above use daily precipitation statistics from NWS COOP, CoCoRaHS, and CoAgMet stations. From top to bottom,
NIDIS Intermountain West Drought Early Warning System April 18, 2017
 1 of 11 4/18/2017 3:42 PM Precipitation NIDIS Intermountain West Drought Early Warning System April 18, 2017 The images above use daily precipitation statistics from NWS COOP, CoCoRaHS, and CoAgMet stations.
Changing Hydrology under a Changing Climate for a Coastal Plain Watershed
 Changing Hydrology under a Changing Climate for a Coastal Plain Watershed David Bosch USDA-ARS, Tifton, GA Jeff Arnold ARS Temple, TX and Peter Allen Baylor University, TX SEWRU Objectives 1. Project changes
DK DM M EMORANDUM D ECEMBER 28, 2018 SUBJECT:
 TO: CC: FROM: SUBJECT: BOARD OF DIRECTORS M EMORANDUM D ECEMBER 28, 2018 ANDY MUELLER, GENERAL MANAGER DAVE DK KANZER, P.E. & DON MEYER, P.E. DK DM COLORADO RIVER BASIN WATER SUPPLY CONDITIONS UPDATE AND
Weather and Climate Summary and Forecast February 2018 Report
 Weather and Climate Summary and Forecast February 2018 Report Gregory V. Jones Linfield College February 5, 2018 Summary: For the majority of the month of January the persistent ridge of high pressure
Incorporating Large-Scale Climate Information in Water Resources Decision Making
 Incorporating Large-Scale Climate Information in Water Resources Decision Making Balaji Rajagopalan Dept. of Civil, Env.. And Arch. Engg.. And CIRES Katrina Grantz, Edith Zagona (CADSWES) Martyn Clark
INVISIBLE WATER COSTS
 Every Drop Every Counts... Drop Counts... INVISIBLE WATER COSTS Corn - 108.1 gallons per pound How much water it takes to produce... Apple - 18.5 gallons to grow Beef - 1,581 gallons per pound Oats - 122.7
ALASKA REGION CLIMATE OUTLOOK BRIEFING. December 22, 2017 Rick Thoman National Weather Service Alaska Region
 ALASKA REGION CLIMATE OUTLOOK BRIEFING December 22, 2017 Rick Thoman National Weather Service Alaska Region Today s Outline Feature of the month: Autumn sea ice near Alaska Climate Forecast Basics Climate
Upper Missouri River Basin January 2018 Calendar Year Runoff Forecast January 3, 2018
 Calendar Year Runoff Forecast Upper Missouri River Basin January 2018 Calendar Year Runoff Forecast January 3, 2018 Explanation and Purpose of Forecast U.S. Army Corps of Engineers, Northwestern Division
Snowcover interaction with climate, topography & vegetation in mountain catchments
 Snowcover interaction with climate, topography & vegetation in mountain catchments DANNY MARKS Northwest Watershed Research Center USDA-Agricultural Agricultural Research Service Boise, Idaho USA RCEW
REDWOOD VALLEY SUBAREA
 Independent Science Review Panel Conceptual Model of Watershed Hydrology, Surface Water and Groundwater Interactions and Stream Ecology for the Russian River Watershed Appendices A-1 APPENDIX A A-2 REDWOOD
Weather and Climate Summary and Forecast March 2018 Report
 Weather and Climate Summary and Forecast March 2018 Report Gregory V. Jones Linfield College March 7, 2018 Summary: The ridge pattern that brought drier and warmer conditions from December through most
Weather and Climate of the Rogue Valley By Gregory V. Jones, Ph.D., Southern Oregon University
 Weather and Climate of the Rogue Valley By Gregory V. Jones, Ph.D., Southern Oregon University The Rogue Valley region is one of many intermountain valley areas along the west coast of the United States.
Predicting Fire Season Severity in the Pacific Northwest
 Predicting Fire Season Severity in the Pacific Northwest Paul Werth 1 Abstract Projections of fire season severity that integrate historical weather and fire information can be used by fire managers when
Upper Missouri River Basin December 2017 Calendar Year Runoff Forecast December 5, 2017
 Upper Missouri River Basin December 2017 Calendar Year Runoff Forecast December 5, 2017 Calendar Year Runoff Forecast Explanation and Purpose of Forecast U.S. Army Corps of Engineers, Northwestern Division
NIDIS Intermountain West Drought Early Warning System February 6, 2018
 NIDIS Intermountain West Drought Early Warning System February 6, 2018 Precipitation The images above use daily precipitation statistics from NWS COOP, CoCoRaHS, and CoAgMet stations. From top to bottom,
Montana Drought & Climate
 Montana Drought & Climate MARCH 219 MONITORING AND FORECASTING FOR AGRICULTURE PRODUCERS A SERVICE OF THE MONTANA CLIMATE OFFICE IN THIS ISSUE IN BRIEF PAGE 2 REFERENCE In a Word PAGE 3 REVIEW Winter 219:
Key Findings & Implications
 A Tree-Ring Based Assessment of Synchronous Extreme Streamflow Episodes in the Upper Colorado & Salt-Verde-Tonto River Basins Key Findings & Implications August 10, 2005 Workshop A Collaborative Project
NIDIS Intermountain West Drought Early Warning System December 11, 2018
 NIDIS Drought and Water Assessment NIDIS Intermountain West Drought Early Warning System December 11, 2018 Precipitation The images above use daily precipitation statistics from NWS COOP, CoCoRaHS, and
Drought in Southeast Colorado
 Drought in Southeast Colorado Nolan Doesken and Roger Pielke, Sr. Colorado Climate Center Prepared by Tara Green and Odie Bliss http://climate.atmos.colostate.edu 1 Historical Perspective on Drought Tourism
NIDIS Intermountain West Drought Early Warning System November 14, 2017
 NIDIS Intermountain West Drought Early Warning System November 14, 2017 Precipitation The images above use daily precipitation statistics from NWS COOP, CoCoRaHS, and CoAgMet stations. From top to bottom,
Highlights of the 2006 Water Year in Colorado
 Highlights of the 2006 Water Year in Colorado Nolan Doesken, State Climatologist Atmospheric Science Department Colorado State University http://ccc.atmos.colostate.edu Presented to 61 st Annual Meeting
NIDIS Intermountain West Drought Early Warning System October 17, 2017
 NIDIS Drought and Water Assessment NIDIS Intermountain West Drought Early Warning System October 17, 2017 Precipitation The images above use daily precipitation statistics from NWS COOP, CoCoRaHS, and
APPLICATIONS OF DOWNSCALING: HYDROLOGY AND WATER RESOURCES EXAMPLES
 APPLICATIONS OF DOWNSCALING: HYDROLOGY AND WATER RESOURCES EXAMPLES Dennis P. Lettenmaier Department of Civil and Environmental Engineering For presentation at Workshop on Regional Climate Research NCAR
NOAA Water Resources Monitor and Outlook
 NOAA Water Resources Monitor and Outlook 1 Andrea J. Ray, NOAA/ESRL Physical Sciences Division, Michelle Stokes, NOAA Colorado Basin River Forecast Center, and the WRMO steering team: Robert Hartman -
Missouri River Basin Water Management Monthly Update
 Missouri River Basin Water Management Monthly Update Participating Agencies 255 255 255 237 237 237 0 0 0 217 217 217 163 163 163 200 200 200 131 132 122 239 65 53 80 119 27 National Oceanic and Atmospheric
United States Streamflow Probabilities based on Forecasted La Niña, Winter-Spring 2000
 United States Streamflow Probabilities based on Forecasted La Niña, Winter-Spring 2000 contributed by Michael D. Dettinger 1, Daniel R. Cayan 1, and Kelly T. Redmond 2 1 U.S. Geological Survey, Scripps
Variability Across Space
 Variability and Vulnerability of Western US Snowpack Potential impacts of Climactic Change Mark Losleben, Kurt Chowanski Mountain Research Station, University of Colorado Introduction The Western United
NIDIS Intermountain West Drought Early Warning System October 30, 2018
 10/30/2018 NIDIS Drought and Water Assessment NIDIS Intermountain West Drought Early Warning System October 30, 2018 Precipitation The images above use daily precipitation statistics from NWS COOP, CoCoRaHS,
Sierra Nevada Hydroclimatology: An Experimental Prediction of Maximum Daily Snowmelt Discharge in 2005
 Sierra Nevada Hydroclimatology: An Experimental Prediction of Maximum Daily Snowmelt Discharge in 2005 David Peterson, Jessica Lundquist, Iris Stewart, Noah Knowles, Madeline Solomon and Stephen Hager
January 2011 Calendar Year Runoff Forecast
 January 2011 Calendar Year Runoff Forecast 2010 Runoff Year Calendar Year 2010 was the third highest year of runoff in the Missouri River Basin above Sioux City with 38.8 MAF, behind 1978 and 1997 which
NIDIS Intermountain West Drought Early Warning System May 23, 2017
 NIDIS Drought and Water Assessment NIDIS Intermountain West Drought Early Warning System May 23, 2017 Precipitation The images above use daily precipitation statistics from NWS COOP, CoCoRaHS, and CoAgMet
Missouri River Basin Water Management Monthly Update
 Missouri River Basin Water Management Monthly Update Participating Agencies 255 255 255 237 237 237 0 0 0 217 217 217 163 163 163 200 200 200 131 132 122 239 65 53 80 119 27 National Oceanic and Atmospheric
The Documentation of Extreme Hydrometeorlogical Events: Two Case Studies in Utah, Water Year 2005
 The Documentation of Extreme Hydrometeorlogical Events: Two Case Studies in Utah, Water Year 2005 Tim Bardsley1*, Mark Losleben2, Randy Julander1 1. USDA, NRCS, Snow Survey Program, Salt Lake City, Utah.
Upper Missouri River Basin May 2018 Calendar Year Runoff Forecast May 4, 2018
 Calendar Year Runoff Forecast Explanation and Purpose of Forecast Upper Missouri River Basin May 2018 Calendar Year Runoff Forecast May 4, 2018 U.S. Army Corps of Engineers, Northwestern Division Missouri
Evapo-transpiration Losses Produced by Irrigation in the Snake River Basin, Idaho
 Nov 7, 2007 DRAFT Evapo-transpiration Losses Produced by Irrigation in the Snake River Basin, Idaho Wendell Tangborn and Birbal Rana HyMet Inc. Vashon Island, WA Abstract An estimated 8 MAF (million acre-feet)
Winter Climate Forecast
 Winter 2018-2019 Climate Forecast 26 th Winter Weather Meeting, OMSI and Oregon AMS, Portland Kyle Dittmer Hydrologist-Meteorologist Columbia River Inter-Tribal Fish Commission Portland, Oregon Professor
Office of the Washington State Climatologist
 Office of the Washington State Climatologist May 3, 2013 April Event Summary Average April temperatures were below normal for a majority of the state. Total precipitation was above normal for western and
Folsom Dam Water Control Manual Update
 Folsom Dam Water Control Manual Update Public Workshop April 3, 2014 Location: Sterling Hotel Ballroom 1300 H Street, Sacramento US Army Corps of Engineers BUILDING STRONG WELCOME & INTRODUCTIONS 2 BUILDING
The following information is provided for your use in describing climate and water supply conditions in the West as of April 1, 2003.
 Natural Resources Conservation Service National Water and Climate Center 101 SW Main Street, Suite 1600 Portland, OR 97204-3224 Date: April 8, 2003 Subject: April 1, 2003 Western Snowpack Conditions and
Winter Climate Forecast
 Winter 2017-2018 Climate Forecast 25 th Winter Weather Meeting, OMSI and Oregon AMS, Portland Kyle Dittmer Hydrologist-Meteorologist Columbia River Inter-Tribal Fish Commission Portland, Oregon Professor
California 120 Day Precipitation Outlook Issued Tom Dunklee Global Climate Center
 California 120 Day Precipitation Outlook Issued 11-01-2008 Tom Dunklee Global Climate Center This is my second updated outlook for precipitation patterns and amounts for the next 4 s of the current rainy
Weather and Climate Summary and Forecast January 2018 Report
 Weather and Climate Summary and Forecast January 2018 Report Gregory V. Jones Linfield College January 5, 2018 Summary: A persistent ridge of high pressure over the west in December produced strong inversions
January 25, Summary
 January 25, 2013 Summary Precipitation since the December 17, 2012, Drought Update has been slightly below average in parts of central and northern Illinois and above average in southern Illinois. Soil
Wyoming Pre-Workshop Survey Results August 27, 2015 Lander Wyoming
 Wyoming Pre-Workshop Survey Results August 27, 2015 Lander Wyoming WHAT AREA(S) DO YOU WORK IN?! PLANNING, MGT, OPS! DROUGHT! RESEARCH! PUBLIC LANDS MGT! AG OR RANCHING! RECREATION! ENERGY! 0! 3.5! 7!
Webinar and Weekly Summary February 15th, 2011
 Webinar and Weekly Summary February 15th, 2011 -Assessment of current water conditions - Precipitation Forecast - Recommendations for Drought Monitor Upper Colorado Normal Precipitation Upper Colorado
NIDIS Intermountain West Drought Early Warning System January 16, 2018
 NIDIS Drought and Water Assessment NIDIS Intermountain West Drought Early Warning System January 16, 2018 Precipitation The images above use daily precipitation statistics from NWS COOP, CoCoRaHS, and
Weather and Climate Summary and Forecast Winter
 Weather and Climate Summary and Forecast Winter 2016-17 Gregory V. Jones Southern Oregon University December 5, 2016 Well after an October that felt more like November, we just finished a November that
Management of Natural and Environmental Resources for Sustainable Agricultural Development
 World Meteorological Organization (WMO) Management of Natural and Environmental Resources for Sustainable Agricultural Development Use of the Object Modeling System for Operational Water Supply Forecasting
Reclamation Perspective on Operational Snow Data and Needs. Snowpack Monitoring for Streamflow Forecasting and Drought Planning August 11, 2015
 Reclamation Perspective on Operational Snow Data and Needs Snowpack Monitoring for Streamflow Forecasting and Drought Planning August 11, 2015 2 Reclamation Operational Modeling 3 Colorado Basin-wide Models
NIDIS Intermountain West Drought Early Warning System February 12, 2019
 NIDIS Intermountain West Drought Early Warning System February 12, 2019 Precipitation The images above use daily precipitation statistics from NWS COOP, CoCoRaHS, and CoAgMet stations. From top to bottom,
NIDIS Intermountain West Drought Early Warning System April 16, 2019
 NIDIS Intermountain West Drought Early Warning System April 16, 2019 Precipitation The images above use daily precipitation statistics from NWS COOP, CoCoRaHS, and CoAgMet stations. From top to bottom,
2013 Summer Weather Outlook. Temperatures, Precipitation, Drought, Hurricanes and why we care
 2013 Summer Weather Outlook Temperatures, Precipitation, Drought, Hurricanes and why we care Role of the ERCOT Meteorologist Forecasts Develop temperature input for hourly load forecasts (next day, days
Water Temperature Monitoring of the Klamath River Mainstem
 Water Temperature Monitoring of the Klamath River Mainstem Progress Report #3 Prepared by Robert Rohde and Leaf Hillman with assistance provided by Susan Smith and William Tripp Karuk Tribe of California
Weather and Climate Summary and Forecast Summer 2017
 Weather and Climate Summary and Forecast Summer 2017 Gregory V. Jones Southern Oregon University August 4, 2017 July largely held true to forecast, although it ended with the start of one of the most extreme
Climatic and Ecological Conditions in the Klamath Basin of Southern Oregon and Northern California: Projections for the Future
 Climatic and Ecological Conditions in the Klamath Basin of Southern Oregon and Northern California: Projections for the Future A Collaborative Effort by: CLIMATE LEADERSHIP INITIATIVE INSTITUTE FOR A SUSTAINABLE
New Zealand Climate Update No 223, January 2018 Current climate December 2017
 New Zealand Climate Update No 223, January 2018 Current climate December 2017 December 2017 was characterised by higher than normal sea level pressure over New Zealand and the surrounding seas. This pressure
Precipitation. Standardized Precipitation Index. NIDIS Intermountain West Regional Drought Early Warning System December 6, 2016
 12/9/2016 NIDIS Drought and Water Assessment NIDIS Intermountain West Regional Drought Early Warning System December 6, 2016 Precipitation The images above use daily precipitation statistics from NWS COOP,
Mapping the extent of temperature-sensitive snowcover and the relative frequency of warm winters in the western US
 Mapping the extent of temperature-sensitive snowcover and the relative frequency of warm winters in the western US Anne Nolin Department of Geosciences Oregon State University Acknowledgements Chris Daly,
Monthly Long Range Weather Commentary Issued: APRIL 1, 2015 Steven A. Root, CCM, President/CEO
 Monthly Long Range Weather Commentary Issued: APRIL 1, 2015 Steven A. Root, CCM, President/CEO sroot@weatherbank.com FEBRUARY 2015 Climate Highlights The Month in Review The February contiguous U.S. temperature
NIDIS Intermountain West Drought Early Warning System September 4, 2018
 NIDIS Drought and Water Assessment NIDIS Intermountain West Drought Early Warning System September 4, 2018 Precipitation The images above use daily precipitation statistics from NWS COOP, CoCoRaHS, and
NIDIS Intermountain West Drought Early Warning System December 30, 2018
 1/2/2019 NIDIS Drought and Water Assessment NIDIS Intermountain West Drought Early Warning System December 30, 2018 Precipitation The images above use daily precipitation statistics from NWS COOP, CoCoRaHS,
NATIONAL HYDROPOWER ASSOCIATION MEETING. December 3, 2008 Birmingham Alabama. Roger McNeil Service Hydrologist NWS Birmingham Alabama
 NATIONAL HYDROPOWER ASSOCIATION MEETING December 3, 2008 Birmingham Alabama Roger McNeil Service Hydrologist NWS Birmingham Alabama There are three commonly described types of Drought: Meteorological drought
SEPTEMBER 2013 REVIEW
 Monthly Long Range Weather Commentary Issued: October 21, 2013 Steven A. Root, CCM, President/CEO sroot@weatherbank.com SEPTEMBER 2013 REVIEW Climate Highlights The Month in Review The average temperature
Assessing recent declines in Upper Rio Grande River runoff efficiency from a paleoclimate perspective
 Assessing recent declines in Upper Rio Grande River runoff efficiency from a paleoclimate perspective Flavio Lehner, Andrew Wood Eugene Wahl Dagmar Llewellyn, Douglas Blatchford NCAR Research Applications
Update on Seasonal Conditions & Summer Weather Outlook
 Update on Seasonal Conditions & Summer Weather Outlook Andy Bryant National Weather Service Portland, Oregon June 6, 2018 Overview Quick review of winter and spring conditions Seasonal water supply forecasts
Northeast River Forecast Center s
 Northeast River Forecast Center s Apr 13 th Spring Outlook Brought to you by: Edward Capone Service Coordination Hydrologist Overview to Include: Potential flood outlook convective/synoptic conditions
2. PHYSICAL SETTING FINAL GROUNDWATER MANAGEMENT PLAN. 2.1 Topography. 2.2 Climate
 FINAL GROUNDWATER MANAGEMENT PLAN 2. PHYSICAL SETTING Lassen County is a topographically diverse area at the confluence of the Cascade Range, Modoc Plateau, Sierra Nevada and Basin and Range geologic provinces.
The Climate of Oregon Climate Zone 5 High Plateau
 105 E55 Unbound issue i". 9 13oes not circulate CZe Special Report 917 May 1993 The Climate of Oregon Climate Zone 5 Property of OREGON STATE UNIVERSITY Library Serials Corvallis, OR 97331-4503 Agricultural
Monthly Long Range Weather Commentary Issued: APRIL 18, 2017 Steven A. Root, CCM, Chief Analytics Officer, Sr. VP,
 Monthly Long Range Weather Commentary Issued: APRIL 18, 2017 Steven A. Root, CCM, Chief Analytics Officer, Sr. VP, sroot@weatherbank.com MARCH 2017 Climate Highlights The Month in Review The average contiguous
Analysis Links Pacific Decadal Variability to Drought and Streamflow in United States
 Page 1 of 8 Vol. 80, No. 51, December 21, 1999 Analysis Links Pacific Decadal Variability to Drought and Streamflow in United States Sumant Nigam, Mathew Barlow, and Ernesto H. Berbery For more information,