1 UVOD 1 INTRODUCTION
|
|
|
- Dwayne Stevenson
- 5 years ago
- Views:
Transcription
1 PRORA»UN GODIŠNJIH GUBITAKA RADNE ENERGIJE U DISTRI BUCIJSKOJ MREŽI S PRIKLJU»ENOM VJETROELEKTRANOM CALCULATION OF ANNUAL ACTIVE ENERGY LOSSES IN A DISTRIBUTION NETWORK WITH A CONNECTED WIND POWER PLANT Dr. sc. Ranko GoiÊ, Damir Jakus, dipl. ing., Dr. sc. Eugen MudniÊ, SveuËiliπte u Splitu, Fakultet elektrotehnike, strojarstva i brodogradnje, R. BoπkoviÊa b.b, Split, Hrvatska PrikljuËak distribuiranih izvora energije na distribucijsku mreæu, izmeappleu ostalih utjecaja, ima za posljedicu preraspodjelu tokova snaga u mreæi, a time i promjenu iznosa gubitaka radne energije. U odreappleenom trenutku, ovisno o potroπnji u mreæi i snazi koju u mreæu injektira vjetroelektrana, gubici radne snage mogu biti veêi ili manji u odnosu na stanje bez prikljuëene elektrane. Meappleutim, trenutaëna vrijednost gubitaka radne snage nije bitna, veê prvenstveno ukupni gubici radne energije na godiπnjoj razini. Zbog toga je u radu razraappleena metodologija proraëuna godiπnjih gubitaka radne energije u distribucijskoj mreæi u uvjetima prikljuëenog distribuiranog izvora, pri Ëemu se polazi od poznatih kronoloπkih krivulja optereêenja i proizvodnje. OdgovarajuÊi proraëuni su izvrπeni na primjeru realne distribucijske mreæe i vjetroelektrane koja se planira prikljuëiti na nju. Connecting distributed generation to a distribution network affects the load flows in the network, resulting in the redistribution of load flows in the network and thereby changing the amount of active energy losses. At a given moment, depending upon the network consumption and the power injected from a wind power plant into the network, the active power losses can be higher or lower than they were before the wind power plant was connected. However, the aggregate annual energy losses, rather than instantaneous active power losses, are of significance. Therefore, a methodology has been developed for calculating the annual active energy losses in a distribution network in the case of a distributed generation connection, assuming the known chronological consumption and production curves. The corresponding calculations have been performed for an existing distribution network and a wind power plant scheduled to be connected to it. KljuËne rijeëi: distribuirani izvor, gubici radne energije, vjetroelektrana Key words: Distributed generation, wind power plant, active energy losses GoiÊ, R., Jakus, D., MudniÊ, E., ProraËun godišnjih gubitaka radne energije, Energija, god. 56(2007), br.6., str


2
3 1 UVOD U proteklih 10-tak godina svjedoci smo relativno velikog rasta udjela distribuiranih izvora elektriëne energije, tj. elektrana prikljuëenih na distribucijsku mreæu, πto je primarno rezultat: otvaranja træiπta elektriëne energije, praêenog odgovarajuêom zakonskom regulativom za slobodan pristup distribucijskoj mreæi, πto omoguêava privatnim (malim) investitorima ulaganje i izgradnju manjih elektrana, poticajnih cijena elektriëne energije (najëeπêe u obliku fiksnih i garantiranih otkupnih cijena) koje se takoappleer odgovarajuêom zakonskom regulativom redovito propisuju za obnovljive izvore energije i kogeneracijsku proizvodnju, tehnoloπkog napretka, odnosno razvoja efikasnijih i jeftinijih elektrana, posebice onih manjih nazivnih snaga za koje prije, bez prethodne dvije stavke, nije postojala dovoljna motivacija za razvoj. U zadnjih nekoliko godina, posebno je intenzivan rast novih distribuiranih izvora ostvaren u vjetroelektranama. Razlog tome je bio prvenstveno ekonomske naravi, tj. najkraêe vrijeme povrata investicije u odnosu na ostale obnovljive izvore, ali i ostali faktori, kao πto su zanemariv utjecaj na okoliπ, kratko vrijeme izgradnje (tipski proizvod), veliki potencijalni resursi energije vjetra itd. Iako takvo stanje vrijedi i danas, tendencije razvoja vjetroagregata idu prema veêim jedinicama i veêim vjetroelektranama koje se u tom sluëaju prikljuëuju na prijenosnu mreæu. PrikljuËak elektrane na distribucijsku mreæu [1] i [2], bez obzira na snagu elektrane i naponsku razinu, odnosno mjesto prikljuëka, dovode do znaëajnih promjena pogonskih znaëajki distribucijske mreæe, koje se mogu grupirati u stacionarne i dinamiëke znaëajke. PromatrajuÊi samo stacionarne znaëajke, valja istaknuti dva osnovna aspekta: naponske prilike duæ radijalnog kraka distribucijske mreæe na koju je prikljuëen jedan ili viπe distribuiranih izvora, utjecaj na gubitke snage i energije u distribucijskoj mreæi. Oba navedena aspekta mogu imati pozitivne i negativne utjecaje, ovisno o tipu i reæimu rada distribuiranog izvora s jedne strane, te reæimu optereêenja i tehniëkim karakteristikama distribucijske mreæe s druge strane. U ovom radu ukratko su opisane teoretske osnove utjecaja distribuiranih izvora na gubitke snage i energije u distribucijskoj mreæi, te moguênosti njihova izraëuna. Pri tome je od primarnog znaëenja πto toëniji izraëun promje- 1 INTRODUCTION During the past decade, we have witnessed a relatively high increase in the share of distributed generation, i.e. power plants connected to a distribution network, primarily due to the following: electricity market liberalization, accompanied by the corresponding legislative framework for open access to the distribution network, which has made it possible for private (small) investors to invest in and build small power plants, incentive electricity prices, most commonly in the form of fixed and guaranteed feed-in tariffs, which are also regularly stipulated by the legislation governing renewable energy sources and cogeneration, technological achievements, i.e. the development of more efficient and less expensive power plants, especially those with lower nominal power, for which there had been little inducement prior to the above-mentioned market liberalization and price incentives. Recently the growth of new distributed power sources from wind power plants has been particularly intensive. The reason for this is primarily of an economic nature, i.e. the shortest period of investment return among the other renewables as well other factors, such as negligible environmental impact, short construction time (standardized product), the great potential of wind energy resources etc. Although all this still applies today, the trend in wind turbine development is toward large units and wind power plants that are connected to a transmission network. The connection of a power plant to a distribution network [1] and [2], irrespective of the rated power, voltage level and connection point of the power plant, results in significant changes in the operating features of the distribution network, which can be classified as either stationary or transient features. Regarding the stationary features, two basic aspects should be emphasized: the voltage profile along the distribution network radial feeder, to which one or more distributed sources are connected, the impact on power and energy losses in the distribution network. Both of these aspects can have positive or negative repercussions, depending upon the type of distributed generation and operating conditions, on the one side, and the technical characteristics of the distribution network and load conditions, on the other side. In this work, the theoretical foundations of the basic impact of distributed generation upon power and energy losses in a distribution network GoiÊ, R., Jakus, D., MudniÊ, E., ProraËun godišnjih gubitaka radne energije, Energija, god. 56(2007), br. 6., str
4 ne (poveêanja/smanjenja) gubitaka radne energije na godiπnjoj razini nakon prikljuëka distribuiranog izvora na distribucijsku mreæu. Takoappleer, vrlo je znaëajno iznalaæenje prave razine kompromisa izmeappleu detaljnog toënog proraëuna koji zahtijeva veliku koliëinu ulaznih parametara i aproksimativnih izraëuna koji traæe manji opseg ulaznih parametara uz bræi i jednostavniji proraëun, ali uz neπto veêu greπku u proraëunu. Primjer takvog proraëuna dan je za realnu distribucijsku mreæu i vjetroelektranu koja se planira prikljuëiti na nju, na naëin da je napravljen detaljni i aproksimativni izraëun. 2 GUBICI SNAGE I ENERGIJE U DISTRIBUCIJSKOJ MREŽI 2.1 OpÊenito o gubicima snage i energije u distribucijskoj mreæi Prema naëinu nastanka, gubici elektriëne snage i energije [3] dijele se na: tehniëke gubitke koji su direktna su posljedica stavljanja postrojenja pod napon i protjecanja elektriëne struje kroz elemente elektriëne mreæe. VeliËina ovih gubitaka ovisi o tehniëkim karakteristikama elemenata elektriëne mreæe. TehniËki gubici se mogu vrlo toëno ustanoviti mjerenjem ili proraëunom na odgovarajuêem raëunalnom modelu, iako obje metode mogu biti vrlo zahtjevne. Mjerenje zahtijeva instaliranje mjernih ureappleaja koje se uobiëajeno ne koriste, tako da implicira dodatne troπkove. Mjerenjem se ne mogu ustanoviti gubici radne energije u fazi planiranja prikljuëka distribuiranog izvora, dok je nakon prikljuëka to moguêe, ali samo uz dodatne raëunske tehnike kojima je moguêe sa zadovoljavajuêom razinom toënosti ustanoviti promjenu u odnosu na stanje bez distribuiranog izvora. Meappleutim, opêenito mjerenjem nije moguêe ustanoviti tehniëke gubitke u mreæi, prvenstveno zbog utjecaja komercijalnih gubitaka, komercijalne (netehniëke) gubitke koji nastaju zbog neispravnosti mjernih ureappleaja i neovlaπtene potroπnje elektriëne energije. Redovito ih nije moguêe direktno prepoznati i alocirati, veê samo izraëunati kao razliku ukupno registriranih gubitaka (razlika obraëunate elektriëne energije na mjestima preuzimanja i isporuke elektriëne energije) i izraëunatih tehniëkih gubitaka pomoêu raëunalnog modela. TehniËki gubici, s obzirom na naëin nastanka mogu se podijeliti na [4]: are briefly described, as well as possibilities for their calculation. Following the connection of a distributed power plant to a distribution network, it is of primary importance to calculate the changes (increases/decreases) in energy losses on the annual level as precisely as possible. Furthermore, it is very important to find the right level of compromise between detailed and precise calculation, requiring a large number of input parameters, and approximate calculation, requiring fewer input parameters and facilitating faster and simpler calculation but with a somewhat higher margin of error. An example is provided for an existing distribution network and wind power plant scheduled to be connected to it, for which both detailed and approximate calculations have been performed. 2 POWER AND ENERGY LOSSES IN DISTRIBUTION NETWORKS 2.1 Power and energy losses in distribution networks Power and energy losses are classified according to the manner in which they occur [3], as follows: technical losses are a direct consequence of energizing electrical facilities and current flows through the electrical network elements. The majority of these losses depend upon the technical characteristics of the network elements. Technical losses can be determined very precisely by measurement or calculation using a suitable computer model, although both methods can be highly demanding. Measurement requires the installation of measuring equipment, which is generally not used and therefore implies additional costs. Measurement cannot determine active energy losses during the preparatory phase of a distributed generation connection. Measurement can be used after connection but a satisfactory level of accuracy in determining change in comparison to the situation without the distributed source requires the use of additional calculation techniques. However, it is generally not possible to determine technical losses in a network through measurement, primarily due to the influence of commercial losses, commercial (non-technical) losses occur due to the malfunctioning of the measuring equipment and illegal electricity consumption. They cannot be recognized and allocated by regular means but only as the difference between the total registered losses (the difference between the accounted energy at delivery points and the energy delivered to final customers) and the 679 GoiÊ, R., Jakus, D., MudniÊ, E., ProraËun godišnjih gubitaka radne energije, Energija, god. 56(2007), br. 6., str
5 naponski ovisni gubici (tzv. gubici neovisni o optereêenju) nastaju na popreënim elementima ekvivalentne sheme promatranog elementa elektriëne mreæe. TipiËan i najznaëajniji primjer su gubici praznog hoda transformatora koji su u ekvivalentnoj shemi predoëeni popreënom granom. OpÊeniti izraz za naponski ovisne gubitke snage dan je izrazom: technical losses calculated using a computer model. Technical losses are classified according to the manner in which they occur [4], as follows: voltage-dependent losses (so-called load-independent losses) occur in parallel elements of the network under consideration. The typical and most significant examples are transformer iron losses, shown by a cross branch in equivalent schemes. The general expression for voltage-dependent losses is as follows: (1) gdje je: S pop gubici prividne snage u popreënoj grani elementa mreæe, P pop gubici radne snage u popreënoj grani elementa mreæe, Q pop gubici jalove snage u popreënoj grani elementa mreæe, V fazni napon elementa mreæe, Y popreëna admitancija elementa mreæe. Ukupni naponski ovisni gubici snage u promatranom dijelu distribucijske mreæe dani su sumiranjem izraza (1) po svim Ëvorovima mreæe (N): where: S pop apparent power losses in a parallel network element branch, P pop active and reactive power losses in a parallel network element branch, Q pop reactive power losses in a parallel network element branch, V phase voltage of the network elements, Y parallel admittance of the network elements. The total voltage-dependent power losses in the part of the distribution network under consideration is obtained as the sum of expression (1) for all the network nodes (N): (2) Strujno ovisni gubici (tzv. gubici ovisni o optereêenju) nastaju na uzduænim elementima ekvivalentne sheme promatranog elementa mreæe. TipiËni i najznaëajniji primjeri su gubici u vodiëima zraënih, odnosno kabelskih vodova i namotima transformatora. U ekvivalentnoj shemi predoëeni su uzduænom granom elementa mreæe. OpÊeniti izraz za strujno ovisne gubitke snage dan je izrazom: Current-dependent losses (so-called load-dependent losses) occur in series elements of the network equivalent scheme considered. The typical and most significant examples are losses in the conductors of overhead and cable power lines and transformer windings. In an equivalent scheme, they are represented by a series branch of the network element. The general expression for current-dependent losses is as follows: (3) GoiÊ, R., Jakus, D., MudniÊ, E., ProraËun godišnjih gubitaka radne energije, Energija, god. 56(2007), br. 6., str
6 gdje je: S uzd gubici prividne snage u uzduænoj grani elementa mreæe, P uzd gubici radne snage u uzduænoj grani elementa mreæe, Q uzd gubici jalove snage u uzduænoj grani elementa mreæe, I struja koja protjeëe kroz element mreæe, Z uzduæna impedancija elementa mreæe. Ukupni strujno ovisni gubici snage u promatranom dijelu distribucijske mreæe dani su sumiranjem izraza (3) po svim granama mreæe (M): where: S uzd apparent power losses in a series branch of the network element, P uzd active power losses in a series branch of the network element, Q uzd reactive power losses in a series branch of the network element, I network element current, Z network element series impedance. The total current-dependent power losses in the part of the distribution network under consideration is obtained as the sum of expression (3) for all the network branches (M): (4) U razmatranju utjecaja distribuiranog izvora na gubitke snage u distribucijskoj mreæi, popreëni gubici se mogu zanemariti, bez obzira πto se naponske prilike u mreæi ipak mijenjaju. Naime, naponi u mreæi u realnom sluëaju trebali bi biti u granicama ±5 %, πto prema (1) znaëi moguêe varijacije naponski ovisnih gubitaka u granicama ±10 %. To je daleko manje od moguêih varijacija gubitaka ovisnih o strujnom optereêenju mreæe koje moæe varirati u rasponu 0 do 100 %. Zbog toga se dalje u tekstu promatraju samo strujno ovisni gubici, pa je iz oznaka izostavljen indeks uzd koji je oznaëavao komponentu uzduænih gubitaka, πto se dalje podrazumijeva. Izrazi (3) i (4) mogu se izraziti i preko snage koja prolazi kroz element mreæe, tj.: Cconsidering the impact of the distributed source on the power losses in the distribution network, voltage-dependent losses can be ignored, although the voltage conditions in the network nonetheless change. Voltages in the existing situation should be within the limits of ±5 %, which according to (1) signify possible voltage-dependent power loss variation within the limits of ±10 %. This is far less than the possible variations in loss, depending upon the network current loads that can vary within a range of 0 to 100 %. Therefore, only the current-dependent losses will be considered henceforth. The superscript uzd, which indicates the parallel power loss component, will not be written in the expressions but should be assumed. The expressions (3) and (4) can also be expressed as power through the network element, i.e.: (5) (6) gdje je: P radna snaga koja protjeëe kroz element mreæe, Q jalova snaga koja protjeëe kroz element mreæe, R radni otpor elementa mreæe, X induktivni otpor elementa mreæe, U linijski napon elementa mreæe. where: P active power through the network element, Q reactive power through the network element, R the resistance of the network element, X the reactance of the network element, U the phase-to-phase voltage of the network element. 681 GoiÊ, R., Jakus, D., MudniÊ, E., ProraËun godišnjih gubitaka radne energije, Energija, god. 56(2007), br. 6., str
7 Tokovi radnih i jalovih snaga kroz elemente elektroenergetske mreæe, te naponi svih Ëvorova, dobiju se standardnim proraëunom tokova snaga i naponskih prilika, pod pretpostavkom da su poznati tehniëki parametri mreæe, topologija i uklopno stanje, te optereêenje mreæe u svakom Ëvoru. Redovito se u programima za proraëun tokova snaga implementira i proraëun za automatsko izraëunavanje gubitaka radne i jalove snage za svaki element mreæe, te eventualno zbirno po naponskim nivoima, istovrsnim elementima mreæe, distribucijskim (napojnim) podruëjima, izvodima itd. [5] i [6]. Zbog toga je proraëun gubitaka snage u distribucijskoj mreæi zapravo trivijalan zadatak, kojeg je za manju distribucijsku mreæu moguêe izvesti Ëak i ruëno. Meappleutim, poznavanje izraëun gubitaka snage u distribucijskoj mreæi za promatrano optereêenje, opêenito nije dovoljan pokazatelj, bez obzira πto se moæe izvesti primjerice za dva krajnja karakteristiëna stanja maksimalnog i minimalnog optereêenja. Pravi znaëajni pokazatelj su gubici energije u odreappleenom vremenskom razdoblju, primjerice u jednoj kalendarskoj godini. ToËan izraëun gubitaka elektriëne energije znatno usloænjava proraëun i to najmanje iz dva (meappleusobno povezana) razloga: potrebno je poznavati karakteristiku potroπnje u svim Ëvorovima promatrane distribucijske mreæe, tj. kronoloπke krivulje optereêenja linearno diskretizirane na veêe ili manje vremenske podintervale (primjerice sate) ili odgovarajuêe krivulje trajanja optereêenja. Prva aproksimacija, bez veêih utjecaja na greπku proraëuna, moæe se napraviti i koriπtenjem navedenih krivulja promatrane distribucijske mreæe u cjelini, uz odgovarajuêu raspodjelu potroπnje po Ëvorovima koja odgovara potroπnji u trenutku vrπnog optereêenja ili u trenutku za koje raspolaæemo izmjerenim podacima optereêenja svih Ëvoriπta, s obzirom na promjenljivost potroπnje, proraëun tokova snaga potrebno je napraviti za svaki promatrani vremenski podinterval ili eventualno reducirati potreban broj proraëuna na naëin da se koristi krivulja trajanja optereêenja i njena linearizacija na veêe podsegmente (u odnosu na bazni vremenski podinterval), pri Ëemu je onda za oëekivati odreappleenu pogreπku u rezultatu zbog takve aproksimacije. Dakle, ukupni gubici energije u promatranom vremenskom razdoblju T mogu se dobiti iz izraza (6), sumiranjem gubitaka energije po svim vremenskim podintervalima unutar ukupno promatranog razdoblja, pod pretpostavkom konstantnog optereêenja u svakom podintervalu i istog trajanja svakog podintervala ( t): The flows of active and reactive power through the power network elements and all the node voltages are obtained using the standard calculations of the load flow and voltage drop, assuming that the technical parameters of the network, topology, network configuration and network loads in each node are known. In power flow software, automatic active and reactive calculations of power losses are regularly performed for each network element, and eventually totaled according to voltage levels, the same types of network elements, distribution areas, feeders etc. [5] and [6]. Therefore, the calculation of the power losses in a distribution network is actually a trivial task, which can even be performed manually for a small distribution network. However, the power loss in a distribution network for a particular load is generally not a sufficient indicator, although calculation can be performed, e.g. for two characteristic states of maximum and minimum loads. The truly significant indices are energy losses during a specific time period, e.g., during one calendar year. The precise calculation of electrical energy losses significantly complicates analysis, for at least two related reasons: it is necessary to know the load characteristics for all the nodes of the distribution network considered, i.e. the chronological load curves linearly discretized into larger or smaller time subintervals (e.g., hours) or corresponding load duration curves. The first approximation, without a major impact on the calculation error, can be performed by using the aforementioned curves of the considered distribution network in its entirety, with the corresponding load allocation on the nodes, which corresponds to consumption at the moment of peak load or at the moment for which we have measured load data available for all the nodes, due to load variability, load flow calculation should be performed for each time subinterval considered or eventually the required number of calculations should be reduced in such a manner that the load duration curve and its linearization are used on large subsegments (in relation to the basic time subinterval), although a certain degree of error should be expected in the result due to such approximations. Therefore, total energy losses during the time period T under consideration can be obtained using expression (6), by totaling the energy losses according to all the time subintervals within the total period under consideration, assuming a constant load at each subinterval and the same duration of each subinterval (Δt): GoiÊ, R., Jakus, D., MudniÊ, E., ProraËun godišnjih gubitaka radne energije, Energija, god. 56(2007), br. 6., str
8 (7) U gornjem izrazu, napon se moæe pretpostaviti jednak nazivnom naponu bez veêeg utjecaja na toënost izraëuna. U sluëaju proraëuna gubitaka energije pomoêu programa za tokove snaga, nema potrebe za takvom aproksimacijom. Ako se proraëun radi temeljem aproksimirane krivulje trajanja optereêenja, vremenski podintervali t opêenito ne moraju biti jednaki, tako da je u izrazu (7) faktor t potrebno uvesti u sumu. In the above expression, the voltage can be assumed to be equal to the rated voltage, without major impact upon the precision of the calculation. In the calculation of energy losses using load flow software, there is no need for such approximation. If the calculation is based upon the approximated load duration curve, the time subintervals Δt generally do not have to be equal, so that in expression (7), factor Δt must be entered into the sum. 2.2 Utjecaj prikljuëka distribuiranog izvora na gubitke snage i energije u distribucijskoj mreæi U tzv. pasivnoj distribucijskoj mreæi radne i jalove snage u granama P i (t), Q i (t) rezultat su iskljuëivo potroπnje, odnosno potroπaëa prikljuëenih iza (u odnosu na pojnu toëku) promatrane grane mreæe, te gubitaka snage u granama (koji su obiëno reda veliëine do nekoliko postotaka). Zbog toga se na radijalnom izvodu distribucijske mreæe (npr. izvodu 10 kv ili 20 kv) snage u granama smanjuju kako se kreêe od pojne toëke prema kraju izvoda, pa se i gubici koncentriraju na poëetnim granama, te opadaju prema kraju izvoda. Na slici 1 je prikazan primjer 10(20) kv-nog izvoda napajanog iz TS x/10(20) kv sa 5 Ëvorova (mjesta prikljuëka TS x/0,4 kv) i 5 grana (vodova). Grafikonom su prikazani tokovi radnih i jalovih snaga duæ izvoda, tj. po svim granama. Potroπnja radne i jalove snage u i-tom Ëvoriπtu oznaëena je sa P p-i, odnosno Q p-i. Ako se npr. u Ëvoru 4 prikljuëi elektrana, ona Êe u trenutku t proizvoditi radnu snagu P G (t) i jalovu snagu Q G (t), pa se takva mreæa, odnosno dio mreæe od pojne toëke do Ëvora s prikljuëenom elektranom, naziva aktivna distribucijska mreæa. U sluëaju da nema potroπnje na izvodu, radna i jalova snaga koju proizvede elektrana ima tijek prema pojnoj toëki i to u jednakom iznosu preko svih grana 1 do 4 (takoappleer zanemareni gubici). Superpozicijom tokova snaga u granama koje su rezultat potroπnje i tokova snaga koje su rezultat proizvodnje elektrane, dobije se situacija prikazana na slici 2. Odabran je sluëaj kad je radna snaga elektrane upravo jednaka potroπnji na izvodu, dok je jalova snaga elektrane jednaka nuli, buduêi da je najëeπêi sluëaj da distribuirani izvori rade s faktorom snage cos = 1. Meappleutim, u nekim sluëajevima radi se o asinkronim generatorima bez kompenzacije jalove snage, tako da elektrana u tom sluëaju predstavlja dodatnog potroπaëa jalove snage, poveêavajuêi na taj naëin optereêenje grana jalovom snagom. 2.2 The impact of the connection of a distributed source on power and energy losses in a distribution network In a so-called passive distribution network, the active and reactive power in branches P i (t) and Q i (t) are exclusively the result of the loads connected behind the feeder supply point of the network branch considered, and the power losses in the branches (which are usually of an order of magnitude of up to several percentage points). Therefore, on the radial distribution feeder, e.g., a 10 kv or 20 kv feeder, the power in the branches decreases as we move away from the feeder supply point toward the feeder end, so that the losses are concentrated at the beginning branches and decrease toward the end of the feeder. Figure 1 presents an example of a 10(20) kv feeder supplied from an x/10(20) kv substation with 5 nodes (the connection points of the x/10(20) kv substation) and 5 branches (lines). The graphs present the active and reactive power flows along the feeder, i.e. along all the branches. The active and reactive consumption in the i th node is indicated by P p-i or Q p-i. If, for example, a power plant is connected to Node 4, it will generate active power P G (t) and reactive power Q G (t) at the moment of time t. Such a network, i.e. the part of the network from the feeder supply point to the node with the power plant connection, is called the active distribution network. In the event that there are no loads on the feeder, the active and reactive power generated by the power plant will flow toward the feeder supply point in equal amounts along all the branches 1 to 4 (also with negligible losses). By superposition of the branch power flows resulting from consumption and the power flows resulting from power plant generation, the situation presented in Figure 2 is obtained. A case has been selected in which the active power of the power plant is equal to the loads on the feeder, while the reactive power of the power plant is equal to zero, since the distributed sources usually operate with a power factor of cos = GoiÊ, R., Jakus, D., MudniÊ, E., ProraËun godišnjih gubitaka radne energije, Energija, god. 56(2007), br. 6., str
9 However, some cases involve induction generators lacking reactive power compensation, so that a power plant represents an additional reactive power load, thereby increasing the reactive power load of the branches. Slika 1 Tokovi snaga u granama pasivne distribucijske mreæe Figure 1 Power flows in a passive distribution network 110(35) kv 10(20) kv Mreža 110 kv / 110 kv network P p-1 (t) Q p-1 (t) P p-2 (t) Q p-2 (t) P p-3 (t) Q p-3 (t) P p-4 (t) Q p-4 (t) P p-5 (t) Q p-5 (t) Tokovi radnih snaga / Active power flow P 1 (t) P 2 (t) Tokovi jalovih snaga / Reactive power flow Q 1 (t) Q 2 (t) P 3 (t) Q 3 (t) P 4 (t) Q 4 (t) P 5 (t) Q 5 (t) Slika 2 Tokovi snaga u granama aktivne distribucijske mreæe Figure 2 Power flows in an active distribution network Mreža 110 kv / 110 kv network 110(35) kv 10(20) kv Tokovi radnih snaga (bez elektrane) / Active power flow (without power plant) P p-1 (t) Q p-1 (t) P p-2 (t) Q p-2 (t) P p-3 (t) Q p-3 (t) P p-4 (t) Q p-4 (t) P G (t) Q G (t) P p-5 (t) Q p-5 (t) Tokovi radnih snaga (s elektranom) / Active power flow (with power plant) Tokovi jalovih snaga / Reactive power flow Q 1 (t) P 1 (t)=0 Q 2 (t) P 2 (t) P 3 (t) Q 3 (t) P 4 (t) Q 4 (t) P 5 (t) Q 5 (t) Prikazani primjer ilustrira tipiënu situaciju u aktivnoj distribucijskoj mreæi, u kojoj se mijenja iznos i smjer tokova radnih snaga u svim granama od pojne toëke do mjesta prikljuëka elektrane u mreæi. Sa stanoviπta gubitaka radne snage, elektrana u ovakvom sluëaju ima pozitivni uëinak, buduêi da u cjelini smanjuje tokove radnih snaga u mreæi, pa tako i gubitke radne snage. Meappleutim, u sluëaju da je proizvodnja radne snage elektrane znatno veêa od ukupne potroπnje radne snage na izvodu, dobit Êe se obrnuti efekt, tj. poveêanje ukupnih tokova radne snage po granama, tako da Êe ukupni gubici radne snage biti veêi. Doprinos rada prikljuëene elektrane na smanjenje/ poveêanje gubitaka radne snage na promatranom The example shown illustrates a typical situation in an active distribution network, in which the amount and direction of the active power flows change in all the branches from the feeder supply point to the point at which the power plant is connected to the network. From the standpoint of active power losses, in such a case the power plant has a positive impact, since it decreases the active power flows in the network as a whole, and thereby also the active power losses. However, in the event that the generation of active power by the power plant is significantly greater than the total active power load at the feeder, the opposite effect occurs, i.e. the increase of the total active power flows of the branches, so that the total active power losses will be greater. GoiÊ, R., Jakus, D., MudniÊ, E., ProraËun godišnjih gubitaka radne energije, Energija, god. 56(2007), br. 6., str
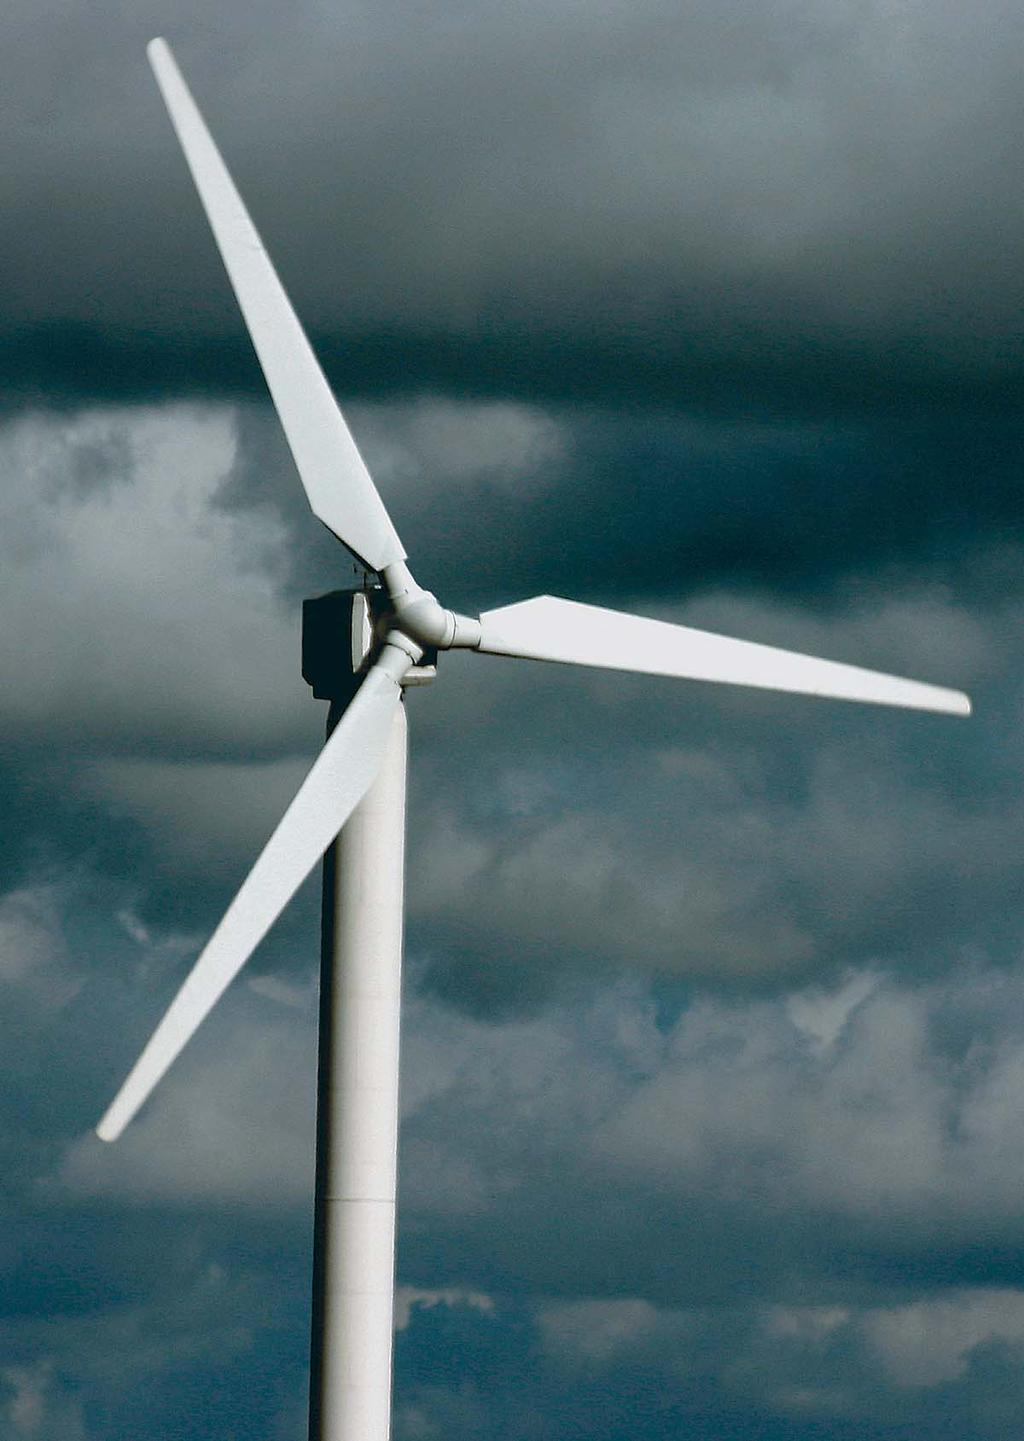
10 izvodu distribucijske mreæe za promatrani trenutak lako se izraëunava na naëin da se gubici izraëunaju u obje varijante (bez elektrane i sa elektranom). Meappleutim, za izraëun gubitaka radne energije u duæem vremenskom razdoblju, takav proraëun je potrebno ponoviti za sve kombinacije potroπnje na izvodu i proizvodnje elektrane, buduêi da su potroπnja i proizvodnja promjenljive u vremenu i u naëelu ne postoji nikakva meappleusobna ovisnost (korelacija). Dakle, prilikom raëunanja gubitaka radne energije bitno je uvaæiti kronoloπku podudaranost potroπnje s proizvodnjom distribuiranog izvora [7] i [8], pri Ëemu smanjenju gubitaka pridonosi njihova vremenska podudaranost (maksimalno optereêenje maksimalna proizvodnja, minimalno optereêenje minimalna proizvodnja). The contribution of the operation of the connected power plant to the decrease/increase in the active power losses at a distribution network feeder at a given moment can be easily determined by calculating the losses for both variants, with and without the power plant. However, for the calculation of the active power losses over a longer period of time, it is necessary to repeat such calculations for all the combinations of feeder loads and power plant generation, since consumption and generation are variable in time and in principle are not correlated. Therefore, when calculating active energy losses, it is essential to take the chronological correlation of consumption and generation into account [7] and [8]. Losses are decreased when consumption and generation are synchronous (maximum load maximum generation, minimum load minimum generation). 3 PRORA»UN GUBITAKA RADNE SNAGE U DISTRIBUCIJSKOJ MREŽI S PRIKLJU»ENOM VJETROELEKTRANOM 3.1 Ulazni parametri Primjer proraëuna utjecaja prikljuëka elektrane na gubitke radne snage u distribucijskoj mreæi izraappleen je na realnoj mreæi 30 kv, tj. zraënom vodu TS Bilice Primoπten Rogoznica. Na taj vod se planira, kao jedna od opcija, prikljuëak vjetroelektrane Orlice snage 11 x 900 kw (9,9 MW), koji bi se izveo kabelom presjeka 3x185 mm 2 Al od lokacije vjetroelektrane do prikljuënog mjesta na jednom stupu navedenog nadzemnog voda 30 kv koji se koristi se za napajanje TS 30/10 kv Primoπten i TS 30/10 kv Rogoznica. Jednopolna shema promatrane distribucijske mreæe i VE Orlice prikazana je na slici 3. Plavom bojom prikazana je transformacija 110/30 kv u TS 220/110/30 kv Bilice odakle se napaja DV 30 kv Bilice Primoπten Rogoznica koji je prikazan zelenom bojom. Crvenom bojom prikazana je interna kabelska mreæa 30 kv VE Orlice zajedno s prikljuënim kabelom. Topologija interne kabelske mreæe VE Orlice rezultat je posebne analize kojom su definirane trase, presjeci i naëin povezivanja vjetrogeneratora s obzirom na pozicije vjetrogeneratora i pristupne ceste. Oznake vjetrogeneratora VE I-x i VE II-x odnose se na prvu fazu (6 VG) i drugu fazu (5 VG) izgradnje VE Orlice, uz izostavljene vjetrogeneratore druge faze VE II-3 i VE II-4. 3 CALCULATION OF ACTIVE POWER LOSS IN A DISTRIBUTION NETWORK WITH A CONNECTED WIND POWER PLANT 3.1 Input parameters An example of the calculation of the impact of power plant generation on the active power losses in a distribution network has been performed for an existing 30 kv network, i.e. the overhead line supplying the Primoπten and Rogoznica 30/10 kv substations from the Bilice 110/30 kv substation. Among the options is the connection of the Orlice Wind Power Plant (WPP) with a rated power of 11 x 900 kw (9,9 MW) using a 3x185 mm 2 aluminum cable from the wind power plant site to the connection point at one of the poles of the 30 kv overhead line used to supply the Primoπten and Rogoznica substations. A single-line diagram of this distribution network at the Orlice WPP is presented in Figure 3. Transformation of 110/30 kv is shown in blue at the Bilice 220/110/30 kv substation, which supplies the Bilice Primoπten Rogoznica 30 kv line, shown in green. The 30 kv internal cable network of the Orlice WPP together with the connection cable is shown in red. The internal cable network topology of the Orlice WPP is the result of a separate analysis according to which the routes, cross-sections and wind turbine interconnection method are defined, regarding the positions of the wind turbines and access roads. The designations VE I-x and VE II-x of the wind turbines refer to the first phase (6 wind turbines) and the second phase (5 wind turbines) of the construction of the Orlice Wind Power Plant, 685 GoiÊ, R., Jakus, D., MudniÊ, E., ProraËun godišnjih gubitaka radne energije, Energija, god. 56(2007), br. 6., str
11 Mjesto prikljuëka je oko 15 km od poëetka voda. TehniËki parametri srednjonaponske (SN) mreæe i interne kabelske mreæe vjetroelektrane dani su u tablicama 1 i 2. omitting the VE II-3 and VE II-4 wind turbines of the third phase. The connection point is approximately 15 km from the beginning of the overhead line feeder. The technical parameters of the medium-voltage network and internal cable network of the wind power plant are presented in Tables 1 and 2. Slika 3 Jednopolna shema distribucijske mreæe 30 kv Bilice- Primoπten-Rogoznica i VE Orlice Figure 3 Single-line diagram of the Bilice- Primoπten-Rogoznica 30 kv network and the Orlice WPP POSTOJEΔA MREŽA / EXISTING NETWORK VE ORLICE / ORLICE WPP (11 x 0,9 MW) Tablica 1 Parametri vodova Table 1 Power line data Tip voda / Line type I max (A) R d / R 0 (Ω/km) X d / X 0 (Ω/km) B d / B 0 (μs/km) Al/» 3x ,157 / 0,471 0,38 / 1,14 3,25 / 3,25 Al/» 3x ,253 / 0,403 0,35 / 1,47 3,3 / 1,98 Cu 3x ,155 / 0,465 0,38 / 1,14 3,08 / 3,08 XHE 49 3x ,164/1,07 0,11/0,36 88/88 GoiÊ, R., Jakus, D., MudniÊ, E., ProraËun godišnjih gubitaka radne energije, Energija, god. 56(2007), br. 6., str
12 Tablica 2 Parametri transformatora Table 2 Transformer dana Transformator / Transformer Komada / Number U n1 /U n2 /U n3 (kv) S n1 /S n2 /S n3 (MVA) P ksp-s /P ksp-t /P kss-t (KW) u kp-s /u kp-t /u ks-t (%) P 0 (kw) I 0 (%) Grupa spoja / Connection Bilice / 30 / / 63 / / 80 / / 12 / 7,7 52,5 0,5 Ynyn0d11 Primoπten 2 30 / ,4 4 Yd5 Rogoznica 1 30 / ,4 4 Yd5 VE Orlice / ,1 2 Yd5 Vrπna snaga TS 30/10 kv Primoπten iznosi 6 + j 2 MVA, a TS 30/10 kv Rogoznica 2,5 + j 0,8 MVA, tako da je ukupno neistodobno vrπno optereêenje izvoda 8,5 + j 2,8 MVA, a faktor istodobnosti je blizu 1, buduêi da se radi o ljetnom vrπnom optereêenju konzuma praktiëki istih karakteristika. U odnosu na maksimalnu planiranu snagu VE Orlice, vrπno radno optereêenje je oko 15 % manje. BuduÊi da se radi o ljetnom vrπnom optereêenju u kojem se vrlo rijetko moæe oëekivati maksimalni angaæman VE Orlice, za oëekivati je relativno Ëeste situacije: maksimalne distribucijske potroπnje i minimalne proizvodnje VE Orlice (ljeti), minimalne distribucijske potroπnje i maksimalne proizvodnje VE Orlice (proljeêe, jesen). Svi proraëuni gubitaka radne snage i energije u distribucijskoj mreæi ograniëeni su na DV 30 kv Bilice Primoπten Rogoznica i transformatore 30/10 kv Primoπten i Rogoznica, dakle bez transformacije 110/30 kv i prijenosne mreæe. 3.2 Rezultati proraëuna ProraËun gubitaka radne snage u prethodno opisanoj mreæi 30 kv napravljen je uz pretpostavku prikljuëene VE Orlice, pri Ëemu je pretpostavljen reæim potpune kompenzacije jalove snage, tj. svaki vjetroagregat radi s faktorom snage cos = 1. ProraËuni su napravljeni na modelu u programskom paketu PowerCAD za razliëite kombinacije potroπnje u mreæi i proizvodnje VE Orlice. Tablica 3 prikazuje izraëunate gubitke radne snage u ovisnosti o optereêenju (potroπnja TS Primoπten i TS Rogoznica), πto je osnovna referenca za daljnje proraëune gubitaka radne snage i energije. The peak power of the Primoπten 30/10 kv substation amounts to 6 + j 2 MVA, and that of the Rogoznica 30/10 kv substation is 2,5 + j 0,8 MVA, so that the total non-simultaneous feeder peak load is 8,5 + j 2,8 MVA, and the coincidence load factor is close to 1, since this is a case of a summer peak load of two substations supplying similar loads. In relation to the maximum planed power rating of the Orlice WPP, the active power peak load is approximately 15 % lower. Since this is a case of a summer peak load in which the maximum generation of the Orlice WPP will occur very rarely, the following situations can be expected to occur relatively often: maximum distribution consumption and minimum generation of the Orlice WPP (summer), minimum distribution consumption and maximum generation of the Orlice WPP (spring and autumn). All the calculations of the active power and energy losses in the distribution network are limited to the Bilice Primoπten Rogoznica 30 kv overhead line and the Primoπten and Rogoznica 30/10 kv transformers, i.e. without 110/30 kv transformation and the transmission network. 3.2 Calculation results Calculations of active power losses in the previously described 30kV network have been performed under the assumption that the Orlice WPP is connected, and it was also assumed that the reactive power was fully compensated, i.e. each wind generator operates at a power factor of cos = 1. The calculations were performed on a model using PowerCAD software for various load combinations in the network and generation of the Orlice WPP. Table 3 presents the calculated load-dependent active power losses (consumption of the Primoπten and Rogoznica substations), which is the basic reference for the further calculation of the reactive power and energy losses. 687 GoiÊ, R., Jakus, D., MudniÊ, E., ProraËun godišnjih gubitaka radne energije, Energija, god. 56(2007), br. 6., str
13 Tablica 3 Gubici snage u mreæi 30 kv bez VE Orlice Table 3 Power losses in the 30 kv network without the Orlice WPP Potroπnja / Load (%) Gubici snage / Active power loss (kw) U tablici 4, prikazani su rezultati proraëuna gubitaka radne snage u mreæi 30 kv na naëin da je varirana proizvodnja VE Orlice od 10 % P n do P n, te potroπnja od 30 % P peak do P peak. Gubici radne snage raëunati su za svaku kombinaciju potroπnje i proizvodnje, tako da su rezultati prikazani u matriënom obliku. Prvi redak pribliæno odgovara stanju bez VE Orlice (proizvodnja VE Orlice = 0), ali su gubici radne snage neznatno manji u odnosu na vrijednosti iz tablice 3, buduêi da kabelska mreæa 30 kv VE Orlice u praznom hodu proizvodi jalovu snagu i injektira je u zraëni vod 30 kv, smanjujuêi na taj naëin tokove jalovih snaga. In Table 4, the results of the calculation of the active power losses in the 30 kv network are presented in such a manner that the Orlice WPP generation varied from 10 % P n to P n, and the load from 30 % P peak to P peak. Active power losses were calculated for each combination of load and generation and the results were presented in matrix form. The first row approximately corresponds to the situation without the Orlice WPP (Orlice WPP generation = 0). The active power losses are insignificantly lower than the values from Table 3, since the unloaded 30 kv cable network of the Orlice WPP generates reactive power and injects it into the 30 kv overhead line, thereby reducing the reactive power flows. Tablica 4 Gubici radne snage u mreæi 30 kv ovisno o angaæiranju VE Orlice (kw) Table 4 Active power losses in the 30 kv network in relation to generation of the Orlice WPP Potroπnja / Load (%) 30 % 40 % 50 % 60 % 70 % 80 % 90 % 100 % Snaga VE Orlice / Orlice WPP power (MW) 0, , , , , , , , , , Rezultati iz tablice 4 prikazani su grafiëki na slikama 4, 5 i 6. Na slici 4 prikazana je krivulja gubitaka radne snage u mreæi 30 kv ovisno o optereêenju mreæe i proizvodnji VE Orlice. Tamno plava linija prikazuje gubitke radne snage kad VE Orlice nije prikljuëena na distribucijsku mreæu. PodruËje osjenëano svjetlo plavom bojom prikazuje granicu u kojoj se kreêu gubici radne snage u mreæi 30 kv u sluëaju da je prikljuëena VE Orlice, a raspon se odnosi na angaæiranje VE Orlice 0 do P n. The results from Table 4 are presented graphically in Figures 4, 5 and 6. Figure 4 presents the active power loss curve in the 30 kv network as a function of the network load and generation of the Orlice WPP. The dark blue line shows the active power losses when the Orlice WPP is not connected to the distribution network. The light blue shaded area shows the range of the active power losses in the 30 kv network when the Orlice WPP is connected, as a function of its generation, 0 to P n. GoiÊ, R., Jakus, D., MudniÊ, E., ProraËun godišnjih gubitaka radne energije, Energija, god. 56(2007), br. 6., str

14 Na slikama 5 i 6 prikazane su apsolutne, odnosno postotne promjene ukupnih gubitaka snage na DV Bilice Primoπten Rogoznica, ovisno o optereêenju mreæe i veliëini angaæiranja VE Orlice. Kao referenca za promjenu gubitaka uzeti su podaci iz tablice 3, tj. gubici bez VE Orlice, prema postojeêem stanju mreæe. Iz slika 4 do 6 jasno se uoëava uglavnom pozitivan utjecaj prikljuëka VE Orlice u smislu smanjenja gubitaka radne snage u distribucijskoj mreæi na koju se prikljuëuje. PrikljuËak VE Orlice poveêava gubitke radne snage jedino u kombinacijama niske potroπnje i visoke proizvodnje. Figures 5 and 6 present the absolute or percentage changes in the total power losses on the Bilice Primoπten Rogoznica overhead line, as a function of network load and generation of the Orlice WPP. Data from Table 3, i.e. energy losses prior to the connection of the Orlice WPP, were used as reference values indicating the existing status of the network. From Figures 4 to 6, the generally positive impact of the connection of the Orlice WPP is evident in reducing active power losses in the distribution network to which it is connected. Connection of the Orlice WPP only increases active power losses in combinations of low loads and high generation. Gubici snage / Power loss (kw) bez VE / without WPP sa VE / with WPP Slika 4 Raspon gubitaka radne snage u mreæi 30 kv u sluëaju prikljuëka VE Orlice Figure 4 Active power losses in the 30 kv network with the Orlice WPP connected Potrošnja / Load (%) Razlika gubitaka snage / Difference in active power loss (kw) ,99 1,98 2,97 3,96 4,95 5,94 6,93 7,92 8,91 9,9 Potrošnja / Load (%) 30 % 40 % 50 % 60 % 70 % 80 % 90 % 100 % Slika 5 Apsolutne promjene gubitaka radne snage u mreæi 30 kv u sluëaju prikljuëka VE Orlice Figure 5 Absolute active power loss changes in the 30 kv network with the Orlice WPP connected Snaga vjetroelektrane / WPP power (MW) 689 GoiÊ, R., Jakus, D., MudniÊ, E., ProraËun godišnjih gubitaka radne energije, Energija, god. 56(2007), br. 6., str
15 Slika 6 Postotne promjene gubitaka radne snage u mreæi 30 kv u sluëaju prikljuëka VE Orlice Figure 6 Active power losses in the 30 kv network with the Orlice WPP connected (%) Razlika gubitaka snage / Difference in active power loss (%) ,99 1,98 2,97 3,96 4,95 5,94 6,93 7,92 8,91 9,9 Potrošnja / Load (%) 30 % 40 % 50 % 60 % 70 % 80 % 90 % 100 % Snaga vjetroelektrane / WPP power (MW) 4 PRORA»UN GODIŠNJIH GUBITAKA RADNE ENERGIJE U DISTRIBUCIJSKOJ MREŽI S PRIKLJU»ENOM VJETROELEKTRANOM 4 CALCULATION OF ANNUAL ACTIVE ENERGY LOSS IN A DISTRIBUTION NETWORK WITH A WIND POWER PLANT CONNECTED 4.1 Ulazni parametri Za toëan proraëun godiπnjih gubitaka radne energije u istom primjeru iz prethodnog poglavlja potrebno je poznavati: 4.1 Input parameters For the precise calculation of annual active energy losses in the same example from the previous chapter, it is necessary to know the following: kronoloπku krivulju optereêenja TS 30/10 kv Primoπten i TS 30/10 kv Rogoznica, tj. satne potroπnje u razdoblju od 1 godine, kronoloπku krivulju proizvodnje VE Orlice, tj. satne proizvodnje u razdoblju od 1 godine. the chronological load curve of the 30/10 kv Primoπten and 30/10 kv Rogoznica subtations, i.e. hourly loads during a 1-year period, the chronological generation curve of the Orlice WPP, i.e. hourly generation during a 1-year period. S obzirom da za promatranu mreæu nije bila dostupna kronoloπka krivulja potroπnje, koriπteni su izmjereni podaci iz druge TS 35/10 kv (prosjeëna satna optereêenja), normirani po vrπnoj snazi na poznato vrπno optereêenje DV 30 kv Bilice Primoπten Rogoznica. Jalova snaga potroπaëa pretpostavljena je proporcionalna radnoj, uz konstantan faktor snage cos = 0,95. Za simulaciju proizvodnje VE Orlice nisu koriπteni podaci o brzinama vjetra s lokacije Orlice, veê su koriπteni izmjereni jednogodiπnji podaci s druge lokacije (brzina vjetra usrednjena na satne intervale). Zbog toga se izraëunati parametri ne mogu direktno primijeniti na promatranu mreæu i vjetroelektranu, veê samo kao ilustracija opisane metodologije. Since a chronological load curve was not available for the network considered, measured data (average hourly loads) from another 35/10 kv substation were used, normalized according to peak power for the known peak load of the 30 kv Bilice-Primoπten- Rogoznica line. The reactive power loads were assumed to be proportional to the active power loads, with a constant power factor of cos = 0,95. For the simulation of the Orlice WPP generation, wind speed data from the Orlice location were not used. Instead, data measured for one year from another location were employed (wind speed averaged at hourly intervals). Therefore, the calculation parameters cannot be applied directly to the considered network and wind power plant but only as an illustration of the described methodology. GoiÊ, R., Jakus, D., MudniÊ, E., ProraËun godišnjih gubitaka radne energije, Energija, god. 56(2007), br. 6., str
16 Kronoloπka krivulja proizvodnje VE Orlice slijedi iz kronoloπke krivulje brzina vjetra i P-v karakteristike vjetroagregata Enercon E-44 koji je pretpostavljen za VE Orlice. Radi se o sinkronom generatoru nazivne snage 900 kw, s direktnim pogonom i indirektnim prikljuëkom na mreæu (preko pretvaraëa). U proraëunu je pretpostavljena jednaka brzina vjetra na svih 11 lokacija vjetroagregata, te reæim potpune kompenzacije jalove snage vjetrogeneratora VE Orlice (cos = 1). Da bi se reducirala potreba za izvoappleenjem proraëuna tokova snaga na razumnu mjeru, proraëun je izveden pomoêu krivulje trajanja potroπnje i krivulje trajanja proizvodnje VE Orlice, aproksimacijom krivulja na manji broj segmenata konstantne snage. Meappleutim, istodobnost distribucijske potroπnje i proizvodnje VE Orlice nije na taj naëin izgubljena, veê je modelirana izdvojeno zasebnim proraëunom koji Êe naknadno biti opisan. Godiπnja krivulja trajanja potroπnje formirana je na osnovi kronoloπke krivulje potroπnje, te je segmentirana na 8 diskretnih iznosa snaga u rasponu od 30 % do 100 % vrπnog optereêenja s korakom 10 % (slika 7). Pri tome svaki segment koji je predstavljen snagom P i reprezentira (aproksimira) snage u rasponu P i - 5%P peak P i P i + 5%P peak. Sa P peak oznaëena je snaga koja odgovara prvom segmentu i neπto je manja od stvarnog maksimalnog optereêenja. The chronological generation curve of the Orlice WPP is derived from the chronological wind speed curve and P-v curve of the Enercon E-44 Wind Generator, which is assumed for the Orlice WPP. This is a synchronous generator with a rated power of 900 kw, direct drive and an indirect network connection using a converter. In the calculation, a uniform wind speed was assumed for all 11 wind generator locations, and the reactive power of the Orlice WPP was fully compensated (cos = 1). In order to reduce the necessary load-flow calculations to a reasonable number, calculation was performed using the load duration curve and the generation duration curve of the Orlice WPP, with an approximated curve for a smaller number of segments with constant power. However, the coincidence of the distribution consumption and generation of the Orlice WPP was not lost in this manner but modeled separately by a calculation that will be described subsequently. The annual load duration curve is formed on the basis of the chronological load curve and segmented into 8 discrete parts with constant power, ranging from 30 % to 100 % of the peak load, with a 10 % increment (Figure 7). Moreover, each segment designated by power P i represents (approximates) power in the range of P i - 5%P peak P i P i + 5%P peak. P peak stands for power that corresponds to the first segment and is somewhat lower than the existing maximum load. Potrošnja / Load (%) Slika 7 Aproksimacija krivulje trajanja potroπnje Figure 7 Approximated load duration curve Vrijeme / Time (h) Godiπnja krivulja trajanja proizvodnje VE Orlice takoappleer je formirana na osnovi kronoloπke krivulje trajanja proizvodnje izraëunate preko kronoloπke krivulje brzine vjetra i P-v krivulje odabranog vjetroagregata, a segmentirana je na 11 diskretnih iznosa snaga pojedinaënog vjetroagregata u rasponu od 0 do 900 x 11 kw uz korak 90 x 11 The annual generation duration curve of the Orlice WPP is also formed on the basis of the chronological generation curve calculated using the chronological wind speed curve and the P-v curves of the selected wind turbine, and segmented into 11 discrete power units of an individual wind power plant ranging from 0 to 900 x 11 kw, with an increment 691 GoiÊ, R., Jakus, D., MudniÊ, E., ProraËun godišnjih gubitaka radne energije, Energija, god. 56(2007), br. 6., str
TEORIJA SKUPOVA Zadaci
 TEORIJA SKUPOVA Zadai LOGIKA 1 I. godina 1. Zapišite simbolima: ( x nije element skupa S (b) d je član skupa S () F je podskup slupa S (d) Skup S sadrži skup R 2. Neka je S { x;2x 6} = = i neka je b =
MONTHLY REPORT ON WIND POWER PLANT GENERATION IN CROATIA
 Hrvatski operator prijenosnog sustava d.o.o. MJESEČNI IZVJEŠTAJ O PROIZVODNJI VJETROELEKTRANA U HRVATSKOJ MONTHLY REPORT ON WIND POWER PLANT GENERATION IN CROATIA Listopad/October 2017 Monthly report on
NAPREDNI FIZIČKI PRAKTIKUM 1 studij Matematika i fizika; smjer nastavnički MJERENJE MALIH OTPORA
 NAPREDNI FIZIČKI PRAKTIKUM 1 studij Matematika i fizika; smjer nastavnički MJERENJE MALIH OTPORA studij Matematika i fizika; smjer nastavnički NFP 1 1 ZADACI 1. Mjerenjem geometrijskih dimenzija i otpora
Mjerenje snage. Na kraju sata student treba biti u stanju: Spojevi za jednofazno izmjenično mjerenje snage. Ak. god. 2008/2009
 Mjerenje snae Ak. od. 008/009 1 Na kraju sata student treba biti u stanju: Opisati i analizirati metode mjerenja snae na niskim i visokim frekvencijama Odabrati optimalnu metodu mjerenja snae Analizirati
IMPACT OF PV POWER PLANTS ON THE VOLTAGE CONDITIONS AND POWER SYSTEM LOSSES IN MV DISTRIBUTION NETWORK
 HRVATSKI OGRANAK MEĐUNARODNE ELEKTRODISTRIBUCIJSKE KONFERENCIJE - HO CIRED 4. (0.) savjeovanje Trogir/Sege Donji,. - 4. svibnja 204. SO2 07 Doc dr. sc. Damir Jakus, dipl.ing Fakule elekroehnike, srojarsva
Metode praćenja planova
 Metode praćenja planova Klasična metoda praćenja Suvremene metode praćenja gantogram mrežni dijagram Metoda vrednovanja funkcionalnosti sustava Gantogram VREMENSKO TRAJANJE AKTIVNOSTI A K T I V N O S T
Uvod u relacione baze podataka
 Uvod u relacione baze podataka Ana Spasić 2. čas 1 Mala studentska baza dosije (indeks, ime, prezime, datum rodjenja, mesto rodjenja, datum upisa) predmet (id predmeta, sifra, naziv, bodovi) ispitni rok
Red veze za benzen. Slika 1.
 Red veze za benzen Benzen C 6 H 6 je aromatično ciklično jedinjenje. Njegove dve rezonantne forme (ili Kekuléove structure), prema teoriji valentne veze (VB) prikazuju se uobičajeno kao na slici 1 a),
PowerApps Optimal Power Flow Formulation
 PowerApps Optimal Power Flow Formulation Page1 Table of Contents 1 OPF Problem Statement... 3 1.1 Vector u... 3 1.1.1 Costs Associated with Vector [u] for Economic Dispatch... 4 1.1.2 Costs Associated
Algoritam za množenje ulančanih matrica. Alen Kosanović Prirodoslovno-matematički fakultet Matematički odsjek
 Algoritam za množenje ulančanih matrica Alen Kosanović Prirodoslovno-matematički fakultet Matematički odsjek O problemu (1) Neka je A 1, A 2,, A n niz ulančanih matrica duljine n N, gdje su dimenzije matrice
Harmonic Modeling of Networks
 Harmonic Modeling of Networks Thomas H. Ortmeyer ECE Dept. Clarkson University Potsdam, NY 13699-5720 M. Fayyaz Akram Dept. of Elec. Eng. Univ. of Engineering and Technology Lahore, Pakistan Takashi Hiyama
METODE ZA IDENTIFIKACIJU PARAMETARA ASINKRONOG MOTORA
 Sveučilište u Zagrebu Fakultet elektrotehnike i računarstva Tin Bariša METODE ZA IDENTIFIKACIJU PARAMETARA ASINKRONOG MOTORA Zagreb, travanj 2014. Ovaj rad izraďen je u Laboratoriju za upravljanje elektromotornim
Optimizacija Niza Čerenkovljevih teleskopa (CTA) pomoću Monte Carlo simulacija
 pomoću Monte Carlo simulacija") 1 / 21 Optimizacija Niza Čerenkovljevih teleskopa (CTA) pomoću Monte Carlo simulacija Mario Petričević Fizički odsjek, PMF Sveučilište u Zagrebu 30. siječnja 2016. 2 / 21 Izvori Spektar Detekcija Gama-astronomija
1 / 21 Optimizacija Niza Čerenkovljevih teleskopa (CTA) pomoću Monte Carlo simulacija Mario Petričević Fizički odsjek, PMF Sveučilište u Zagrebu 30. siječnja 2016. 2 / 21 Izvori Spektar Detekcija Gama-astronomija
Power Factor Correction Capacitors Low Voltage
 Capacitors Zadružna c. 33, 8340 Črnomelj, Slovenija Tel.: (+386) (0)7 356 92 60 Fax: (+386) (0)7 356 92 61 GSM (+386) (0)41 691 469 e-mail: slovadria@siol.net Power Factor Correction Capacitors Low Voltage
EE 6501 POWER SYSTEMS UNIT I INTRODUCTION
 EE 6501 POWER SYSTEMS UNIT I INTRODUCTION PART A (2 MARKS) 1. What is single line diagram? A Single line diagram is diagrammatic representation of power system in which the components are represented by
METODE ZA IZBOR OPTIMALNE VELIČINE I LOKACIJE UGRADNJE KOMPENZACIJSKIH UREĐAJA
 ETODE ZA IZBOR OPTIAL ELIČI I LOKACIJE UGRADJE KOPEZACIJSKIH UREĐAJA Prof. dr. sc. atislav ajstrović, r. sc. Goran ajstrović, r. sc. Davor Bajs, Zagreb U članku se prezentira matematički model za određivanje
Chapter 3 AUTOMATIC VOLTAGE CONTROL
 Chapter 3 AUTOMATIC VOLTAGE CONTROL . INTRODUCTION TO EXCITATION SYSTEM The basic function of an excitation system is to provide direct current to the field winding of the synchronous generator. The excitation
EE 451 Power System Stability
 EE 451 Power System Stability Power system operates in synchronous mode Power system is subjected to a wide range of disturbances (small and large) - Loads and generation changes - Network changes - Faults
SHORT QUESTIONS AND ANSWERS. Year/ Semester/ Class : III/ V/ EEE Academic Year: Subject Code/ Name: EE6501/ Power System Analysis
 Srividya colllege of Engg & Tech,Virudhunagar Sri Vidya College of Engineering And Technology Virudhunagar 626 005 Department of Electrical and Electronics Engineering QUESTION BANK SHORT QUESTIONS AND
B.E. / B.Tech. Degree Examination, April / May 2010 Sixth Semester. Electrical and Electronics Engineering. EE 1352 Power System Analysis
 B.E. / B.Tech. Degree Examination, April / May 2010 Sixth Semester Electrical and Electronics Engineering EE 1352 Power System Analysis (Regulation 2008) Time: Three hours Answer all questions Part A (10
REGULACIJA NAPONA I JALOVE SNAGE U ELEKTROENERGETSKOM SUSTAVU SA PRIKLJUČENIM VJETROELEKTRANAMA
 SVEUČILIŠTE JOSIPA JURJA STROSSMAYERA U OSIJEKU FAKULTET ELEKTROTEHNIKE, RAČUNARSTVA I INFORMACIJSKIH TEHNOLOGIJA Sveučilišni studij REGULACIJA NAPONA I JALOVE SNAGE U ELEKTROENERGETSKOM SUSTAVU SA PRIKLJUČENIM
PRIPADNOST RJEŠENJA KVADRATNE JEDNAČINE DANOM INTERVALU
 MAT KOL Banja Luka) ISSN 0354 6969 p) ISSN 1986 58 o) Vol. XXI )015) 105 115 http://www.imvibl.org/dmbl/dmbl.htm PRIPADNOST RJEŠENJA KVADRATNE JEDNAČINE DANOM INTERVALU Bernadin Ibrahimpašić 1 Senka Ibrahimpašić
CHAPTER 2 LOAD FLOW ANALYSIS FOR RADIAL DISTRIBUTION SYSTEM
 16 CHAPTER 2 LOAD FLOW ANALYSIS FOR RADIAL DISTRIBUTION SYSTEM 2.1 INTRODUCTION Load flow analysis of power system network is used to determine the steady state solution for a given set of bus loading
Projektovanje paralelnih algoritama II
 Projektovanje paralelnih algoritama II Primeri paralelnih algoritama, I deo Paralelni algoritmi za množenje matrica 1 Algoritmi za množenje matrica Ovde su data tri paralelna algoritma: Direktan algoritam
Chapter 8: Unsymmetrical Faults
 Chapter 8: Unsymmetrical Faults Introduction The sequence circuits and the sequence networks developed in the previous chapter will now be used for finding out fault current during unsymmetrical faults.
AIR CURTAINS VAZDU[NE ZAVESE V H
 AIR CURTAINS V 15.000 H 21.000 KLIMA Co. 2 KLIMA Co. Flow and system stress should be known factors in air flow. The flow is gas quantity flowing through the system during given time unit and is measured
EE5250 TERM PROJECT. Report by: Akarsh Sheilendranath
 EE5250 TERM PROJECT Analytical Approaches for Optimal Placement of Distributed Generation Sources in Power System Caisheng Wang, student member, IEEE, and M. Hashem Nehrir, senior member, IEEE Report by:
International Studies about the Grid Integration of Wind Generation
 International Studies about the Grid Integration of Wind Generation Dr.-Ing. Markus Pöller/DIgSILENT GmbH Internation Studies About Grid Integration of Wind Generation Grid Integration of Wind Generationin
EE2351 POWER SYSTEM OPERATION AND CONTROL UNIT I THE POWER SYSTEM AN OVERVIEW AND MODELLING PART A
 EE2351 POWER SYSTEM OPERATION AND CONTROL UNIT I THE POWER SYSTEM AN OVERVIEW AND MODELLING PART A 1. What are the advantages of an inter connected system? The advantages of an inter-connected system are
EE 742 Chapter 3: Power System in the Steady State. Y. Baghzouz
 EE 742 Chapter 3: Power System in the Steady State Y. Baghzouz Transmission Line Model Distributed Parameter Model: Terminal Voltage/Current Relations: Characteristic impedance: Propagation constant: π
Fault Calculation Methods
 ELEC9713 Industrial and Commercial Power Systems Fault Calculation Methods There are two major problems that can occur in electrical systems: these are open circuits and short circuits. Of the two, the
Transmission and Distribution of Electrical Power
 KINGDOM OF SAUDI ARABIA Ministry Of High Education Umm Al-Qura University College of Engineering & Islamic Architecture Department Of Electrical Engineering Transmission and Distribution of Electrical
APPLICATION OF FUZZY LOGIC FOR REACTIVE POWER COMPENSATION BY SYNCHRONOUS MOTORS WITH VARIABLE LOAD
 M. Stojkov et al. Primjena neizrazite logike za kompenzaciju reaktivne energije sinkronim motorima s promjenjivim opterećenjem APPLICATION OF FUZZY LOGIC FOR REACTIVE POWER COMPENSATION BY SYNCHRONOUS
Power System Analysis Prof. A. K. Sinha Department of Electrical Engineering Indian Institute of Technology, Kharagpur
 Power System Analysis Prof. A. K. Sinha Department of Electrical Engineering Indian Institute of Technology, Kharagpur Lecture - 9 Transmission Line Steady State Operation Welcome to lesson 9, in Power
KINGS COLLEGE OF ENGINEERING Punalkulam
 KINGS COLLEGE OF ENGINEERING Punalkulam 613 303 DEPARTMENT OF ELECTRICAL AND ELECTRONICS ENGINEERING POWER SYSTEM ANALYSIS QUESTION BANK UNIT I THE POWER SYSTEM AN OVERVIEW AND MODELLING PART A (TWO MARK
Rešenja zadataka za vežbu na relacionoj algebri i relacionom računu
 Rešenja zadataka za vežbu na relacionoj algebri i relacionom računu 1. Izdvojiti ime i prezime studenata koji su rođeni u Beogradu. (DOSIJE WHERE MESTO_RODJENJA='Beograd')[IME, PREZIME] where mesto_rodjenja='beograd'
NAPREDNI FIZIČKI PRAKTIKUM II studij Geofizika POLARIZACIJA SVJETLOSTI
 NAPREDNI FIZIČKI PRAKTIKUM II studij Geofizika POLARIZACIJA SVJETLOSTI studij Geofizika NFP II 1 ZADACI 1. Izmjerite ovisnost intenziteta linearno polarizirane svjetlosti o kutu jednog analizatora. Na
NADOMJESNI MODELI ENERGETSKIH TRANSFORMATORA
 SVEUČILIŠTE U RIJECI TEHNIČKI FAKULTET Preddiplomski stručni studij elektrotehnike Završni rad NADOMJESNI MODELI ENERGETSKIH TRANSFORMATORA Rijeka, rujan, 2016. Andrija Pečarić 0069050815 SVEUČILIŠTE U
SSC-JE EE POWER SYSTEMS: GENERATION, TRANSMISSION & DISTRIBUTION SSC-JE STAFF SELECTION COMMISSION ELECTRICAL ENGINEERING STUDY MATERIAL
 1 SSC-JE STAFF SELECTION COMMISSION ELECTRICAL ENGINEERING STUDY MATERIAL Power Systems: Generation, Transmission and Distribution Power Systems: Generation, Transmission and Distribution Power Systems:
THE UNIVERSITY OF NEW SOUTH WALES. School of Electrical Engineering & Telecommunications FINALEXAMINATION. Session
 Name: Student ID: Signature: THE UNIVERSITY OF NEW SOUTH WALES School of Electrical Engineering & Telecommunications FINALEXAMINATION Session 00 ELEC46 Power System Analysis TIME ALLOWED: 3 hours TOTAL
KLASIFIKACIJA NAIVNI BAJES. NIKOLA MILIKIĆ URL:
 KLASIFIKACIJA NAIVNI BAJES NIKOLA MILIKIĆ EMAIL: nikola.milikic@fon.bg.ac.rs URL: http://nikola.milikic.info ŠTA JE KLASIFIKACIJA? Zadatak određivanja klase kojoj neka instanca pripada instanca je opisana
On the relation between Zenkevich and Wiener indices of alkanes
 J.Serb.Chem.Soc. 69(4)265 271(2004) UDC 547.21:54 12+539.6 JSCS 3152 Original scientific paper On the relation between Zenkevich and Wiener indices of alkanes IVAN GUTMAN a*, BORIS FURTULA a, BILJANA ARSI]
Energy saving in electromechanical equipment with power coefficient correction. Dimitris Al. Katsaprakakis Aeolian Land S.A.
 Energy saving in electromechanical equipment with power coefficient correction Dimitris Al. Katsaprakakis Aeolian Land S.A. www.aiolikigi.gr Introduction Electricity production companies (utilities) provide
UTICAJ KRIVE SNAGE VETROGENERATORA NA TEHNO-EKONOMSKE POKAZATELJE SISTEMA ZA NAPAJANJE POTROŠAČA MALE SNAGE
 UTICAJ KRIVE SNAGE VETROGENERATORA NA TEHNO-EKONOMSKE POKAZATELJE SISTEMA ZA NAPAJANJE POTROŠAČA MALE SNAGE Vukman Bakić *, and Saša Stojković ** * University of Belgrade, Institute Vinča, Laboratory for
DYNAMIC RESPONSE OF A GROUP OF SYNCHRONOUS GENERATORS FOLLOWING DISTURBANCES IN DISTRIBUTION GRID
 Engineering Review Vol. 36 Issue 2 8-86 206. 8 DYNAMIC RESPONSE OF A GROUP OF SYNCHRONOUS GENERATORS FOLLOWING DISTURBANCES IN DISTRIBUTION GRID Samir Avdaković * Alija Jusić 2 BiH Electrical Utility Company
Mathcad sa algoritmima
 P R I M J E R I P R I M J E R I Mathcad sa algoritmima NAREDBE - elementarne obrade - sekvence Primjer 1 Napraviti algoritam za sabiranje dva broja. NAREDBE - elementarne obrade - sekvence Primjer 1 POČETAK
FTN Novi Sad Katedra za motore i vozila. Drumska vozila Uputstvo za izradu vučnog proračuna motornog vozila. 1. Ulazni podaci IZVOR:
 1. Ulazni podaci IZVOR: WWW.CARTODAY.COM 1. Ulazni podaci Masa / težina vozila Osovinske reakcije Raspodela težine napred / nazad Dimenzije pneumatika Čeona površina Koeficijent otpora vazduha Brzinska
APPROPRIATENESS OF GENETIC ALGORITHM USE FOR DISASSEMBLY SEQUENCE OPTIMIZATION
 JPE (2015) Vol.18 (2) Šebo, J. Original Scientific Paper APPROPRIATENESS OF GENETIC ALGORITHM USE FOR DISASSEMBLY SEQUENCE OPTIMIZATION Received: 17 July 2015 / Accepted: 25 Septembre 2015 Abstract: One
Incorporation of Asynchronous Generators as PQ Model in Load Flow Analysis for Power Systems with Wind Generation
 Incorporation of Asynchronous Generators as PQ Model in Load Flow Analysis for Power Systems with Wind Generation James Ranjith Kumar. R, Member, IEEE, Amit Jain, Member, IEEE, Power Systems Division,
J. Electrical Systems x-x (2010): x-xx. Regular paper
: x-xx. Regular paper") JBV Subrahmanyam Radhakrishna.C J. Electrical Systems x-x (2010): x-xx Regular paper A novel approach for Optimal Capacitor location and sizing in Unbalanced Radial Distribution Network for loss minimization
JBV Subrahmanyam Radhakrishna.C J. Electrical Systems x-x (2010): x-xx Regular paper A novel approach for Optimal Capacitor location and sizing in Unbalanced Radial Distribution Network for loss minimization
OPTIMAL CAPACITOR PLACEMENT USING FUZZY LOGIC
 CHAPTER - 5 OPTIMAL CAPACITOR PLACEMENT USING FUZZY LOGIC 5.1 INTRODUCTION The power supplied from electrical distribution system is composed of both active and reactive components. Overhead lines, transformers
GENERATOR INTERCONNECTION APPLICATION
 GENERATOR INTERCONNECTION APPLICATION FOR BUY-ALL/SELL-ALL PROJECTS WITH AGGREGATE GENERATOR OUTPUT OF MORE THAN 20 KW BUT LESS THAN OR EQUAL TO 1 MW Electric Utility Contact Information Great Lakes Energy
Module 3 : Sequence Components and Fault Analysis
 Module 3 : Sequence Components and Fault Analysis Lecture 12 : Sequence Modeling of Power Apparatus Objectives In this lecture we will discuss Per unit calculation and its advantages. Modeling aspects
The Prediction of. Key words: LD converter, slopping, acoustic pressure, Fourier transformation, prediction, evaluation
 K. Kostúr, J. et Futó al.: The Prediction of Metal Slopping in LD Coerter on Base an Acoustic ISSN 0543-5846... METABK 45 (2) 97-101 (2006) UDC - UDK 669.184.224.66:534.6=111 The Prediction of Metal Slopping
Optimal Capacitor Placement and Sizing on Radial Distribution System by using Fuzzy Expert System
 274 Optimal Placement and Sizing on Radial Distribution System by using Fuzzy Expert System T. Ananthapadmanabha, K. Parthasarathy, K.Nagaraju, G.V. Venkatachalam Abstract:--This paper presents a mathematical
Transformatori. 10/2 Uvod. Jednofazni transformatori. Sigurnosni, rastavni, upravlja ki i
 Transformatori /2 Uvod Jednofazni transformatori Sigurnosni, rastavni, upravlja ki i mrežni transformatori 4AM, 4AT /4 Sigurnosni (mrežni transformatori) i upravlja ki transformatori 4AM /5 Rastavni, upravlja
ELECTRIC POWER CIRCUITS BASIC CONCEPTS AND ANALYSIS
 Contents ELEC46 Power ystem Analysis Lecture ELECTRC POWER CRCUT BAC CONCEPT AND ANALY. Circuit analysis. Phasors. Power in single phase circuits 4. Three phase () circuits 5. Power in circuits 6. ingle
Termodinamika. FIZIKA PSS-GRAD 29. studenog Copyright 2015 John Wiley & Sons, Inc. All rights reserved.
 Termodinamika FIZIKA PSS-GRAD 29. studenog 2017. 15.1 Thermodynamic Systems and Their Surroundings Thermodynamics is the branch of physics that is built upon the fundamental laws that heat and work obey.
PROPOSED STRATEGY FOR CAPACITOR ALLOCATION IN RADIAL DISTRIBUTION FEEDERS
 IMPACT: International ournal of Research in Engineering & Technology (IMPACT: IRET) ISSN 2321-8843 Vol. 1, Issue 3, Aug 2013, 85-92 Impact ournals PROPOSED STRATEGY FOR CAPACITOR ALLOCATION IN RADIAL DISTRIBUTION
Metode izračunavanja determinanti matrica n-tog reda
 Osječki matematički list 10(2010), 31 42 31 STUDENTSKA RUBRIKA Metode izračunavanja determinanti matrica n-tog reda Damira Keček Sažetak U članku su opisane metode izračunavanja determinanti matrica n-tog
MATHEMATICAL ANALYSIS OF PERFORMANCE OF A VIBRATORY BOWL FEEDER FOR FEEDING BOTTLE CAPS
 http://doi.org/10.24867/jpe-2018-02-055 JPE (2018) Vol.21 (2) Choudhary, M., Narang, R., Khanna, P. Original Scientific Paper MATHEMATICAL ANALYSIS OF PERFORMANCE OF A VIBRATORY BOWL FEEDER FOR FEEDING
INSTITUTE OF AERONAUTICAL ENGINEERING (Autonomous)
") INSTITUTE OF AERONAUTICAL ENGINEERING (Autonomous) Dundigal, Hyderabad - 500 043 ELECTRICAL AND ELECTRONICS ENGINEERING QUESTION BANK Course Name : Computer Methods in Power Systems Course Code : A60222
INSTITUTE OF AERONAUTICAL ENGINEERING (Autonomous) Dundigal, Hyderabad - 500 043 ELECTRICAL AND ELECTRONICS ENGINEERING QUESTION BANK Course Name : Computer Methods in Power Systems Course Code : A60222
Performance Improvement of the Radial Distribution System by using Switched Capacitor Banks
 Int. J. on Recent Trends in Engineering and Technology, Vol. 10, No. 2, Jan 2014 Performance Improvement of the Radial Distribution System by using Switched Capacitor Banks M. Arjun Yadav 1, D. Srikanth
5 th INTERNATIONAL CONFERENCE Contemporary achievements in civil engineering 21. April Subotica, SERBIA
 5 th INTERNATIONAL CONFERENCE Contemporary achievements in civil engineering 21. April 2017. Subotica, SERBIA COMPUTER SIMULATION OF THE ORDER FREQUENCIES AMPLITUDES EXCITATION ON RESPONSE DYNAMIC 1D MODELS
CHAPTER 6 STEADY-STATE ANALYSIS OF SINGLE-PHASE SELF-EXCITED INDUCTION GENERATORS
 79 CHAPTER 6 STEADY-STATE ANALYSIS OF SINGLE-PHASE SELF-EXCITED INDUCTION GENERATORS 6.. INTRODUCTION The steady-state analysis of six-phase and three-phase self-excited induction generators has been presented
Asset Life and pricing the use of infrastructure: the case of Electricity Transmission in Chile
 Asset Life and pricing the use of infrastructure: the case of Electricity Transmission in Chile USAEE - IAEE Houston - Texas 17-19 September 2007 Ricardo Raineri rraineri@ing.puc.cl / www.ricardoraineri.com
Optimal Placement & sizing of Distributed Generator (DG)
") Chapter - 5 Optimal Placement & sizing of Distributed Generator (DG) - A Single Objective Approach CHAPTER - 5 Distributed Generation (DG) for Power Loss Minimization 5. Introduction Distributed generators
Chapter - 5 Optimal Placement & sizing of Distributed Generator (DG) - A Single Objective Approach CHAPTER - 5 Distributed Generation (DG) for Power Loss Minimization 5. Introduction Distributed generators
DEPARTMENT OF ELECTRICAL AND ELECTRONICS ENGINEERING QUESTION BANK
 DEPARTMENT OF ELECTRICAL AND ELECTRONICS ENGINEERING QUESTION BANK SUBJECT CODE & NAME: EE 2303 - TRANSMISSION & DISTRIBUTION YEAR / SEM: III/V UNIT-I TRANSMISSION SYSTEM INTRODUCTION PART-A 1. What is
Zavisnost gubitaka snage turbogeneratora od reaktivnih opterećenja
 Stručni rad UDK: 61.313.1:61.3.017 BIBLID:0350-858(011),1.p.1-0 Zavisnost gubitaka snage turbogeneratora od reaktivnih opterećenja Miloje.M. Kostić, Branka B.Kostić, Igor Belić, Nikola Georgijević Elektrotehnički
STATISTICAL ANALYSIS OF WET AND DRY SPELLS IN CROATIA BY THE BINARY DARMA (1,1) MODEL
 MODEL") Hrvatski meteoroloπki Ëasopis Croatian Meteorological Journal, 4, 2006., 43 5. UDK: 55.577.22 Stručni rad STATISTICAL ANALYSIS OF WET AND DRY SPELLS IN CROATIA BY THE BINARY DARMA (,) MODEL Statistička
Hrvatski meteoroloπki Ëasopis Croatian Meteorological Journal, 4, 2006., 43 5. UDK: 55.577.22 Stručni rad STATISTICAL ANALYSIS OF WET AND DRY SPELLS IN CROATIA BY THE BINARY DARMA (,) MODEL Statistička
Modeling of Power System Components During Electromagnetic Transients
 Modeling of Power System Components During Electromagnetic Transients 1 Paweł Sowa, 2 Rafał Kumala and 3 Katarzyna Łuszcz 1, 2,3 Faculty of Electrical Engineering, Silesian University of Technology/ Institute
Tutorial 2: Modelling Transmission
 Tutorial 2: Modelling Transmission In our previous example the load and generation were at the same bus. In this tutorial we will see how to model the transmission of power from one bus to another. The
International Workshop on Wind Energy Development Cairo, Egypt. ERCOT Wind Experience
 International Workshop on Wind Energy Development Cairo, Egypt ERCOT Wind Experience March 22, 21 Joel Mickey Direcr of Grid Operations Electric Reliability Council of Texas jmickey@ercot.com ERCOT 2 2
The influence of thermal properties on power transmission characteristics of HVDC cables a factor analysis
 The influence of thermal properties on power transmission characteristics of HVDC cables a factor analysis Björn Sonerud, Wendy Loyens Borealis B bstract Power transmission capacity of HVDC cable links
Slika 1. Slika 2. Da ne bismo stalno izbacivali elemente iz skupa, mi ćemo napraviti još jedan niz markirano, gde će
 Permutacije Zadatak. U vreći se nalazi n loptica različitih boja. Iz vreće izvlačimo redom jednu po jednu lopticu i stavljamo jednu pored druge. Koliko različitih redosleda boja možemo da dobijemo? Primer
RELIABILITY OF GLULAM BEAMS SUBJECTED TO BENDING POUZDANOST LIJEPLJENIH LAMELIRANIH NOSAČA NA SAVIJANJE
 RELIABILITY OF GLULAM BEAMS SUBJECTED TO BENDING Mario Jeleč Josip Juraj Strossmayer University of Osijek, Faculty of Civil Engineering Osijek, mag.ing.aedif. Corresponding author: mjelec@gfos.hr Damir
Basics of Electric Circuits
 António Dente Célia de Jesus February 2014 1 Alternating Current Circuits 1.1 Using Phasors There are practical and economic reasons justifying that electrical generators produce emf with alternating and
ECE 325 Electric Energy System Components 7- Synchronous Machines. Instructor: Kai Sun Fall 2015
 ECE 325 Electric Energy System Components 7- Synchronous Machines Instructor: Kai Sun Fall 2015 1 Content (Materials are from Chapters 16-17) Synchronous Generators Synchronous Motors 2 Synchronous Generators
POWER SYSTEM STABILITY
 LESSON SUMMARY-1:- POWER SYSTEM STABILITY 1. Introduction 2. Classification of Power System Stability 3. Dynamic Equation of Synchronous Machine Power system stability involves the study of the dynamics
FORECAST ACCURACY REPORT 2017 FOR THE 2016 NATIONAL ELECTRICITY FORECASTING REPORT
 FORECAST ACCURACY REPORT 2017 FOR THE 2016 NATIONAL ELECTRICITY FORECASTING REPORT Published: November 2017 Purpose The National Electricity Rules (Rules) require AEMO to report to the Reliability Panel
Battery Energy Storage
 Battery Energy Storage Implications for Load Shapes and Forecasting April 28, 2017 TOPICS» What is Energy Storage» Storage Market, Costs, Regulatory Background» Behind the Meter (BTM) Battery Storage Where
EE2351 POWER SYSTEM ANALYSIS UNIT I: INTRODUCTION
 EE2351 POWER SYSTEM ANALYSIS UNIT I: INTRODUCTION PART: A 1. Define per unit value of an electrical quantity. Write equation for base impedance with respect to 3-phase system. 2. What is bus admittance
ECEN 460 Exam 1 Fall 2018
 ECEN 460 Exam 1 Fall 2018 Name: KEY UIN: Section: Score: Part 1 / 40 Part 2 / 0 Part / 0 Total / 100 This exam is 75 minutes, closed-book, closed-notes. A standard calculator and one 8.5 x11 note sheet
PROPOSAL FOR ADDITION OF IEC 34-4 STANDARD IN PART FOR DETERMINATION OF POTIER REACTANCE
 PROPOSAL FOR ADDITION OF IEC 34-4 STANDARD IN PART FOR DETERMINATION OF POTIER REACTANCE M. M. Kostic * Electrical Engeneering Institute Nikola Tesla, Belgrade, SERBIA* Abstract: On the base of ones investigations
Generation, transmission and distribution, as well as power supplied to industrial and commercial customers uses a 3 phase system.
 Three-phase Circuits Generation, transmission and distribution, as well as power supplied to industrial and commercial customers uses a 3 phase system. Where 3 voltages are supplied of equal magnitude,
RACIONALIZACIJA SOPSTVENE POTROŠNJE ELEKTRIČNE ENERGIJE U TERMOELEKTRANI "MORAVA"
 Stručni rad UDK: 621.311.22 : 621.3.17.8 BIBLID:35-8528(27),18.p. 69-84 RACIONALIZACIJA SOPSTVENE POTROŠNJE ELEKTRIČNE ENERGIJE U TERMOELEKTRANI "MORAVA" Ivan Stanisavljević, Vladimir Sovrlić, Miloje Kostić
Elevated Neutral to Earth Voltages Due to Harmonics A T&D Update
 Elevated Neutral to Earth Voltages Due to Harmonics A T&D Update E. R. (Randy) Collins, PhD, PE Dept. of Electrical and Computer Engineering Clemson University Clemson, South Carolina Stray Voltage Panel
Šime Šuljić. Funkcije. Zadavanje funkcije i područje definicije. š2004š 1
 Šime Šuljić Funkcije Zadavanje funkcije i područje definicije š2004š 1 Iz povijesti Dvojica Francuza, Pierre de Fermat i Rene Descartes, posebno su zadužila matematiku unijevši ideju koordinatne metode
1 Unified Power Flow Controller (UPFC)
") Power flow control with UPFC Rusejla Sadikovic Internal report 1 Unified Power Flow Controller (UPFC) The UPFC can provide simultaneous control of all basic power system parameters ( transmission voltage,
Power flow control with UPFC Rusejla Sadikovic Internal report 1 Unified Power Flow Controller (UPFC) The UPFC can provide simultaneous control of all basic power system parameters ( transmission voltage,
DESIGN AND CALCULATION OF RING SPRINGS AS SPRING ELEMENTS OF THE WAGON BUFFER UDC : Jovan Nešović
 FACTA UNIVERSITATIS Series: Mechanical Engineering Vol.1, N o 9, 2002, pp. 1127-1133 DESIGN AND CALCULATION OF RING SPRINGS AS SPRING ELEMENTS OF THE WAGON BUFFER UDC 62-272.43:623.435 Jovan Nešović Faculty
POWER SEMICONDUCTOR BASED ELECTRIC DRIVES
 POWER SEMICONDUCT BASED ELECTRIC DRIVES [Time: 3 Hrs] [Max. Marks: 80] Instructions: Solve any six questions from Q.No (1 or 2), Q.No (3 or 4), Q.No (5 or 6), Q.No (7 or 8), Q.No (9 or 10), Q.No (11 or
FIZIKALNA KOZMOLOGIJA VII. VRLO RANI SVEMIR & INFLACIJA
 FIZIKALNA KOZMOLOGIJA VII. VRLO RANI SVEMIR & INFLACIJA KOZMIČKI SAT ranog svemira Ekstra zračenje u mjerenju CMB Usporedba s rezultatima LEP-a Usporedba CMB i neutrina Vj.: Pozadinsko zračenje neutrina
Power Engineering II. Fundamental terms and definitions
 Fundamental terms and definitions Power engineering A scientific discipline that focuses on: Generation of electrical energy (EE) Transmission and distribution of EE Consumption of EE Power grid operation
SIMULACIJA PREKIDAČKO-RELUKTANTNOG MOTORA SWITCHED RELUCTANCE MOTOR SIMULATION
 Eng. Rev. 3-1 (21) 15-116 15 UDK 621.313.33:4.94 SIMULACIJA PREKIDAČKO-RELUKTANTNOG MOTORA SWITCHED RELUCTANCE MOTOR SIMULATION Livio ŠUŠNJIĆ Ivan MUŽIĆ Sažetak: U ovome je radu opisan način rada i primjene
Fajl koji je korišćen može se naći na
 Machine learning Tumačenje matrice konfuzije i podataka Fajl koji je korišćen može se naći na http://www.technologyforge.net/datasets/. Fajl se odnosi na pečurke (Edible mushrooms). Svaka instanca je definisana
Exercise Dr.-Ing. Abdalkarim Awad. Informatik 7 Rechnernetze und Kommunikationssysteme
 Exercise1 1.10.015 Informatik 7 Rechnernetze und Kommunikationssysteme Review of Phasors Goal of phasor analysis is to simplify the analysis of constant frequency ac systems v(t) = max cos(wt + q v ) i(t)
Two-Layer Network Equivalent for Electromagnetic Transients
 1328 IEEE TRANSACTIONS ON POWER DELIVERY, VOL. 18, NO. 4, OCTOBER 2003 Two-Layer Network Equivalent for Electromagnetic Transients Mohamed Abdel-Rahman, Member, IEEE, Adam Semlyen, Life Fellow, IEEE, and
TRANSMISSION LINES. All aluminum alloy conductor (AAAC) Aluminum conductor alloy reinforced (ACAR)
 Aluminum conductor alloy reinforced (ACAR)") TRANSMISSION LINES. Transmission Structures An overhead transmission line consists of conductor, insulators, support structures and in most cases shield wires. Overhead power transmission lines are classified
TRANSMISSION LINES. Transmission Structures An overhead transmission line consists of conductor, insulators, support structures and in most cases shield wires. Overhead power transmission lines are classified
Chapter 2 Direct Current Circuits
 Chapter 2 Direct Current Circuits 2.1 Introduction Nowadays, our lives are increasingly dependent upon the availability of devices that make extensive use of electric circuits. The knowledge of the electrical