NASA EARTH EXCHANGE (NEX)
|
|
|
- Candice Wells
- 5 years ago
- Views:
Transcription

1 NASA EARTH EXCHANGE (NEX) Enabling Interdisciplinary Research nex.nasa.gov Uttam Kumar and Ramakrishna Nemani NASA Ames Research Center, Moffett Field, CA.
2 The need for collaborative research - NEX


3 Massive data from multiple missions Scalable and diverse computing architectures Challenges: Data Volume Data Access Scalable Processing and Analytics Scalable Engagement Most data are not analysis-ready and processes are not well established
4 Need for an Earth Science Collaborative Earth science at NASA is a community effort (179 institutions in the US published 5 or more papers ( ) using MODIS data alone). 100s of investigators spend a majority of their time dealing with data. Redundant storage and processing facilities result in larger overall computing budgets. Moving data sets that are getting larger each year is expensive & time-consuming. Sharing knowledge (codes, intermediate results, workflows) is difficult.


5 NASA EARTH EXCHANGE (NEX) - OVERVIEW VISION To provide science as a service to the Earth science community addressing global environmental challenges GOAL To improve efficiency and expand the scope of NASA Earth science technology, research and applications programs + NEX is virtual collaborative that brings scientists together in a knowledge-based social network and provides the necessary tools, computing power, and access to big data to accelerate research, innovation and provide transparency.


6 NEX Provides a Complete Work Environment- Science As A Service COLLABORATION CENTRALIZED DATA REPOSITORY Over 400 Members Over 2.3 PB of Data COMPUTING Scalable Diverse Secure/Reliable KNOWLEDGE Workflows Model codes Re-useable software Machine Images


7 NEX Collaboration Tools Network and Share Outreach Collaborate Visualize


8 NEX Architecture at NASA Supercomputing Center NASA Users Non-NASA Users Authentication NEX Sandbox Limited computing, NEX science data access (1.9PB), local storage (300TB), NEX Science Platform Secure enclave Read-only data access NEX Core Science Datasets and storage MODIS, Sentinel, Landsat, NAIP, Climate, PB Read-write data access NEX Computing NASA Pleiades Supercomputer 200,000+ CPUs
9 NEX Resources Portal Web server Database server 503 registered members Sandbox 96-core server, 264GB memory, with 320 TB storage 48-core server, 128 GB, 163 TB storage HPC 720-core dedicated queue + access to rest of Pleiades 181 users/44 active 2.3 PB storage Models/Tools/Workflows used by NEX User Community GEOS-5 CESM WRF RegCM VIC BGC LPJ TOPS BEAMS Fmask LEDAPS METRIC Data (>2 PB) Landsat MODIS TRMM GRACE ICESAT CMIP5 NCEP MERRA NARR PRISM DAYMET NAIP Digital Globe NEX-DCP30 NEX-GDDP WELD NAFD-NEX


10 NEX Access View


11 ACCESS TO NEX COMPONENT ARCHITECTURE


12 OpenNEX A private public partnership NASA Private Cloud Restricted access NASA funded Focus on large-scale modeling and analysis Ideal for producing research quality/reproducible results Commercial Public Cloud Builds on NEX Open access User-funded Ideal for prototyping, exploration and community engagement
13 Classes on NEX Big Data Projects Fully distributed data processing with no inter-process dependencies Data sizes: 100TB 25PB Machine-learning and data-mining with some inter-process data dependencies Data sizes: 50TB 2PB Analytics and science applications Database query systems: 1 20TB Provenance and other graph queries 100 million up to 1 billion triples in 2017 Climate and ecosystem modeling Computationally intensive, time and space data dependent processing 2 20TB


14 Science at NEX Global Vegetation Biomass at 100m resolution by blending data from different satellites High resolution climate projections for climate impact studies High resolution monthly global data for monitoring forests, crops and water resources Mapping fallow area in California during drought Machine learning and Data mining moving towards more data-driven approaches


15 Regional multi-sensor analysis and anomaly detection Monitoring global drought July 2012 MODIS 1km NDVI anomaly Landsat Processing WELD, GIBS, NAFD, Landsat 8 Climate downscaling (NEX-DCP30) TRMM Precipitation Anomaly, 2012 NEX enables National Climate Assessment

16 Global Landsat processing MODISizing the Landsat Data Volumes: 1800TB For the first time in Landsat history of nearly 40 years, we can now process and create quantitative information about changes in global landscapes, in a matter of DAYS. Near real-time quantitative updates of information about global landscapes (Global WELD project with D. South Dakota State University) For monitoring crop growth, deforestation, and impacts of natural disasters


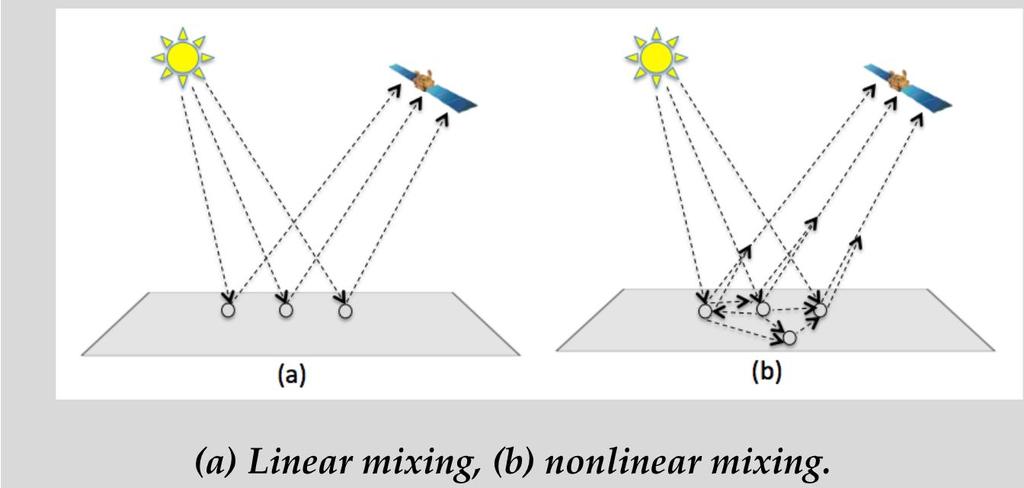
17 High Resolution Tree Cover Classification NAIP Processing Architecture NEX NEX HPC UPDATE TRAINING DATASET HPC M3 VOTING OUTPUT IMAGE INPUT IMAGE NEX HPC M1 HPC M2 HPC M1 HPC Module 1 HPC M2 HPC Module 2 HPC M3 HPC Module 3 NEX NEX HPC NASA Earth Exchange Storage NASA Earth Exchange High Performance Computing (HPC)


18 California Tree Cover Mosaic San Francisco Bay Area


19
20 NEX Summary Lowers the barrier of - locating data, reuse models, reuse codes, and compute resources. Why create your own if a similar analytics was done before? Allows knowledge sharing. Provides a framework for reproducible/verifiable results. Platform for prototyping or extending applications. Enabling broader community access through public-private partnerships.

21
22 Subpixel Learning Algorithms for Estimating Global Land Cover Fractions using High Performance Computing

23
 η n 1 n n 3 1 2 y Eα η n = 1, 2, 3 n( x, y) is a scalar value representing the functional coverage of endmember vector e n at pixel y(x, y).")
24 Linear unmixing model N y( x, y) e. ( x, y) η n 1 n n y Eα η n = 1, 2, 3 n( x, y) is a scalar value representing the functional coverage of endmember vector e n at pixel y(x, y). Constraints: 1.) n 0, n: 1 n N 2.) N n 1 n 1 Abundance nonnegativity constraint (ANC) Abundance sum-to-one constraint (ASC)
25 Objective 1. To perform a comparative analysis of the least squares sparse regression signal-subspace geometrical and statistical methods for subpixel classification on different data sets. 2. To develop a method to utilize the subpixel maps in obtaining fractional land cover classes.


26
27 Endmember generation Global mixing spaces were sampled* using a spectrally diverse land cover and diversity of biomes with 100 Landsat ETM+ scenes. This defined a standardized spectral endmember of substrate (S), vegetation (V), and dark objects (D). Substrate - soils, sediments, rocks, and non-photosynthetic vegetation. Vegetation - green photosynthetic plants. Dark objects - clear waters, deep shadows, absorptive substrate materials, etc., The SVD endmember coefficient, in addition to dates and locations of each subscene are available at * Small, C., & Milesi, C. (2013). Multi-scale Standardized Spectral Mixture Models. Remote Sensing of Environment, 136,

28 Global endmembers
29 Validation Range - minimum and maximum abundance values correlation coefficient (cc) RMSE signal-to-reconstruction error (SRE) probability of success (ps) and bivariate distribution function (BDF) Error matrix (TP, TN, FP, FN) Producer s, User s, Overall accuracy, and Kappa coefficient were used for validation.

30 Results CC a d RMSE for e dmember Plot 1, of probability 2 a d of success 3. (ps) and SRE(dB).


31


32 Global WELD classification Mosaic of 8003 scenes generated from the 2011 annual WELD. Each scene is composed of 5295 rows and 5295 columns, therefore, a single snapshot global data consists of billion pixels with 6 spectral dimensions, which was processed in 29 minutes.
 FCC from Landsat (bands 5-4-3 as RGB) showing forest patch, grassland and water bodies; (d) forest fractional map for the corresponding area in (c); (e) grassland / farmland fractional map; (f)")
33 LC classification from Abundance Maps Figure. (a) Forest fractional map (b) farmland / grassland fractional map for the state of California. (c) FCC from Landsat (bands as RGB) showing forest patch, grassland and water bodies; (d) forest fractional map for the corresponding area in (c); (e) grassland / farmland fractional map; (f) water fractional map, (g) classification of original WELD data by RF; and (h) forest cover map from NAFD product.
 showing San Luis")

34 (a) (b) (c) (d) (e) Spatial distribution of the fractional water bodies in California RGB composite of the Landsat bands (5, 4, 3) showing San Luis Reservoir in central California fractional map of San Luis reservoir classification of original WELD data by RF classifier and San Luis reservoir from NAFD product.


35 Urban area classification a Fra cisco Bay Area Los A ge es Area

, (f) are the extracted urban areas from the substrate fractional cover and NPP-VIIRS data; (g),")
36 The builtup urban areas extracted from substrate fractional map and NPP-VIIRS data of SF Bay Area and LA area. Note: (a), (b) are Landsat RGB composite (bands 5, 4, and 3 as RGB); (c), (d) are NPP-VIIRS data; (e), (f) are the extracted urban areas from the substrate fractional cover and NPP-VIIRS data; (g), (h) are the urban settlement obtained from classification of original WELD data by RF classifier.

37 Validation

 and LA area (bottom) obtained from unmixing, RF,")
38 Proportion of forest cover (top), farmland (middle), and water bodies (bottom) obtained from unmixing, RF, NLCD and NAFD for 100 sample patches. The straight lines indicate mean of the corresponding classes. Proportion of urban built-up in SF Bay Area (top) and LA area (bottom) obtained from unmixing, RF, and NLCD for 100 sample patches. The straight lines indicate mean of the corresponding classes.
39 Conclusions S-V-D fractional maps obtained from global WELD using unmixing were shown to be useful in deriving forest, farmland, water and urban areas. An overall classification accuracy of over 91% was achieved. Validation of these land cover maps with NLCD 2011 products and NAFD maps revealed a 6% improvement in unmixing based classification and their advantages over perpixel classifier such as Random Forest. Unmixing based approach is a feasible method for land cover mapping on a global scale. The current study may be a pathfinder, recognizing that the mapping of land cover classes from fractional estimates at both the local and global scales will continue to improve over time.


40 Thank you.
Mapping for a Changing California
 Mapping for a Changing California Spatial Data Science: - the 21 st century mapping toolkit - case studies in remote sensing and participatory informatics -where to get more information Maggi Kelly, University
A Service Architecture for Processing Big Earth Data in the Cloud with Geospatial Analytics and Machine Learning
 A Service Architecture for Processing Big Earth Data in the Cloud with Geospatial Analytics and Machine Learning WOLFGANG GLATZ & THOMAS BAHR 1 Abstract: The Geospatial Services Framework (GSF) brings
A Cotton Irrigator s Decision Support System Using National, Regional and Local Data
 A Cotton Irrigator s Decision Support System Using National, Regional and Local Data ISESS 2015, Melbourne Jamie Vleeshouwer, Nicholas J. Car, John Hornbuckle 26 March 2015 LAND & WATER FLAGSHIP / AGRICULTURE
DETECTING HUMAN ACTIVITIES IN THE ARCTIC OCEAN BY CONSTRUCTING AND ANALYZING SUPER-RESOLUTION IMAGES FROM MODIS DATA INTRODUCTION
 DETECTING HUMAN ACTIVITIES IN THE ARCTIC OCEAN BY CONSTRUCTING AND ANALYZING SUPER-RESOLUTION IMAGES FROM MODIS DATA Shizhi Chen and YingLi Tian Department of Electrical Engineering The City College of
Urban land cover and land use extraction from Very High Resolution remote sensing imagery
 Urban land cover and land use extraction from Very High Resolution remote sensing imagery Mengmeng Li* 1, Alfred Stein 1, Wietske Bijker 1, Kirsten M.de Beurs 2 1 Faculty of Geo-Information Science and
Urban areas & climate change
 Urban areas & climate change Paolo Gamba University of Pavia University of Pavia The UNIPV TLC & RS Lab is a dynamic research group developing in the past years many techniques devoted to the analysis
Greening of Arctic: Knowledge and Uncertainties
 Greening of Arctic: Knowledge and Uncertainties Jiong Jia, Hesong Wang Chinese Academy of Science jiong@tea.ac.cn Howie Epstein Skip Walker Moscow, January 28, 2008 Global Warming and Its Impact IMPACTS
Imagery and the Location-enabled Platform in State and Local Government
 Imagery and the Location-enabled Platform in State and Local Government Fred Limp, Director, CAST Jim Farley, Vice President, Leica Geosystems Oracle Spatial Users Group Denver, March 10, 2005 TM TM Discussion
A Facility for Producing Consistent Remotely Sensed Biophysical Data Products of Australia
 TERRESTRIAL ECOSYSTEM RESEARCH NETWORK - AusCover - A Facility for Producing Consistent Remotely Sensed Biophysical Data Products of Australia June, 2011 Mervyn Lynch Professor of Remote Sensing Curtin
1. Introduction. Chaithanya, V.V. 1, Binoy, B.V. 2, Vinod, T.R. 2. Publication Date: 8 April DOI: https://doi.org/ /cloud.ijarsg.
 Cloud Publications International Journal of Advanced Remote Sensing and GIS 2017, Volume 6, Issue 1, pp. 2088-2096 ISSN 2320 0243, Crossref: 10.23953/cloud.ijarsg.112 Research Article Open Access Estimation
Using satellite images to calculate land use and land cover statistics
 Using satellite images to calculate land use and land cover statistics National Administrative Department of Statistics DANE Colombia April 2016 @DANE_Colombia /DANEColombia /DANEColombia Background (1)
Module 2.1 Monitoring activity data for forests using remote sensing
 Module 2.1 Monitoring activity data for forests using remote sensing Module developers: Frédéric Achard, European Commission (EC) Joint Research Centre (JRC) Jukka Miettinen, EC JRC Brice Mora, Wageningen
Observing land from space: Interacting with land data from NASA s LP DAAC
 Observing land from space: Interacting with land data from NASA s LP DAAC Danielle Golon Innovate! Inc., contractor to the U.S. Geological Survey (USGS) Earth Resources Observation and Science (EROS) Center
Land Use / Land Cover Mapping in
 Land Use / Land Cover Mapping in Eastern and Southern African Regions RCMRD Experience by 6/24/2013, Nairobi Kenya Dr. Tesfaye Korme Director of RS, GIS and Mapping, RCMRD I. About RCMRD, Its Vision and
Working with ArcGIS Online
 Esri International User Conference San Diego, CA Technical Workshops July 12, 2011 Working with ArcGIS Online Bern Szukalski, Deane Kensok Topics for this Session ArcGIS Online Overview ArcGIS Online Content
Sources of Imagery and GIS Data Layers (Last updated October 2005)
") Sources of Imagery and GIS Data Layers (Last updated October 2005) The question of where to find data is one often asked by beginners in precision agriculture and other geospatial projects. The following
Sources of Imagery and GIS Data Layers (Last updated October 2005) The question of where to find data is one often asked by beginners in precision agriculture and other geospatial projects. The following
GLOBWETLAND AFRICA TOOLBOX
 The GlobWetland Africa Toolbox is an open source and free-of-charge software toolbox for inventorying, mapping, monitoring and assessing wetlands. The toolbox comes with end-to-end processing workflows
Predicting ectotherm disease vector spread. - Benefits from multi-disciplinary approaches and directions forward
 Predicting ectotherm disease vector spread - Benefits from multi-disciplinary approaches and directions forward Naturwissenschaften Stephanie Margarete THOMAS, Carl BEIERKUHNLEIN, Department of Biogeography,
Observation (EO) & Geomatics in Canada
 & Geomatics in Canada") Innovating to Increase the Impact of Earth Observation (EO) & Geomatics in Canada Natural Resources Canada February 25, 2014 Prashant Shukle, Director General Canada Centre for Mapping and Earth Observation
Innovating to Increase the Impact of Earth Observation (EO) & Geomatics in Canada Natural Resources Canada February 25, 2014 Prashant Shukle, Director General Canada Centre for Mapping and Earth Observation
Land cover research, applications and development needs in Slovakia
 Land cover research, applications and development needs in Slovakia Andrej Halabuk Institute of Landscape Ecology Slovak Academy of Sciences (ILE SAS) Štefánikova 3, 814 99 Bratislava, Slovakia Institute
Mining Climate Data. Michael Steinbach Vipin Kumar University of Minnesota /AHPCRC
 Mining Climate Data Michael Steinbach Vipin Kumar University of Minnesota /AHPCRC Collaborators: G. Karypis, S. Shekhar (University of Minnesota/AHPCRC) V. Chadola, S. Iyer, G. Simon, P. Zhang (UM/AHPCRC)
The Challenge of Geospatial Big Data Analysis
 288 POSTERS The Challenge of Geospatial Big Data Analysis Authors - Teerayut Horanont, University of Tokyo, Japan - Apichon Witayangkurn, University of Tokyo, Japan - Shibasaki Ryosuke, University of Tokyo,
Patrick Leinenkugel. German Aerospace Center (DLR) Vortrag > Autor > Dokumentname > Datum
 Vortrag > Autor > Dokumentname > Datum") Characterisation of land surface phenology and land cover for the Mekong Basin on the basis of multitemporal and multispectral satellite data from the MODIS Sensor Patrick Leinenkugel German Aerospace
Characterisation of land surface phenology and land cover for the Mekong Basin on the basis of multitemporal and multispectral satellite data from the MODIS Sensor Patrick Leinenkugel German Aerospace
Introduction to Portal for ArcGIS
 Introduction to Portal for ArcGIS Derek Law Product Management March 10 th, 2015 Esri Developer Summit 2015 Agenda Web GIS pattern Product overview Installation and deployment Security and groups Configuration
Integrating Globus into a Science Gateway for Cryo-EM
 Integrating Globus into a Science Gateway for Cryo-EM Michael Cianfrocco Life Sciences Institute Department of Biological Chemistry University of Michigan Globus World 2018 Impact & growth of Executive
EFFECT OF ANCILLARY DATA ON THE PERFORMANCE OF LAND COVER CLASSIFICATION USING A NEURAL NETWORK MODEL. Duong Dang KHOI.
 EFFECT OF ANCILLARY DATA ON THE PERFORMANCE OF LAND COVER CLASSIFICATION USING A NEURAL NETWORK MODEL Duong Dang KHOI 1 10 Feb, 2011 Presentation contents 1. Introduction 2. Methods 3. Results 4. Discussion
Sparse Representation-based Analysis of Hyperspectral Remote Sensing Data
 Sparse Representation-based Analysis of Hyperspectral Remote Sensing Data Ribana Roscher Institute of Geodesy and Geoinformation Remote Sensing Group, University of Bonn 1 Remote Sensing Image Data Remote
Capabilities and Limitations of Land Cover and Satellite Data for Biomass Estimation in African Ecosystems Valerio Avitabile
 Capabilities and Limitations of Land Cover and Satellite Data for Biomass Estimation in African Ecosystems Valerio Avitabile Kaniyo Pabidi - Budongo Forest Reserve November 13th, 2008 Outline of the presentation
Landsat-based Global Urban Area Map
 1. TITLE Landsat-based Global Urban Area Map Abbreviation Metadata Identifier Landsat-based Global Urban Area Map LaGURAM LaGURAM20160711142456-DIAS20160706142617-en 2. CONTACT 2.1 CONTACT on DATASET Hiroyuki
The Global Land Cover Facility
 The Global Land Cover Facility REASoN Activities John Townshend, Principal Investigator Joseph JaJa, Co-Principal Investigator Paul Davis, Science Manager University of Maryland January 2004 The GLCF The
ZRCSAZU. Remote sensing and Earth observation data at ZRC SAZU. dr. Tatjana Veljanovski Atrij ZRC Ljubljana
 ZRCSAZU Remote sensing and Earth observation data at ZRC SAZU dr. Tatjana Veljanovski 2016-06-08 Atrij ZRC Ljubljana Remote Sensing Department Remote Sensing Department 20 years of experience application,
Leveraging Web GIS: An Introduction to the ArcGIS portal
 Leveraging Web GIS: An Introduction to the ArcGIS portal Derek Law Product Management DLaw@esri.com Agenda Web GIS pattern Product overview Installation and deployment Configuration options Security options
Vegetation Change Detection of Central part of Nepal using Landsat TM
 Vegetation Change Detection of Central part of Nepal using Landsat TM Kalpana G. Bastakoti Department of Geography, University of Calgary, kalpanagb@gmail.com Abstract This paper presents a study of detecting
Dynamic Land Cover Dataset Product Description
 Dynamic Land Cover Dataset Product Description V1.0 27 May 2014 D2014-40362 Unclassified Table of Contents Document History... 3 A Summary Description... 4 Sheet A.1 Definition and Usage... 4 Sheet A.2
Machine Learning to Automatically Detect Human Development from Satellite Imagery
 Technical Disclosure Commons Defensive Publications Series April 24, 2017 Machine Learning to Automatically Detect Human Development from Satellite Imagery Matthew Manolides Follow this and additional
Building a validation database for land cover products from high spatial resolution images
 Building a validation database for land cover products from high spatial resolution images The Land Cover project of the ESA Climate Change Initiative Bontemps Sophie 1, Achard Frédéric 2, Lamarche Céline
Temporal and spatial approaches for land cover classification.
 Temporal and spatial approaches for land cover classification. Ryabukhin Sergey sergeyryabukhin@gmail.com Abstract. This paper describes solution for Time Series Land Cover Classification Challenge (TiSeLaC).
Land cover/land use mapping and cha Mongolian plateau using remote sens. Title. Author(s) Bagan, Hasi; Yamagata, Yoshiki. Citation Japan.
 Bagan, Hasi; Yamagata, Yoshiki. Citation Japan.") Title Land cover/land use mapping and cha Mongolian plateau using remote sens Author(s) Bagan, Hasi; Yamagata, Yoshiki International Symposium on "The Imp Citation Region Specific Systems". 6 Nove Japan.
Title Land cover/land use mapping and cha Mongolian plateau using remote sens Author(s) Bagan, Hasi; Yamagata, Yoshiki International Symposium on "The Imp Citation Region Specific Systems". 6 Nove Japan.
AGOG 485/585 /APLN 533 Spring Lecture 5: MODIS land cover product (MCD12Q1). Additional sources of MODIS data
. Additional sources of MODIS data") AGOG 485/585 /APLN 533 Spring 2019 Lecture 5: MODIS land cover product (MCD12Q1). Additional sources of MODIS data Outline Current status of land cover products Overview of the MCD12Q1 algorithm Mapping
AGOG 485/585 /APLN 533 Spring 2019 Lecture 5: MODIS land cover product (MCD12Q1). Additional sources of MODIS data Outline Current status of land cover products Overview of the MCD12Q1 algorithm Mapping
The Road to Data in Baltimore
 Creating a parcel level database from high resolution imagery By Austin Troy and Weiqi Zhou University of Vermont, Rubenstein School of Natural Resources State and local planning agencies are increasingly
CONTEMPORARY ANALYTICAL ECOSYSTEM PATRICK HALL, SAS INSTITUTE
 CONTEMPORARY ANALYTICAL ECOSYSTEM PATRICK HALL, SAS INSTITUTE Copyright 2013, SAS Institute Inc. All rights reserved. Agenda (Optional) History Lesson 2015 Buzzwords Machine Learning for X Citizen Data
Time Series Analysis with SAR & Optical Satellite Data
 Time Series Analysis with SAR & Optical Satellite Data Thomas Bahr ESRI European User Conference Thursday October 2015 harris.com Motivation Changes in land surface characteristics mirror a multitude of
USING HYPERSPECTRAL IMAGERY
 USING HYPERSPECTRAL IMAGERY AND LIDAR DATA TO DETECT PLANT INVASIONS 2016 ESRI CANADA SCHOLARSHIP APPLICATION CURTIS CHANCE M.SC. CANDIDATE FACULTY OF FORESTRY UNIVERSITY OF BRITISH COLUMBIA CURTIS.CHANCE@ALUMNI.UBC.CA
Marla Meehl Manager of NCAR/UCAR Networking and Front Range GigaPoP (FRGP)
") Big Data at the National Center for Atmospheric Research (NCAR) & expanding network bandwidth to NCAR over Pacific Wave and Western Regional Network (WRN) Marla Meehl Manager of NCAR/UCAR Networking and
Big Data at the National Center for Atmospheric Research (NCAR) & expanding network bandwidth to NCAR over Pacific Wave and Western Regional Network (WRN) Marla Meehl Manager of NCAR/UCAR Networking and
MAPPING LAND USE/ LAND COVER OF WEST GODAVARI DISTRICT USING NDVI TECHNIQUES AND GIS Anusha. B 1, Sridhar. P 2
 MAPPING LAND USE/ LAND COVER OF WEST GODAVARI DISTRICT USING NDVI TECHNIQUES AND GIS Anusha. B 1, Sridhar. P 2 1 M. Tech. Student, Department of Geoinformatics, SVECW, Bhimavaram, A.P, India 2 Assistant
A GLOBAL ANALYSIS OF URBAN REFLECTANCE. Christopher SMALL
 A GLOBAL ANALYSIS OF URBAN REFLECTANCE Christopher SMALL Lamont Doherty Earth Observatory Columbia University Palisades, NY 10964 USA small@ldeo.columbia.edu ABSTRACT Spectral characterization of urban
EuroGEOSS Protected Areas Pilot
 EuroGEOSS Protected Areas Pilot Max Craglia European Commission Joint Research Centre Part 1: the present MyNatura2000 Mobile app. Awareness raising & volunteered data collection. Natura2000 covers 18%
Monitoring of Tropical Deforestation and Land Cover Changes in Protected Areas: JRC Perspective
 Monitoring of Tropical Deforestation and Land Cover Changes in Protected Areas: JRC Perspective Z. Szantoi, A. Brink, P. Mayaux, F. Achard Monitoring Of Natural resources for DEvelopment (MONDE) Joint
CHAPTER 1 THE UNITED STATES 2001 NATIONAL LAND COVER DATABASE
 CHAPTER 1 THE UNITED STATES 2001 NATIONAL LAND COVER DATABASE Collin Homer*, Jon Dewitz, Joyce Fry, and Nazmul Hossain *U.S. Geological Survey (USGS) Center for Earth Resources Observation and Science
Analyzing and Visualizing Precipitation and Soil Moisture in ArcGIS
 Analyzing and Visualizing Precipitation and Soil Moisture in ArcGIS Wenli Yang, Pham Long, Peisheng Zhao, Steve Kempler, and Jennifer Wei * NASA Goddard Earth Science Data and Information Services Center
Land abandonment and recultivation in Central and Eastern Europe
 Land abandonment and recultivation in Central and Eastern Europe Patrick Hostert Patrick Griffiths, Stephan Estel, Camilo Alcantara, Tobias Kuemmerle, Dirk Pflugmacher, Alexander Prishchepov, Volker Radeloff
SPATIAL AND TEMPORAL MODELLING OF ECOSYSTEM SERVICES
 SPATIAL AND TEMPORAL MODELLING OF ECOSYSTEM SERVICES Solen Le Clec h, T.Decaëns, S. Dufour, M. Grimaldi, N. Jégou and J. Oszwald ACES Conference 2016 Jacksonville, Florida (USA). December, 5-9th : issues
Spanish national plan for land observation: new collaborative production system in Europe
 ADVANCE UNEDITED VERSION UNITED NATIONS E/CONF.103/5/Add.1 Economic and Social Affairs 9 July 2013 Tenth United Nations Regional Cartographic Conference for the Americas New York, 19-23, August 2013 Item
Building Stronger Data Ecosystems to Address SDGs Data Needs
 Building Stronger Data Ecosystems to Address SDGs Data Needs Data Science in Africa Workshop @ the African University of Science and Technology, Abuja Nov. 15, 2018 The Global Sustainable Development Goals
Portal for ArcGIS: An Introduction. Catherine Hynes and Derek Law
 Portal for ArcGIS: An Introduction Catherine Hynes and Derek Law Agenda Web GIS pattern Product overview Installation and deployment Configuration options Security options and groups Portal for ArcGIS
Regionalized and application-specific compositing - a review of requirements, opportunities and challenges
 Regionalized and application-specific compositing - a review of requirements, opportunities and challenges Patrick Griffiths & Patrick Hostert Geography Department, Humboldt University Berlin Joanne White
Advanced Image Analysis in Disaster Response
 Advanced Image Analysis in Disaster Response Creating Geographic Knowledge Thomas Harris ITT The information contained in this document pertains to software products and services that are subject to the
Object-Oriented Oriented Method to Classify the Land Use and Land Cover in San Antonio using ecognition Object-Oriented Oriented Image Analysis
 Object-Oriented Oriented Method to Classify the Land Use and Land Cover in San Antonio using ecognition Object-Oriented Oriented Image Analysis Jayar S. Griffith ES6973 Remote Sensing Image Processing
Big Data and Geospatial Cyberinfrastructure for Advancing Applications
 Big Data and Geospatial Cyberinfrastructure for Advancing Applications Presented at GIScience 2012 Big Data and CyberGIS Panel Budhendra Bhaduri September 20, 2012 Columbus, OH Geospatial Cyberinfrastructure
Director: Soroosh Sorooshian
 Director: Soroosh Sorooshian X. Gao B. Imam K. Hsu S. O Rourke D. Hohnbaum J. Li G.H. Park D. Braithwaite E. Pritchard B. Khakbaz W. Chu A. Behrangi Alex R. Sutlana Joey A. Zahraei Developing state-of-the-art
History & Scope of Remote Sensing FOUNDATIONS
 History & Scope of Remote Sensing FOUNDATIONS Lecture Overview Introduction Overview of visual information Power of imagery Definition What is remote sensing? Definition standard for class History of Remote
Amita Mehta and Ana Prados
 Building Capacity in Utilizing NASA Remote Sensing Observations in SWAT for Water Resources and Agricultural Management Applications Amita Mehta and Ana Prados NASA - University of Maryland Baltimore County
Management of Geological Information for Mining Sector Development and Investment Attraction Examples from Uganda and Tanzania
 Mineral Wealth Conference 2016 Kampala / Uganda Management of Geological Information for Mining Sector Development and Investment Attraction Examples from Uganda and Tanzania Andreas Barth 1, Andreas Knobloch
Introduction to Geographic Information Systems (GIS): Environmental Science Focus
: Environmental Science Focus") Introduction to Geographic Information Systems (GIS): Environmental Science Focus September 9, 2013 We will begin at 9:10 AM. Login info: Username:!cnrguest Password: gocal_bears Instructor: Domain: CAMPUS
Introduction to Geographic Information Systems (GIS): Environmental Science Focus September 9, 2013 We will begin at 9:10 AM. Login info: Username:!cnrguest Password: gocal_bears Instructor: Domain: CAMPUS
The AMGI project: A Brief Overview
 The AMGI project: A Brief Overview World Bank Group (Energy & Extractives Global Practice) GEEDR Francisco Igualada (figualada@worldbank.org) Presented by Ash Johnson, Geosoft Inc. The AMGI Project: Vision
EU collaborations with NASA LCLUC Program & Current Priorities
 & Current Priorities ioannis Manakos, Dr. Centre for Research and Technology Hellas Information Technologies Institute Visual Analytics, Virtual & Augmented Reality Laboratory European Association of Remote
Leveraging Sentinel-1 time-series data for mapping agricultural land cover and land use in the tropics
 Leveraging Sentinel-1 time-series data for mapping agricultural land cover and land use in the tropics Caitlin Kontgis caitlin@descarteslabs.com @caitlinkontgis Descartes Labs Overview What is Descartes
An Internet-based Agricultural Land Use Trends Visualization System (AgLuT)
") An Internet-based Agricultural Land Use Trends Visualization System (AgLuT) Second half yearly report 01-01-2001-06-30-2001 Prepared for Missouri Department of Natural Resources Missouri Department of
An Internet-based Agricultural Land Use Trends Visualization System (AgLuT) Second half yearly report 01-01-2001-06-30-2001 Prepared for Missouri Department of Natural Resources Missouri Department of
NATIONAL MAPPING EFFORTS: THE PHILIPPINES
 NATIONAL MAPPING EFFORTS: THE PHILIPPINES Dr. RIJALDIA N. SANTOS DENR National Mapping and Resource Information Authority (NAMRIA) May 30, 2018 Land Cover/Land Use Changes (LC/LUC) and Its Impacts on Environment
ArcGIS is Advancing. Both Contributing and Integrating many new Innovations. IoT. Smart Mapping. Smart Devices Advanced Analytics
 ArcGIS is Advancing IoT Smart Devices Advanced Analytics Smart Mapping Real-Time Faster Computing Web Services Crowdsourcing Sensor Networks Both Contributing and Integrating many new Innovations ArcGIS
Progress Report Year 2, NAG5-6003: The Dynamics of a Semi-Arid Region in Response to Climate and Water-Use Policy
 Progress Report Year 2, NAG5-6003: The Dynamics of a Semi-Arid Region in Response to Climate and Water-Use Policy Principal Investigator: Dr. John F. Mustard Department of Geological Sciences Brown University
APPENDIX. Normalized Difference Vegetation Index (NDVI) from MODIS data
 from MODIS data") APPENDIX Land-use/land-cover composition of Apulia region Overall, more than 82% of Apulia contains agro-ecosystems (Figure ). The northern and somewhat the central part of the region include arable lands
APPENDIX Land-use/land-cover composition of Apulia region Overall, more than 82% of Apulia contains agro-ecosystems (Figure ). The northern and somewhat the central part of the region include arable lands
Voices from Private Sector: Insights for Future NSDI Development in Indonesia
 Voices from Private Sector: Insights for Future NSDI Development in Indonesia Ta n d a n g Yu l i a d i D w i P u t ra, Ryosuke S h i b a s a k i I n st i t u t e o f I n d u st r i a l S c i e n c e,
Transboundary water management with Remote Sensing. Oluf Jessen DHI Head of Projects, Water Resources Technical overview
 Transboundary water management with Remote Sensing Oluf Jessen DHI Head of Projects, Water Resources Technical overview ozj@dhigroup.com Transboundary water management Water management across national
Empowered lives. Resilient nations. Data for People and Planet. powered by
 Empowered lives. Resilient nations. Data for People and Planet powered by Overview As we enter the fourth industrial revolution, technology is revolutionizing our ability to map nature. Satellite data
Portal for ArcGIS: An Introduction
 Portal for ArcGIS: An Introduction Derek Law Esri Product Management Esri UC 2014 Technical Workshop Agenda Web GIS pattern Product overview Installation and deployment Security and groups Configuration
GIS in Weather and Society
 GIS in Weather and Society Olga Wilhelmi Institute for the Study of Society and Environment National Center for Atmospheric Research WAS*IS November 8, 2005 Boulder, Colorado Presentation Outline GIS basic
XXIII CONGRESS OF ISPRS RESOLUTIONS
 XXIII CONGRESS OF ISPRS RESOLUTIONS General Resolutions Resolution 0: Thanks to the Czech Society commends: To congratulate The Czech Society, its president and the Congress Director Lena Halounová, the
RESEARCH METHODOLOGY
 III. RESEARCH METHODOLOGY 3.1 Time and Location This research has been conducted in period March until October 2010. Location of research is over Sumatra terrain. Figure 3.1 show the area of interest of
ArcGIS Enterprise: What s New. Philip Heede Shannon Kalisky Melanie Summers Shreyas Shinde
 ArcGIS Enterprise: What s New Philip Heede Shannon Kalisky Melanie Summers Shreyas Shinde ArcGIS Enterprise is the new name for ArcGIS for Server ArcGIS Enterprise Software Components ArcGIS Server Portal
Current Status of the Stratospheric Ozone Layer From: UNEP Environmental Effects of Ozone Depletion and Its Interaction with Climate Change
 Goals Produce a data product that allows users to acquire time series of the distribution of UV-B radiation across the continental USA, based upon measurements from the UVMRP. Provide data in a format
Mapping Coastal Change Using LiDAR and Multispectral Imagery
 Mapping Coastal Change Using LiDAR and Multispectral Imagery Contributor: Patrick Collins, Technical Solutions Engineer Presented by TABLE OF CONTENTS Introduction... 1 Coastal Change... 1 Mapping Coastal
Overview on Land Cover and Land Use Monitoring in Russia
 Russian Academy of Sciences Space Research Institute Overview on Land Cover and Land Use Monitoring in Russia Sergey Bartalev Joint NASA LCLUC Science Team Meeting and GOFC-GOLD/NERIN, NEESPI Workshop
Rick Ebert & Joseph Mazzarella For the NED Team. Big Data Task Force NASA, Ames Research Center 2016 September 28-30
 NED Mission: Provide a comprehensive, reliable and easy-to-use synthesis of multi-wavelength data from NASA missions, published catalogs, and the refereed literature, to enhance and enable astrophysical
C O P E R N I C U S F O R G I P R O F E S S I O N A L S
 C O P E R N I C U S F O R G I P R O F E S S I O N A L S Downstream Applications MALTA 2017-06-26 Pascal Lory, EUROGI EU EU EU www.copernicus.eu S c o p e Identifying urban housing density: Stella Ofori-Ampofo,
Introduction to Portal for ArcGIS. Hao LEE November 12, 2015
 Introduction to Portal for ArcGIS Hao LEE November 12, 2015 Agenda Web GIS pattern Product overview Installation and deployment Security and groups Configuration options Portal for ArcGIS + ArcGIS for
USGS/EROS Accomplishments and Year 3 Plans. Enhancement of the U.S. Drought Monit Through the Integration of NASA Vegetation Index Imagery
 USGS/EROS Accomplishments and Year 3 Plans Enhancement of the U.S. Drought Monit Through the Integration of NASA Vegetation Index Imagery Jesslyn Brown Team Meeting, Austin, TX, 10/6/09 U.S. Department
Sub-pixel regional land cover mapping. with MERIS imagery
 Sub-pixel regional land cover mapping with MERIS imagery R. Zurita Milla, J.G.P.W. Clevers and M. E. Schaepman Centre for Geo-information Wageningen University 29th September 2005 Overview Land Cover MERIS
Oak Ridge Urban Dynamics Institute
 Oak Ridge Urban Dynamics Institute Presented to ORNL NEED Workshop Budhendra Bhaduri, Director Corporate Research Fellow July 30, 2014 Oak Ridge, TN Our societal challenges and solutions are often local
Customizable Drought Climate Service for supporting different end users needs
 1 Customizable Drought Climate Service for supporting different end users needs Ramona MAGNO, T. De Filippis, E. Di Giuseppe, M. Pasqui, E. Rapisardi, L. Rocchi (IBIMET-CNR; LaMMA Consortium) 1 Congresso
Land Surface Remote Sensing II
 PROCEEDINGS OFSPIE Land Surface Remote Sensing II Thomas J. Jackson Jing Ming Chen Peng Gong Shunlin Liang Editors 13-16 October 2014 Beijing, China Sponsored by SPIE Cosponsored by State Key Laboratory
Spatial Process VS. Non-spatial Process. Landscape Process
 Spatial Process VS. Non-spatial Process A process is non-spatial if it is NOT a function of spatial pattern = A process is spatial if it is a function of spatial pattern Landscape Process If there is no
ASimultaneousRadiometricand Gravimetric Framework
 Towards Multisensor Snow Assimilation: ASimultaneousRadiometricand Gravimetric Framework Assistant Professor, University of Maryland Department of Civil and Environmental Engineering September 8 th, 2014
Data Aggregation with InfraWorks and ArcGIS for Visualization, Analysis, and Planning
 Data Aggregation with InfraWorks and ArcGIS for Visualization, Analysis, and Planning Stephen Brockwell President, Brockwell IT Consulting, Inc. Join the conversation #AU2017 KEYWORD Class Summary Silos
Ecosystems. 1. Population Interactions 2. Energy Flow 3. Material Cycle
 Ecosystems 1. Population Interactions 2. Energy Flow 3. Material Cycle The deep sea was once thought to have few forms of life because of the darkness (no photosynthesis) and tremendous pressures. But
LCMAP Workshop Welcome. Jesslyn F. Brown USGS/EROS Nov 6, 2018
 LCMAP Workshop Welcome Jesslyn F. Brown USGS/EROS Nov 6, 2018 LCMAP: Workshop Goals Land Change Monitoring, Analysis, and Projection (LCMAP) Provide an update on current status (Version 1) Algorithm approaches
Smart Land Administration. Brent A. Jones, PE, PLS
 Smart Land Administration Brent A. Jones, PE, PLS bjones@esri.com What is Smart? Required Important Modern Open Secure Authoritative Sustainable Cost Effective Reliable Scalable Contributory Usable Timely
System of Environmental-Economic Accounting. Advancing the SEEA Experimental Ecosystem Accounting. Extent Account (Levels 1 and 2)
") Advancing the SEEA Experimental Ecosystem Accounting Extent Account (Levels 1 and 2) Overview: The Extent Account 1. Learning objectives 2. Review of Level 0 (5m) What is it? Why do we need it? What does
Advancing the SEEA Experimental Ecosystem Accounting Extent Account (Levels 1 and 2) Overview: The Extent Account 1. Learning objectives 2. Review of Level 0 (5m) What is it? Why do we need it? What does
COMPARISON OF PIXEL-BASED AND OBJECT-BASED CLASSIFICATION METHODS FOR SEPARATION OF CROP PATTERNS
 COMPARISON OF PIXEL-BASED AND OBJECT-BASED CLASSIFICATION METHODS FOR SEPARATION OF CROP PATTERNS Levent BAŞAYİĞİT, Rabia ERSAN Suleyman Demirel University, Agriculture Faculty, Soil Science and Plant