A GLOBAL ANALYSIS OF URBAN REFLECTANCE. Christopher SMALL
|
|
|
- Cornelius Stephens
- 5 years ago
- Views:
Transcription
1 A GLOBAL ANALYSIS OF URBAN REFLECTANCE Christopher SMALL Lamont Doherty Earth Observatory Columbia University Palisades, NY USA ABSTRACT Spectral characterization of urban reflectance is necessary for discrimination of human settlements from other types of land cover. The 10 to 20 m scale of urban land cover elements results in a preponderance of spectrally mixed pixels when imaged with moderate resolution optical sensors like Landsat. The overall reflectance of the urban mosaic is determined by the spectral reflectance of surface materials and shadows and their spatial distribution. Building materials dominate net reflectance in most cities but in many cases vegetation also has a very strong influence on urban reflectance. A comparative analysis of Landsat imagery for a set of 28 cities worldwide provides a basis for a general spectral characterization of urban reflectance. The results of the analysis indicate that the reflectance of these cities can be described as linear combinations of high albedo, low albedo and vegetation spectral endmembers within a 2 dimensional mixing space. The primary two dimensions of the full six dimensional mixing space consistently contain over 90% of observed variance. The relative proportions of the endmembers vary considerably among different cities and within individual cities. The most consistent characteristic of the urban mosaic is spectral heterogeneity. At scales of 10 to 30 meters, urban areas are considerably more heterogeneous than other land cover types investigated. Spectral characterization of urban land cover on the basis of heterogeneity could provide a basis for mapping the spatial extent of human settlements with satellite imagery collected over the past 30 years. 1 Introduction Moderate resolution optical sensors provide a 30 year record of urban evolution worldwide. Although urban areas occupy a relatively small fraction of Earth's surface area, their extent, distribution and evolution have enormous impact on environmental and socioeconomic dynamics world wide. Despite its fundamental importance, urban land cover has not been characterized to the same extent that other land cover types have. In order to quantify the extent and evolution of urban areas with optical sensors it is necessary to understand the physical characteristics that distinguish developed urban areas from other types of human modified land surfaces and from undeveloped land surfaces. A systematic physical characterization of optical reflectance properties of urban areas would facilitate global mapping of urban extent. Such a characterization of urban land cover would also benefit understanding of energy flux and micro and mesoscale meteorological processes controlling urban environmental conditions. One of the primary obstacles to urban land cover classification is the diversity and spectral heterogeneity of urban reflectance. Unlike many other land cover types, urban reflectance is extremely variable at a variety of spatial scales. Spectral heterogeneity at scales comparable to the Ground Instantaneous Field Of View (GIFOV) of an optical sensor results in a preponderance of spectrally mixed pixels. Mixed pixels are problematic for conventional classification methods because most algorithms are predicated on the assumption of spectral homogeneity within a particular type of land cover. The diversity of land cover types at different spatial scales in the
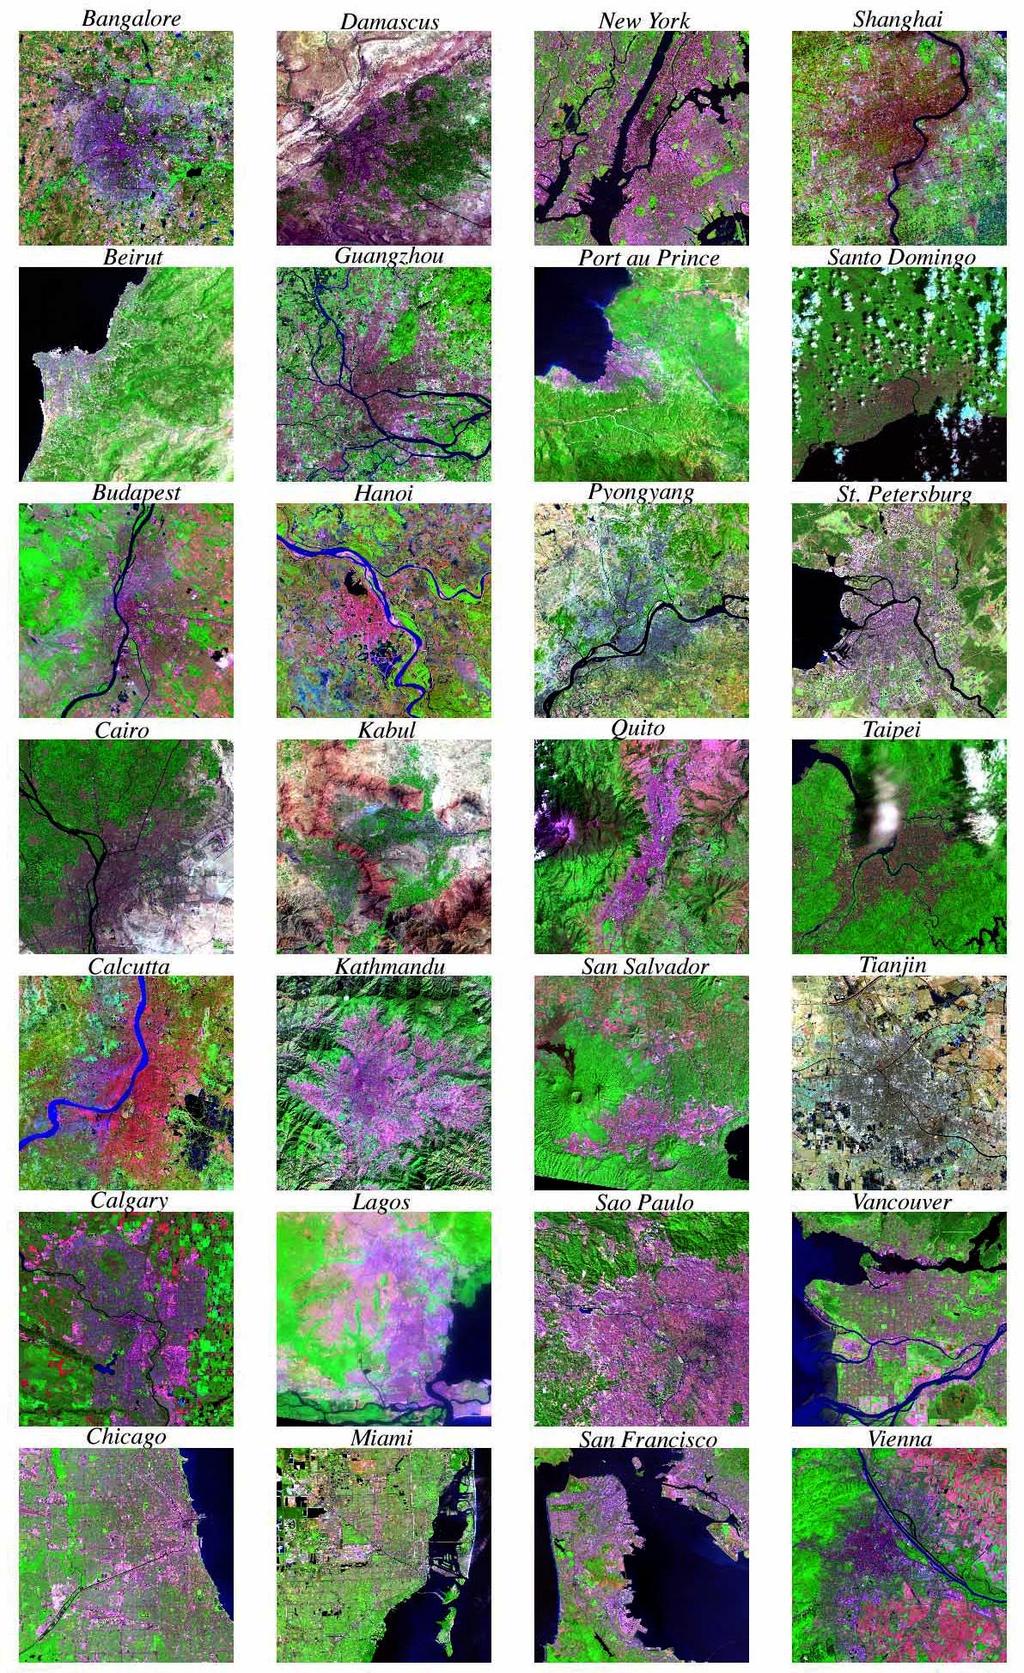
2 urban mosaic therefore results in high rates of misclassification between urban and other land cover classes. The objective of this study is to develop a quantitative physical characterization of the reflectance properties of the urban mosaic. This task is complicated by two distinct types of variability in urban reflectance. Intraurban spatial variabitlity is a result of the diversity of building materials and land covers present in the urban mosaic at different spatial scales. Characterizing scale dependent reflectance properties requires higher spatial resolution than is provided by moderate resolution sensors like Landsat. Interurban variations in urban reflectance are a result of socioeconomic, cultural, historical and environmental differences among cities. Factors such as building materials, physical environment, urban planning constraints and historical evolution influence differences in overall reflectance patterns observed in cities worldwide. This study uses the concepts of spectral mixture analysis to provide self consistent physical descriptions of a variety of cities in order to determine what, if any, reflectance characteristics can be used to distinguish urban land cover in moderate resolution optical imagery. 2 Reflectance Scale and Spectral Mixing The characteristic spatial scale of surface reflectance patterns in the built environment is comparable to the GIFOV of most operational multispectral sensors in use today. Two dimensional spatial autocorrelation of 1 m Ikonos imagery in 14 cities of varying size and setting indicates that the characteristic spatial scale on which Visible/Near Infrared reflectance decorrelates is 10 to 20 meters (Small, 2002). This explains the preponderance of mixed pixels observed in Landsat imagery of urban areas. This spectral mixing within the urban mosaic is what prevents hard classification algorithms from producing accurate results. In order to characterize urban reflectance in a physically meaningful and sufficiently robust way, it is necessary to accommodate the fact that moderate resolution sensors will generally image a combination of discrete surface reflectances and represent the upwelling radiance field in the form of a mixed pixel. Spectral mixture analysis provides a systematic way to quantify spectrally heterogeneous urban reflectance. Spectral Mixture Analysis (SMA) is based on the observation that, in some situations, radiances from surfaces with different "endmember" reflectances mix linearly within the IFOV (Nash and Conel, 1974; Singer and McCord, 1979; Singer, 1981; Johnson et al, 1983). This observation has made possible the development of a systematic methodology for Spectral Mixture Analysis (Adams et al, 1986, 1989; Smith et al, 1990; Gillespie et al, 1990) that has proven successful for a variety of quantitative applications with multispectral imagery (e.g. Adams et al, 1995; Pech et. al., 1986; Smith et al, 1990; Elmore et al, 2000; Roberts et al, 1998). If a limited number of distinct spectral endmembers are known it is possible to define a "mixing space" within which mixed pixels can be described by linear mixtures of the endmembers. Given sufficient spectral resolution, a system of linear mixing equations may be defined and the best fitting combination of endmember fractions can be estimated for the observed reflectance spectra. The strength of the SMA approach lies in the fact that it explicitly takes into account the physical processes responsible for the observed radiances and therefore accommodates the existence of mixed pixels. Figure 1 (Next Page) Visible/Infrared false color composites of urban Landsat 7 imagery. ETM+ bands 7, 4 and 2 (RGB) emphasize contrast between soil, vegetation, high albedo and low albedo landcovers at 30 m spatial scales. The most heavily built up areas are near the center of each 30 x 30 km subscene. A full resolution color version of this figure is available online at:
3
4 This analysis is based on a diverse collection of cities spanning a range of environmental, cultural and socioeconomic settings. The analyses are conducted on a set of 28 Landsat 7 ETM+ images acquired between 1999 and This quasi-random selection was gleaned from the Landsat 7 archive at the University of Maryland's Global Land Cover Facility (glcf.umiacs.umd.edu). The cities were chosen on the basis of area, diversity and image quality. All analyses were conducted on calibrated exoatmospheric reflectance. For each city, a 30 x 30 km image was chosen to represent the urban area and as wide a variety of surrounding land covers as possible. In most cases, the 900 km 2 image contained all of the built up area and varying amounts of surrounding land covers. In only two cases (New York and Sao Paulo) was the built up area too large to be contained in the subscene. In these cases, the scene was chosen to cover the city center as well as some land cover representative of the surrounding areas. 3 Urban Mixing Spaces The divesity of landcovers present in the urban mosaic determines the spectral dimensionality of the image collected by a sensor. The limited spatial and spectral resolution of the ETM+ sensor results in a projection of a high dimensional mixing space onto a lower dimensional representation constrained by the ability of the sensor to discriminate different surface reflectances at GIFOV scales. Analyses of AVIRIS hyperspectral imagery suggest that some urban areas have as many as 30 to 50 spectral dimensions (Green and Boardman, 1999; Small, 2001) but the TM and ETM+ sensors can resolve only 6 of these dimensions at most. A central question of this analysis is whether these six dimensions provide an adequate basis for a systematic characterization of urban reflectance. Is the information content provided by the Landsat sensors sufficient to discriminate between urban areas and other land cover types in a consistent manner? The fact that an experienced interpreter can recognize urban areas in Landsat imagery suggests that this is the case but visual interpretation is based on a complex combination of spectral and textural cues that have proven extremely difficult to simulate with machine-based algorithms. The basis of the spectral mixture analysis is the variance partition and mixing space characterization provided by a principal component transformation of the multispectral imagery. The eigenvalue distribution provides a quantitative estimate of the variance partition between the signal and noise dominated principal components of the image. This partition and the number of signal dominated components forms the basis of the dimensionality estimate of the image. The multidimensional feature space of the low order principal components represents the spectral mixing space that can be used to describe the spectral mixtures as combinations of spectral endmembers (Johnson et al, 1985; Boardman, 1993). In this analysis, a Minimum Noise Fraction (MNF) principal component transformation is used. The MNF transformation implemented in ENVI is analogous to the Maximum Noise Transformation described by Green et al (1988) but differs in ordering of the principal components from high to low signal variance (RSI, 2000). With Landsat imagery, the MNF transformation usually produces principal components similar to those resulting from a traditional covariance-based PC rotation but offers the added benefit of normalizing the eigenvalues relative to the variance of the sensor noise estimate. For this analysis, all MNF transformations were applied using noise covariance statistics derived from a June 2000 ETM+ image of a large, clear lake at 3400 m elevation in the Peruvian Andes. Normalized eigenvalue distributions quantify the partition of variance among the principal components indicating how many spectral dimensions are required to represent the information content in the image. The larger eigenvalues are associated with the low order principal components representing the dominant reflectance patterns while the smaller eigenvalues are associated with the higher order principal components associated with the pixel scale variance commonly assumed to be noise.
5
6 Figure 2 (Previous Page) Spectral mixing spaces of the 28 urban areas and their surroundings shown in Figure 1. Each 2D mixing space is represented by a density shaded scatter plot of the two low order principal components of the corresponding image in Figure 1. The pixels near the apexes of the scatter plot represent spectral endmembers while the darker interior regions represent a greater number of mixed pixels. The mixing spaces generally have a triangular form in the two primary dimensions (except some images w/ clouds). The pixels at the apexes consistently correspond to High Albedo, Low Albedo and Vegetation endmembers. The small, dark clusters (generally at right-most apex) correspond to low albedo water and deep shadow. Spectral mixing spaces provide a self-consistent basis for comparison of urban reflectance characteristics. The similarity of the triangular mixing spaces shown in Figure 2 indicates that all 28 of the urban areas in this study show a consistent mixing space topology. Although the distributions of mixed pixels within the mixing spaces vary considerably, the overall form is consistent. The apexes of the mixing space corresponding to the spectral endmembers are generally well defined and the edges between the apexes are generally straight or concave. This suggests that the mixing among the endmembers is primarily linear. The spectra of the endmembers (Figure 3) are also remarkably consistent. This suggests that a three component linear mixing model may provide a consistent and accurate way to represent urban reflectances. 4 Spectral Endmembers and Linear Mixture Models The consistency in the topology of the urban mixing spaces is reflected in the consistency of the spectral endmembers. Figure 3 shows exoatmospheric reflectance profiles for the three primary endmembers associated with the apexes of the triangular two dimensional mixing space. The Low Albedo and Vegetation endmembers are remarkably consistent. The High Albedo endmember is variable in amplitude but is generally convex upward with a peak at SWIR wavelengths. The low albedo endmember generally corresponds to deep shadow or clear water. In many cases, several different water bodies of differing reflectance can be resolved as distinct clusters near the low albedo apex of the mixing space. In these cases, the Low Albedo endmember was chosen to correspond to clear water or deep shadow areas. These Low Albedo reflectances represent the atmospheric path radiance component that is present in every pixel. The fraction of Low Albedo provides an indication of the net albedo of a mixed pixel because it represents the complement of overall surface reflectance. The fraction of High Albedo endmember does not provide an accurate estimate of the overall albedo because of the nonlinearity and dispersion of most mixing spaces near the high albedo apex. The high intra and interurban variability of the High Albedo endmember suggests that a single endmember could not accurately represent the wide variety (but low areal abundance) of high albedo reflectances observed. For the same reason, the similarity of the Low Albedo endmember suggests that it provides a more consistent metric of inverse urban albedo (darkness). Eigenvalue distributions provide concise estimates of urban spectral dimensionality. Consistency in the topology of spectral mixing spaces is reflected in the consistency in variance partition and spectral dimensionality seen in eigenvalue distributions (Figure 4). Analysis of AVIRIS hyperspectral imagery indicates that urban spectral dimensionality can be scale dependent as larger areas can contain a wider variety of spectral endmembers (Small, 2001b). Because surrounding areas may be more spectrally diverse than the built up area, mixture analyses were also conducted for 5 x 5 km areas around the city centers. Eigenvalue distributions for these areas also indicate that the mixing space is essentially two dimensional. Simple three endmember mixing models are well posed for most of the urban areas investigated in this study. Some areas could be represented more accurately with four
7
8 endmember models but, in general, the RMS misfits to the three endmember models were quite small (>0.02 in Figure 5). Small misfit is a necessary but not sufficient verification of the three endmember model. Large misfits would indicate that the model did not provide an accurate description of the mixed reflectances but small misfit does not guarantee that the estimates are accurate. It would be necessary to validate the fraction estimates with independent field measurements to determine the level of accuracy (e.g. Small, 2001). Nonetheless, the low misfits do suggest that the three endmember model can account for most of the observed variance. The most consistent spectral characteristic of urban reflectance at 30 m scale is spectral heterogeneity. Despite the consistency of the 2D mixing spaces and the similarity of the bounding spectral endmembers, a wide variety of endmember fraction abundances characterize the built up areas of the cities shown in Figure 2. Non-urban land covers generally correspond to distinct mixing fractions nearer the apexes of the mixing spaces. This suggests that a measure of spectral heterogeneity at GIFOV scales may be an effective indicator of urban land cover. REFERENCES Adams, J.B. et al., Spectral Mixture Modeling: a New Analysis of Rock and Soil Types at the Viking Lander 1 Site. Journal of Geophysical Research, 91, pp Boardman, J.W., Automating Spectral Unmixing of AVIRIS data using Convex Geometry Concepts, Proceedings Third JPL Airborne Earth Science Workshop, Pasadena, CA, 1993 Green, A. A., M. Berman, P. Switzer, and M. D. Craig, 1988, A transformation for ordering mutispecral data in terms of image quality with implications for noise removal, I.E.E.E. Transactions on Geoscience and Remote Sensing, 26, 1, Green, R. O., and J. Boardman, 2000, Exploration of the relationship between information content and signal/noise ratio and spatial resolution in AVIRIS data, edited by R.O. Green, Proceedings of the Ninth JPL Airborne Earth Science Workshop, Pasadena, CA, Johnson, P. E., M. O. Smith, and J. B. Adams,, 1985, Quantitative analysis of planetary reflectance spectra with principal components analysis, J. Geophys. Res., 90, C805-C810. Johnson, P. E., M. O. Smith, S. Taylor-George, and J. B. Adams, 1983, A semiempirical method for analysis of the reflectance spectra fo binary mineral mixtures, J. Geophys. Res., 1983, 88, Kauth, R.J. and Thomas, G.S., The Tasseled Cap a Graphic Description of the Spectral- Temporal Development of Agricultural Crops as Seen by Landsat. Proceedings of the Symposium on Machine Processing of Remotely Sensed Data, pp Singer, R.B. and McCord, T.B., Large Scale Mixing of Bright and Dark Surface Materials and Implications for Analysis of Spectral Reflectance. Journal of Geophysical Research, pp Small C., 2001a. Estimation of Urban Vegetation Abundance by Spectral Mixture Analysis. International Journal of Remote Sensing, 22(7), pp Small C., 2001b. Multiresolution Analysis of Urban Reflectance. Proceedings of the IEEE Workshop on Remote Sensing and Data Fusion Urban Areas, 8-9 Nov. 2001, Rome, Italy. Small, C., 2002, High Resolution Spectral Mixture Analysis of Urban Ikonos Imagery, Remote Sensing of Environment, Submitted 5/2002. Smith, M. O., P. E. Johnson, and J. B. Adams, 1985, Quantitative determination of mineral types and abundances from reflectance spectra using principal component analysis, J. Geophys. Res., 90, Smith, M. O., S. L. Ustin, J. B. Adams, and A. R. Gillespie, 1990, Vegetation in deserts: I. A measure of abundance from multispectral images, Remote Sensing of Environment, 31, 1-26.
Multiresolution Analysis of Urban Reflectance
 Multiresolution Analysis of Urban Reflectance Christopher Small Lamont Doherty Earth Observatory Columbia University Palisades, NY 10964 USA small@ldeo.columbia.edu Reprinted from: IEEE/ISPRS joint Workshop
Spatiotemporal Monitoring of Urban Vegetation
 Spatiotemporal Monitoring of Urban Vegetation Christopher Small Lamont Doherty Earth Observatory, Columbia University, USA small@ldeo.columbia.edu Roberta Balstad Miller CIESIN Columbia University, USA
Hyperspectral Data as a Tool for Mineral Exploration
 1 Hyperspectral Data as a Tool for Mineral Exploration Nahid Kavoosi, PhD candidate of remote sensing kavoosyn@yahoo.com Nahid Kavoosi Abstract In Geology a lot of minerals and rocks have characteristic
HYPERSPECTRAL IMAGING
 1 HYPERSPECTRAL IMAGING Lecture 9 Multispectral Vs. Hyperspectral 2 The term hyperspectral usually refers to an instrument whose spectral bands are constrained to the region of solar illumination, i.e.,
A COMPARISON OF SPECTRAL MIXTURE ANALYSIS METHODS FOR URBAN LANDSCAPE USING LANDSAT ETM+ DATA: LOS ANGELES, CA
 A COMPARISO OF SPECTRAL MIXTURE AALYSIS METHODS FOR URBA LADSCAPE USIG LADSAT ETM+ DATA: LOS AGELES, CA Xianfeng Chen a and Lin Li b a Slippery Rock University of Pennsylvania, Slippery Rock, PA 657, USA
Urban remote sensing: from local to global and back
 Urban remote sensing: from local to global and back Paolo Gamba University of Pavia, Italy A few words about Pavia Historical University (1361) in a nice town slide 3 Geoscience and Remote Sensing Society
Mineral Mapping with AVIRIS and EO-1 Hyperion **
 Mineral Mapping with AVIRIS and EO-1 Hyperion ** Fred A. Kruse 1 1.0 Introduction Imaging Spectrometry data or Hyperspectral Imagery (HSI) acquired using airborne systems have been used in the geologic
Remote sensing of sealed surfaces and its potential for monitoring and modeling of urban dynamics
 Remote sensing of sealed surfaces and its potential for monitoring and modeling of urban dynamics Frank Canters CGIS Research Group, Department of Geography Vrije Universiteit Brussel Herhaling titel van
GNR401 Principles of Satellite Image Processing
 Principles of Satellite Image Processing Instructor: Prof. CSRE, IIT Bombay bkmohan@csre.iitb.ac.in Slot 5 Guest Lecture PCT and Band Arithmetic November 07, 2012 9.30 AM 10.55 AM IIT Bombay Slide 1 November
SPECTROMETRY AND HYPERSPECTRAL REMOTE SENSING OF URBAN ROAD INFRASTRUCTURE. Martin Herold, Margaret E. Gardner, Val Noronha and. Dar A.
 SPECTROMETRY AND HYPERSPECTRAL REMOTE SENSING OF URBAN ROAD INFRASTRUCTURE Martin Herold, Margaret E. Gardner, Val Noronha and Dar A. Roberts Introduction Detailed and accurate information about the road
Urban Mapping & Change Detection. Sebastian van der Linden Humboldt-Universität zu Berlin, Germany
 Urban Mapping & Change Detection Sebastian van der Linden Humboldt-Universität zu Berlin, Germany Introduction - The urban millennium Source: United Nations Introduction Text Source: Google Earth Introduction
A Quantitative and Comparative Analysis of Linear and Nonlinear Spectral Mixture Models Using Radial Basis Function Neural Networks
 2314 IEEE TRANSACTIONS ON GEOSCIENCE AND REMOTE SENSING, VOL. 39, NO. 8, AUGUST 2001 Pasadena, CA for the use of their data. They would also like to acknowledge the useful comments by one anonymous reviewer.
URBAN MAPPING AND CHANGE DETECTION
 URBAN MAPPING AND CHANGE DETECTION Sebastian van der Linden with contributions from Akpona Okujeni Humboldt-Unveristät zu Berlin, Germany Introduction Introduction The urban millennium Source: United Nations,
SOIL MINERALOGY ANOMALY DETECTION IN DIXIE VALLEY, NEVADA USING HYPERSPECTRAL DATA
 PROCEEDINGS: Twenty-Seventh Workshop on Geothermal Reservoir Engineering Stanford University, Stanford, California, January 28-30, 2002 SGP-TR-171 SOIL MINERALOGY ANOMALY DETECTION IN DIXIE VALLEY, NEVADA
Vegetation Change Detection of Central part of Nepal using Landsat TM
 Vegetation Change Detection of Central part of Nepal using Landsat TM Kalpana G. Bastakoti Department of Geography, University of Calgary, kalpanagb@gmail.com Abstract This paper presents a study of detecting
MODULE 5 LECTURE NOTES 5 PRINCIPAL COMPONENT ANALYSIS
 MODULE 5 LECTURE NOTES 5 PRINCIPAL COMPONENT ANALYSIS. (PCA) Principal component analysis (PCA), also known as Karhunen-Loeve analysis, transforms the information inherent in multispectral remotely sensed
Learning Objectives. Thermal Remote Sensing. Thermal = Emitted Infrared
 November 2014 lava flow on Kilauea (USGS Volcano Observatory) (http://hvo.wr.usgs.gov) Landsat-based thermal change of Nisyros Island (volcanic) Thermal Remote Sensing Distinguishing materials on the ground
Many of remote sensing techniques are generic in nature and may be applied to a variety of vegetated landscapes, including
 Remote Sensing of Vegetation Many of remote sensing techniques are generic in nature and may be applied to a variety of vegetated landscapes, including 1. Agriculture 2. Forest 3. Rangeland 4. Wetland,
Estimation of Wavelet Based Spatially Enhanced Evapotranspiration Using Energy Balance Approach
 Estimation of Wavelet Based Spatially Enhanced Evapotranspiration Using Energy Balance Approach Dr.Gowri 1 Dr.Thirumalaivasan 2 1 Associate Professor, Jerusalem College of Engineering, Department of Civil
CHARACTERIZATION OF THE LAND-COVER AND LAND-USE BY SHAPE DESCRITORS IN TWO AREAS IN PONTA GROSSA, PR, BR. S. R. Ribeiro¹*, T. M.
 CHARACTERIZATION OF THE LAND-COVER AND LAND-USE BY SHAPE DESCRITORS IN TWO AREAS IN PONTA GROSSA, PR, BR S. R. Ribeiro¹*, T. M. Hamulak 1 1 Department of Geography, State University of Ponta Grossa, Brazil
Alteration zone Mapping in the Meiduk and Sar Cheshmeh Porphyry Copper Mining Districts of Iran using Advanced Land Imager (ALI) Satellite Data
 Satellite Data") Alteration zone Mapping in the Meiduk and Sar Cheshmeh Porphyry Copper Mining Districts of Iran using Advanced Land Imager (ALI) Satellite Data Amin Beiranvand Pour*, Mazlan Hashim Geoscience and Digital
Alteration zone Mapping in the Meiduk and Sar Cheshmeh Porphyry Copper Mining Districts of Iran using Advanced Land Imager (ALI) Satellite Data Amin Beiranvand Pour*, Mazlan Hashim Geoscience and Digital
NASA s Airborne Visible/Infrared Imaging Spectrometer (AVIRIS) AVIRIS: PEARL HARBOR, HAWAII
 AVIRIS: PEARL HARBOR, HAWAII") AVIRIS: PEARL HARBOR, HAWAII 000412 NASA s Airborne Visible/Infrared Imaging Spectrometer (AVIRIS) LCLUC Update Robert O. Green (Tom Chrien, presenting) Jet Propulsion Laboratory Overview Objective & Approach
AVIRIS: PEARL HARBOR, HAWAII 000412 NASA s Airborne Visible/Infrared Imaging Spectrometer (AVIRIS) LCLUC Update Robert O. Green (Tom Chrien, presenting) Jet Propulsion Laboratory Overview Objective & Approach
Urban Mapping. Sebastian van der Linden, Akpona Okujeni, Franz Schug 11/09/2018
 Urban Mapping Sebastian van der Linden, Akpona Okujeni, Franz Schug 11/09/2018 Introduction to urban remote sensing Introduction The urban millennium Source: United Nations, 2014 Urban areas mark extremes
Sparse Representation-based Analysis of Hyperspectral Remote Sensing Data
 Sparse Representation-based Analysis of Hyperspectral Remote Sensing Data Ribana Roscher Institute of Geodesy and Geoinformation Remote Sensing Group, University of Bonn 1 Remote Sensing Image Data Remote
Defining microclimates on Long Island using interannual surface temperature records from satellite imagery
 Defining microclimates on Long Island using interannual surface temperature records from satellite imagery Deanne Rogers*, Katherine Schwarting, and Gilbert Hanson Dept. of Geosciences, Stony Brook University,
Impacts of Atmospheric Corrections on Algal Bloom Detection Techniques
 1 Impacts of Atmospheric Corrections on Algal Bloom Detection Techniques Ruhul Amin, Alex Gilerson, Jing Zhou, Barry Gross, Fred Moshary and Sam Ahmed Optical Remote Sensing Laboratory, the City College
URBAN LAND COVER AND LAND USE CLASSIFICATION USING HIGH SPATIAL RESOLUTION IMAGES AND SPATIAL METRICS
 URBAN LAND COVER AND LAND USE CLASSIFICATION USING HIGH SPATIAL RESOLUTION IMAGES AND SPATIAL METRICS Ivan Lizarazo Universidad Distrital, Department of Cadastral Engineering, Bogota, Colombia; ilizarazo@udistrital.edu.co
Coastal Characterization Using EO-1 Hyperion Data
 Coastal Characterization Using EO-1 Hyperion Data Dr. Hsiao-hua K. Burke EO-1 SVT Meeting 18-21 November 2002 Sponsor: NOAA NESDIS GOES 2002-1 Channel Positions of Various Ocean- Color Sensors, 1978-2000*
Urban Growth Analysis: Calculating Metrics to Quantify Urban Sprawl
 Urban Growth Analysis: Calculating Metrics to Quantify Urban Sprawl Jason Parent jason.parent@uconn.edu Academic Assistant GIS Analyst Daniel Civco Professor of Geomatics Center for Land Use Education
Research Article A Quantitative Assessment of Surface Urban Heat Islands Using Satellite Multitemporal Data over Abeokuta, Nigeria
 International Atmospheric Sciences Volume 2016, Article ID 3170789, 6 pages http://dx.doi.org/10.1155/2016/3170789 Research Article A Quantitative Assessment of Surface Urban Heat Islands Using Satellite
Lênio Soares Galvão Raimundo Almeida Filho Ícaro Vitorello
 Use of ASTER short-wave infrared bands for the spectral discrimination of hydrothermally altered-materials: evaluation in a tropical savannah environment Lênio Soares Galvão Raimundo Almeida Filho Ícaro
Hyperspectral Atmospheric Correction
 Hyperspectral Atmospheric Correction Bo-Cai Gao June 2015 Remote Sensing Division Naval Research Laboratory, Washington, DC USA BACKGROUND The concept of imaging spectroscopy, or hyperspectral imaging,
Exploring the Use of Urban Greenspace through Cellular Network Activity
 Exploring the Use of Urban Greenspace through Cellular Network Activity Ramón Cáceres 1, James Rowland 1, Christopher Small 2, and Simon Urbanek 1 1 AT&T Labs Research, Florham Park, NJ, USA {ramon,jrr,urbanek}@research.att.com
GEOG 4110/5100 Advanced Remote Sensing Lecture 12. Classification (Supervised and Unsupervised) Richards: 6.1, ,
 Richards: 6.1, ,") GEOG 4110/5100 Advanced Remote Sensing Lecture 12 Classification (Supervised and Unsupervised) Richards: 6.1, 8.1-8.8.2, 9.1-9.34 GEOG 4110/5100 1 Fourier Transforms Transformations in the Frequency Domain
GEOG 4110/5100 Advanced Remote Sensing Lecture 12 Classification (Supervised and Unsupervised) Richards: 6.1, 8.1-8.8.2, 9.1-9.34 GEOG 4110/5100 1 Fourier Transforms Transformations in the Frequency Domain
GEOG 4110/5100 Advanced Remote Sensing Lecture 15
 GEOG 4110/5100 Advanced Remote Sensing Lecture 15 Principal Component Analysis Relevant reading: Richards. Chapters 6.3* http://www.ce.yildiz.edu.tr/personal/songul/file/1097/principal_components.pdf *For
Progress Report Year 2, NAG5-6003: The Dynamics of a Semi-Arid Region in Response to Climate and Water-Use Policy
 Progress Report Year 2, NAG5-6003: The Dynamics of a Semi-Arid Region in Response to Climate and Water-Use Policy Principal Investigator: Dr. John F. Mustard Department of Geological Sciences Brown University
Remote Sensing Based Inversion of Gap Fraction for Determination of Leaf Area Index. Alemu Gonsamo 1 and Petri Pellikka 1
 Remote Sensing Based Inversion of Gap Fraction for Determination of Leaf Area Index Alemu Gonsamo and Petri Pellikka Department of Geography, University of Helsinki, P.O. Box, FIN- Helsinki, Finland; +-()--;
Figure S1. CRISM maps of modeled mineralogy projected over CTX imagery (same
 GSA DATA REPOSITORY 2015222 Cannon and Mustard Additional examples Figure S1. CRISM maps of modeled mineralogy projected over CTX imagery (same parameters as Figure 1). A: Taytay Crater (CRISM ID: HRL00005B77).
A COMPARISON BETWEEN DIFFERENT PIXEL-BASED CLASSIFICATION METHODS OVER URBAN AREA USING VERY HIGH RESOLUTION DATA INTRODUCTION
 A COMPARISON BETWEEN DIFFERENT PIXEL-BASED CLASSIFICATION METHODS OVER URBAN AREA USING VERY HIGH RESOLUTION DATA Ebrahim Taherzadeh a, Helmi Z.M. Shafri a, Seyed Hassan Khalifeh Soltani b, Shattri Mansor
Module 2.1 Monitoring activity data for forests using remote sensing
 Module 2.1 Monitoring activity data for forests using remote sensing Module developers: Frédéric Achard, European Commission (EC) Joint Research Centre (JRC) Jukka Miettinen, EC JRC Brice Mora, Wageningen
Change Detection Methods Using Band Ratio and Raster to Vector Transform
 Change Detection Methods Using Band Ratio and Raster to Vector Transform Gheidaa Sabeeh Al-Hassany Remote sensing Unit, College of Science, University of Baghdad, Baghdad, Iraq Gheida2009@yahoo.com Abstract
Undergraduate Research Final Report: Estimation of suspended sediments using MODIS 250 m bands in Mayagüez Bay, Puerto Rico
 Undergraduate Research Final Report: Estimation of suspended sediments using MODIS 250 m bands in Mayagüez Bay, Puerto Rico Abstract: José F. Martínez Colón Undergraduate Research 2007 802-03-4097 Advisor:
SPECTRAL DISCRIMINATION OF ROCK TYPES IN THE ARAVALLI MOUNTAIN RANGES OF RAJASTHAN (INDIA) USING LANDSAT THEMATIC MAPPER DATA
 USING LANDSAT THEMATIC MAPPER DATA") SPECTRAL DISCRIMINATION OF ROCK TYPES IN THE ARAVALLI MOUNTAIN RANGES OF RAJASTHAN (INDIA) USING LANDSAT THEMATIC MAPPER DATA Dr. Nilanchal Patel Reader, Department of Remote Sensing Birla Institute of
SPECTRAL DISCRIMINATION OF ROCK TYPES IN THE ARAVALLI MOUNTAIN RANGES OF RAJASTHAN (INDIA) USING LANDSAT THEMATIC MAPPER DATA Dr. Nilanchal Patel Reader, Department of Remote Sensing Birla Institute of
Spectral Mixture Analysis of EO-1 Hyperion Imagery focused on the Spatial-Temporal Variability of the Amazon Floodplain Multicomponental Waters
 Spectral Mixture Analysis of EO-1 Hyperion Imagery focused on the Spatial-Temporal Variability of the Amazon Floodplain Multicomponental Waters Conrado de Moraes Rudorff 1 Evlyn Márcia Leão de Moraes Novo
A DATA FIELD METHOD FOR URBAN REMOTELY SENSED IMAGERY CLASSIFICATION CONSIDERING SPATIAL CORRELATION
 The International Archives of the Photogrammetry, Remote Sensing and Spatial Information Sciences, Volume XLI-B7, 016 XXIII ISPRS Congress, 1 19 July 016, Prague, Czech Republic A DATA FIELD METHOD FOR
Lesson 4b Remote Sensing and geospatial analysis to integrate observations over larger scales
 Lesson 4b Remote Sensing and geospatial analysis to integrate observations over larger scales We have discussed static sensors, human-based (participatory) sensing, and mobile sensing Remote sensing: Satellite
An Automated Object-Oriented Satellite Image Classification Method Integrating the FAO Land Cover Classification System (LCCS).
.") An Automated Object-Oriented Satellite Image Classification Method Integrating the FAO Land Cover Classification System (LCCS). Ruvimbo Gamanya Sibanda Prof. Dr. Philippe De Maeyer Prof. Dr. Morgan De
An Automated Object-Oriented Satellite Image Classification Method Integrating the FAO Land Cover Classification System (LCCS). Ruvimbo Gamanya Sibanda Prof. Dr. Philippe De Maeyer Prof. Dr. Morgan De
Improvement of Urban Impervious Surface Estimation in Shanghai Using Landsat7 ETM+ Data
 Chin. Geogra. Sci. 2009 19(3) 283 290 DOI: 10.1007/s11769-009-0283-x www.springerlink.com Improvement of Urban Impervious Surface Estimation in Shanghai Using Landsat7 ETM+ Data (Department of Land Management,
EMPIRICAL ESTIMATION OF VEGETATION PARAMETERS USING MULTISENSOR DATA FUSION
 EMPIRICAL ESTIMATION OF VEGETATION PARAMETERS USING MULTISENSOR DATA FUSION Franz KURZ and Olaf HELLWICH Chair for Photogrammetry and Remote Sensing Technische Universität München, D-80290 Munich, Germany
Drought Estimation Maps by Means of Multidate Landsat Fused Images
 Remote Sensing for Science, Education, Rainer Reuter (Editor) and Natural and Cultural Heritage EARSeL, 2010 Drought Estimation Maps by Means of Multidate Landsat Fused Images Diego RENZA, Estíbaliz MARTINEZ,
Deriving Uncertainty of Area Estimates from Satellite Imagery using Fuzzy Land-cover Classification
 International Journal of Information and Computation Technology. ISSN 0974-2239 Volume 3, Number 10 (2013), pp. 1059-1066 International Research Publications House http://www. irphouse.com /ijict.htm Deriving
Fundamentals of Remote Sensing
 Division of Spatial Information Science Graduate School Life and Environment Sciences University of Tsukuba Fundamentals of Remote Sensing Prof. Dr. Yuji Murayama Surantha Dassanayake 10/6/2010 1 Fundamentals
Seek of Specific Soils in Puerto Rico using IKONOS
 Geological Aplication of Remote Sensing Copyright 2004 Department of Geology University of Puerto Rico, Mayagüez Seek of Specific Soils in Puerto Rico using IKONOS D. HERNÁNDEZ University of Puerto Rico
Landuse and Landcover change analysis in Selaiyur village, Tambaram taluk, Chennai
 Landuse and Landcover change analysis in Selaiyur village, Tambaram taluk, Chennai K. Ilayaraja Department of Civil Engineering BIST, Bharath University Selaiyur, Chennai 73 ABSTRACT The synoptic picture
Fri. Apr. 14, Hewson paper: Geological Map using ASTER data Sabins Ch. 10 Oil Exploration Overview. Reading:
 Fri. Apr. 14, 2018 Hewson paper: Geological Map using ASTER data Sabins Ch. 10 Oil Exploration Overview Reading: Skim Sabins Chapter 10. Oil Exploration 1 Hewson et al. Objectives 1. 2. 3. 4. 5. 6. 7.
OBJECT BASED IMAGE ANALYSIS FOR URBAN MAPPING AND CITY PLANNING IN BELGIUM. P. Lemenkova
 Fig. 3 The fragment of 3D view of Tambov spatial model References 1. Nemtinov,V.A. Information technology in development of spatial-temporal models of the cultural heritage objects: monograph / V.A. Nemtinov,
Fractional Vegetation Cover Estimation from PROBA/CHRIS Data: Methods, Analysis of Angular Effects and Application to the Land Surface Emissivity
 Fractional Vegetation Cover Estimation from PROBA/CHRIS Data: Methods, Analysis of Angular Effects and Application to the Land Surface Emissivity J.C. Jiménez-Muñoz 1, J.A. Sobrino 1, L. Guanter 2, J.
Land cover/land use mapping and cha Mongolian plateau using remote sens. Title. Author(s) Bagan, Hasi; Yamagata, Yoshiki. Citation Japan.
 Bagan, Hasi; Yamagata, Yoshiki. Citation Japan.") Title Land cover/land use mapping and cha Mongolian plateau using remote sens Author(s) Bagan, Hasi; Yamagata, Yoshiki International Symposium on "The Imp Citation Region Specific Systems". 6 Nove Japan.
Title Land cover/land use mapping and cha Mongolian plateau using remote sens Author(s) Bagan, Hasi; Yamagata, Yoshiki International Symposium on "The Imp Citation Region Specific Systems". 6 Nove Japan.
Directional Analysis and Filtering for Dust Storm detection in NOAA-AVHRR Imagery
 Directional Analysis and Filtering for Dust Storm detection in NOAA-AVHRR Imagery S. Janugani a,v.jayaram a,s.d.cabrera a,j.g.rosiles a,t.e.gill b,c,n.riverarivera b a Dept. of Electrical & Computer Engineering
A new perspective on aerosol direct radiative effects in South Atlantic and Southern Africa
 A new perspective on aerosol direct radiative effects in South Atlantic and Southern Africa Ian Chang and Sundar A. Christopher Department of Atmospheric Science University of Alabama in Huntsville, U.S.A.
AUTOMATED BUILDING DETECTION FROM HIGH-RESOLUTION SATELLITE IMAGE FOR UPDATING GIS BUILDING INVENTORY DATA
 13th World Conference on Earthquake Engineering Vancouver, B.C., Canada August 1-6, 2004 Paper No. 678 AUTOMATED BUILDING DETECTION FROM HIGH-RESOLUTION SATELLITE IMAGE FOR UPDATING GIS BUILDING INVENTORY
Object-based feature extraction of Google Earth Imagery for mapping termite mounds in Bahia, Brazil
 OPEN ACCESS Conference Proceedings Paper Sensors and Applications www.mdpi.com/journal/sensors Object-based feature extraction of Google Earth Imagery for mapping termite mounds in Bahia, Brazil Sunhui
GMES: calibration of remote sensing datasets
 GMES: calibration of remote sensing datasets Jeremy Morley Dept. Geomatic Engineering jmorley@ge.ucl.ac.uk December 2006 Outline Role of calibration & validation in remote sensing Types of calibration
Retrieval Algorithm Using Super channels
 Retrieval Algorithm Using Super channels Xu Liu NASA Langley Research Center, Hampton VA 23662 D. K. Zhou, A. M. Larar (NASA LaRC) W. L. Smith (HU and UW) P. Schluessel (EUMETSAT) Hank Revercomb (UW) Jonathan
Atmospheric Correction Using Hyperion
 Atmospheric Correction Using Hyperion Progress and Issues Investigation: Correlative Analysis of EO-1, Landsat, and Terra Data of the DOE ARM CART Sites: An Investigation of Instrument Performance and
AUTOMATISIERTE ZEITREIHENANALYSE VON FERNERKUNDUNGSDATEN FÜR DAS MONITORING VON OBERFLÄCHENGEWÄSSERN
 Place image here (10 x 3.5 ) AUTOMATISIERTE ZEITREIHENANALYSE VON FERNERKUNDUNGSDATEN FÜR DAS MONITORING VON OBERFLÄCHENGEWÄSSERN THOMAS BAHR & NICOLAI HOLZER 23. Workshop Arbeitskreis Umweltinformationssysteme
Time Series Analysis with SAR & Optical Satellite Data
 Time Series Analysis with SAR & Optical Satellite Data Thomas Bahr ESRI European User Conference Thursday October 2015 harris.com Motivation Changes in land surface characteristics mirror a multitude of
APPLICATIONS WITH METEOROLOGICAL SATELLITES. W. Paul Menzel. Office of Research and Applications NOAA/NESDIS University of Wisconsin Madison, WI
 APPLICATIONS WITH METEOROLOGICAL SATELLITES by W. Paul Menzel Office of Research and Applications NOAA/NESDIS University of Wisconsin Madison, WI July 2004 Unpublished Work Copyright Pending TABLE OF CONTENTS
KNOWLEDGE-BASED CLASSIFICATION OF LAND COVER FOR THE QUALITY ASSESSEMENT OF GIS DATABASE. Israel -
 KNOWLEDGE-BASED CLASSIFICATION OF LAND COVER FOR THE QUALITY ASSESSEMENT OF GIS DATABASE Ammatzia Peled a,*, Michael Gilichinsky b a University of Haifa, Department of Geography and Environmental Studies,
Making Accurate Field Spectral Reflectance Measurements By Dr. Alexander F. H. Goetz, Co-founder ASD Inc., Boulder, Colorado, 80301, USA October 2012
 Making Accurate Field Spectral Reflectance Measurements By Dr. Alexander F. H. Goetz, Co-founder ASD Inc., Boulder, Colorado, 80301, USA October 2012 Introduction Accurate field spectral reflectance measurements
District-level mineral survey using airborne hyperspectral data, Los Menucos, Argentina
 ANNALS OF GEOPHYSICS, VOL. 49, N. 1, February 2006 District-level mineral survey using airborne hyperspectral data, Los Menucos, Argentina Fred A. Kruse ( 1 ), Sandra L. Perry ( 2 ) and Alejandro Caballero
VISUALIZATION URBAN SPATIAL GROWTH OF DESERT CITIES FROM SATELLITE IMAGERY: A PRELIMINARY STUDY
 CO-439 VISUALIZATION URBAN SPATIAL GROWTH OF DESERT CITIES FROM SATELLITE IMAGERY: A PRELIMINARY STUDY YANG X. Florida State University, TALLAHASSEE, FLORIDA, UNITED STATES ABSTRACT Desert cities, particularly
Landsat-based Global Urban Area Map
 1. TITLE Landsat-based Global Urban Area Map Abbreviation Metadata Identifier Landsat-based Global Urban Area Map LaGURAM LaGURAM20160711142456-DIAS20160706142617-en 2. CONTACT 2.1 CONTACT on DATASET Hiroyuki
Principal Component Analysis (PCA) of AIRS Data
 of AIRS Data") Principal Component Analysis (PCA) of AIRS Data Mitchell D. Goldberg 1, Lihang Zhou 2, Walter Wolf 2 and Chris Barnet 1 NOAA/NESDIS/Office of Research and Applications, Camp Springs, MD 1 QSS Group Inc.
Principal Component Analysis (PCA) of AIRS Data Mitchell D. Goldberg 1, Lihang Zhou 2, Walter Wolf 2 and Chris Barnet 1 NOAA/NESDIS/Office of Research and Applications, Camp Springs, MD 1 QSS Group Inc.
Estimation of ocean contribution at the MODIS near-infrared wavelengths along the east coast of the U.S.: Two case studies
 GEOPHYSICAL RESEARCH LETTERS, VOL. 32, L13606, doi:10.1029/2005gl022917, 2005 Estimation of ocean contribution at the MODIS near-infrared wavelengths along the east coast of the U.S.: Two case studies
RESTORATION OF GERIS DATA USING THE MAXIMUM NOISE FRACTIONS TRANSFORM 1. Allan Aasbjerg Nielsen Rasmus Larsen
 RESTORATION OF GERIS DATA USING THE MAXIMUM NOISE FRACTIONS TRANSFORM 1 Allan Aasbjerg Nielsen Rasmus Larsen IMSOR Image Analysis Group Institute of Mathematical Modelling Technical University of Denmark,
Multi- and Hyperspectral Remote Sensing Change Detection with Generalized Difference Images by the IR-MAD Method
 Multi- and Hyperspectral Remote Sensing Change Detection with Generalized Difference Images y the IR-MAD Method Allan A. Nielsen Technical University of Denmark Informatics and Mathematical Modelling DK-2800
THE UTILITY OF HYPERSPECTRAL DATA ON EXPLORATION OF SANDSTONE-HOSTED URANIUM DEPOSITS *
 THE UTILITY OF HYPERSPECTRAL DATA ON EXPLORATION OF SANDSTONE-HOSTED URANIUM DEPOSITS * Jie-lin Zhang Beijing Research Institute of Uranium Geology Key Laboratory of Remote Sensing Beijing 100029, China,
DETECTING AIR POLLUTION FROM SPACE USING IMAGE-BASED METHOD
 DETECTING AIR POLLUTION FROM SPACE USING IMAGE-BASED METHOD D.G. Hadjimitsis 1, 2, 3 and C.R.I Clayton 2 1 Frederick Institute of Technology, Department of Civil Engineering, 7, Y. Frederickou St., Palouriotisa,
SNOW COVER MAPPING USING METOP/AVHRR DATA
 SNOW COVER MAPPING USING METOP/AVHRR DATA Niilo Siljamo, Markku Suomalainen, Otto Hyvärinen Finnish Meteorological Institute, Erik Palménin Aukio 1, FI-00101 Helsinki, Finland Abstract LSA SAF snow cover
Key words: Hyperspectral, imaging, object identification, urban, investigation
 URBAN SENSING BY HYPERSPECTRAL DATA Lanfen ZHENG, Qingxi TONG, Bing ZHANG, Xing LI, Jiangui LIU The Institute of Remote Sensing Applications, Chinese Academy of Sciences P. O. Box 9718, 100101, Beijing,
Impacts of sensor noise on land cover classifications: sensitivity analysis using simulated noise
 Impacts of sensor noise on land cover classifications: sensitivity analysis using simulated noise Scott Mitchell 1 and Tarmo Remmel 2 1 Geomatics & Landscape Ecology Research Lab, Carleton University,
Remote Sensing of Snow GEOG 454 / 654
 Remote Sensing of Snow GEOG 454 / 654 What crysopheric questions can RS help to answer? 2 o Where is snow lying? (Snow-covered area or extent) o How much is there? o How rapidly is it melting? (Area, depth,
GEO 874 Remote Sensing. Zihan Lin, Nafiseh Hagtalab, Ranjeet John
 GEO 874 Remote Sensing Zihan Lin, Nafiseh Hagtalab, Ranjeet John http://onlinelibrary.wiley.com/doi/10.1002/wat2.1147/full Landscape Heterogeneity S-I: homogeneous landscape using only cropland for the
1. Introduction. Chaithanya, V.V. 1, Binoy, B.V. 2, Vinod, T.R. 2. Publication Date: 8 April DOI: https://doi.org/ /cloud.ijarsg.
 Cloud Publications International Journal of Advanced Remote Sensing and GIS 2017, Volume 6, Issue 1, pp. 2088-2096 ISSN 2320 0243, Crossref: 10.23953/cloud.ijarsg.112 Research Article Open Access Estimation
Hyperspectral image classification using Support Vector Machine
 Journal of Physics: Conference Series OPEN ACCESS Hyperspectral image classification using Support Vector Machine To cite this article: T A Moughal 2013 J. Phys.: Conf. Ser. 439 012042 View the article
International Journal of Remote Sensing, in press, 2006.
 International Journal of Remote Sensing, in press, 2006. Parameter Selection for Region-Growing Image Segmentation Algorithms using Spatial Autocorrelation G. M. ESPINDOLA, G. CAMARA*, I. A. REIS, L. S.
Overview of Remote Sensing in Natural Resources Mapping
 Overview of Remote Sensing in Natural Resources Mapping What is remote sensing? Why remote sensing? Examples of remote sensing in natural resources mapping Class goals What is Remote Sensing A remote sensing
Comparison between Land Surface Temperature Retrieval Using Classification Based Emissivity and NDVI Based Emissivity
 Comparison between Land Surface Temperature Retrieval Using Classification Based Emissivity and NDVI Based Emissivity Isabel C. Perez Hoyos NOAA Crest, City College of New York, CUNY, 160 Convent Avenue,
Change Detection Over Sokolov Open Pit Mine Areas, Czech Republic, Using Multi Temporal HyMAP Data ( )
") Change Detection Over Sokolov Open Pit Mine Areas, Czech Republic, Using Multi Temporal HyMAP Data (2009 2010) S. Adar* a G. Notesco b, A. Brook b, I. Livne b, P. Rojik c, V. Kopackova d, K. Zelenkova
Change Detection Over Sokolov Open Pit Mine Areas, Czech Republic, Using Multi Temporal HyMAP Data (2009 2010) S. Adar* a G. Notesco b, A. Brook b, I. Livne b, P. Rojik c, V. Kopackova d, K. Zelenkova
International Journal of Intellectual Advancements and Research in Engineering Computations
 ISSN:2348-2079 Volume-5 Issue-2 International Journal of Intellectual Advancements and Research in Engineering Computations Agricultural land investigation and change detection in Coimbatore district by
METRIC tm. Mapping Evapotranspiration at high Resolution with Internalized Calibration. Shifa Dinesh
 METRIC tm Mapping Evapotranspiration at high Resolution with Internalized Calibration Shifa Dinesh Outline Introduction Background of METRIC tm Surface Energy Balance Image Processing Estimation of Energy
Applications of Remote Sensing Systems. to MINERAL DEPOSIT DISCOVERY, DEVELOPMENT
 REMS 6022: Term Project Applications of Remote Sensing Systems to MINERAL DEPOSIT DISCOVERY, DEVELOPMENT and RECLAMATION Venessa Bennett OVERVIEW Remote Sensing data extensively used in all aspects of
AGOG 485/585 /APLN 533 Spring Lecture 5: MODIS land cover product (MCD12Q1). Additional sources of MODIS data
. Additional sources of MODIS data") AGOG 485/585 /APLN 533 Spring 2019 Lecture 5: MODIS land cover product (MCD12Q1). Additional sources of MODIS data Outline Current status of land cover products Overview of the MCD12Q1 algorithm Mapping
AGOG 485/585 /APLN 533 Spring 2019 Lecture 5: MODIS land cover product (MCD12Q1). Additional sources of MODIS data Outline Current status of land cover products Overview of the MCD12Q1 algorithm Mapping
IR-MAD Iteratively Re-weighted Multivariate Alteration Detection
 IR-MAD Iteratively Re-weighted Multivariate Alteration Detection Nielsen, A. A., Conradsen, K., & Simpson, J. J. (1998). Multivariate Alteration Detection (MAD) and MAF Postprocessing in Multispectral,
Remote sensing Based Assessment of Urban Heat Island Phenomenon in Nagpur Metropolitan Area
 International Journal of Information & Computation Technology. ISSN 0974-2239 Volume 4, Number 11 (2014), pp. 1069-1074 International Research Publications House http://www. irphouse.com Remote sensing
Assessing Drought in Agricultural Area of central U.S. with the MODIS sensor
 Assessing Drought in Agricultural Area of central U.S. with the MODIS sensor Di Wu George Mason University Oct 17 th, 2012 Introduction: Drought is one of the major natural hazards which has devastating
DETECTING HUMAN ACTIVITIES IN THE ARCTIC OCEAN BY CONSTRUCTING AND ANALYZING SUPER-RESOLUTION IMAGES FROM MODIS DATA INTRODUCTION
 DETECTING HUMAN ACTIVITIES IN THE ARCTIC OCEAN BY CONSTRUCTING AND ANALYZING SUPER-RESOLUTION IMAGES FROM MODIS DATA Shizhi Chen and YingLi Tian Department of Electrical Engineering The City College of
12.2 Dimensionality Reduction
 510 Chapter 12 of this dimensionality problem, regularization techniques such as SVD are almost always needed to perform the covariance matrix inversion. Because it appears to be a fundamental property
Parameter selection for region-growing image segmentation algorithms using spatial autocorrelation
 International Journal of Remote Sensing Vol. 27, No. 14, 20 July 2006, 3035 3040 Parameter selection for region-growing image segmentation algorithms using spatial autocorrelation G. M. ESPINDOLA, G. CAMARA*,