Smart Cities, Data and Big Data
|
|
|
- Caitlin George
- 6 years ago
- Views:
Transcription
1 Urban and Regional Planning for Urban Design October 2015 Smart Cities, Data and Big Data Michael
2 FIRST DATA, THEN BIG DATA
3 DATA Numeric, Ordinal, Nominal Quantitative, Qualitative Spatial, Non Spatial, People, Places Individual or Aggregated Collected by Questionnaire or by Sensor Large Scale, Small Scale Individual
4 Urban Analytics: to process data Databases Excel, SQL and so on GIS geographic information systems Statistical methods for developing summaries of data insights into data and also patterns in data Data mining multivariate technical Spatial scale Archives, Portals, Depositories, Servers,
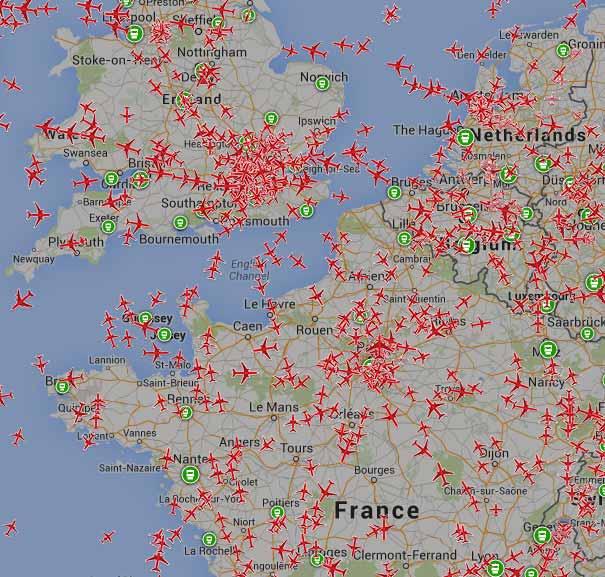
5 BIG DATA AFirst couple of examples about what smart cities are all about Real time, streamed data and this is big First, An example from public transport in London where smart card data is now key Second, about online aircraft flight data


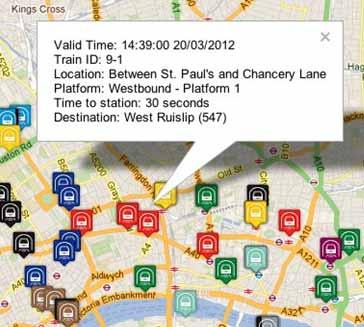
6 Smart Card Data Oyster Card Taps Tap at start and end of train journeys Tap at start only on buses Accepted at 695 Underground and rail stations, and on thousands of buses 991 million Oyster Card taps over Summer 2012 this is big data

7
8

9 And how can we make sense of this
10

11


12


13
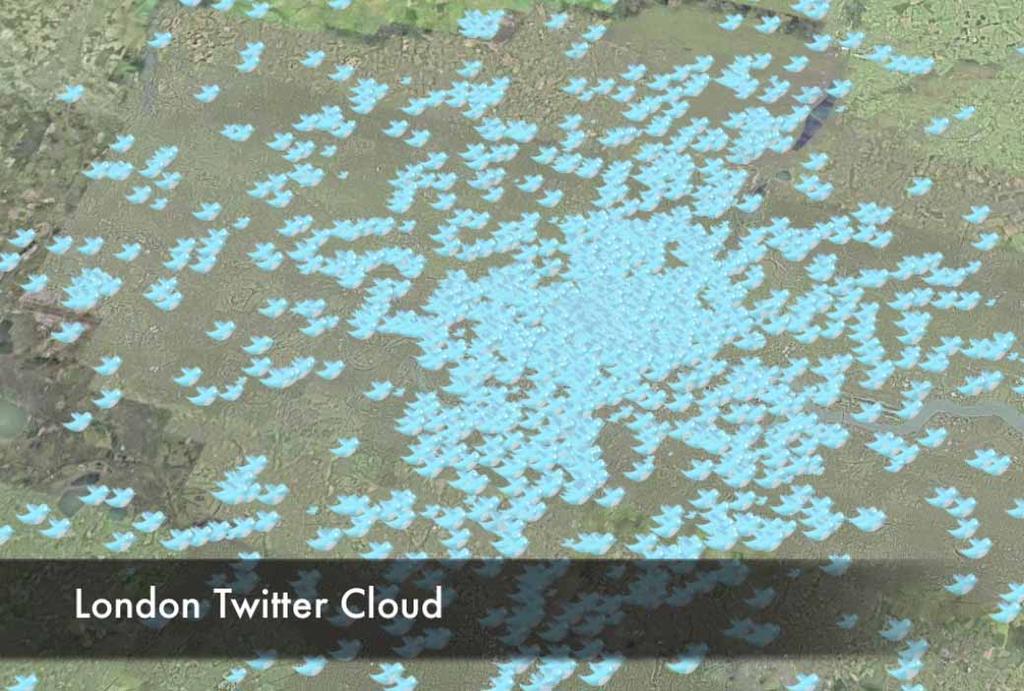
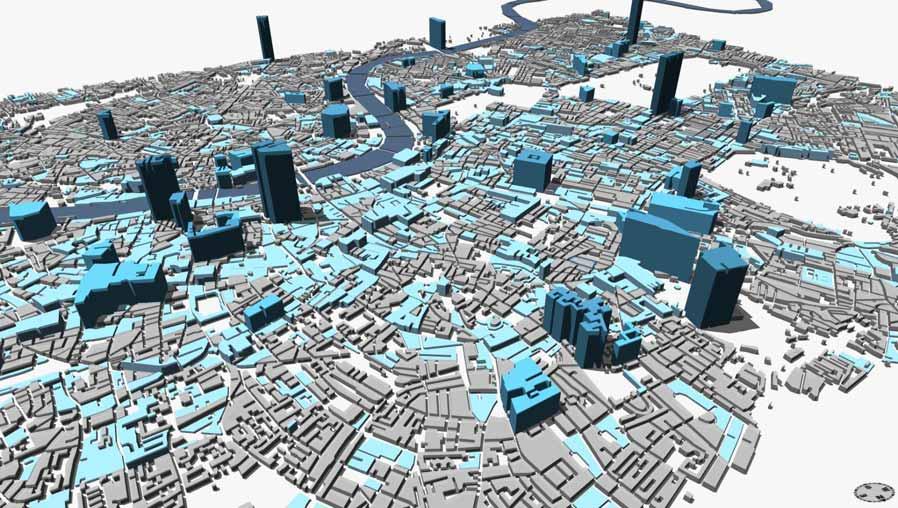
14 Visualisation is all important in making sense of big data Real time, streamed data is usually unstructured it does not come in a form that is already ordered To find patterns in it, we need to visualise it making it a little more abstract Let me show you some patterns that are clear when we visualise in 3D


15

16 Flooding from our 3D Virtual London Model


17 Shifts in Traffic Accessibility if all Bridges across the Thames are Inoperable as far West as Hammersmith
18 I will return to my subway example using the Oyster card data We can do many things with this and one of the key things is to understand how different kinds of passengers travel We have just visualised the movement patterns over one day for disabled free pass travellers which can be identified in the data
19


20 Oyster Card Data interpreting urban structure, multitrips, etc.

21 Entries Exits
22 Particular Events: Weekdays, Saturdays and Sundays Entry at Camden Town (10 Mn. Intervals) Weekday Saturday Sunday Entry at Arsenal (10 Mn. Intervals) Weekday Saturday Sunday Number of Events Number of Events Events Nightlife am 4am 6am 8am 10am 12pm 2pm 4pm 6pm 8pm 10pm 12am 2am 4am Time of Day 100 2am 4am 6am 8am 10am 12pm 2pm 4pm 6pm 8pm 10pm 12am 2am 4am Time of Day Entry at Bank (10 Mn. Intervals) Weekday Saturday Sunday 150 Entry at Bayswater (10 Mn. Intervals) Weekday Saturday Sunday Number of Events Number of Events Work Tourism? am 4am 6am 8am 10am 12pm 2pm 4pm 6pm 8pm 10pm 12am 2am 4am Time of Day 2am 4am 6am 8am 10am 12pm 2pm 4pm 6pm 8pm 10pm 12am 2am 4am Time of Day 150

23 Circle and District line part closure From Edgware Road to Aldgate/Aldgate East 19 th July :49 to 12: Oyster Cards with regular pattern during disrupted time period travelled


24 Increased Travel Time Greater than 2SD above mean increase on usual travel time for that Oyster Card Size equal to proportion of users that regularly travel from station during time period, and travelled that during disruption

25 The Public Transport System in Terms of Vehicle Flows


26

27


28 Delays from Tube, National Rail and Bus Fused Key National Rail more than 5 minutes late Tube stations showing a wait time 15% above expected Tuesday 9 October 10:30 Bus stops showing a wait time 20% above expected Tube delays from the TfL status feed are also plotted as lines

29 Tube, Overground and National Rail Networks in London where Oyster cards can be used


30 Just to bring us academics back to earth we need to write our papers on all this stuff in learned journals so here are some examples Here is a digression into our alchemy We did a paper in 2011 with Marc Barthelemy in PLOS One We have done a paper recently with Chen Zhong for the Easy Link data in Singapore


31 We are currently using information theory to figure out how much information from trips is transmitted from station to station through time by working out how many passengers are in stations or on trains in stations over time. We are using the concept of transfer entropy to do this. I don t have time to say much about this but here is a picture about this for one line in London
32 Second we are working with the Oyster data again with Melanie Bosredon in out group and Marc Barthelemy in Paris on extracting clusters from the travel data using a new method of defining intensity. I will show this as a simple movie of origin and destination intensities as they change over time of day.
33

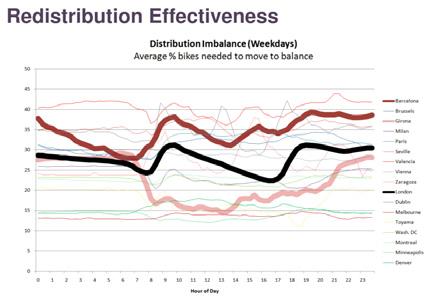
34 A lot of data is now coming online for travel and one of our group Oliver O Brien has some 97 bike schemes world wide for which he has online data in real time Bikes Data 4200 bikes, started Nov 2010, all the data everything all trips, all times, all stations/docks

35


36 The Website: Real Time Visualisation of Origins and Destinations Activity
37
38 We are collecting some of this real time data together in one stop portals City Dashboards And here is our example for London but we have some other cities too such as Manchester, Bristol and so on


39
40 I will change tack to finish and talk about data that we generate ourselves We can use the power of the web to collect data with a spatial or travel reference using what is called crowdsourcing We can use data from hand held devices which pertain to movement as Laslo indicated in the previous talk


41 23,475 responses April, May, June 2008 A new credit crunch survey started in October and currently has 3,802 responses.


42


43 BBC Look East: Anti Social Behaviour July, August, September ,902 responses


44 Manchester Congestion Charge 15,902 responses October to December 2008
45


46 New York London Paris Moscow

47
48
49

50
51 So Data is very diverse and you need powerful tools to analyze it Powerful methods to visualise it And of course it is the essence of modelling, simulation and predictions Next week networks and communications
52 Thanks Acknowledgements Andy Hudson Smith, Melanie Bosredon, Gareth Simmonds, Roberto Murcio, Richard Milton, Oliver O Brien, Stephen Gray, Fabian Neuhaus, Pete Ferguson, Martin Austwick, Joan Serras, Camilo Vargas Ruiz, Paul Longley, Jon Reades, Ed Manley, Anders Johansson, Flora Roumpani and Stephan Hugel


53 Some of our books which are about some of this
54 Urban and Regional Planning for Urban Design October 2015 Networks, Communications & Cities Michael
55 Outline What are Networks in Cities: A Little Bit of History A Question of Spatial Scale: Planarity v Topology Down At Street Level: Space Syntax Urban Transport Infrastructures Throwing Out the Planarity Growing Networks Flows on Networks: Scale Again Local to Global The Mathematics and Beyond An Indulgent and Interesting Example to Finish
56 What are Networks in Cities: A Little Bit of History Haggett and Chorley s famous book Network Analysis in Geography 1969 about rivers, transport networks, and flow systems of all kinds that permeated geographical Euclidean space but it was linked very strongly to location as well as interaction. Networks in this sense dealt with flows and their infrastructure as arcs and nodes. Graph theory essentially was discovered in these fields But these two worlds of flows and graphs were separate. Let me show you these contrasts by way of introduction
57


58


59
60 A Question of Spatial Scale: Planarity v Topology Essentially at the fine scale, in cities we deal with Euclidean space but as we aggregate in terms of spatial scale, we abstract and space although rooted in the 2 or 3 dimensional world becomes a world of points and lines. In short we move from planar graphs such as street networks to graphs of flows between cities, which can be treated topologically Network science which developed well after this early forays into graph theory in the 1960s such as those by Haggett and Chorley, has largely eschewed planarity but it is coming.


61
62 Down At Street Level: Space Syntax


63

64 There are a couple of chapters on this in my book The New Science of Cities and you can download the software from the CASA website


65 Urban Transport Infrastructures Network size: ~10 6 road nodes ~2x10 6 road links Extracted from Ordnance Survey s Integrated Transport Network Layer
66 Road network for Milton Keynes Network size: ~3x10 3 road nodes ~7x10 3 road links
67 Power laws in road networks topology Effective dimension Node betweenness centrality Link betweenness centrality

68 Throwing Out the Planarity


69


70 Historical Examples from Abercrombie s book Town and Country Planning (1935)

71 Note the flow of traffic and the pictogram or histogram of employment. Essential science supporting the physical plan

72

73


74 These clusters scale geometrically and their organization is fractal. This is fractal geometry where objects of the same shape exist at all scales


75
76


77 Network Data in the COSMIC project CASA Telecoms see article in PLoS ONE Wednesday this week


78 CASA Subway Data London Tube, and London data generally See forthcoming paper in PLoS ONE


79 Growing Networks

80 k=0 k=1 k=2 k=3


81 In essence, this is random walk in space which is can be likened to the diffusion of particles around a source but limited to remain within the influence of the source the city seed


82


83


84
85 Flows on Networks: Scale Again Local to Global There is an enormous amount of work on spatial interactio, largely separated from the underlying networks but conceived in terms of gravitational models which lie at the origins of social physics Many of these models are being developed in our group and I simply illustrate some snaps from our London land use transport model that we have built for the Tyndall Centre Climate Change Cities project These models predict flows on fixed networks which we have seen earlier for London

86

87


88 The Mathematics and Beyond Basically we are building various models of processes on such networks we want to develop some diffusion models of disease on networks, like the spread of the common cold in enclosed transportation spaces like the tube.


89 Above: Crowd Scenes and Emergency Vehicles at Hajj and in Notting Hill: Below: Our ABM of the Notting Hill Carnival

90 John Ward s ABM of Tourists & Shoppers in Covent Garden

91 My Indulgent and Final Example London Bikes Project Scraping Data: The London Bikes Experiment Locally called Boris s Bikes 4200 bikes, 340 stations, access via online registration or by paying on a credit card at the local bike station so all online data


92


93

94

95 As yet no records of demand from people logging on, so no management capabilities, but could happen probably from an App based software but maybe from the server

96


97

98 Some references which are accessible MIT Press, 2005 MIT Press, 2013
99 If there is time, Questions
Smart Cities & Big Data How We Can Make Cities More Resilient
 July 15 th 19 th 2012 University College Dublin Smart Cities & Big Data How We Can Make Cities More Resilient Michael Batty m.batty@ucl.ac.uk @jmichaelbatty http://www.spatialcomplexity.info/ http://www.casa.ucl.ac.uk/
Infrastructure to Explore Geographic Systems through Models and Maps
 Exemplar 1: GeoVUE Then GENeSIS (GENerative e SocIalScience) Infrastructure to Explore Geographic Systems through Models and Maps Michael Batty University College London m.batty@ucl.ac.uk http://www.casa.ucl.ac.uk/
Integrated Modelling of the Spatial Impacts of Climate Change In Greater London
 Megacities, Vulnerability and Global Climate Change: FAPESP: City of São Paulo, July 20 th 22 nd 2009 Integrated Modelling of the Spatial Impacts of Climate Change In Greater London Michael Batty University
Land Use Transportation Interaction Models
 Opening Lecture 2 September 4 th 2014 Land Use Transportation Interaction Models Michael Batty m.batty@ucl.ac.uk @michaelbatty http://www.complexcity.info/ http://www.spatialcomplexity.info/ Outline Preliminary
COSMIC: COmplexity in Spatial dynamic
 COSMIC: COmplexity in Spatial dynamic MICs 9 10 November, Brussels Michael Batty University College London m.batty@ucl.ac.uk http://www.casa.ucl.ac.uk/ Outline The Focus of the Pilot The Partners: VU,
Land Use Transportation Interaction Models
 July 27- August 2, 2014 Land Use Transportation Interaction Models Michael Batty m.batty@ucl.ac.uk @michaelbatty http://www.complexcity.info/ http://www.spatialcomplexity.info/ Outline Preliminary Ideas:
A Land Use Transport Model for Greater London:
 Spatio-Temporal Analysis of Network Data and Road Developments Launch Event Workshop UCL Monday 18 May 2009 A Land Use Transport Model for Greater London: With Applications to an Integrated Assessment
Exploring the Patterns of Human Mobility Using Heterogeneous Traffic Trajectory Data
 Exploring the Patterns of Human Mobility Using Heterogeneous Traffic Trajectory Data Jinzhong Wang April 13, 2016 The UBD Group Mobile and Social Computing Laboratory School of Software, Dalian University
1. Richard Milton 2. Steven Gray 3. Oliver O Brien Centre for Advanced Spatial Analysis (UCL)
") UCL CENTRE FOR ADVANCED SPATIAL ANALYSIS Apps Delivering Information to Mass Audiences 1. Richard Milton 2. Steven Gray 3. Oliver O Brien Centre for Advanced Spatial Analysis (UCL) Scott Adams 1995 The
UCL CENTRE FOR ADVANCED SPATIAL ANALYSIS Apps Delivering Information to Mass Audiences 1. Richard Milton 2. Steven Gray 3. Oliver O Brien Centre for Advanced Spatial Analysis (UCL) Scott Adams 1995 The
Measuring connectivity in London
 Measuring connectivity in London OECD, Paris 30 th October 2017 Simon Cooper TfL City Planning 1 Overview TfL Connectivity measures in TfL PTALs Travel time mapping Catchment analysis WebCAT Current and
City Models to Explore the Impact of New Urban Infrastructures
 June 29 th 2016 City Models to Explore the Impact of New Urban Infrastructures Michael Batty m.batty@ucl.ac.uk @jmichaelbatty http://www.complexcity.info/ http://www.spatialcomplexity.info/ My Main Themes
Cities, AI, Design, & the Future Can Artificial Intelligence Improve Design Intelligence?
 March 27 th 28 Cities, AI, Design, & the Future Can Artificial Intelligence Improve Design Intelligence? Michael Batty m.batty@ucl.ac.uk @jmichaelbatty http://www.spatialcomplexcity.info/ http://www.casa.ucl.ac.uk/
GIS Analysis of Crenshaw/LAX Line
 PDD 631 Geographic Information Systems for Public Policy, Planning & Development GIS Analysis of Crenshaw/LAX Line Biying Zhao 6679361256 Professor Barry Waite and Bonnie Shrewsbury May 12 th, 2015 Introduction
Extending the Focus of Urban Modelling Tools
 A Meeting sponsored by ASU, UCL, Newcastle Universities and the British Consulate, 21-23 May 2010 Extending the Focus of Urban Modelling Tools Michael Batty University College London m.batty@ucl.ac.uk
Exploring Human Mobility with Multi-Source Data at Extremely Large Metropolitan Scales. ACM MobiCom 2014, Maui, HI
 Exploring Human Mobility with Multi-Source Data at Extremely Large Metropolitan Scales Desheng Zhang & Tian He University of Minnesota, USA Jun Huang, Ye Li, Fan Zhang, Chengzhong Xu Shenzhen Institute
Mapping Travel-To-Work Flows. Oliver O Brien and James Cheshire Department of Geography, UCL
 Mapping Travel-To-Work Flows Oliver O Brien and James Cheshire Department of Geography, UCL RSAI-BIS Annual Conference (UKDS-CS Sessions), Harrogate, 23 August 2017 Contents 1. The DataShine Project &
Collection and Analyses of Crowd Travel Behaviour Data by using Smartphones
 Collection and Analyses of Crowd Travel Behaviour Data by using Smartphones Rik Bellens 1 Sven Vlassenroot 2 Sidharta Guatama 3 Abstract: In 2010 the MOVE project started in the collection and analysis
Forecasts from the Strategy Planning Model
 Forecasts from the Strategy Planning Model Appendix A A12.1 As reported in Chapter 4, we used the Greater Manchester Strategy Planning Model (SPM) to test our long-term transport strategy. A12.2 The origins
Esri and GIS Education
 Esri and GIS Education Organizations Esri Users 1,200 National Government Agencies 11,500 States & Regional Agencies 30,800 Cities & Local Governments 32,000 Businesses 8,500 Utilities 12,600 NGOs 11,000
of places Key stage 1 Key stage 2 describe places
 Unit 25 Geography and numbers ABOUT THE UNIT This continuous unit aims to show how geographical enquiry can provide a meaningful context for the teaching and reinforcement of many aspects of the framework
NAME: DATE: Leaving Certificate GEOGRAPHY: Maps and aerial photographs. Maps and Aerial Photographs
 NAME: DATE: Leaving Certificate Geography Maps and Aerial Photographs Please see Teachers Notes for explanations, additional activities, and tips and suggestions. Learning Support Vocabulary, key terms
Urban Planning Word Search Level 1
 Urban Planning Word Search Level 1 B C P U E C O S Y S T E M P A R E U O E U R B A N P L A N N E R T N S T D H E C O U N T Y G E R E R D W R E N I C I T Y C O U N C I L A A A S U G G C I L A G P R I R
Place Syntax Tool (PST)
") Place Syntax Tool (PST) Alexander Ståhle To cite this report: Alexander Ståhle (2012) Place Syntax Tool (PST), in Angela Hull, Cecília Silva and Luca Bertolini (Eds.) Accessibility Instruments for Planning
Place Syntax Tool (PST) Alexander Ståhle To cite this report: Alexander Ståhle (2012) Place Syntax Tool (PST), in Angela Hull, Cecília Silva and Luca Bertolini (Eds.) Accessibility Instruments for Planning
Typical information required from the data collection can be grouped into four categories, enumerated as below.
 Chapter 6 Data Collection 6.1 Overview The four-stage modeling, an important tool for forecasting future demand and performance of a transportation system, was developed for evaluating large-scale infrastructure
UCL CENTRE FOR ADVANCED SPATIAL ANALYSIS. Mapping London. Oliver O Brien and James Cheshire. Society of Cartographers 48 th Annual Conference (UCL)
") UCL CENTRE FOR ADVANCED SPATIAL ANALYSIS Mapping London Oliver O Brien and James Cheshire Society of Cartographers 48 th Annual Conference (UCL) 5 September 2012 The Mapping London Blog A blog highlighting
UCL CENTRE FOR ADVANCED SPATIAL ANALYSIS Mapping London Oliver O Brien and James Cheshire Society of Cartographers 48 th Annual Conference (UCL) 5 September 2012 The Mapping London Blog A blog highlighting
Big Data Discovery and Visualisation Insights for ArcGIS
 Big Data Discovery and Visualisation Insights for ArcGIS Create Enrich - Collaborate Lee Kum Cheong GIS CONVERSATIONS At Esri, we believe people can do amazing things with applied geography. GIS CONVERSATIONS
Mobility Analytics through Social and Personal Data. Pierre Senellart
 Mobility Analytics through Social and Personal Data Pierre Senellart Session: Big Data & Transport Business Convention on Big Data Université Paris-Saclay, 25 novembre 2015 Analyzing Transportation and
INTRODUCTION. In March 1998, the tender for project CT.98.EP.04 was awarded to the Department of Medicines Management, Keele University, UK.
 INTRODUCTION In many areas of Europe patterns of drug use are changing. The mechanisms of diffusion are diverse: introduction of new practices by new users, tourism and migration, cross-border contact,
Grade. Why are maps useful? What do maps tell us?
 ACTIVITY 2.1 Follow That DART Bus! DETAILS TYPE Whole-group TIME 20 minutes plus 20 minutes homework (40 minutes total) PRINTED MATERIALS Handouts (Reading A Map, Follow that DART Bus! map and Follow that
Foreword. Vision and Strategy
 GREATER MANCHESTER SPATIAL FRAMEWORK Friends of Walkden Station Consultation Response January 2017 Foreword Friends of Walkden Station are a group of dedicated volunteers seeking to raise the status and
Simple Spatial Growth Models The Origins of Scaling in Size Distributions
 Lectures on Spatial Complexity 17 th 28 th October 2011 Lecture 3: 21 st October 2011 Simple Spatial Growth Models The Origins of Scaling in Size Distributions Michael Batty m.batty@ucl.ac.uk @jmichaelbatty
The 3V Approach. Transforming the Urban Space through Transit Oriented Development. Gerald Ollivier Transport Cluster Leader World Bank Hub Singapore
 Transforming the Urban Space through Transit Oriented Development The 3V Approach Gerald Ollivier Transport Cluster Leader World Bank Hub Singapore MDTF on Sustainable Urbanization The China-World Bank
The prediction of passenger flow under transport disturbance using accumulated passenger data
 Computers in Railways XIV 623 The prediction of passenger flow under transport disturbance using accumulated passenger data T. Kunimatsu & C. Hirai Signalling and Transport Information Technology Division,
Data Collection. Lecture Notes in Transportation Systems Engineering. Prof. Tom V. Mathew. 1 Overview 1
 Data Collection Lecture Notes in Transportation Systems Engineering Prof. Tom V. Mathew Contents 1 Overview 1 2 Survey design 2 2.1 Information needed................................. 2 2.2 Study area.....................................
ArcGIS Enterprise: Out-of-the-Box Spatial Analysis. Vicki Cove Hilary Curtis
 ArcGIS Enterprise: Out-of-the-Box Spatial Analysis Vicki Cove Hilary Curtis Agenda What is spatial analysis? Spatial analysis with ArcGIS Enterprise Analysis demos: - Sunflower proximity to bees - Tourists
Analysis of the urban travel structure using smartcard and GPS data from Santiago, Chile
 Analysis of the urban travel structure using smartcard and GPS data from Santiago, Chile Marcela Munizaga, Felipe Hernández, Universidad de Chile Ricardo Hurtubia, Pontificia Universidad Católica de Chile
The Model Research of Urban Land Planning and Traffic Integration. Lang Wang
 International Conference on Materials, Environmental and Biological Engineering (MEBE 2015) The Model Research of Urban Land Planning and Traffic Integration Lang Wang Zhejiang Gongshang University, Hangzhou
Mapping Accessibility Over Time
 Journal of Maps, 2006, 76-87 Mapping Accessibility Over Time AHMED EL-GENEIDY and DAVID LEVINSON University of Minnesota, 500 Pillsbury Drive S.E., Minneapolis, MN 55455, USA; geneidy@umn.edu (Received
Demystifying ArcGIS Online. Karen Lizcano Esri
 Demystifying ArcGIS Online Karen Lizcano Esri An Integrated Web GIS Platform Desktop Web Device Powered by Services Managed via Portal Access from any Device Portal Server Online Content and Services ArcGIS
Lecture 7: Cellular Automata Modelling: Principles of Cell Space Simulation
 MRes in Advanced Spatial Analysis and Visualisation Lecture 7: Cellular Automata Modelling: Principles of Cell Space Simulation Outline Types of Urban Models Again The Cellular Automata Approach: Urban
Lecture 7: Cellular Automata Modelling: Principles of Cell Space Simulation
 SCHOOL OF GEOGRAPHY Lecture 7: Cellular Automata Modelling: Principles of Cell Space Simulation Outline Types of Urban Models Again The Cellular Automata Approach: Urban Growth and Complexity Theory The
Lecture 9: Geocoding & Network Analysis
 Massachusetts Institute of Technology - Department of Urban Studies and Planning 11.520: A Workshop on Geographic Information Systems 11.188: Urban Planning and Social Science Laboratory Lecture 9: Geocoding
Managing Growth: Integrating Land Use & Transportation Planning
 Managing Growth: Integrating Land Use & Transportation Planning Metro Vancouver Sustainability Community Breakfast Andrew Curran Manager, Strategy June 12, 2013 2 Integrating Land Use & Transportation
ArcGIS is Advancing. Both Contributing and Integrating many new Innovations. IoT. Smart Mapping. Smart Devices Advanced Analytics
 ArcGIS is Advancing IoT Smart Devices Advanced Analytics Smart Mapping Real-Time Faster Computing Web Services Crowdsourcing Sensor Networks Both Contributing and Integrating many new Innovations ArcGIS
Trip and Parking Generation Study of Orem Fitness Center-Abstract
 Trip and Parking Generation Study of Orem Fitness Center-Abstract The Brigham Young University Institute of Transportation Engineers student chapter (BYU ITE) completed a trip and parking generation study
A Science of Cities. Models of Urban Form and Function. Michael
 July 27- August 2, 2014 A Science of Cities Models of Urban Form and Function Michael Batty m.batty@ucl.ac.uk @jmichaelbatty http://www.complexcity.info/ http://www.casa.ucl.ac.uk/ Centre Centre for Advanced
GRADE 6 GEOGRAPHY TERM 1 LATITUDE AND LONGITUDE (degrees)
") 1 GRADE 6 GEOGRAPHY TERM 1 LATITUDE AND LONGITUDE (degrees) Contents Lines of Latitude... 2 Lines of Longitude... 3 The hemispheres of The Earth... 4 Finding countries and cities on a map using latitude
1 GRADE 6 GEOGRAPHY TERM 1 LATITUDE AND LONGITUDE (degrees) Contents Lines of Latitude... 2 Lines of Longitude... 3 The hemispheres of The Earth... 4 Finding countries and cities on a map using latitude
M14/3/GEOGR/SP2/ENG/TZ0/XX/Q GEOGRAPHY STANDARD LEVEL PAPER 2. Monday 19 May 2014 (morning) 1 hour 20 minutes INSTRUCTIONS TO CANDIDATES
 1 hour 20 minutes INSTRUCTIONS TO CANDIDATES") M14/3/GEOGR/SP2/ENG/TZ0/XX/Q 22145203 GEOGRAPHY STANDARD LEVEL PAPER 2 Monday 19 May 2014 (morning) 1 hour 20 minutes INSTRUCTIONS TO CANDIDATES Do not open this examination paper until instructed to do
M14/3/GEOGR/SP2/ENG/TZ0/XX/Q 22145203 GEOGRAPHY STANDARD LEVEL PAPER 2 Monday 19 May 2014 (morning) 1 hour 20 minutes INSTRUCTIONS TO CANDIDATES Do not open this examination paper until instructed to do
1 A Science of Cities
 5 th February 2014 1 A Science of Cities Michael Batty m.batty@ucl.ac.uk @jmichaelbatty http://www.complexcity.info/ http://www.casa.ucl.ac.uk/ Centre Centre for Advanced for Advanced Spatial Spatial Analysis,
Project Appraisal Guidelines
 Project Appraisal Guidelines Unit 16.2 Expansion Factors for Short Period Traffic Counts August 2012 Project Appraisal Guidelines Unit 16.2 Expansion Factors for Short Period Traffic Counts Version Date
HALFF 16196? TRAFFIC MANAGEMENT PLAN. Richardson ISD Aikin Elementary School Dallas, Texas North Bowser Road Richardson, Texas 75081
 30280 16196? TRAFFIC MANAGEMENT PLAN Exhibit 572B Aikin Elementary School Planned Development District No. 572 Approved City Plan Commission October20, 2016 July 12, 2016 Prepared for HALFF AVO 31586 PHO1
Assessing spatial distribution and variability of destinations in inner-city Sydney from travel diary and smartphone location data
 Assessing spatial distribution and variability of destinations in inner-city Sydney from travel diary and smartphone location data Richard B. Ellison 1, Adrian B. Ellison 1 and Stephen P. Greaves 1 1 Institute
SPATIAL INEQUALITIES IN PUBLIC TRANSPORT AVAILABILITY: INVESTIGATION WITH SMALL-AREA METRICS
 SPATIAL INEQUALITIES IN PUBLIC TRANSPORT AVAILABILITY: INVESTIGATION WITH SMALL-AREA METRICS Research conducted by Yeran Sun and Piyushimita (Vonu) Thakuriah Presented by Obinna C.D. Anejionu INTRODUCTION
? 4. Like number bonds, a formula is useful because it helps us know what operation to use depending on which pieces of information we have.
 UNIT SIX DECIMALS LESSON 168 PROBLEM-SOLVING You ve covered quite a distance in your journey through our number system, from whole numbers through fractions, to decimals. Today s math mysteries all have
Interstate 90 Road Report Montana
 Interstate 90 Road Report Montana Thank you for reading. Maybe you have knowledge that, people have look numerous times for their chosen books like this, but end up in malicious downloads. Rather than
CIMA Professional
 CIMA Professional 201819 Manchester Interactive Timetable Version 3.1 Information last updated 12/10/18 Please note: Information and dates in this timetable are subject to change. A better way of learning
Using Social Media for Geodemographic Applications
 Using Social Media for Geodemographic Applications Muhammad Adnan and Guy Lansley Department of Geography, University College London @gisandtech @GuyLansley Web: http://www.uncertaintyofidentity.com Outline
Barlows Primary School Geography Curriculum Content Key Stage 1 and
 Geography Curriculum Content Key Stage 1 and 2 2017-2018 Curriculum Content Year 1 The content for Year 1 is detailed below: WHAT ARE SEASONS? WHAT SIT LIKE WHERE WE LIVE? WHERE DO DIFFERENT ANIMALS LIVE?
Social Studies Grade 2 - Building a Society
 Social Studies Grade 2 - Building a Society Description The second grade curriculum provides students with a broad view of the political units around them, specifically their town, state, and country.
By Abdulraheem M.Baabbad. Supervisor: Dr.Bager Al-Ramadan
 By Abdulraheem M.Baabbad Supervisor: Dr.Bager Al-Ramadan OUTLINE Health GIS Health GIS Application Emergency Vehicles Allocation: A case study Health GIS Innovative structureto access,integrate,visualize
The Building Blocks of the City: Points, Lines and Polygons
 The Building Blocks of the City: Points, Lines and Polygons Andrew Crooks Centre For Advanced Spatial Analysis andrew.crooks@ucl.ac.uk www.gisagents.blogspot.com Introduction Why use ABM for Residential
WOODRUFF ROAD CORRIDOR ORIGIN-DESTINATION ANALYSIS
 2018 WOODRUFF ROAD CORRIDOR ORIGIN-DESTINATION ANALYSIS Introduction Woodruff Road is the main road to and through the commercial area in Greenville, South Carolina. Businesses along the corridor have
Note on Transportation and Urban Spatial Structure
 Note on Transportation and Urban Spatial Structure 1 By Alain Bertaud, Washington, ABCDE conference, April 2002 Email: duatreb@msn.com Web site: http://alain-bertaud.com/ http://alainbertaud.com/ The physical
Financing Urban Transport. UNESCAP-SUTI Event
 Financing Urban Transport UNESCAP-SUTI Event October 2017 Urban Transport in Context 2 The spiky urban economy of global cities 3 Mass transit networks converge towards a characteristic structure with
The Tyndall Cities Integrated Assessment Framework
 The Tyndall Cities Integrated Assessment Framework Alistair Ford 1, Stuart Barr 1, Richard Dawson 1, Jim Hall 2, Michael Batty 3 1 School of Civil Engineering & Geosciences and Centre for Earth Systems
QUANTIFICATION OF THE NATURAL VARIATION IN TRAFFIC FLOW ON SELECTED NATIONAL ROADS IN SOUTH AFRICA
 QUANTIFICATION OF THE NATURAL VARIATION IN TRAFFIC FLOW ON SELECTED NATIONAL ROADS IN SOUTH AFRICA F DE JONGH and M BRUWER* AECOM, Waterside Place, Tygerwaterfront, Carl Cronje Drive, Cape Town, South
Designing smart & Resilient cities:
 Designing smart & Resilient cities: How can Egyptian cities learn from an emerging global practice On the Cuspof Change Professor Samer Bagaeen FRICS MRTPI FRSA AoU 1. GLOBAL CHALLENGES POPULATION GROWTH,
Data driven approaches to Urban Planning Experience from Derry/Londonderry
 Data driven approaches to Urban Planning Experience from Derry/Londonderry Anna Rose RTPI Belfast 11 th of September 1 June 26 07:47AM 2 The value of the City The space of the city is a theatre: playing
WHAT IS GIS? Source: Longley et al (2005) Geographic Information Systems and Science. 2nd Edition. John Wiley and Sons Ltd.
 Geographic Information Systems and Science. 2nd Edition. John Wiley and Sons Ltd.") WHAT IS GIS? Geographical Information Systems (GIS) are a special class of information systems that keep track not only of events, activities, and things, but also of where these events, activities, and
WHAT IS GIS? Geographical Information Systems (GIS) are a special class of information systems that keep track not only of events, activities, and things, but also of where these events, activities, and
Measurement of human activity using velocity GPS data obtained from mobile phones
 Measurement of human activity using velocity GPS data obtained from mobile phones Yasuko Kawahata 1 Takayuki Mizuno 2 and Akira Ishii 3 1 Graduate School of Information Science and Technology, The University
Early College High School PreAP World Geography Summer Reading Assignment
 Early College High School PreAP World Geography Summer Reading Assignment In preparation for your studies in World Geography you will be familiarizing yourself with the 5 Themes of Geography. This assignment
City monitoring with travel demand momentum vector fields: theoretical and empirical findings
 City monitoring with travel demand momentum vector fields: theoretical and empirical findings Xintao Liu 1, Joseph Y.J. Chow 2 1 Department of Civil Engineering, Ryerson University, Canada 2 Tandon School
Spatial analysis of dynamic movements of Vélo v, Lyon s shared bicycle program
 Noname manuscript No. (will be inserted by the editor) Spatial analysis of dynamic movements of Vélo v, Lyon s shared bicycle program Pierre Borgnat Eric Fleury Céline Robardet Antoine Scherrer Received:
Michael Harrigan Office hours: Fridays 2:00-4:00pm Holden Hall
 Announcement New Teaching Assistant Michael Harrigan Office hours: Fridays 2:00-4:00pm Holden Hall 209 Email: michael.harrigan@ttu.edu Guofeng Cao, Texas Tech GIST4302/5302, Lecture 2: Review of Map Projection
CIV3703 Transport Engineering. Module 2 Transport Modelling
 CIV3703 Transport Engineering Module Transport Modelling Objectives Upon successful completion of this module you should be able to: carry out trip generation calculations using linear regression and category
Neighborhood Locations and Amenities
 University of Maryland School of Architecture, Planning and Preservation Fall, 2014 Neighborhood Locations and Amenities Authors: Cole Greene Jacob Johnson Maha Tariq Under the Supervision of: Dr. Chao
Geography for Life. Course Overview
 Geography for Life Description In Geography for Life students will explore the world around them. Using the six essential elements established by the National Geographic Society students will be able to
Visualizing Geospatial Graphs
 Visualizing Geospatial Graphs An introduction to visualizing geospatial graph data with KeyLines Geospatial www.cambridge-intelligence.com USA: +1 (775) 842-6665 UK: +44 (0)1223 362 000 Cambridge Intelligence
TOWARDS THE DEVELOPMENT OF A MONITORING SYSTEM FOR PLANNING POLICY Residential Land Uses Case study of Brisbane, Melbourne, Chicago and London
 TOWARDS THE DEVELOPMENT OF A MONITORING SYSTEM FOR PLANNING POLICY Residential Land Uses Case study of Brisbane, Melbourne, Chicago and London Presented to CUPUM 12 July 2017 by Claire Daniel Urban Planning/Data
Travel Time Calculation With GIS in Rail Station Location Optimization
 Travel Time Calculation With GIS in Rail Station Location Optimization Topic Scope: Transit II: Bus and Rail Stop Information and Analysis Paper: # UC8 by Sutapa Samanta Doctoral Student Department of
City and SUMP of Ravenna
 City and SUMP of Ravenna Nicola Scanferla Head of Mobility Planning Unit, Municipality of Ravenna nscanferla@comune.ra.it place your logo here 19 April, 2017 1st Steering Committee Meeting, Nicosia, Cyprus
2040 MTP and CTP Socioeconomic Data
 SE Data 6-1 24 MTP and CTP Socioeconomic Data Purpose of Socioeconomic Data The socioeconomic data (SE Data) shows the location of the population and employment, median household income and other demographic
Application of GIS in Public Transportation Case-study: Almada, Portugal
 Case-study: Almada, Portugal Doutor Jorge Ferreira 1 FSCH/UNL Av Berna 26 C 1069-061 Lisboa, Portugal +351 21 7908300 jr.ferreira@fcsh.unl.pt 2 FSCH/UNL Dra. FCSH/UNL +351 914693843, leite.ines@gmail.com
Exploring the Geography of Communities in Social Networks
 Exploring the Geography of Communities in Social Networks Alexis Comber 1, Michael Batty 2, Chris Brunsdon 3, Andrew Hudson-Smith 2, Fabian Neuhaus 2 and Steven Gray 2 1 Department of Geography, University
5.1 Introduction. 5.2 Data Collection
 Chapter 5 Traffic Analysis 5.1 Introduction This chapter of the EIS assesses the traffic impacts of the proposed N5 Westport to Turlough Road Project (the proposed scheme). The proposed scheme will provide
Mountain View Community Shuttle Monthly Operations Report
 Mountain View Community Shuttle Monthly Operations Report December 6, 2018 Contents Passengers per Day, Table...- 3 - Passengers per Day, Chart...- 3 - Ridership Year-To-Date...- 4 - Average Daily Ridership
CIMA Professional
 CIMA Professional 201819 Birmingham Interactive Timetable Version 3.1 Information last updated 12/10/18 Please note: Information and dates in this timetable are subject to change. A better way of learning
Finding Pearls in London s Oysters
 Finding Pearls in London s Oysters JON READES 1, CHEN ZHONG 1, ED MANLEY 2, RICHARD MILTON 2, & MICHAEL BATTY 2 Public transport is perhaps the most significant component of the contemporary smart city
Detecting Origin-Destination Mobility Flows From Geotagged Tweets in Greater Los Angeles Area
 Detecting Origin-Destination Mobility Flows From Geotagged Tweets in Greater Los Angeles Area Song Gao 1, Jiue-An Yang 1,2, Bo Yan 1, Yingjie Hu 1, Krzysztof Janowicz 1, Grant McKenzie 1 1 STKO Lab, Department
Supplementary Figures
 Supplementary Figures 10 1 Roma Milano Napoli Torino Palermo Genova 0.3 0.25 (a) P(t) 10 1 (b) t (h) 0.2 0 0.2 0.4 0.6 0.8 1 t (h) 0.15 10 4 10 5 10 6 10 7 Population Supplementary Figure 1: Variation
APPENDIX IV MODELLING
 APPENDIX IV MODELLING Kingston Transportation Master Plan Final Report, July 2004 Appendix IV: Modelling i TABLE OF CONTENTS Page 1.0 INTRODUCTION... 1 2.0 OBJECTIVE... 1 3.0 URBAN TRANSPORTATION MODELLING
Transit Time Shed Analyzing Accessibility to Employment and Services
 Transit Time Shed Analyzing Accessibility to Employment and Services presented by Ammar Naji, Liz Thompson and Abdulnaser Arafat Shimberg Center for Housing Studies at the University of Florida www.shimberg.ufl.edu
Appendix BAL Baltimore, Maryland 2003 Annual Report on Freeway Mobility and Reliability
 (http://mobility.tamu.edu/mmp) Office of Operations, Federal Highway Administration Appendix BAL Baltimore, Maryland 2003 Annual Report on Freeway Mobility and Reliability This report is a supplement to:
City of Hermosa Beach Beach Access and Parking Study. Submitted by. 600 Wilshire Blvd., Suite 1050 Los Angeles, CA
 City of Hermosa Beach Beach Access and Parking Study Submitted by 600 Wilshire Blvd., Suite 1050 Los Angeles, CA 90017 213.261.3050 January 2015 TABLE OF CONTENTS Introduction to the Beach Access and Parking
PATREC PERSPECTIVES Sensing Technology Innovations for Tracking Congestion
 PATREC PERSPECTIVES Sensing Technology Innovations for Tracking Congestion Drivers have increasingly been using inexpensive mapping applications imbedded into mobile devices (like Google Maps, MapFactor,
Paper Two - Optional Themes for Standard and Higher Level
 Paper Two - Optional Themes for Standard and Higher Level Timing: Approximately 40 minutes for each question (each is worth 20 marks). Choice: Higher Level candidates must answer three questions and Standard
THE GEOGRAPHY OF KNOWLEDGE CREATION
 THE GEOGRAPHY OF KNOWLEDGE CREATION Theoretical Explorations & Raising Questions Dr. Roel Rutten Tilburg University School of Social and Behavioural Sciences Regional Science Association Netherlands &
Mountain View Community Shuttle Monthly Operations Report
 Mountain View Community Shuttle Monthly Operations Report October 9, 2018 Contents Passengers per Day, Table...- 3 - Passengers per Day, Chart...- 3 - Ridership Year-To-Date...- 4 - Average Daily Ridership
About places and/or important events Landmarks Maps How the land is, hills or flat or mountain range Connected to maps World Different countries
 What do you think you know about geography? About places and/or important events Landmarks Maps How the land is, hills or flat or mountain range Connected to maps World Different countries What do you
GIS Based Transit Information System for Metropolitan Cities in India
 PAPER REFERENCE NO.: PN-250 GIS Based Transit Information System for Metropolitan Cities in India Pal, Sarvjeet. a and Singh, Varun. b a M. Tech. (GIS & Remote Sensing); GIS Cell; Motilal Nehru National