Land Use Transportation Interaction Models
|
|
|
- Jodie Pearson
- 5 years ago
- Views:
Transcription

1 Opening Lecture 2 September 4 th 2014 Land Use Transportation Interaction Models Michael Batty
2 Outline Preliminary Ideas: a. LUTI Models: A Little Bit of History, Graphics Interfaces b. Gravitation and Social Physics c. Spatial Interaction Modelling: Some Basic Ideas The Tyndall Model: Integrated Assessment SIMULACRA: ARCADIA and SCALE Proects Requirements: The Model Design: Models Flows: Physical Movements, Money & the Residential Model The Visual Template: The Desktop Model: Running It Building a Web Based Model Interface Data Bases: Location, Interactions & Networks Current Challenges for Immediate Developments
3 Preliminary Ideas a. LUTI Models: A Little Bit of History, Early Graphics Early models: CATS 1955: The 1960s Models: large scale, aggregate data, policy led, suffered from all the problems of science in public policy that we now know Largeness, remoteness from users, crude representation, limits on computation, poor links to policy Lack of understanding of model outcomes Statics versus dynamics semi dynamic models but most operational models predicated in terms of equilibrium and as we have seen, the most developed are structured in terms of a dynamic equilibrium Disaggregation of sectoral activities


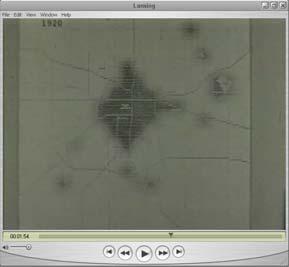
4 Early attempts at Visualisation: Traffic Flows in CATS, and Schmidt s model of the growth of East Lansing 1967 Harvard Lab: SYMAP Symbol Mapping Systems, Early cathode ray displays, 1960 Apart from some SYMAP applications, my own attempts began in the early 1980s with the Melbourne Model


5

6 I worked on these models in the 1970s and published a book on them called Urban Modelling you can get it online and if you go to my blog you can download it Our first foray into these large scale models and their visualisation was for Melbourne in 1982 and then development of a WATFor77 version in The Melbourne Version is primitive and not very nice to look at because we attached a video to the raster display device

7 From a VAX Terminal A Raster 1982 From a Sun Workstation Simple Windows At the risk of the talk getting longer, I will show the 1986 demo as some of you may not have been alive in It still runs under DOS on this laptop
8 b. Gravitation and Social Physics Let me begin to tell you how these models are built with a basic model of interaction that was first articulated by Newton as his second law of motion force is proportional to mass times acceleration In more conventional terms relevant to this treatment, we might write the force between two bodies as M im M im F12 ~ G 2 2 d d There is a very long history of analogies between force and social interaction going back to Newton himself. There are many references in the books listed at the end of this talk
9 Let me immediately generalise this and say that we need to define many interactions we break our system in to areas or points which we define as origins and destinations i and And then we measure the distance as in von Thunen not as distance per se but as travel cost or rather generalised cost c We also define the mass at the origins and destinations as O i and D and we then write the conventional spatial interaction of gravity model as T ~ PP i 2 c K PP i c where K is now the gravitational constant and a parameter
10 This is the model that has been used for years but in the late 1960s and 1970s various researchers cast it in a wider framework deriving the model by setting up a series of constraints on its form which showed how it might be solved and produced various generating mechanisms that could generate consistent models The constraints logic led to consistent accounting The generative logic lead to analogies between utility and entropy maximising and opened a door that has not been much exploited to date between entropy, energy, urban forms physical morphology and economic structure In particular the economic logic rather than the energy entropy logic was called choice theory, specifically discrete choice
11 Now to introduce all this, we need to define some more terms We will refer to the size of volume of origins and destinations not as population P but as O i and D assuming they are different from one another. We will also assume that the inverse square law on distance or travel cost does not apply and that whenever c appears it will be parameterised with a value that varies which we call. Vito used a model like this in his first talk to take account of the weight on a link. We will assume trips are as we have defined them as T but we can also normalise trips by their total volume T to produce probabilities
12 p T We must move quite quickly now so let me introduce the basic constraints on spatial interaction and then state various models T The constraints are usually specified as origin constraints and destination constraints as O i T T T Note that we use summation extensively in what follows D T i And we can take our basic gravity model and make it subect to either or both of these constraints or not at all
13 So what we get are four possible models Unconstrained T KO D i c Singly (Origin) Constrained so that the volume of trips at the origins is conserved T AO D c i i Singly (Destination) Constrained so that the volume of trips at the destinations is conserved T B O D i c Doubly Constrained trip volumes at origin destinations conserved T A B O D c i i The first three are location models, the last is a traffic model
14 Ok, so what are these parameters that enable the constraints to me met well they can be very easily produced by summing each model over the relevant subscripts ie origins or destinations and then substituting & rearranging I will do this but I will leave you to work through the algebra if you want to but it isn t necessary as I ust want to impress the main ideas. Here are the factors which are sometimes called balancing factors Unconstrained Origin Constrained Destination Constrained Doubly Constrained K T A B A i i 1 1 i i D i O O c c i D c 1 B D c B 1 i A O c i i
15 Let me illustrate in two ways how we can build comprehensive models using this framework If we say that residential location depends on not only travel cost but also on money available for housing we argue as before that The model is singly constrained we know where people work and we want to find out where they live so origins are workplaces and destinations are housing areas The model then lets us predict people in housing We argue that people will trade off money for housing against transport cost And we then set up the model as follows
16 Using the trip activity volume form, we get T i i T leads T i T to O c A O i i R C R exp( R )exp( c Note that we now add a constraint on money available for housing (like rent) R. We can of course find out from this location model how many people live in destination housing zones, so again it is a distribution as well as a location model P T i )
17 We can extend this model in lots of ways and we will show some of these later. We also can think about disaggregating the model into different transport modes let us call each mode k and then set up the model so that we can predict T as follows The model is singly (origin) constrained because we want to predicts how many people travel from work to home. Given we know how many people work at origins, and we want to predict what mode of transport k they travel on. Then i k T i k T k k T c k k O F i C k F k
18 And the model can be specified as T k O i F k k exp( c F k ) k exp( c k ) Note that the mode split is a ratio of the competitive effects of each travel cost, that is O i F F k exp( c k k ) k exp( c k ) T T k k exp( c exp( c k ) ) In short the model is not only distributing trips so that locations compete but also that modes compete BUT modes do not compete per se with locations Now let us see how we can build this model for real
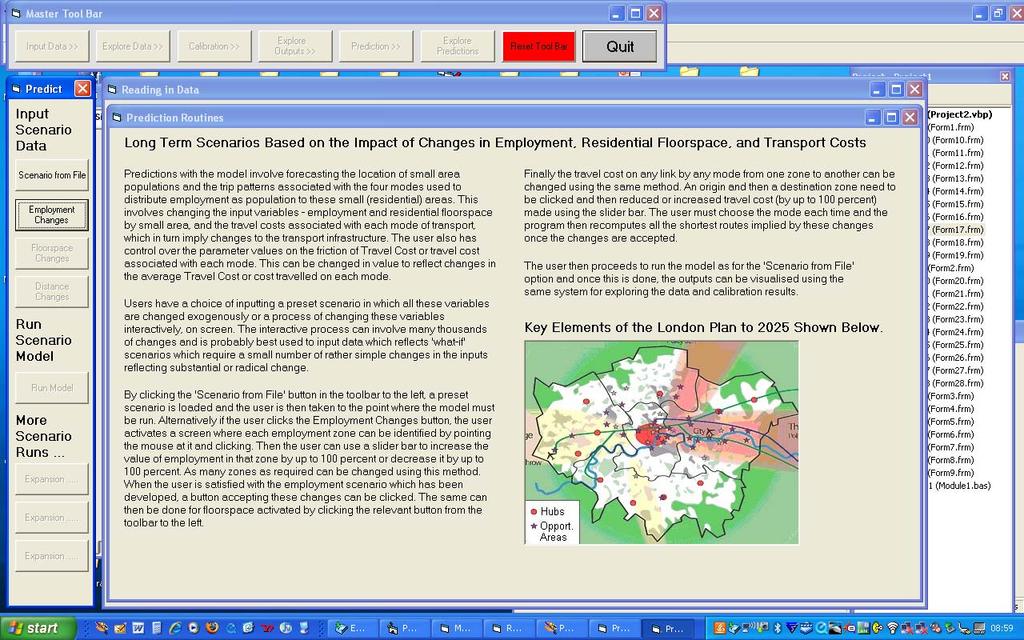
19 The Tyndall Model: Integrated Assessment of Climate Change in the London Region Our first model is a residential location model based on four modes but it is part of a much bigger proect involving stringing different models together to look at integrated assessment of sea level rise and its impact on population in the London region. The reason why I have stressed visualisation as a key theme today is that one of our guiding principles in this modelling was to communicate the models as easily and as effectively as possible to our stakeholders These were largely policy analysts and had some expertise in climate change problems and some knowledge of models of various kinds but not any one particular model We also needed to communicate these ideas to other modellers, such as the flood modellers, the input output, people etc.


20 MoSeS
, heavy rail, light rail and tube, and bus walk/bike is a residual mode. To fix ideas let me show the extent of the area first Go to www.maptube.")
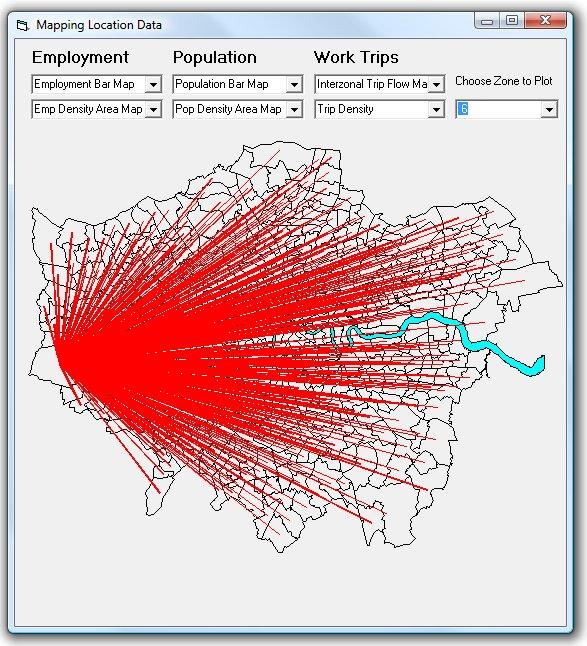
21 The London Tyndall Model: Applications Essentially we have built this model for Greater London which is divided into 633 zones the area has 7.7m population and about 4.3m obs we have four modes road (car), heavy rail, light rail and tube, and bus walk/bike is a residual mode. To fix ideas let me show the extent of the area first Go to to see many maps of Greater London

22 The Model Interface

23
:")
24 Modes Road Bus Heavy Rail Light Rail All Trips Road: 38%; Bus: 12%: Heavy Rail: 12%: Light Rail 19%; Other (Walk, Bike, Fly): 19%

25
26


27 Accessibility from the LUTM model Many different accessibility measures, 8 in all
28

29

30 Let us run the model I need to go to my folder >>


31 Testing the impact of Cross Rail 1


32

33 For a very old movie of all this go to our old web site We need to re track a bit now and for our full model we need to say something more about these kinds of spatial interaction models and how they can be extended
34 SIMULACRA: ARCADIA and SCALE Proects SIMULACRA 1 is a generic set of models that we are building for a series of proects, first the ARCADIA proect that is an extension of Tyndall, and then for another EPSRC Proect called SCALE which deals with energy change in large cities We are very keen on building a model framework in which we can develop many different variants, easily and quickly. I think we are now in a position in this field where we can and should develop lots of variants, which test the robustness of any approach while at the same time, enabling models to be tuned to the problem in hand. But first let me sketch the integrated model which involves coupling sectors 1 SIMulation of Urban Landuse, And Commercial and Residential Activities
35 Modular Modelling: Coupled Spatial Interaction Now we have a module for one kind of interaction consider stringing these together as more than one kind of spatial interaction Classically we might model flows from home to work and home to shop but there are many more and in this sense, we can use these as building blocks for wider models. This is for next time too What we will now do is illustrate how we might build such a structure taking a ourney to work model from Employment to Population and then to Shopping which we structure as
36 First we have the ourney from work to home model as T P Ei i F exp( c ), F exp( c ) T And then the demand from home to shop Wm exp( c m ) S m P, W exp( c ) S m S m m m m And there is a potential link back to employment from the retail sector E f ( S m ) m T m S m E i P
37 Ok so this is the model structure iterative coupling of sectors to take account of simultaneity and we also want to be able to do the following: Alter and aggregate the zoning system quickly and easily, on the fly almost Alter by adding and deleting different model sectors, so for example running a model based on simply the retailing and other employment sectors without the residential and so on Subecting the model to various kinds of physical constraints, at will and according to external policies Extending all sectors to not only predict endogenous activities but to also be subect to exogenous inputs of the same To interface the models easily and quickly with other sectoral models, demographic and more established transport models
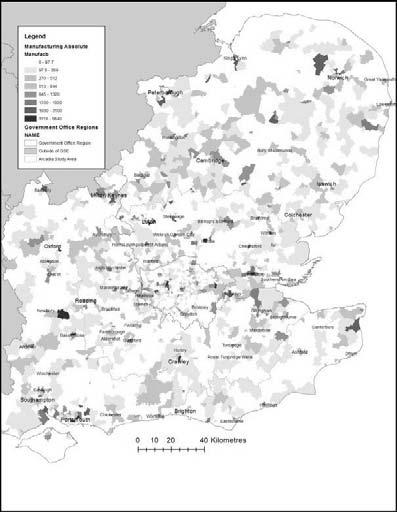
38 Requirements: The Model Design: Models Flows: Physical Movements, Money & the Residential Model We will now show the current model to present the logic of our framework. Our model has now been scaled up massively to include the outer met area 1767 zones ( ) It is now a three sector model, not simply a residential location model as it includes internal employment location, retail location and residential location So far, we do not have modal split or any disaggregation of the sectors but we will have five modes and then probably 5 population categories and maybe 5 employment types in terms of occupations in short the model will ultimately scale up to some 100 times the size of the current model

39 The Structure of SIMULACRA

40 I want to ust show very briefly the sort of data that we have in the money sector that is driving this variant of the model and also state the residential location equation so you have some sense of what is going on
41 And the model is formalised as
42 The Visual Template: The Desktop Model Ok let me quickly tell you our strategy we are building a fully fledged model using state of the art software and various web based interfaces which is highly visual and will be as fast as possible We are also building a mirror model on the desktop which is my contribution to the proect and this is a one window minimal model which is for comparative purposes and to enable the bigger model to be tested This is the model I will now show and then I will sketch the bigger application very briefly which Camilo in our group is developing
43 This is the order in which the operations take place Parameter Values Sequence of Model Functions Map Graphics Goodness of Fit Statistics: Deviations & r 2 Graphical Functions Activity Totals Logo Graph Data

44


45

46 Here are some sample outputs I will run the model as speed is important here goes RUN
47 The employment model has been built more recently and it much wider in scale than the current 1767 model it has 3202 or so zones and this is largely because we need to capture locational change in the wider region. The model is econometric based on predicting floorspace which in turn predicts employment. The two typical equations


48

49 And here are some screen shots from the desktop version of the web based application on Mac and PC


50

51 And here are some examples of testing the impact of new airports on existing urban structure in the London region
52 Data Bases: Location, Interactions & Networks We have a big problem in getting the networks sorted out for the aggregate model as these networks are at a very fine scale We need them to be at a coarser scale for the model as we need to do all the assignment and capacity checking at the level of the model This is a long standing issue, we know, but we cannot afford to move down the local fine scale level to do the assignment of trips to the network because this would simply destroy our basic principle of accessibility of the model to users and also the speed requirements we need We will show some of the detail we have by way of illustrating our work in progress.


53 Road Costs Used GPS data for realistic road speeds across the South East. Sourced from ITIS and Ecourier. Future improvements with dynamic consideration of congestion.


54 Public Transport Costs Based on network geometry and timetabled services. Initially using model presented by Duncan last term. Allows multimodal PT trips. TransXchange Full UK PT timetable available in XML format. Could be used to automate process of generating PT networks.


55


56 And we are linking all this to Melanie Bosredon s Work is adding energy issues and data to the The DSC SETLUM (South Essex Land Use Model)
57 Key Challenges for Immediate Developments Speed of Models Quick and Effective Visualisation Running the Model with Users/Stakeholders Building a Residential Model Based on the Housing Market Cost, prices, travel and energy costs etc The Wegener Principle Moving to a Semi Dynamic Model with Inertia and Internal Migration A Local UK Dimension: Thinking of the Modelling Strategy as being Informed by National Data Bases such as Neighbourhood Statistics


58 Thanks Acknowledgements Melanie Bosredon, Richard Milton, Pete Ferguson, Joan Serras, Camilo Vargas Ruiz We are also working on these models with your own group here which leads the EU INSIGHT Proect and EUNOIA which is led by NOMMON from Madrid

59 Environment and Planning B SIMULACRA: fast land-use transportation models for the rapid assessment of urban futures Michael Batty, Camilo Vargas, Duncan Smith, Joan Serras, Jon Reades, Anders Johansson Environment and Planning A Visually-Driven Urban Simulation: exploring fast and slow change in residential location Michael Batty
Land Use Transportation Interaction Models
 July 27- August 2, 2014 Land Use Transportation Interaction Models Michael Batty m.batty@ucl.ac.uk @michaelbatty http://www.complexcity.info/ http://www.spatialcomplexity.info/ Outline Preliminary Ideas:
Integrated Modelling of the Spatial Impacts of Climate Change In Greater London
 Megacities, Vulnerability and Global Climate Change: FAPESP: City of São Paulo, July 20 th 22 nd 2009 Integrated Modelling of the Spatial Impacts of Climate Change In Greater London Michael Batty University
A Land Use Transport Model for Greater London:
 Spatio-Temporal Analysis of Network Data and Road Developments Launch Event Workshop UCL Monday 18 May 2009 A Land Use Transport Model for Greater London: With Applications to an Integrated Assessment
City Models to Explore the Impact of New Urban Infrastructures
 June 29 th 2016 City Models to Explore the Impact of New Urban Infrastructures Michael Batty m.batty@ucl.ac.uk @jmichaelbatty http://www.complexcity.info/ http://www.spatialcomplexity.info/ My Main Themes
The Tyndall Cities Integrated Assessment Framework
 The Tyndall Cities Integrated Assessment Framework Alistair Ford 1, Stuart Barr 1, Richard Dawson 1, Jim Hall 2, Michael Batty 3 1 School of Civil Engineering & Geosciences and Centre for Earth Systems
Extending the Focus of Urban Modelling Tools
 A Meeting sponsored by ASU, UCL, Newcastle Universities and the British Consulate, 21-23 May 2010 Extending the Focus of Urban Modelling Tools Michael Batty University College London m.batty@ucl.ac.uk
Infrastructure to Explore Geographic Systems through Models and Maps
 Exemplar 1: GeoVUE Then GENeSIS (GENerative e SocIalScience) Infrastructure to Explore Geographic Systems through Models and Maps Michael Batty University College London m.batty@ucl.ac.uk http://www.casa.ucl.ac.uk/
Simple Spatial Growth Models The Origins of Scaling in Size Distributions
 Lectures on Spatial Complexity 17 th 28 th October 2011 Lecture 3: 21 st October 2011 Simple Spatial Growth Models The Origins of Scaling in Size Distributions Michael Batty m.batty@ucl.ac.uk @jmichaelbatty
ECNU Writing Workshop, October 28 th, Urban Models: The Decline of Theory, The Rise of Big Data and the Fragmentation of Applications
 ECNU Writing Workshop, October 28 th, 2012 CAMUSS Urban Models: The Decline of Theory, The Rise of Big Data and the Fragmentation of Applications Michael Batty University College London m.batty@ucl.ac.uk
Smart Cities, Data and Big Data
 Urban and Regional Planning for Urban Design October 2015 Smart Cities, Data and Big Data Michael Batty m.batty@ucl.ac.uk @jmichaelbatty http://www.complexcity.info/ http://www.spatialcomplexity.info/
Changes in the Spatial Distribution of Mobile Source Emissions due to the Interactions between Land-use and Regional Transportation Systems
 Changes in the Spatial Distribution of Mobile Source Emissions due to the Interactions between Land-use and Regional Transportation Systems A Framework for Analysis Urban Transportation Center University
Typical information required from the data collection can be grouped into four categories, enumerated as below.
 Chapter 6 Data Collection 6.1 Overview The four-stage modeling, an important tool for forecasting future demand and performance of a transportation system, was developed for evaluating large-scale infrastructure
CIV3703 Transport Engineering. Module 2 Transport Modelling
 CIV3703 Transport Engineering Module Transport Modelling Objectives Upon successful completion of this module you should be able to: carry out trip generation calculations using linear regression and category
Lecture 2: Modelling Histories: Types and Styles:
 SCHOOL OF GEOGRAPHY Lecture 2: Modelling Histories: Types and Styles: Urban Models defined, The Urban Modelling Timeline, What Kind of Cities, Examples of Three Model Types Outline Origins: Location Theory
Data Collection. Lecture Notes in Transportation Systems Engineering. Prof. Tom V. Mathew. 1 Overview 1
 Data Collection Lecture Notes in Transportation Systems Engineering Prof. Tom V. Mathew Contents 1 Overview 1 2 Survey design 2 2.1 Information needed................................. 2 2.2 Study area.....................................
1 A Science of Cities
 5 th February 2014 1 A Science of Cities Michael Batty m.batty@ucl.ac.uk @jmichaelbatty http://www.complexcity.info/ http://www.casa.ucl.ac.uk/ Centre Centre for Advanced for Advanced Spatial Spatial Analysis,
COSMIC: COmplexity in Spatial dynamic
 COSMIC: COmplexity in Spatial dynamic MICs 9 10 November, Brussels Michael Batty University College London m.batty@ucl.ac.uk http://www.casa.ucl.ac.uk/ Outline The Focus of the Pilot The Partners: VU,
Foreword. Vision and Strategy
 GREATER MANCHESTER SPATIAL FRAMEWORK Friends of Walkden Station Consultation Response January 2017 Foreword Friends of Walkden Station are a group of dedicated volunteers seeking to raise the status and
URBAN TRANSPORTATION SYSTEM (ASSIGNMENT)
") BRANCH : CIVIL ENGINEERING SEMESTER : 6th Assignment-1 CHAPTER-1 URBANIZATION 1. What is Urbanization? Explain by drawing Urbanization cycle. 2. What is urban agglomeration? 3. Explain Urban Class Groups.
BRANCH : CIVIL ENGINEERING SEMESTER : 6th Assignment-1 CHAPTER-1 URBANIZATION 1. What is Urbanization? Explain by drawing Urbanization cycle. 2. What is urban agglomeration? 3. Explain Urban Class Groups.
2040 MTP and CTP Socioeconomic Data
 SE Data 6-1 24 MTP and CTP Socioeconomic Data Purpose of Socioeconomic Data The socioeconomic data (SE Data) shows the location of the population and employment, median household income and other demographic
Land Use Modeling at ABAG. Mike Reilly October 3, 2011
 Land Use Modeling at ABAG Mike Reilly michaelr@abag.ca.gov October 3, 2011 Overview What and Why Details Integration Use Visualization Questions What is a Land Use Model? Statistical relationships between
ENV208/ENV508 Applied GIS. Week 1: What is GIS?
 ENV208/ENV508 Applied GIS Week 1: What is GIS? 1 WHAT IS GIS? A GIS integrates hardware, software, and data for capturing, managing, analyzing, and displaying all forms of geographically referenced information.
Lesson 8: Velocity. Displacement & Time
 Lesson 8: Velocity Two branches in physics examine the motion of objects: Kinematics: describes the motion of objects, without looking at the cause of the motion (kinematics is the first unit of Physics
Decentralisation and its efficiency implications in suburban public transport
 Decentralisation and its efficiency implications in suburban public transport Daniel Hörcher 1, Woubit Seifu 2, Bruno De Borger 2, and Daniel J. Graham 1 1 Imperial College London. South Kensington Campus,
Cities, AI, Design, & the Future Can Artificial Intelligence Improve Design Intelligence?
 March 27 th 28 Cities, AI, Design, & the Future Can Artificial Intelligence Improve Design Intelligence? Michael Batty m.batty@ucl.ac.uk @jmichaelbatty http://www.spatialcomplexcity.info/ http://www.casa.ucl.ac.uk/
Gravity: How fast do objects fall? Teacher Advanced Version (Grade Level: 8 12)
") Gravity: How fast do objects fall? Teacher Advanced Version (Grade Level: 8 12) *** Experiment with Audacity and Excel to be sure you know how to do what s needed for the lab*** Kinematics is the study
Gravity: How fast do objects fall? Teacher Advanced Version (Grade Level: 8 12) *** Experiment with Audacity and Excel to be sure you know how to do what s needed for the lab*** Kinematics is the study
THE GENERAL URBAN MODEL: RETROSPECT AND PROSPECT. Alan Wilson Centre for Advanced Spatial Analysis University College London
 THE GENERAL URBAN MODEL: RETROSPECT AND PROSPECT Alan Wilson Centre for Advanced Spatial Analysis University College London PART 1: RETROSPECT Achievements and insights INTRODUCTION anniversaries: beyond
The Building Blocks of the City: Points, Lines and Polygons
 The Building Blocks of the City: Points, Lines and Polygons Andrew Crooks Centre For Advanced Spatial Analysis andrew.crooks@ucl.ac.uk www.gisagents.blogspot.com Introduction Why use ABM for Residential
California Urban Infill Trip Generation Study. Jim Daisa, P.E.
 California Urban Infill Trip Generation Study Jim Daisa, P.E. What We Did in the Study Develop trip generation rates for land uses in urban areas of California Establish a California urban land use trip
Urban Geography. Unit 7 - Settlement and Urbanization
 Urban Geography Unit 7 - Settlement and Urbanization Unit 7 is a logical extension of the population theme. In their analysis of the distribution of people on the earth s surface, students became aware
Modern Urban and Regional Economics
 Modern Urban and Regional Economics SECOND EDITION Philip McCann OXFORD UNIVERSITY PRESS Contents List of figures List of tables Introduction xii xiv xvii Part I Urban and Regional Economic Models and
Lecture 7: Cellular Automata Modelling: Principles of Cell Space Simulation
 MRes in Advanced Spatial Analysis and Visualisation Lecture 7: Cellular Automata Modelling: Principles of Cell Space Simulation Outline Types of Urban Models Again The Cellular Automata Approach: Urban
Trip Distribution Modeling Milos N. Mladenovic Assistant Professor Department of Built Environment
 Trip Distribution Modeling Milos N. Mladenovic Assistant Professor Department of Built Environment 25.04.2017 Course Outline Forecasting overview and data management Trip generation modeling Trip distribution
Collection and Analyses of Crowd Travel Behaviour Data by using Smartphones
 Collection and Analyses of Crowd Travel Behaviour Data by using Smartphones Rik Bellens 1 Sven Vlassenroot 2 Sidharta Guatama 3 Abstract: In 2010 the MOVE project started in the collection and analysis
Taming the Modeling Monster
 Taming the Modeling Monster Starring: Ellen Greenberg Scott McCarey Jim Charlier Audience Poll, part 1 Elected Officials Board Members Public Staff Consultants Journalists Other Audience Poll, part 2 Modeling
Accessibility: an academic perspective
 Accessibility: an academic perspective Karst Geurs, Associate Professor, Centre for Transport Studies, University of Twente, the Netherlands 28-2-2011 Presentatietitel: aanpassen via Beeld, Koptekst en
Stepping away from trend analyses for regional integrated planning and modelling
 University of Wollongong Research Online SMART Infrastructure Facility - Papers Faculty of Engineering and Information Sciences 2015 Stepping away from trend analyses for regional integrated planning and
From transport to accessibility: the new lease of life of an old concept
 Paris 07 /01/ 2015 From transport to accessibility: the new lease of life of an old concept Pr. Yves Crozet Laboratory of Transport Economics (LET) University of Lyon (IEP) - France yves.crozet@let.ish-lyon.cnrs.fr
accessibility instruments in planning practice
 accessibility instruments in planning practice Spatial Network Analysis for Multi-Modal Transport Systems (SNAMUTS): Helsinki Prof Carey Curtis, Dr Jan Scheurer, Curtin University, Perth - RMIT University,
Measuring connectivity in London
 Measuring connectivity in London OECD, Paris 30 th October 2017 Simon Cooper TfL City Planning 1 Overview TfL Connectivity measures in TfL PTALs Travel time mapping Catchment analysis WebCAT Current and
Urban Spatial Scenario Design Modelling (USSDM) in Dar es Salaam: Background Information
 in Dar es Salaam: Background Information") Urban Spatial Scenario Design Modelling (USSDM) in Dar es Salaam: Background Information Modelling urban settlement dynamics in Dar es Salaam Revision: 2 (July 2013) Prepared by: Katja Buchta TUM team
Urban Spatial Scenario Design Modelling (USSDM) in Dar es Salaam: Background Information Modelling urban settlement dynamics in Dar es Salaam Revision: 2 (July 2013) Prepared by: Katja Buchta TUM team
Data driven approaches to Urban Planning Experience from Derry/Londonderry
 Data driven approaches to Urban Planning Experience from Derry/Londonderry Anna Rose RTPI Belfast 11 th of September 1 June 26 07:47AM 2 The value of the City The space of the city is a theatre: playing
The 3V Approach. Transforming the Urban Space through Transit Oriented Development. Gerald Ollivier Transport Cluster Leader World Bank Hub Singapore
 Transforming the Urban Space through Transit Oriented Development The 3V Approach Gerald Ollivier Transport Cluster Leader World Bank Hub Singapore MDTF on Sustainable Urbanization The China-World Bank
Accessibility analysis of multimodal transport systems using advanced GIS techniques
 Urban Transport XIII: Urban Transport and the Environment in the 21st Century 655 Accessibility analysis of multimodal transport systems using advanced GIS techniques T. Vorraa Citilabs Regional Director,
Lecture 7: Cellular Automata Modelling: Principles of Cell Space Simulation
 SCHOOL OF GEOGRAPHY Lecture 7: Cellular Automata Modelling: Principles of Cell Space Simulation Outline Types of Urban Models Again The Cellular Automata Approach: Urban Growth and Complexity Theory The
A Science of Cities. Models of Urban Form and Function. Michael
 July 27- August 2, 2014 A Science of Cities Models of Urban Form and Function Michael Batty m.batty@ucl.ac.uk @jmichaelbatty http://www.complexcity.info/ http://www.casa.ucl.ac.uk/ Centre Centre for Advanced
A Simplified Travel Demand Modeling Framework: in the Context of a Developing Country City
 A Simplified Travel Demand Modeling Framework: in the Context of a Developing Country City Samiul Hasan Ph.D. student, Department of Civil and Environmental Engineering, Massachusetts Institute of Technology,
Dar es Salaam - Reality Check Workshop
 Dar es Salaam - Reality Check Workshop hosted by GIZ and Dar es Salaam City Council Introduction: Key Urban Characteristics of Dar es Salaam Challenges and Opportunities for Resilient Development in the
Unit 1, Lesson 2. What is geographic inquiry?
 What is geographic inquiry? Unit 1, Lesson 2 Understanding the way in which social scientists investigate problems will help you conduct your own investigations about problems or issues facing your community
Transport Planning in Large Scale Housing Developments. David Knight
 Transport Planning in Large Scale Housing Developments David Knight Large Scale Housing Developments No longer creating great urban spaces in the UK (Hall 2014) Transport Planning Transport planning processes
Implementing Visual Analytics Methods for Massive Collections of Movement Data
 Implementing Visual Analytics Methods for Massive Collections of Movement Data G. Andrienko, N. Andrienko Fraunhofer Institute Intelligent Analysis and Information Systems Schloss Birlinghoven, D-53754
Gravity-Based Accessibility Measures for Integrated Transport-Land Use Planning (GraBAM)
") Gravity-Based Accessibility Measures for Integrated Transport-Land Use Planning (GraBAM) Enrica Papa, Pierluigi Coppola To cite this report: Enrica Papa and Pierluigi Coppola (2012) Gravity-Based Accessibility
Gravity-Based Accessibility Measures for Integrated Transport-Land Use Planning (GraBAM) Enrica Papa, Pierluigi Coppola To cite this report: Enrica Papa and Pierluigi Coppola (2012) Gravity-Based Accessibility
Forces and Movement. Book pg 23 25, /09/2016 Syllabus , 1.24
 Forces and Movement Book pg 23 25, 39-40 Syllabus 1.15-1.18, 1.24 Reflect What is the relationship between mass, force and acceleration? Learning Outcomes 1. Demonstrate an understanding of the effects
Unit 1, Lesson 3 What Tools and Technologies Do Geographers Use?
 Unit 1, Lesson 3 What Tools and Technologies Do Geographers Use? Geographers use a variety of tools and technologies in investigating geographic questions. Maps and globes both represent the earth, but
CIE4801 Transportation and spatial modelling Modal split
 CIE4801 Transportation and spatial modelling Modal split Rob van Nes, Transport & Planning 31-08-18 Delft University of Technology Challenge the future Content Nested logit part 2 Modelling component 3:
transportation research in policy making for addressing mobility problems, infrastructure and functionality issues in urban areas. This study explored
 ABSTRACT: Demand supply system are the three core clusters of transportation research in policy making for addressing mobility problems, infrastructure and functionality issues in urban areas. This study
Demographic Data in ArcGIS. Harry J. Moore IV
 Demographic Data in ArcGIS Harry J. Moore IV Outline What is demographic data? Esri Demographic data - Real world examples with GIS - Redistricting - Emergency Preparedness - Economic Development Next
What s wrong with sprawl? The urgent need for cost benefit analyses of modern urban growth patterns. Jacy Gaige
 What s wrong with sprawl? The urgent need for cost benefit analyses of modern urban growth patterns. Jacy Gaige Urban Econ 245 Professor Charles Becker Literature Review 1 Urban is hip. Bikes, messenger
East Bay BRT. Planning for Bus Rapid Transit
 East Bay BRT Planning for Bus Rapid Transit Regional Vision Draper Prison The Bottleneck is a State-Level issue, Salt Lake County 2050 Population: 1.5M Draper Prison hopefully with some State-Level funding!
Subject: Note on spatial issues in Urban South Africa From: Alain Bertaud Date: Oct 7, A. Spatial issues
 Page 1 of 6 Subject: Note on spatial issues in Urban South Africa From: Alain Bertaud Date: Oct 7, 2009 A. Spatial issues 1. Spatial issues and the South African economy Spatial concentration of economic
M. Saraiva* 1 and J. Barros 1. * Keywords: Agent-Based Models, Urban Flows, Accessibility, Centrality.
 The AXS Model: an agent-based simulation model for urban flows M. Saraiva* 1 and J. Barros 1 1 Department of Geography, Birkbeck, University of London, 32 Tavistock Square, London, WC1H 9EZ *Email: m.saraiva@mail.bbk.ac.uk
Place Syntax Tool (PST)
") Place Syntax Tool (PST) Alexander Ståhle To cite this report: Alexander Ståhle (2012) Place Syntax Tool (PST), in Angela Hull, Cecília Silva and Luca Bertolini (Eds.) Accessibility Instruments for Planning
Place Syntax Tool (PST) Alexander Ståhle To cite this report: Alexander Ståhle (2012) Place Syntax Tool (PST), in Angela Hull, Cecília Silva and Luca Bertolini (Eds.) Accessibility Instruments for Planning
Techniques for Science Teachers: Using GIS in Science Classrooms.
 Techniques for Science Teachers: Using GIS in Science Classrooms. After ESRI, 2008 GIS A Geographic Information System A collection of computer hardware, software, and geographic data used together for
SPATIAL INEQUALITIES IN PUBLIC TRANSPORT AVAILABILITY: INVESTIGATION WITH SMALL-AREA METRICS
 SPATIAL INEQUALITIES IN PUBLIC TRANSPORT AVAILABILITY: INVESTIGATION WITH SMALL-AREA METRICS Research conducted by Yeran Sun and Piyushimita (Vonu) Thakuriah Presented by Obinna C.D. Anejionu INTRODUCTION
Part 1: Measures of accessibility
 Part 1: Measures of accessibility 1. INTRODUCTION Accessibility is a term often used in transport and land-use planning, and is generally understood to mean approximately ease of reaching'. However, the
Early College High School PreAP World Geography Summer Reading Assignment
 Early College High School PreAP World Geography Summer Reading Assignment In preparation for your studies in World Geography you will be familiarizing yourself with the 5 Themes of Geography. This assignment
Figure 8.2a Variation of suburban character, transit access and pedestrian accessibility by TAZ label in the study area
 Figure 8.2a Variation of suburban character, transit access and pedestrian accessibility by TAZ label in the study area Figure 8.2b Variation of suburban character, commercial residential balance and mix
Joint-accessibility Design (JAD) Thomas Straatemeier
 Thomas Straatemeier") Joint-accessibility Design (JAD) Thomas Straatemeier To cite this report: Thomas Straatemeier (2012) Joint-accessibility Design (JAD), in Angela Hull, Cecília Silva and Luca Bertolini (Eds.) Accessibility
Joint-accessibility Design (JAD) Thomas Straatemeier To cite this report: Thomas Straatemeier (2012) Joint-accessibility Design (JAD), in Angela Hull, Cecília Silva and Luca Bertolini (Eds.) Accessibility
MOBILITIES AND LONG TERM LOCATION CHOICES IN BELGIUM MOBLOC
 MOBILITIES AND LONG TERM LOCATION CHOICES IN BELGIUM MOBLOC A. BAHRI, T. EGGERICKX, S. CARPENTIER, S. KLEIN, PH. GERBER X. PAULY, F. WALLE, PH. TOINT, E. CORNELIS SCIENCE FOR A SUSTAINABLE DEVELOPMENT
Forecasts for the Reston/Dulles Rail Corridor and Route 28 Corridor 2010 to 2050
 George Mason University Center for Regional Analysis Forecasts for the Reston/Dulles Rail Corridor and Route 28 Corridor 21 to 25 Prepared for the Fairfax County Department of Planning and Zoning Lisa
OPTIMISING SETTLEMENT LOCATIONS: LAND-USE/TRANSPORT MODELLING IN CAPE TOWN
 OPTIMISING SETTLEMENT LOCATIONS: LAND-USE/TRANSPORT MODELLING IN CAPE TOWN Molai, L. and Vanderschuren, M.J.W.A. Civil Engineering, Faculty of Engineering and the Built Environment, University of Cape
How GIS can support the Production
 How GIS can support the Production of Local Development Plans ESRI User Conference 2017 Mandy Maas ARUP Who we are Shaping a better world We are an independent firm of designers, planners, engineers, consultants
PRIMA. Planning for Retailing in Metropolitan Areas
 PRIMA Planning for Retailing in Metropolitan Areas Metropolitan Dimension to sustainable retailing futures Metropolitan strategies Retailing in city and town centres will be a primary component of any
APPENDIX I: Traffic Forecasting Model and Assumptions
 APPENDIX I: Traffic Forecasting Model and Assumptions Appendix I reports on the assumptions and traffic model specifications that were developed to support the Reaffirmation of the 2040 Long Range Plan.
The Model Research of Urban Land Planning and Traffic Integration. Lang Wang
 International Conference on Materials, Environmental and Biological Engineering (MEBE 2015) The Model Research of Urban Land Planning and Traffic Integration Lang Wang Zhejiang Gongshang University, Hangzhou
Traffic Demand Forecast
 Chapter 5 Traffic Demand Forecast One of the important objectives of traffic demand forecast in a transportation master plan study is to examine the concepts and policies in proposed plans by numerically
Local Area Key Issues Paper No. 13: Southern Hinterland townships growth opportunities
 Draft Sunshine Coast Planning Scheme Review of Submissions Local Area Key Issues Paper No. 13: Southern Hinterland townships growth opportunities Key Issue: Growth opportunities for Southern Hinterland
Climate Risk Visualization for Adaptation Planning and Emergency Response
 Climate Risk Visualization for Adaptation Planning and Emergency Response NCR Flood Fact Finding Workshop Ricardo Saavedra ricardo@vizonomy.com Social Media, Mobile, and Big Data St. Peter s Basilica,
Baccalieu Collegiate. Physics Course Outline
 Baccalieu Collegiate Physics 2204 Course Outline Course Content: Unit 1: Kinematics Motion is a common theme in our everyday lives: birds fly, babies crawl, and we, ourselves, seem to be in a constant
Tue Sept 15. Dynamics - Newton s Laws of Motion. Forces: Identifying Forces Free-body diagram Affect on Motion
 Tue Sept 15 Assignment 4 Friday Pre-class Thursday Lab - Print, do pre-lab Closed toed shoes Exam Monday Oct 5 7:15-9:15 PM email me if class conflict or extended time Dynamics - Newton s Laws of Motion
Trip Generation Model Development for Albany
 Trip Generation Model Development for Albany Hui (Clare) Yu Department for Planning and Infrastructure Email: hui.yu@dpi.wa.gov.au and Peter Lawrence Department for Planning and Infrastructure Email: lawrence.peter@dpi.wa.gov.au
Estimating Transportation Demand, Part 2
 Transportation Decision-making Principles of Project Evaluation and Programming Estimating Transportation Demand, Part 2 K. C. Sinha and S. Labi Purdue University School of Civil Engineering 1 Estimating
Velocity Time Graphs 12.2
 1. Velocity Time Graphs How are velocities represented on a graph? You can translate the situation shown in Figure 1 into a velocity time graph by first assigning one direction, for example east, as the
Travel Time Calculation With GIS in Rail Station Location Optimization
 Travel Time Calculation With GIS in Rail Station Location Optimization Topic Scope: Transit II: Bus and Rail Stop Information and Analysis Paper: # UC8 by Sutapa Samanta Doctoral Student Department of
Urban Form and Travel Behavior:
 Urban Form and Travel Behavior: Experience from a Nordic Context! Presentation at the World Symposium on Transport and Land Use Research (WSTLUR), July 28, 2011 in Whistler, Canada! Petter Næss! Professor
Give 4 advantages of using ICT in the collection of data. Give. Give 4 disadvantages in the use of ICT in the collection of data
 Give 4 advantages of using ICT in the collection of data can use a handheld GPS to get accurate location information which can be used to show data linked to specific locations within a GIS can collect
Analysis and Design of Urban Transportation Network for Pyi Gyi Ta Gon Township PHOO PWINT ZAN 1, DR. NILAR AYE 2
 www.semargroup.org, www.ijsetr.com ISSN 2319-8885 Vol.03,Issue.10 May-2014, Pages:2058-2063 Analysis and Design of Urban Transportation Network for Pyi Gyi Ta Gon Township PHOO PWINT ZAN 1, DR. NILAR AYE
Urban Planning Word Search Level 1
 Urban Planning Word Search Level 1 B C P U E C O S Y S T E M P A R E U O E U R B A N P L A N N E R T N S T D H E C O U N T Y G E R E R D W R E N I C I T Y C O U N C I L A A A S U G G C I L A G P R I R
APPENDIX IV MODELLING
 APPENDIX IV MODELLING Kingston Transportation Master Plan Final Report, July 2004 Appendix IV: Modelling i TABLE OF CONTENTS Page 1.0 INTRODUCTION... 1 2.0 OBJECTIVE... 1 3.0 URBAN TRANSPORTATION MODELLING
Shaping Your Neighbourhood
 Shaping Your Neighbourhood Building a Core Sustainable Neighbourhood Action Plan Nov. 25 & 26, 2006 Welcome! Peter Russell Planner, Holland Barrs Planning Group Inc. Role in this project: Work with the
STILLORGAN QBC LEVEL OF SERVICE ANALYSIS
 4-5th September, STILLORGAN QBC LEVEL OF SERVICE ANALYSIS Mr David O Connor Lecturer Dublin Institute of Technology Mr Philip Kavanagh Graduate Planner Dublin Institute of Technology Abstract Previous
THE FUTURE OF FORECASTING AT METROPOLITAN COUNCIL. CTS Research Conference May 23, 2012
 THE FUTURE OF FORECASTING AT METROPOLITAN COUNCIL CTS Research Conference May 23, 2012 Metropolitan Council forecasts Regional planning agency and MPO for Twin Cities metropolitan area Operates regional
Riocan Centre Study Area Frontenac Mall Study Area Kingston Centre Study Area
 OVERVIEW the biggest challenge of the next century (Dunham Jones, 2011). New books are continually adding methods and case studies to a growing body of literature focused on tackling this massive task.
Chapter 4 Linear Motion
 Chapter 4 Linear Motion You can describe the motion of an object by its position, speed, direction, and acceleration. I. Motion Is Relative A. Everything moves. Even things that appear to be at rest move.
Edexcel Geography Advanced Paper 2
 Edexcel Geography Advanced Paper 2 SECTION B: SHAPING PLACES Assessment objectives AO1 Demonstrate knowledge and understanding of places, environments, concepts, processes, interactions and change, at
How is public transport performing in Australia
 How is public transport performing in Australia CILTA Moving People Thursday 17 March 2011 Professor Corinne Mulley Institute of Transport and Logistics Studies Outline Measuring performance Australia
Shall we Dense?: Policy Potentials. Summary. Simon McPherson Director SJB Urban Australia au
 Shall we dense? Shall we Dense?: Policy Potentials Simon McPherson Director SJB Urban Australia smcpherson@sjb.com. au Adam Haddow Director SJB Architects Australia ahaddow@sjb.com.au Summary This paper
Christina Karaberi- Msc Health Management European Program Manager ITR. CityMobil2 Reference Group Meeting, Antibes, France 22/03/206
 TRIKALA DEMONSTRATION TITLE A CTS SITE- FOR Large THE Scale PerspectiveNEW ROME EXHIBITION Christina Karaberi- Msc Health Management European Program Manager E-Trikala Gabriele S.A Giustiniani, ITR 22/03/206
Key Indicators for Territorial Cohesion and Spatial Planning in Preparing Territorial Development Strategies
 ESPON Evidence in a North European Context Challenges and Opportunities for Territorial Development and Cohesion in a North European Macro Region, 10-11 April, 2014, Vilnius, Lithuania Key Indicators for
The Built Environment, Car Ownership, and Travel Behavior in Seoul
 The Built Environment, Car Ownership, and Travel Behavior in Seoul Sang-Kyu Cho, Ph D. Candidate So-Ra Baek, Master Course Student Seoul National University Abstract Although the idea of integrating land