Smart Cities & Big Data How We Can Make Cities More Resilient
|
|
|
- James Fowler
- 6 years ago
- Views:
Transcription
1 July 15 th 19 th 2012 University College Dublin Smart Cities & Big Data How We Can Make Cities More Resilient Michael Centre Centre for Advanced for Advanced Spatial Spatial Analysis, University College London AESOP ACSP 2013.pdf 1


2 2


3 Key Themes Changes: Big Data, Short Times, Fine Spatial Scales: The Next 5 Minutes or the Next 5 Years? How Do We Articulate Resilience in Urban Systems: Complexity, Redundancy, Robustness yet Fragility The London Oyster Card Data Set Simpler Systems: Public Bikes as Exemplar Long & Short Term Flooding: Tyndall Cities Project Big Disruptions in Infrastructure: Olympics,Cross Rail Regional Breakdown: Phase Transitions Attempting a Synthesis: What Next for Planning? 3
4 Changes: Big Data, Short Times, Fine Spatial Scales: The Next 5 Minutes or the Next 5 Years? Big data is distorting or at least changing our attention span from longer to shorter time periods in which intervention takes place This is because big data is largely but not exclusively based on massive volumes terabytes over very short time spans seconds at very precise spatial scales centimetres or less The focus thus turns to issues such as disruption of systems for individuals over 5 minutes to 1 hour to 1 day rather than change for aggregate groups of populations from 1 year to 5 years to 50 years. To an extent there is a general shift from equity to efficiency. Of course big data is also being streamed incessantly without any potential end limit although systems will inevitably change and there is no guarantee that big data will tell us about change on any and every time scale. Big data can also be traditionally collected data by manual means and a good working definition is anything that will not fit into an Excel spreadsheet 4.56 million individual records the population of Ireland is big data and it might be collected from many sources none of which are streamed in real time. Big data is also as unreliable as small data and perhaps more so and I will tell you of some problems in it as we go along. 4

5 How Do We Articulate Resilience in Urban Systems: Complexity, Redundancy, Robust Yet Fragile If our attention is shifted to the short term, the focus changes from issues of equity in aggregate populations to issues of efficiency in individual behaviours. The focus also shifts from ideal states to dynamic change. It shifts to how systems are disrupted, and one of the very obvious ways is that the links between the parts that compose a system get fractured or broken in some way. In short, the very definition of a system as a set of interacting parts contains within it the seeds of its own destruction. Networks and their robustness to fracture is of the essence. Now in the popular science book Resilience written by Zolli and Healy last year, the reviewer in Time magazine had this to say of the ideas: In the 21st century, disruption is going to become the new normal in ways that we can t even predict. All we can do is learn to bounce back better In fact we now have quite a lot of science to help us in thinking this way and much of this grows out of the systems approach, its successor complexity theory, and of course its specific tools such as network science. 5
6 A science of resilient systems is in the making depending on new notions about systems as much as developments like big data. It depends on notions such as how can networks remain robust while at the same time being fragile, how can they suddenly disrupt without any obvious slow and sure warnings, what bits of them can be attacked with little or nothing happening and what bits can be attacked with a lot happening. This is the science of small worlds, tipping points, weak ties, key hubs, catastrophes, bifurcations,, order effects, infinite repercussions and so on. It is the science of phase transition, of complexity and most of all of redundancy in systems. It is the science of heart attacks, and societal collapse and much else besides. It is the science of how the flows and interactions, how social networks keep the city functioning. There are many many examples particularly pertaining to transport but peel back the layers and same logics apply to everything from the financial crisis to the spread of epidemics. My recent favourite example is the M25 orbital road which has not had one day free of closure in the last 3 years. Even more recently failures in the UK NHS due to systematic management breakdowns, not resources per se. An excellent example of all of this is the forest fire and let me tell you how such a fire works. Imagine a grid of trees widely spaced a tree catches fire due to a lightening strike but burns out. As the trees get closer together, those adjacent to one another burn but only when 59% of the area of the forest is full of trees, does the entire forest burn down. This is the percolation limit absolutely critical for breakdown. 6

7 The London Oyster Card Data Set Ok let me begin to illustrate these ideas with some examples. which involve big data and networks. Our Oyster card data set involves all tap in and tap outs by unique ID number with location and time for every person over a 6 month period 7 million a day, 40 million a week, 160 million a month, nearly 1 billion for every half year. This is very big data simply to explore it takes a lot of computer time It is very good data in that we can begin to get a very detailed sense of how people travel over time the routiness of travel but there are a lot of holes in the data too. Tube, Overground and National Rail Networks in London where Oyster cards can be used 7


8 Roth C., Kang S. M., Batty, M., and Barthelemy, M. (2011) Structure of Urban Movements: Polycentric Activity and Entangled Hierarchical Flows. PLoS ONE 6(1): e doi: /journal.pone Animation over 24 hours of speeded up position/time of tubes: How can we match this supply of vehicles from the API queries to the demand from the Oyster card data? 8


9 The effect of a bus strike Tuesday 22 nd May 2012, 09:00 Wednesday 23 rd May 2012, 09:00 The left image shows the effect of the bus strike on 22 nd May 2012, while the image on the right shows a normal day. 9

10 Disruption caused by closing Liverpool Street in terms of the graph of the tube network Closing Green Park shifts in betweenness centrality Bank & Monument Stations: 5 Lines and 2 Modes 60k Entries/Exits Weekdays 35k Entries/Exits Weekends 10
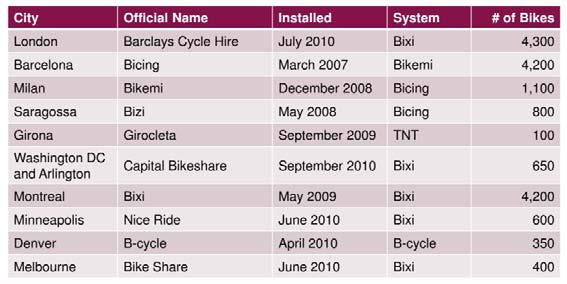
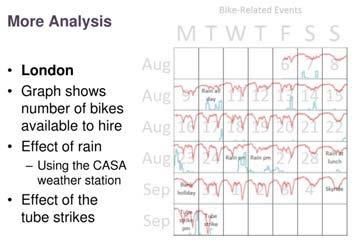
11 Particular Events: Weekdays, Saturdays and Sundays Entry at Camden Town (10 Mn. Intervals) Entry at Arsenal (10 Mn. Intervals) Weekday Weekday 300 Saturday Sunday 800 Saturday Sunday Number of Events Number of Events Events Nightlife am 4am 6am 8am 10am 12pm 2pm 4pm 6pm 8pm 10pm 12am 2am 4am 100 2am 4am 6am 8am 10am 12pm 2pm 4pm 6pm 8pm 10pm 12am 2am 4am Time of Day Time of Day Entry at Bank (10 Mn. Intervals) Entry at Bayswater (10 Mn. Intervals) Weekday Weekday 800 Saturday Sunday Saturday Sunday Number of Events Number of Events Work 100 Tourism? am 4am 6am 8am 10am 12pm 2pm 4pm 6pm 8pm 10pm 12am 2am 4am 150 2am 4am 6am 8am 10am 12pm 2pm 4pm 6pm 8pm 10pm 12am 2am 4am Time of Day Time of Day Simpler Systems: Public Bike as Exemplars World wide case study from Ollie O Brien: 100 cities, 3 years of data Docking station status Journey records Looking at cultural behaviour Each docking station shown by a circle Blue = empty, Purple = ~50% full, Red = full Normally two graphs Weekday (normally Wednesday) Weekend (normally Saturday) Live versions at Let us look at London 11


![[10] The coverage zone spans approximately 17 square](/docs-images/77/75327833/images/12-2.jpg "miles (44 km2), roughly matching the Zone 1 Travelcard")

12 The Barclays Cycle Hire London Project BCH commenced operations in July 2010 with 5,000 bicycles and 315 docking stations distributed across the City of London and parts of eight London boroughs.[10] The coverage zone spans approximately 17 square miles (44 km2), roughly matching the Zone 1 Travelcard area. Currently there are some 8,000 'Boris Bikes' and 570 docking stations in the BCH scheme, which has been used for over 19 million journeys to date 12


13 13


14 As yet no records of demand from people logging on, so no management capabilities, but could happen probably from an App based software but maybe from the server 14


15 15


16 The Website: Real Time Visualisation of Origins and Destinations Activity 16


17 Your can play back the last couple of days from the animator for many of the cities where the data is captured online Initial Analyses Flows Origins and Destinations 17


18 Thre are quite a few visualisations on Vimeo which have been developed by James Cheshire and Martin Austwick where they have used shortest routes methods to figure out bike paths And one from Jo Wood at City University 18


19 Long & Short Term Flooding: The Tyndall Cities Project We have been involved in a large consortium project led by Newcastle Civ Eng to look at an integrated assessment of climate change in Greater London MoSeS 19


20 Flooding from our 3D Virtual London Model Shifts in Traffic Accessibility if all Bridges across the Thames are Inoperable as far West as Hammersmith 20


21 Big Disruptions/Additions in Infrastructure: The Olympics games Regeneration of East London and Cross Rail The Impact of Additional Employment and Population at the Olympic Games Site in East London 21

 Urban Regeneration as Self")

22 Absolute Gains in Population (left) in East London but Relative% Gains in Population in West London (right) M. Batty (2012) Urban Regeneration as Self Organisation, Architectural Design, 215, Cross Rail: The High Speed Rail Line from Maidenhead to Stratford 30 trains an hour each way 22
23 Regional Breakdown: Phase Transitions My last example shifts scale massively to the entire country. We are working on a problem essentially in the regional economic geography of the UK or at least England, Wales and Scotland examining how prosperous cities are with scale. This is called allometry of city sizes the idea is that as cities grow they generate economies of scale and to cut a long story short, their per capita income grows with size. This is called superlinearity in short their metabolism get faster with size the pace of life gets faster, congestion gets greater and crime gets greater per capita as does income, inventiveness and so on I cant go into this in any detailed but to do this we need to construct cities from the ground up to define them the work done in the US for MSAs indicates that for every doubling of city size, income more than doubles going up by 215% or so. In the UK we have not found this incomes do not go up superlinearly but linearly and this we believe is due to many factors it may well be that the UK urban system is much more integrated than the US more global and it may be that policy, historical path dependence of how the country has developed and so on is key we don t know but we need to define proper defintions of cities and this we are using percolation theory to do this let me give you a sense of how we can break up the regional system from the UK network 23


24 log access log pop A Theory of City Size, Science, 21 June 2013: Vol. 340, What we do is we decrease the distance threshold for places to connect with one another systematically, starting from any integrated system where we show the top ten clusters in terms of size This reveals the splits in the system eventually giving us cities 24
25 Attempting a Synthesis: What Next for Planning? Ok a longish talk I know but basically my point is that big data is changing our focus and in some senses planning needs to respond The danger is that we shift too radically big data gives is the opportunity to develop new more focussed tools for dealing with short terms changes but this does not negate long term change, our traditional focus In some senses, this enriches our ability to understand, manage and intervene. There is also a warning we need to embrace these new technologies before then embrace us and work with many groups of people other disciplines that are moving in on these domains I could say a lot more but I won t just to give you my coordinates and remind you that this power point as a pdf is on one of our blogs at AESOP ACSP 2013.pdf M. Batty, CASA, UCL, 90 Tottenham Court Road, London WC1E 6BT m.batty@ucl.ac.uk 25
Smart Cities, Data and Big Data
 Urban and Regional Planning for Urban Design October 2015 Smart Cities, Data and Big Data Michael Batty m.batty@ucl.ac.uk @jmichaelbatty http://www.complexcity.info/ http://www.spatialcomplexity.info/
City Models to Explore the Impact of New Urban Infrastructures
 June 29 th 2016 City Models to Explore the Impact of New Urban Infrastructures Michael Batty m.batty@ucl.ac.uk @jmichaelbatty http://www.complexcity.info/ http://www.spatialcomplexity.info/ My Main Themes
Mapping Travel-To-Work Flows. Oliver O Brien and James Cheshire Department of Geography, UCL
 Mapping Travel-To-Work Flows Oliver O Brien and James Cheshire Department of Geography, UCL RSAI-BIS Annual Conference (UKDS-CS Sessions), Harrogate, 23 August 2017 Contents 1. The DataShine Project &
Integrated Modelling of the Spatial Impacts of Climate Change In Greater London
 Megacities, Vulnerability and Global Climate Change: FAPESP: City of São Paulo, July 20 th 22 nd 2009 Integrated Modelling of the Spatial Impacts of Climate Change In Greater London Michael Batty University
UCL CENTRE FOR ADVANCED SPATIAL ANALYSIS. Mapping London. Oliver O Brien and James Cheshire. Society of Cartographers 48 th Annual Conference (UCL)
") UCL CENTRE FOR ADVANCED SPATIAL ANALYSIS Mapping London Oliver O Brien and James Cheshire Society of Cartographers 48 th Annual Conference (UCL) 5 September 2012 The Mapping London Blog A blog highlighting
UCL CENTRE FOR ADVANCED SPATIAL ANALYSIS Mapping London Oliver O Brien and James Cheshire Society of Cartographers 48 th Annual Conference (UCL) 5 September 2012 The Mapping London Blog A blog highlighting
T H I R T Y L O D G E R O A D L O N D O N N W 8 8 N T F R E E H O L D D E V E L O P M E N T O P P O R T U N I T Y
 T H I R T Y L O D G E R O A D L O N D O N N W 8 8 N T F R E E H O L D D E V E L O P M E N T O P P O R T U N I T Y 3 0 L O D G E R O A D L O N D O N N W 8 8 N T Oxford Street Marylebone Station Regent s
1. Richard Milton 2. Steven Gray 3. Oliver O Brien Centre for Advanced Spatial Analysis (UCL)
") UCL CENTRE FOR ADVANCED SPATIAL ANALYSIS Apps Delivering Information to Mass Audiences 1. Richard Milton 2. Steven Gray 3. Oliver O Brien Centre for Advanced Spatial Analysis (UCL) Scott Adams 1995 The
UCL CENTRE FOR ADVANCED SPATIAL ANALYSIS Apps Delivering Information to Mass Audiences 1. Richard Milton 2. Steven Gray 3. Oliver O Brien Centre for Advanced Spatial Analysis (UCL) Scott Adams 1995 The
1 A Science of Cities
 5 th February 2014 1 A Science of Cities Michael Batty m.batty@ucl.ac.uk @jmichaelbatty http://www.complexcity.info/ http://www.casa.ucl.ac.uk/ Centre Centre for Advanced for Advanced Spatial Spatial Analysis,
Extending the Focus of Urban Modelling Tools
 A Meeting sponsored by ASU, UCL, Newcastle Universities and the British Consulate, 21-23 May 2010 Extending the Focus of Urban Modelling Tools Michael Batty University College London m.batty@ucl.ac.uk
? 4. Like number bonds, a formula is useful because it helps us know what operation to use depending on which pieces of information we have.
 UNIT SIX DECIMALS LESSON 168 PROBLEM-SOLVING You ve covered quite a distance in your journey through our number system, from whole numbers through fractions, to decimals. Today s math mysteries all have
INTRODUCTION. In March 1998, the tender for project CT.98.EP.04 was awarded to the Department of Medicines Management, Keele University, UK.
 INTRODUCTION In many areas of Europe patterns of drug use are changing. The mechanisms of diffusion are diverse: introduction of new practices by new users, tourism and migration, cross-border contact,
CIV3703 Transport Engineering. Module 2 Transport Modelling
 CIV3703 Transport Engineering Module Transport Modelling Objectives Upon successful completion of this module you should be able to: carry out trip generation calculations using linear regression and category
of places Key stage 1 Key stage 2 describe places
 Unit 25 Geography and numbers ABOUT THE UNIT This continuous unit aims to show how geographical enquiry can provide a meaningful context for the teaching and reinforcement of many aspects of the framework
Forecasts from the Strategy Planning Model
 Forecasts from the Strategy Planning Model Appendix A A12.1 As reported in Chapter 4, we used the Greater Manchester Strategy Planning Model (SPM) to test our long-term transport strategy. A12.2 The origins
Infrastructure to Explore Geographic Systems through Models and Maps
 Exemplar 1: GeoVUE Then GENeSIS (GENerative e SocIalScience) Infrastructure to Explore Geographic Systems through Models and Maps Michael Batty University College London m.batty@ucl.ac.uk http://www.casa.ucl.ac.uk/
A Land Use Transport Model for Greater London:
 Spatio-Temporal Analysis of Network Data and Road Developments Launch Event Workshop UCL Monday 18 May 2009 A Land Use Transport Model for Greater London: With Applications to an Integrated Assessment
Note on Transportation and Urban Spatial Structure
 Note on Transportation and Urban Spatial Structure 1 By Alain Bertaud, Washington, ABCDE conference, April 2002 Email: duatreb@msn.com Web site: http://alain-bertaud.com/ http://alainbertaud.com/ The physical
Simple Spatial Growth Models The Origins of Scaling in Size Distributions
 Lectures on Spatial Complexity 17 th 28 th October 2011 Lecture 3: 21 st October 2011 Simple Spatial Growth Models The Origins of Scaling in Size Distributions Michael Batty m.batty@ucl.ac.uk @jmichaelbatty
Riocan Centre Study Area Frontenac Mall Study Area Kingston Centre Study Area
 OVERVIEW the biggest challenge of the next century (Dunham Jones, 2011). New books are continually adding methods and case studies to a growing body of literature focused on tackling this massive task.
CIMA Professional 2018
 CIMA Professional 2018 Newcastle Interactive Timetable Version 10.20 Information last updated 12/06/18 Please note: Information and dates in this timetable are subject to change. A better way of learning
Typical information required from the data collection can be grouped into four categories, enumerated as below.
 Chapter 6 Data Collection 6.1 Overview The four-stage modeling, an important tool for forecasting future demand and performance of a transportation system, was developed for evaluating large-scale infrastructure
Data driven approaches to Urban Planning Experience from Derry/Londonderry
 Data driven approaches to Urban Planning Experience from Derry/Londonderry Anna Rose RTPI Belfast 11 th of September 1 June 26 07:47AM 2 The value of the City The space of the city is a theatre: playing
East Bay BRT. Planning for Bus Rapid Transit
 East Bay BRT Planning for Bus Rapid Transit Regional Vision Draper Prison The Bottleneck is a State-Level issue, Salt Lake County 2050 Population: 1.5M Draper Prison hopefully with some State-Level funding!
The 3V Approach. Transforming the Urban Space through Transit Oriented Development. Gerald Ollivier Transport Cluster Leader World Bank Hub Singapore
 Transforming the Urban Space through Transit Oriented Development The 3V Approach Gerald Ollivier Transport Cluster Leader World Bank Hub Singapore MDTF on Sustainable Urbanization The China-World Bank
Early College High School PreAP World Geography Summer Reading Assignment
 Early College High School PreAP World Geography Summer Reading Assignment In preparation for your studies in World Geography you will be familiarizing yourself with the 5 Themes of Geography. This assignment
CIMA Professional 2018
 CIMA Professional 2018 Interactive Timetable Version 16.25 Information last updated 06/08/18 Please note: Information and dates in this timetable are subject to change. A better way of learning that s
Unit 1 Part 2. Concepts Underlying The Geographic Perspective
 Unit 1 Part 2 Concepts Underlying The Geographic Perspective Unit Expectations 1.B Enduring Understanding: Students will be able to.. Know that Geography offers asset of concepts, skills, and tools that
Using Social Media for Geodemographic Applications
 Using Social Media for Geodemographic Applications Muhammad Adnan and Guy Lansley Department of Geography, University College London @gisandtech @GuyLansley Web: http://www.uncertaintyofidentity.com Outline
Data Collection. Lecture Notes in Transportation Systems Engineering. Prof. Tom V. Mathew. 1 Overview 1
 Data Collection Lecture Notes in Transportation Systems Engineering Prof. Tom V. Mathew Contents 1 Overview 1 2 Survey design 2 2.1 Information needed................................. 2 2.2 Study area.....................................
Land Use Transportation Interaction Models
 Opening Lecture 2 September 4 th 2014 Land Use Transportation Interaction Models Michael Batty m.batty@ucl.ac.uk @michaelbatty http://www.complexcity.info/ http://www.spatialcomplexity.info/ Outline Preliminary
Regional Growth Strategy Work Session Growth Management Policy Board
 Regional Growth Strategy Work Session Growth Management Policy Board September 6, 2018 1 Overview Recap June GMPB work session Objectives and outcomes Regional geographies Growth scenarios Breakout Discussion:
Cities, AI, Design, & the Future Can Artificial Intelligence Improve Design Intelligence?
 March 27 th 28 Cities, AI, Design, & the Future Can Artificial Intelligence Improve Design Intelligence? Michael Batty m.batty@ucl.ac.uk @jmichaelbatty http://www.spatialcomplexcity.info/ http://www.casa.ucl.ac.uk/
The spatial network Streets and public spaces are the where people move, interact and transact
 The spatial network Streets and public spaces are the where people move, interact and transact The spatial network Cities are big spatial networks that create more of these opportunities Five key discoveries
Urban Regeneration as Self-Organisation
 Forthcoming special issue of Architectural Design on London (Re)generation, edited by David Littlefield Urban Regeneration as Self-Organisation Michael Batty Centre for Advanced Spatial Analysis (CASA)
SPATIAL INEQUALITIES IN PUBLIC TRANSPORT AVAILABILITY: INVESTIGATION WITH SMALL-AREA METRICS
 SPATIAL INEQUALITIES IN PUBLIC TRANSPORT AVAILABILITY: INVESTIGATION WITH SMALL-AREA METRICS Research conducted by Yeran Sun and Piyushimita (Vonu) Thakuriah Presented by Obinna C.D. Anejionu INTRODUCTION
Weather forecasts and warnings: Support for Impact based decision making
 Weather forecasts and warnings: Support for Impact based decision making Gerry Murphy, Met Éireann www.met.ie An Era of Change Climate and weather is changing Societal vulnerability is increasing The nature
Preliminary Physics. Moving About. DUXCollege. Week 2. Student name:. Class code:.. Teacher name:.
 Week 2 Student name:. Class code:.. Teacher name:. DUXCollege Week 2 Theory 1 Present information graphically of: o Displacement vs time o Velocity vs time for objects with uniform and non-uniform linear
Lecture 19: Common property resources
 Lecture 19: Common property resources Economics 336 Economics 336 (Toronto) Lecture 19: Common property resources 1 / 19 Introduction Common property resource: A resource for which no agent has full property
Forecasting Australian Transport
 Australasian Transport Research Forum Proceedings 3 September - 2 October, Sydney, Australia Publication website: http://www.atrf.info/papers/index.aspx Forecasting Australian Transport David Gargett Bureau
ENV208/ENV508 Applied GIS. Week 1: What is GIS?
 ENV208/ENV508 Applied GIS Week 1: What is GIS? 1 WHAT IS GIS? A GIS integrates hardware, software, and data for capturing, managing, analyzing, and displaying all forms of geographically referenced information.
COSMIC: COmplexity in Spatial dynamic
 COSMIC: COmplexity in Spatial dynamic MICs 9 10 November, Brussels Michael Batty University College London m.batty@ucl.ac.uk http://www.casa.ucl.ac.uk/ Outline The Focus of the Pilot The Partners: VU,
CIMA Professional
 CIMA Professional 201819 Manchester Interactive Timetable Version 3.1 Information last updated 12/10/18 Please note: Information and dates in this timetable are subject to change. A better way of learning
CIMA Professional
 CIMA Professional 201819 Birmingham Interactive Timetable Version 3.1 Information last updated 12/10/18 Please note: Information and dates in this timetable are subject to change. A better way of learning
Land Use Transportation Interaction Models
 July 27- August 2, 2014 Land Use Transportation Interaction Models Michael Batty m.batty@ucl.ac.uk @michaelbatty http://www.complexcity.info/ http://www.spatialcomplexity.info/ Outline Preliminary Ideas:
Trip and Parking Generation Study of Orem Fitness Center-Abstract
 Trip and Parking Generation Study of Orem Fitness Center-Abstract The Brigham Young University Institute of Transportation Engineers student chapter (BYU ITE) completed a trip and parking generation study
The GeoSix and the bushfire
 Core units: Exemplars Year 5 Illustration 1: Bushfire stories The GeoSix and the bushfire Chapter One Dominic, Antonia, Sophie, Hannah, Joshua and Jonty were going away together again. After their last
Key Issue 1: Where Are Services Distributed? INTRODUCING SERVICES AND SETTLEMENTS LEARNING OUTCOME DESCRIBE THE THREE TYPES OF SERVICES
 Revised 2017 NAME: PERIOD: Rubenstein: The Cultural Landscape (12 th edition) Chapter Twelve Services and Settlements (pages 430 thru 457) This is the primary means by which you will be taking notes this
Making maps: Traditions and perceptions in Europe. European spatial planning and cartographic representations
 ESPON Create Europe! Making maps: Traditions and perceptions in Europe Dr. Stefanie Dühr University of the West of England, Bristol, UK European spatial planning and cartographic representations Scenarios.
Parking Study MAIN ST
 Parking Study This parking study was initiated to help understand parking supply and parking demand within Oneida City Center. The parking study was performed and analyzed by the Madison County Planning
Expanding Canada s Rail Network to Meet the Challenges of the Future
 Expanding Canada s Rail Network to Meet the Challenges of the Future Lesson Overview Rail may become a more popular mode of transportation in the future due to increased population, higher energy costs,
Foreword. Vision and Strategy
 GREATER MANCHESTER SPATIAL FRAMEWORK Friends of Walkden Station Consultation Response January 2017 Foreword Friends of Walkden Station are a group of dedicated volunteers seeking to raise the status and
Identifying Megaregions in the US: Implications for Infrastructure Investment
 7. 10. 2 0 08 Identifying Megaregions in the US: Implications for Infrastructure Investment Dr. Myungje Woo Dr. Catherine L. Ross Jason Barringer Harry West Jessica Lynn Harbour Doyle Center for Quality
Unit 2 Lesson 2: The Study of Pre-History
 Unit 2 Lesson 2: The Study of Pre-History Content Expectations 6 and 7 Explain how historians use a variety of sources to explore the past (e.g., artifacts, H1.2.1: Primary and secondary sources including
Curriculum Catalog
 2017-2018 Curriculum Catalog - for use with AP courses 2017 Glynlyon, Inc. - for use with AP courses Table of Contents HUMAN GEOGRAPHY COURSE OVERVIEW... 1 UNIT 1: GEOGRAPHY NATIVE AND PERSPECTIVE... 1
Wednesday 3 June 2015 Afternoon
 Oxford Cambridge and RSA H Wednesday 3 June 2015 Afternoon GCSE GEOGRAPHY B B563/02 Key Geographical Themes (Higher Tier) *4390586245* Candidates answer on the Question Paper. OCR supplied materials: OS
Clustering Analysis of London Police Foot Patrol Behaviour from Raw Trajectories
 Clustering Analysis of London Police Foot Patrol Behaviour from Raw Trajectories Jianan Shen 1, Tao Cheng 2 1 SpaceTimeLab for Big Data Analytics, Department of Civil, Environmental and Geomatic Engineering,
Financing Urban Transport. UNESCAP-SUTI Event
 Financing Urban Transport UNESCAP-SUTI Event October 2017 Urban Transport in Context 2 The spiky urban economy of global cities 3 Mass transit networks converge towards a characteristic structure with
SPECIMEN. Date Morning/Afternoon. GCSE (9 1) Geography A (Geographical Themes) J383/01 Living in the UK Today Sample Question Paper
 Geography A (Geographical Themes) J383/01 Living in the UK Today Sample Question Paper") GCSE (9 1) Geography A (Geographical Themes) J383/01 Living in the UK Today Sample Question Paper Date Morning/Afternoon Time allowed: 1 hour You must have: the Resource Booklet You may use: a ruler (cm/mm)
GCSE (9 1) Geography A (Geographical Themes) J383/01 Living in the UK Today Sample Question Paper Date Morning/Afternoon Time allowed: 1 hour You must have: the Resource Booklet You may use: a ruler (cm/mm)
Mapping Accessibility Over Time
 Journal of Maps, 2006, 76-87 Mapping Accessibility Over Time AHMED EL-GENEIDY and DAVID LEVINSON University of Minnesota, 500 Pillsbury Drive S.E., Minneapolis, MN 55455, USA; geneidy@umn.edu (Received
Content Area: Social Studies Standard: 1. History Prepared Graduates: Develop an understanding of how people view, construct, and interpret history
 Standard: 1. History Develop an understanding of how people view, construct, and interpret history 1. Organize and sequence events to understand the concepts of chronology and cause and effect in the history
QUANTIFICATION OF THE NATURAL VARIATION IN TRAFFIC FLOW ON SELECTED NATIONAL ROADS IN SOUTH AFRICA
 QUANTIFICATION OF THE NATURAL VARIATION IN TRAFFIC FLOW ON SELECTED NATIONAL ROADS IN SOUTH AFRICA F DE JONGH and M BRUWER* AECOM, Waterside Place, Tygerwaterfront, Carl Cronje Drive, Cape Town, South
By Abdulraheem M.Baabbad. Supervisor: Dr.Bager Al-Ramadan
 By Abdulraheem M.Baabbad Supervisor: Dr.Bager Al-Ramadan OUTLINE Health GIS Health GIS Application Emergency Vehicles Allocation: A case study Health GIS Innovative structureto access,integrate,visualize
accessibility instruments in planning practice
 accessibility instruments in planning practice Spatial Network Analysis for Multi-Modal Transport Systems (SNAMUTS): Helsinki Prof Carey Curtis, Dr Jan Scheurer, Curtin University, Perth - RMIT University,
Let's Make Our Cities Breathable BECAUSE CLEAN AIR BELONGS TO EVERYONE.
 Let's Make Our Cities Breathable BECAUSE CLEAN AIR BELONGS TO EVERYONE. Clean Air is a Human Right that Everyone Should be Entitled to Making cities more breathable starts by measuring, analyzing and understanding
Spatial Organization of Data and Data Extraction from Maptitude
 Spatial Organization of Data and Data Extraction from Maptitude N. P. Taliceo Geospatial Information Sciences The University of Texas at Dallas UT Dallas GIS Workshop Richardson, TX March 30 31, 2018 1/
Barlows Primary School Geography Curriculum Content Key Stage 1 and
 Geography Curriculum Content Key Stage 1 and 2 2017-2018 Curriculum Content Year 1 The content for Year 1 is detailed below: WHAT ARE SEASONS? WHAT SIT LIKE WHERE WE LIVE? WHERE DO DIFFERENT ANIMALS LIVE?
Our Place in the Universe (Chapter 1) The Structure and Size of the Universe
 The Structure and Size of the Universe") Our Place in the Universe (Chapter 1) The Structure and Size of the Universe Based on Chapter 1 This material will be useful for understanding Chapters 2, 3, and 13 on Years, Seasons, and Months, The Orbits
Our Place in the Universe (Chapter 1) The Structure and Size of the Universe Based on Chapter 1 This material will be useful for understanding Chapters 2, 3, and 13 on Years, Seasons, and Months, The Orbits
Esri and GIS Education
 Esri and GIS Education Organizations Esri Users 1,200 National Government Agencies 11,500 States & Regional Agencies 30,800 Cities & Local Governments 32,000 Businesses 8,500 Utilities 12,600 NGOs 11,000
The Tyndall Cities Integrated Assessment Framework
 The Tyndall Cities Integrated Assessment Framework Alistair Ford 1, Stuart Barr 1, Richard Dawson 1, Jim Hall 2, Michael Batty 3 1 School of Civil Engineering & Geosciences and Centre for Earth Systems
APPLIED FIELDWORK ENQUIRY SAMPLE ASSESSMENT MATERIALS
 GCSE GEOGRAPHY B Sample Assessment Materials 85 GCSE GEOGRAPHY B COMPONENT 3 APPLIED FIELDWORK ENQUIRY SAMPLE ASSESSMENT MATERIALS 1 hour 30 minutes For examiner s use only SPaG Part A 18 0 Part B 18 0
Growing Lagging Regions:
 Growing Lagging Regions: Case study: North of England OECD seminar, June 28 2010 Richard Baker Policy & Research Manager, Northern Way richard.baker@thenorthernway.co.uk Presentation Address discussion
Exploring the Impact of Ambient Population Measures on Crime Hotspots
 Exploring the Impact of Ambient Population Measures on Crime Hotspots Nick Malleson School of Geography, University of Leeds http://nickmalleson.co.uk/ N.S.Malleson@leeds.ac.uk Martin Andresen Institute
Introduction and Project Overview
 Greater New Orleans Regional Land Use Modeling GIS Techniques in a P olitical C ontext Louisiana Remote Sensing and GIS Workshop Wednesday, April 24, 2013 Working Towards a Shared Regional Vision Introduction
Measuring Disaster Risk for Urban areas in Asia-Pacific
 Measuring Disaster Risk for Urban areas in Asia-Pacific Acknowledgement: Trevor Clifford, Intl Consultant 1 SDG 11 Make cities and human settlements inclusive, safe, resilient and sustainable 11.1: By
Urban Link Travel Time Estimation Using Large-scale Taxi Data with Partial Information
 Urban Link Travel Time Estimation Using Large-scale Taxi Data with Partial Information * Satish V. Ukkusuri * * Civil Engineering, Purdue University 24/04/2014 Outline Introduction Study Region Link Travel
NAME: DATE: Leaving Certificate GEOGRAPHY: Maps and aerial photographs. Maps and Aerial Photographs
 NAME: DATE: Leaving Certificate Geography Maps and Aerial Photographs Please see Teachers Notes for explanations, additional activities, and tips and suggestions. Learning Support Vocabulary, key terms
Urban Scaling Laws: Foundations, Implications, Gaps. Somwrita Sarkar University of Sydney
 Urban Scaling Laws: Foundations, Implications, Gaps Somwrita Sarkar University of Sydney Cities as complex systems Physically, socially, economically, cities manifest as regularities, in spite of different
Healthy Cities. Lecture 4 Planning and Regeneration, Sustainable and Healthy. Opening Address
 Healthy Cities Lecture 4 Planning and Regeneration, Sustainable and Healthy Opening Address Suzanne Wylie Director of Health and Environmental Services, Belfast City Council Belfast The Past The Present
Methodological issues in the development of accessibility measures to services: challenges and possible solutions in the Canadian context
 Methodological issues in the development of accessibility measures to services: challenges and possible solutions in the Canadian context Alessandro Alasia 1, Frédéric Bédard 2, and Julie Bélanger 1 (1)
Measurement of human activity using velocity GPS data obtained from mobile phones
 Measurement of human activity using velocity GPS data obtained from mobile phones Yasuko Kawahata 1 Takayuki Mizuno 2 and Akira Ishii 3 1 Graduate School of Information Science and Technology, The University
A Science of Cities. Models of Urban Form and Function. Michael
 July 27- August 2, 2014 A Science of Cities Models of Urban Form and Function Michael Batty m.batty@ucl.ac.uk @jmichaelbatty http://www.complexcity.info/ http://www.casa.ucl.ac.uk/ Centre Centre for Advanced
Spatially Connected Government in Great Britain. Peter Hedlund CEO Ordnance Survey International
 Spatially Connected Government in Great Britain Peter Hedlund CEO Ordnance Survey International 1 Mapping is everywhere 2 Location - a vital component! 3 Location a meeting point for information? Postcode?
Subject: Geography Scheme of Work: B1 to B6 Mastery tiles. Term: Autumn/Spring/Summer
 Subject: Geography Scheme of Work: B1 to B6 Mastery tiles Term: Autumn/Spring/Summer Topic / Unit(s) Overview / Context Introduction to geography. An introduction to geography including basic map skills
SOCIO-DEMOGRAPHIC INDICATORS FOR REGIONAL POPULATION POLICIES
 SOCIO-DEMOGRAPHIC INDICATORS FOR REGIONAL POPULATION POLICIES A CANADIAN PERSPECTIVE Marc Termote Université de Montréal Potsdam, DART Conference, September 3, 2012 3 STEPS 1. Defining the problem 2. Identifying
RURAL SETTLEMENT PATTERNS AND ACCESS TO DEVELOPMENT LAND: DEVELOPING THE EVIDENCE BASE
 School of Planning, Architecture and Civil Engineering RURAL SETTLEMENT PATTERNS AND ACCESS TO DEVELOPMENT LAND: DEVELOPING THE EVIDENCE BASE Prepared for Friends of the Earth Northern Ireland 18 th April
The IIHS Post-Doctoral Programme. A Call for Fellows. Post-Doctoral Fellow in Deindustrialisation in Cities of the Global South and Employment
 The IIHS Post-Doctoral Programme A Call for Fellows Post-Doctoral Fellow in Deindustrialisation in Cities of the Global South and Employment 2 Post-Doctoral Fellow in Deindustrialisation in Cities of the
KNES Geography Course Outline. Year 9
 KNES Geography Course Outline Year Geography is the study of Earth s landscapes, peoples, places and environments. It is, quite simply, about the world in which we live. Geography is unique in bridging
Chapter 2: Studying Geography, Economics, and Citizenship
 Chapter 2: Studying Geography, Economics, and Citizenship Lesson 2.1 Studying Geography I. Displaying the Earth s Surface A. A globe of the Earth best shows the sizes of continents and the shapes of landmasses
Appendix BAL Baltimore, Maryland 2003 Annual Report on Freeway Mobility and Reliability
 (http://mobility.tamu.edu/mmp) Office of Operations, Federal Highway Administration Appendix BAL Baltimore, Maryland 2003 Annual Report on Freeway Mobility and Reliability This report is a supplement to:
30 Years of Awareness STOCKPORT
 30 Years of Awareness STOCKPORT The more you know of your history, the more liberated you are. Maya Angelou 1 Message from Councillor Walter Brett Deputy Mayor of Stockport Black History Month presents
Map Detectives. Geography teaching resource. Paula Owens. Primary. Facts about Great Britain
 Map Detectives Facts about Great Britain Paula Owens Geography teaching resource Primary Digimap for Schools Geography Resources Title: Map Detectives Level Context Location Primary Facts about Great Britain
Urban Planning Word Search Level 1
 Urban Planning Word Search Level 1 B C P U E C O S Y S T E M P A R E U O E U R B A N P L A N N E R T N S T D H E C O U N T Y G E R E R D W R E N I C I T Y C O U N C I L A A A S U G G C I L A G P R I R
ACCA Interactive Timetable
 ACCA Interactive Timetable 2018 Professional Version 3.1 Information last updated 1st May 2018 Please note: Information and dates in this timetable are subject to change. A better way of learning that
ACCA Interactive Timetable & Fees
 ACCA Interactive Timetable & Fees 2018/19 Professional London Version 1.1 Information last updated 3 October 2018 Please note: Information and dates in this timetable are subject to change. A better way
M. Saraiva* 1 and J. Barros 1. * Keywords: Agent-Based Models, Urban Flows, Accessibility, Centrality.
 The AXS Model: an agent-based simulation model for urban flows M. Saraiva* 1 and J. Barros 1 1 Department of Geography, Birkbeck, University of London, 32 Tavistock Square, London, WC1H 9EZ *Email: m.saraiva@mail.bbk.ac.uk
Spatial-Temporal Analytics with Students Data to recommend optimum regions to stay
 Spatial-Temporal Analytics with Students Data to recommend optimum regions to stay By ARUN KUMAR BALASUBRAMANIAN (A0163264H) DEVI VIJAYAKUMAR (A0163403R) RAGHU ADITYA (A0163260N) SHARVINA PAWASKAR (A0163302W)
Book Review: A Social Atlas of Europe
 Book Review: A Social Atlas of Europe Ferreira, J Author post-print (accepted) deposited by Coventry University s Repository Original citation & hyperlink: Ferreira, J 2015, 'Book Review: A Social Atlas
2014 Data Collection Project ITE Western District
 2014 Data Collection Project ITE Western District Project Completed By: Oregon State University OSU ITE Student Chapter 101 Kearney Hall Corvallis, OR 97331 Student Coordinator: Sarah McCrea (OSU ITE Student
What is a map? Understanding your map needs
 What is a map? A map is simply a drawing or picture of a landscape or location. Maps usually show the landscape as it would be seen from above, looking directly down. As well as showing the landscape of
CIMA Dates and Prices Online Classroom Live September August 2016
 CIMA Dates and Prices Online Classroom Live September 2015 - August 2016 This document provides detail of the programmes that are being offered for the Objective Tests and Integrated Case Study Exams from