Drivable Grass Report for Hydraulic Performance Testing
|
|
|
- Cory Watson
- 5 years ago
- Views:
Transcription


1 Drivable Grass Report for Hydraulic Performance Testing Prepared for Soil Retention Products, Inc. Prepared by Michael D. Turner Amanda L. Cox Christopher I. Thornton March 2011 Colorado State University Daryl B. Simons Building at the Engineering Research Center Fort Collins, Colorado
2 Drivable Grass Report for Hydraulic Performance Testing Prepared for Soil Retention Products, Inc. Prepared by Michael D. Turner Amanda L. Cox Christopher I. Thornton March 2011 Colorado State University Daryl B. Simons Building at the Engineering Research Center Fort Collins, Colorado
3 TABLE OF CONTENTS LIST OF FIGURES... ii LIST OF TABLES... iv LIST OF SYMBOLS AND ABBREVIATIONS... vi 1 INTRODUCTION TEST PROGRAM Test Facilities Product Construction Test Procedure TESTING SUMMARY AND DATABASE Configuration 1: Drivable Grass with Mat Configuration A Configuration 2: Drivable Grass with Mat Configuration B Configuration 3: ECB Reinforced Drivable Grass with Mat Configuration B Configuration 4: Geosynthetic Reinforced Drivable Grass with Mat Configuration B Configuration 5: ECB Reinforced Drivable Grass with Mat Configuration C ANALYSIS SUMMARY REFERENCES APPENDIX A PRODUCT DATA SHEETS APPENDIX B COMPACTION VERIFICATION APPENDIX C SUBGRADE PROPERTIES APPENDIX D CLOPPER SOIL LOSS INDEX APPENDIX E TEST DATA i
4 LIST OF FIGURES Figure 2-1: CSU s Engineering Research Center and Horsetooth Reservoir...3 Figure 2-2: Four-foot wide adjustable-slope flume...4 Figure 2-3: Two-foot wide adjustable-slope flume...5 Figure 2-4: Drivable Grass paver mat from Soil Retention Products, Inc....6 Figure 2-5: Block installation for Configuration 1 (A), Configurations 2, 3, and 4 (B), and Configuration 5 (C) (with anchoring)...8 Figure 3-1: Drivable Grass system during Test 1 (Configuration 1) Figure 3-2: Drivable Grass system following final test of Configuration 1 (Test 2) Figure 3-3: Drivable Grass system during Test 3 (Configuration 2) Figure 3-4: Drivable Grass system following final test of Configuration 2 (Test 4) Figure 3-5: Drivable Grass system during Test 19 (Configuration 3) Figure 3-6: Drivable Grass system following final test of Configuration 3 (Test 20) Figure 3-7: Drivable Grass system during Test 30 (Configuration 4) Figure 3-8: Drivable Grass system following final test of Configuration 4 (Test 31) Figure 3-9: Drivable Grass system during Test 40 (Configuration 5) Figure 3-10: Drivable Grass system following final test of Configuration 5 (Test 40) Figure 4-1: Subcritical model and measured vertical flow depths for Test 1 (Configuration 1, M2 profile) Figure 4-2: Supercritical model and measured vertical flow depths for Test 17 (Configuration 3, S2 profile) Figure 4-3: Average flow velocity vs. for Configuration 1 and Configuration Figure 4-4: Average shear stress vs. for Configuration 1 and Configuration Figure 4-5: Average flow velocity vs. for Configuration 3 and Configuration Figure 4-6: Average shear stress vs. for Configuration 3 and Configuration Figure 4-7: Average flow velocity vs. for Configuration Figure 4-8: Average shear stress vs. for Configuration Figure 4-9: Manning s n vs. unit discharge for Configurations 1 and 2 (Drivable Grass mats with bare soil) ii
5 Figure 4-10: Manning s n vs. unit discharge for Configuration 4 (Drivable Grass mats with Miramesh GR) Figure 4-11: Manning s n vs. unit discharge for Configurations 3 and 5 (Drivable Grass mats with ECB) Figure A-1: Drivable Grass brochure information Figure A-2: Western Excelsior Excel R-1 data sheet Figure A-3: Western Excelsior Excel R-2 data sheet Figure A-4: Mirafi Miramesh GR data sheet Figure C-1: Sub-grade grain size distribution Figure C-2: Sub-grade material properties iii
6 LIST OF TABLES Table 2-1: Configuration matrix...6 Table 3-1: Drivable Grass test matrix Table 4-1: Summary of bare-soil performance Table 4-2: Hydraulic summary data for all configurations Table B-1: Compaction testing results Table E-1: Configuration 1 Test 1 hydraulic model and data Table E-2: Configuration 1 Test 2 hydraulic model and data Table E-3: Configuration 2 Test 3 hydraulic model and data Table E-4: Configuration 2 Test 4 hydraulic model and data Table E-5: Configuration 3 Test 5 hydraulic model and data Table E-6: Configuration 3 Test 6 hydraulic model and data Table E-7: Configuration 3 Test 7 hydraulic model and data Table E-8: Configuration 3 Test 8 hydraulic model and data Table E-9: Configuration 3 Test 9 hydraulic model and data Table E-10: Configuration 3 Test 10 hydraulic model and data Table E-11: Configuration 3 Test 11 hydraulic model and data Table E-12: Configuration 3 Test 12 hydraulic model and data Table E-13: Configuration 3 Test 13 hydraulic model and data Table E-14: Configuration 3 Test 14 hydraulic model and data Table E-15: Configuration 3 Test 15 hydraulic model and data Table E-16: Configuration 3 Test 16 hydraulic model and data Table E-17: Configuration 3 Test 17 hydraulic model and data Table E-18: Configuration 3 Test 18 hydraulic model and data Table E-19: Configuration 3 Test 19 hydraulic model and data Table E-20: Configuration 4 Test 21 hydraulic model and data Table E-21: Configuration 4 Test 22 hydraulic model and data iv
7 Table E-22: Configuration 4 Test 23 hydraulic model and data Table E-23: Configuration 4 Test 24 hydraulic model and data Table E-24: Configuration 4 Test 25 hydraulic model and data Table E-25: Configuration 4 Test 26 hydraulic model and data Table E-26: Configuration 4 Test 27 hydraulic model and data Table E-27: Configuration 4 Test 28 hydraulic model and data Table E-28: Configuration 4 Test 29 hydraulic model and data Table E-29: Configuration 4 Test 30 hydraulic model and data Table E-30: Configuration 4 Test 31 hydraulic model and data Table E-31: Configuration 5 Test 32 hydraulic model and data Table E-32: Configuration 5 Test 33 hydraulic model and data Table E-33: Configuration 5 Test 34 hydraulic model and data Table E-34: Configuration 5 Test 35 hydraulic model and data Table E-35: Configuration 5 Test 36 hydraulic model and data Table E-36: Configuration 5 Test 37 hydraulic model and data Table E-37: Configuration 5 Test 38 hydraulic model and data Table E-38: Configuration 5 Test 39 hydraulic model and data Table E-39: Configuration 5 Test 40 hydraulic model and data v
8 LIST OF SYMBOLS AND ABBREVIATIONS Symbols Cumulative Soil Loss i n Soil Loss i Z final Z initial total soil loss (in.) number of discharges conveyed for test Manning s coefficient of hydraulic resistance incremental soil loss (in.) final bed elevation or point-gage reading initial bed elevation or point-gage reading Abbreviations acre/ft ASTM cfs cfs/ft CSU ECB ERC ft ft/ft ft/s ft 2 /s H:V hr(s) ID in. lb lb/ft 3 min n/a No. psf psi USCS acre(s) per foot American Society for Testing and Materials cubic feet per second cubic feet per second per foot Clopper Soil Loss Index Colorado State University Erosion Control Blanket Engineering Research Center feet or foot feet per foot feet per second square feet per second Horizontal: hour(s) identification inch(es) pound(s) pound(s) per cubic foot minute(s) not available pound(s) per square foot pound(s) per square inch registered (trademark) Unified Soil Classification System vi
9 1 INTRODUCTION Between May 2009 and January 2011, hydraulic performance testing was conducted by Colorado State University (CSU) on Drivable Grass, manufactured by Soil Retention Products, Inc. A total of forty tests on five unvegetated installations were conducted under the test program. All configurations consisted of Drivable Grass paver mats installed over an erodible soil bed. Information presented within this report documents the construction, testing procedures, resulting database and data analysis. In addition, this report provides information from the hydraulic testing of full-scale Drivable Grass systems under controlled laboratory conditions for the identification of stability threshold conditions. 1
10 2 TEST PROGRAM 2.1 TEST FACILITIES Performance testing of the Drivable Grass system was conducted at the Hydraulics Laboratory of Colorado State University, located at the Engineering Research Center (ERC). Colorado State University s ERC is comprised of laboratories and offices encompassing virtually all engineering disciplines. Within the ERC, the Hydraulics Division, a subdivision of the Civil and Environmental Engineering Department, operates the Hydraulics Laboratory which has multiple indoor and outdoor facilities. Outdoor facilities are gravity fed from Horsetooth Reservoir with a capacity of approximately 170,000 acre-ft of water and a maximum static pressure of approximately 110 pounds per square inch (psi) in the ERC pipe network. Each outdoor facility has an independent water delivery system. Indoor facilities are fed by a variety of pumps, as well as a gravity feed from Horsetooth Reservoir. Figure 2-1 presents a photograph of the Engineering Research Center and Horsetooth Reservoir. 2


11 Figure 2-1: CSU s Engineering Research Center and Horsetooth Reservoir For this testing program, two facilities were used. An existing adjustable-slope flume measuring 4-ft wide by 30-ft long was used for the first four configurations. The slope of the 4- ft wide flume was adjustable between 0 and 50 percent. Figure 2-2 presents a schematic of the 4-ft adjustable-slope flume used for the first four configurations. Head and toe plates contained an erodible bed, 12 inches deep, over which Drivable Grass mats were installed. Water was supplied to the flume using a 125 horsepower centrifugal pump, and was measured by a combination of instrumentation, including an in-line annubar and an orifice plate. The second facility, which was used for the fifth configuration, was also an existing adjustable-slope flume measuring 2-ft wide by 40-ft long. The slope of the 2-ft wide flume was adjustable between 0 and 10 percent. Figure 2-3 presents a photograph of the 2-ft adjustable-slope flume used for the fifth configuration. Modified wooden transitions contained an erodible bed, over which Drivable Grass mats were installed. Water was supplied to the flume using a variable-speed pump and was measured by a magnetic flow meter. 3

12 Head box Not to Scale Slope adjustable between 0 and 50 percent Data acquisition cart Tail box 1 ft 30 ft Cable winch Figure 2-2: Four-foot wide adjustable-slope flume 4


13 Figure 2-3: Two-foot wide adjustable-slope flume 2.2 PRODUCT The Drivable Grass system, manufactured by Soil Retention Products, Inc., was tested to provide data consistent with the current methodologies for calculating hydraulic performance thresholds. The Drivable Grass mats delivered to the Engineering Research Center were two feet square, and consisted of thirty-six four-inch square blocks measuring 1.5 inches in height. The blocks are cast together with polymer cord. Photographs of the uninstalled Drivable Grass product are presented in Figure 2-4. Appendix A provides the product data sheet for the Drivable Grass system. 5


14 Figure 2-4: Drivable Grass paver mat from Soil Retention Products, Inc. 2.3 CONSTRUCTION To determine hydraulic performance thresholds, five configurations of the Drivable Grass system were tested. All configurations were installed to the specifications of Soil Retention Products, Inc. under the guidance of the Principal Investigator. The objective of testing five configurations was to examine the performance of unvegetated reinforced and unreinforced plots utilizing the Drivable Grass system. A summary of the tested configurations is presented in Table 2-1. Table 2-1: Configuration matrix Configuration No. Facility Reinforcement 1 4-ft indoor adjustable-slope flume None 2 4-ft indoor adjustable-slope flume None 3 4-ft indoor adjustable-slope flume W.E. Excel R ft indoor adjustable-slope flume Miramesh GR 5 2-ft indoor adjustable-slope flume W.E. Excel R-2 Concrete Paver Drivable Grass Drivable Grass Drivable Grass Drivable Grass Drivable Grass Mat Configuration A B B B C For each configuration, soil was installed in the test section in 6-in. lifts and compacted using a plate compactor and steel hand tamp. For Configurations 1 through 4, soil moisture content and in-situ dry unit weight were determined by nuclear density gage along the centerline of the embankment as determined by Terracon, Inc. (ASTM D6938). Compaction verifications 6
15 for Configurations 1 through 4 are provided in Appendix B. For Configuration 5, the in-place soil water content and compaction were determined by ASTM 2216 and 1556, respectively. A clayey sand, SC, as classified by the Unified Soil Classification System (USCS) was used for all embankments. Subgrade properties are located in Appendix C. Following soil compaction, Drivable Grass mats were installed in the facility. For Configurations 1 and 2, Drivable Grass mats were placed directly on the compacted embankment without any ancillary reinforcement. For Configuration 3, an erosion control blanket (ECB), Western Excelsior Excel R-1, was placed between the compacted embankment and Drivable Grass. For Configuration 4, a geosynthetic mesh, Miramesh GR, was installed between the compacted embankment and Drivable Grass. For Configuration 5, the Western Excelsior R-2 ECB was placed between the compacted embankment and Drivable Grass. Appendix A provides product data sheets for both ECBs and the geosynthetic mesh. Three mat placements were used during installation, and schematics of mat placement configurations are presented in Figure 2-5. Configuration 1 utilized mat placement Configuration A which was a non-staggered installation; and Configurations 2, 3, and 4, utilized Configuration B which was a staggered installation. Configuration 5 utilized Configuration C, which was also a non-staggered installation, although the Drivable Grass mats were trimmed to dimensions of 2 ft by 1.67 ft for installation into the 2-ft facility. For Configurations 3 and 4, the reinforcement materials were attached to the upstream and downstream transitions using silicone adhesive, and the final two Drivable Grass mats on each embankment were fixed in place with turf staples. For Configuration 5, 12-inch turf spikes were placed at a density of one per 0.83 ft 2 of mat along the entire length of the embankment. The position of the turf spikes for Configuration 5 is presented in Figure 2-5 (C). 7
16 (A) (B) Flow (C) Flow Flow Figure 2-5: Block installation for Configuration 1 (A), Configurations 2, 3, and 4 (B), and Configuration 5 (C) (with anchoring) 2.4 TEST PROCEDURE A test was defined as a continuous 1.0-hr flow over the system at a uniform discharge. The performance threshold for the Drivable Grass system was defined as 0.5 inches of soil loss as computed using the Clopper Soil Loss Index (). Appendix D summarizes the computation procedure. A secondary performance threshold was identified as movement of the Drivable Grass mats, or when the system was mechanically compromised. If the system endured the 1.0-hr flow without surpassing the defined thresholds, the procedure was repeated at a larger discharge or at a greater slope. Prior to each test, the system was seasoned with nominal flow before increasing the discharge to the target flow rate. For each test, water-surface elevations were recorded at the beginning of each 1.0-hr long flow along the centerline of the flume at approximately 2-ft station intervals along the slope. elevations (top of embankment surface) were established prior to the test at the same measurement stations as the water-surface readings. and water-surface elevation measurements were recorded to the nearest 0.01 ft using a total station and point gage. Upon successful completion of the predefined 1.0-hr long continuous flow, the system was inspected and bed readings were recorded for each station. 8
17 3 TESTING SUMMARY AND DATABASE Hydraulic testing of the Drivable Grass system was completed between May 11 th, 2009 and January 6 th, 2011; resulting data were entered into a database for analysis. Table 3-1 presents the test matrix for the Drivable Grass configurations which includes 40 total tests with five system configurations. Subsequent sections present data, describe conditions during testing, and provide testing photographic documentation. 9
18 Configuration Table 3-1: Drivable Grass test matrix Test Unit Discharge (cfs) Description Slope (ft/ft) Drivable Grass mats w/o staggered installation Drivable Grass mats w/o staggered installation Drivable Grass mats staggered installation Drivable Grass mats staggered installation Drivable Grass mats with Excel R Drivable Grass mats with Excel R Drivable Grass mats with Excel R Drivable Grass mats with Excel R Drivable Grass mats with Excel R Drivable Grass mats with Excel R Drivable Grass mats with Excel R Drivable Grass mats with Excel R Drivable Grass mats with Excel R Drivable Grass mats with Excel R Drivable Grass mats with Excel R Drivable Grass mats with Excel R Drivable Grass mats with Excel R Drivable Grass mats with Excel R Drivable Grass mats with Excel R Drivable Grass mats with Excel R Drivable Grass mats with Miramesh GR Drivable Grass mats with Miramesh GR Drivable Grass mats with Miramesh GR Drivable Grass mats with Miramesh GR Drivable Grass mats with Miramesh GR Drivable Grass mats with Miramesh GR Drivable Grass mats with Miramesh GR Drivable Grass mats with Miramesh GR Drivable Grass mats with Miramesh GR Drivable Grass mats with Miramesh GR Drivable Grass mats with Miramesh GR Drivable Grass mats with Excel R Drivable Grass mats with Excel R Drivable Grass mats with Excel R Drivable Grass mats with Excel R Drivable Grass mats with Excel R Drivable Grass mats with Excel R Drivable Grass mats with Excel R Drivable Grass mats with Excel R Drivable Grass mats with Excel R

 and Figure 3-2 presents a photograph of the test section following Test 2.")
19 3.1 CONFIGURATION 1: DRIVABLE GRASS WITH MAT CONFIGURATION A Testing conducted on Configuration 1 utilized the Drivable Grass system, arranged according to Mat Configuration A. A total of two tests with a 0.35 percent bed slope were performed on Configuration 1. During Test 2, the system became mechanically compromised, indicating that the performance threshold had been exceeded; however, test-reach averaged exceeding 0.5 inches was not measured. Test 2 was shutdown prior to the designated 1-hr duration. Figure 3-1 presents a photograph of Test 1 (Configuration 1) and Figure 3-2 presents a photograph of the test section following Test 2. Hydraulic and soil loss data collected during the testing of Configuration 1 are located in Appendix E. Figure 3-1: Drivable Grass system during Test 1 (Configuration 1) 11


20 Figure 3-2: Drivable Grass system following final test of Configuration 1 (Test 2) 12

 and Figure 3-4 presents a photograph of the test section following Test 4.")
21 3.2 CONFIGURATION 2: DRIVABLE GRASS WITH MAT CONFIGURATION B Testing conducted on Configuration 2 utilized the Drivable Grass system, arranged according to Mat Configuration B. A total of two tests with a 0.22 percent bed slope were performed on Configuration 2. During Test 4, the system became mechanically compromised, indicating that the performance threshold had been exceeded; however, test-reach averaged exceeding 0.5 inches was not measured. Test 4 was conducted for the full 1-hr duration. Figure 3-3 presents a photograph of Test 3 (Configuration 2) and Figure 3-4 presents a photograph of the test section following Test 4. Hydraulic and soil loss data collected during the testing of Configuration 2 are located in Appendix E. Figure 3-3: Drivable Grass system during Test 3 (Configuration 2) 13


22 Figure 3-4: Drivable Grass system following final test of Configuration 2 (Test 4) 14
23 3.3 CONFIGURATION 3: ECB REINFORCED DRIVABLE GRASS WITH MAT CONFIGURATION B Configuration 3 was composed of the Drivable Grass mats reinforced with an erosion control blanket: Excel R-1 manufactured by Western Excelsior. Technical documentation for the Excel R-1 is provided in Appendix A. Testing of Configuration 3 included a total of sixteen tests conducted on three bed slopes 0.25, 2.7, and 10.0 percent. At the onset of Test 20 of Configuration 3, mat movement was observed at the end of the test section. The discharge was terminated and investigation of the test section determined that the system had become mechanically compromised. Test 20 was shutdown prematurely of the designated 1-hr duration. During Test 20, material failure occurred prior to the collection of hydraulic data. Figure 3-5 presents a photograph of Test 19 (Configuration 3) and Figure 3-6 presents a photograph of the test section following Test


24 Figure 3-5: Drivable Grass system during Test 19 (Configuration 3) 16


25 Figure 3-6: Drivable Grass system following final test of Configuration 3 (Test 20) 17


 and Figure 3-8 presents a photograph of the test section following")
26 3.4 CONFIGURATION 4: GEOSYNTHETIC REINFORCED DRIVABLE GRASS WITH MAT CONFIGURATION B Configuration 4 was composed of Drivable Grass mats reinforced with a biaxial, woven geosynthetic fabric, Miramesh GR, manufactured by TenCate. Technical documentation for the Miramesh GR is provided in Appendix A. Testing of Configuration 4 included a total of eleven tests conducted on two bed slopes 0.40 and 2.7. At the conclusion of Test 31, soil loss resulting in mat deformation was observed. Figure 3-7 presents a photograph of Test 30 (Configuration 4) and Figure 3-8 presents a photograph of the test section following Test 31. Hydraulic and soil loss data collected during the testing of Configuration 4 are provided in Appendix E. Figure 3-7: Drivable Grass system during Test 30 (Configuration 4) 18


27 Figure 3-8: Drivable Grass system following final test of Configuration 4 (Test 31) 19

 and Figure 3-10 presents a photograph of the test section following Test 40.")
28 3.5 CONFIGURATION 5: ECB REINFORCED DRIVABLE GRASS WITH MAT CONFIGURATION C Configuration 5 was composed of the Drivable Grass mats reinforced with an erosion control blanket: Excel R-2 manufactured by Western Excelsior. Technical documentation for the Excel R-2 is provided in Appendix A. Testing of Configuration 5 included a total of nine tests conducted on three bed slopes 2.5, 7.5, and 10.1 percent. The Drivable Grass mat and Excel R-2 system reached the discharge and slope facility limits without the test-reach averaged exceeding 0.5 inches or mechanical failure. Figure 3-9 presents a photograph of Test 40 (Configuration 5) and Figure 3-10 presents a photograph of the test section following Test 40. Figure 3-9: Drivable Grass system during Test 40 (Configuration 5) 20


29 Figure 3-10: Drivable Grass system following final test of Configuration 5 (Test 40) 21
30 4 ANALYSIS Hydraulic and soil loss analyses were conducted for all collected water surface and bed elevation data. Average shear stress and average flow velocity were computed and compared to the computed. Both supercritical and subcritical flow regimes were observed during testing. Subcritical tests were analyzed using a standard-step backwater model, while supercritical tests were analyzed using a standard-step forewater model. Representative flow profiles for the subcritical model and supercritical model are presented below in Figure 4-1 and Figure 4-2. Flow depths from the respective model outputs were used with the momentum equation to calculate shear stress using Equation 4.1: Equation 4.1 where: τo = control volume shear stress (lbs/ft 2 ); γ = unit weight of water (62.4 lbs/ft 3 ); y1 = upstream vertical flow depth of control volume ; y2 = downstream vertical flow depth of control volume ; θ = angle of the embankment with respect to horizontal (ft/ft); L = control-volume length ; ρ = density of water (1.94 slugs/ft 3 ); and q = unit discharge (cfs/ft). Additionally, flow velocity was computed using the continuity equation, presented in Equation 4.2: / Equation
31 where: V = local cross-sectional averaged flow velocity (ft/s); Q = volumetric flow rate (cfs); and A = flow area (ft 2 ). Model Flow Measured Flow Horizontal Figure 4-1: Subcritical model and measured vertical flow depths for Test 1 (Configuration 1, M2 profile) 23
32 0.90 Measured Flow Model Flow Horizontal Figure 4-2: Supercritical model and measured vertical flow depths for Test 17 (Configuration 3, S2 profile) For each test, the shear stress and flow velocity averaged over the entire test section were calculated and plotted against the. Figure 4-3 and Figure 4-4 present average flow velocity and average shear stress versus, respectively, for Configuration 1 and Configuration 2; Figure 4-5 and Figure 4-6 present average flow velocity and average shear stress versus, respectively, for Configuration 3 and Configuration 4; and Figure 4-7 and Figure 4-8 present average flow velocity and average shear stress versus, respectively, for Configuration 5. When applicable, computed soil loss near the transition from the headbox to the embankment was neglected due to entrance effects. Additionally represented in the flow velocity and shear stress versus plots are the results for bare-soil testing. Table 4-1 provides a summary of bare-soil testing results for comparison. 24
33 0.80 Configuration 1 Configuration 2 Bare Soil (in) Average Flow (ft/s) Figure 4-3: Average flow velocity vs. for Configuration 1 and Configuration 2 Configuration 1 Configuration 2 Bare Soil (in) Average (lb/ft 2 ) Figure 4-4: Average shear stress vs. for Configuration 1 and Configuration 2 25
34 Configuration 3 Configuration 4 Bare Soil (in) Average Flow (ft/s) Figure 4-5: Average flow velocity vs. for Configuration 3 and Configuration 4 (in) Configuration 3 Configuration 4 Bare Soil Average (lb/ft 2 ) Figure 4-6: Average shear stress vs. for Configuration 3 and Configuration 4 26
35 Configuration 5 Bare Soil (in) Average Flow (ft/s) Figure 4-7: Average flow velocity vs. for Configuration 5 Configuration 5 Bare Soil (in) Average (psf) Figure 4-8: Average shear stress vs. for Configuration 5 27
36 Table 4-1: Summary of bare-soil performance (lb/ft 2 ) (ft/s) (in) Manning s n was computed for each configuration using the standard step hydraulic models. Table 4-2 presents a summary of unit discharge, bed slope, average velocity, average shear stress, Manning s n, and system condition for the Drivable Grass system for each test. The bed slopes presented in Table 4-2 represent the initial bed slope, and do not present test-totest variations incurred through erosion and deposition, although these considerations were taken into account in the hydraulic models. Figure 4-9 displays the relationship between Manning s n and the unit discharge for Configurations 1 and 2 (Drivable Grass mats with bare soil), Figure 4-10 displays Manning s n versus unit discharge for Configuration 4 (Drivable Grass mats with Miramesh GR), and Figure 4-11 displays Manning s n versus unit discharge for Configurations 3 and 5 (Drivable Grass mats with ECB). 28
37 Table 4-2: Hydraulic summary data for all configurations 31 Configuration Description Test Discharge (cfs) Unit Discharge (cfs) Initial Slope (ft/ft) Actual Slope (ft/ft) Average (ft/s) Average (lb/ft 2 ) Maximum (ft/s) Maximum (lb/ft 2 ) Manning's n Condition (in) Drivable Grass Mats with Bare Soil Stable Drivable Grass Mats with Bare Soil 2* * Unstable Drivable Grass Mats, offset, with Bare Soil Stable Drivable Grass Mats, offset, with Bare Soil Unstable Drivable Grass Mats with Excel R Stable Drivable Grass Mats with Excel R Stable Drivable Grass Mats with Excel R Stable Drivable Grass Mats with Excel R Stable Drivable Grass Mats with Excel R Stable Drivable Grass Mats with Excel R Stable Drivable Grass Mats with Excel R Stable Drivable Grass Mats with Excel R Stable Drivable Grass Mats with Excel R Stable Drivable Grass Mats with Excel R Stable Drivable Grass Mats with Excel R Stable Drivable Grass Mats with Excel R Stable Drivable Grass Mats with Excel R Stable Drivable Grass Mats with Excel R Stable Drivable Grass Mats with Excel R Stable Drivable Grass Mats with Excel R n/a n/a n/a n/a n/a n/a n/a Unstable Drivable Grass Mats with Miramesh GR Stable Drivable Grass Mats with Miramesh GR Stable Drivable Grass Mats with Miramesh GR Stable Drivable Grass Mats with Miramesh GR Stable Drivable Grass Mats with Miramesh GR Stable 4 Drivable Grass Mats with Miramesh GR Stable Drivable Grass Mats with Miramesh GR Stable Drivable Grass Mats with Miramesh GR Stable Drivable Grass Mats with Miramesh GR Stable Drivable Grass Mats with Miramesh GR Stable Drivable Grass Mats with Miramesh GR Unstable Drivable Grass Mats with Excel R Stable Drivable Grass Mats with Excel R Stable Drivable Grass Mats with Excel R Stable Drivable Grass Mats with Excel R Stable 5 Drivable Grass Mats with Excel R Stable Drivable Grass Mats with Excel R Stable Drivable Grass Mats with Excel R Stable Drivable Grass Mats with Excel R Stable Drivable Grass Mats with Excel R Stable n/a = not available due to failure prior to data collection, *Test conducted for a duration of 43 minutes instead of the total hour 29
38 Manning's Roughness (-) n= q Unit Discharge (ft 2 /s) S= S= Figure 4-9: Manning s n vs. unit discharge for Configurations 1 and 2 (Drivable Grass mats with bare soil) Manning's Roughness (-) n = ln(q) Unit Discharge (ft 2 /s) S=0.004 S=0.027 Figure 4-10: Manning s n vs. unit discharge for Configuration 4 (Drivable Grass mats with Miramesh GR) 30
39 Manning's Roughness (-) n = ln(q) S=0.010 S=0.075 S=0.027 and Unit Discharge (ft 2 /s) Figure 4-11: Manning s n vs. unit discharge for Configurations 3 and 5 (Drivable Grass mats with ECB) 31
40 5 SUMMARY Between May 2009 and January 2011, unvegetated reinforced erodible soil beds were tested to examine the performance of the Drivable Grass systems, manufactured by Soil Retention Products, Inc. Tests were conducted on five distinct installations, including two testing series with Drivable Grass mats on a bare-soil bed, two testing series with Drivable Grass with an underlying erosion control blanket, and one testing series with Drivable Grass with an underlying open mesh geotextile. The revetment systems were tested in two of CSU s adjustable-slope flumes. The test matrix incorporated varied discharges over several bed slopes to adequately determine the performance thresholds of the Drivable Grass product. The following summarizes the performance of each configuration: Configuration 1 Drivable Grass mats installed on bare soil: o Maximum stable flow velocity equal to 3.1 ft/s o Maximum stable shear stress equal to 0.2 psf Configuration 2 Drivable Grass mats installed on bare soil with staggered installation: o Maximum stable flow velocity equal to 3.4 ft/s o Maximum stable shear stress equal to 0.3 psf Configuration 3 Drivable Grass mats reinforced with Excel R-1 ECB: o Maximum stable flow velocity equal to 7.4 ft/s occurred during Test 18 with a corresponding shear stress of 1.3 psf o Maximum stable shear stress equal to 1.9 psf occurred during Test 19 with a corresponding flow velocity of 4.2 ft/s Configuration 4 Drivable Grass mats reinforced with Miramesh GR geosynthetic fabric: o Maximum stable flow velocity equal to 6.1 ft/s 32
41 o Maximum stable shear stress equal to 1.1 psf Configuration 5 Drivable Grass mats reinforced with Excel R-2 ECB and 12- inch turf spikes: o Maximum stable flow velocity equal to 9.9 ft/s o Maximum stable shear stress equal to 3.0 psf o Not tested to failure Testing was terminated on each configuration when 0.5 inches of was achieved, when the system became mechanically compromised, or when the maximum conditions available in the facility were reached. Data provided within this report offer a foundation for performance analysis and comparison of the Drivable Grass system. 33
42 REFERENCES ASTM Standard Test Method for Particle-Size Analysis of Soils. American Society for Testing and Materials, Standard D422. ASTM (2000). Standard Test Method for Density and Unit Weight of Soil in Place by the Sand- Cone Method. American Society for Testing and Materials, Standard D1556. ASTM Standard Test Method for Laboratory Determination of Water (Moisture) Content of Soil and Rock by Mass. Standard D2216 developed by Subcommittee D18.08 of the American Society for Testing and Materials. ASTM Standard Practice for Classification of Soils for Engineering Purposes (Unified Soil Classification System). American Society for Testing and Materials, Standard D2487. ASTM Standard Test Methods for Liquid Limit, Plastic Limit, and Plasticity Index of Soils. American Society for Testing and Materials, Standard D4318. ASTM (2000). Standard Test Method for Determination of Erosion Control Blanket (ECB) Performance in Protecting Earthen Channels from Stormwater-Induced Erosion. American Society for Testing and Materials, Standard D6460. ASTM Standard Test Method for In-Place Density and Water Content of Soil and Soil- Aggregate by Nuclear Methods (Shallow ). Standard D6938 developed by Subcommittee D18.08 of the American Society for Testing and Materials. 34
43 APPENDIX A PRODUCT DATA SHEETS 35


44 Figure A-1: Drivable Grass brochure information 36


45 Figure A-2: Western Excelsior Excel R-1 data sheet 37


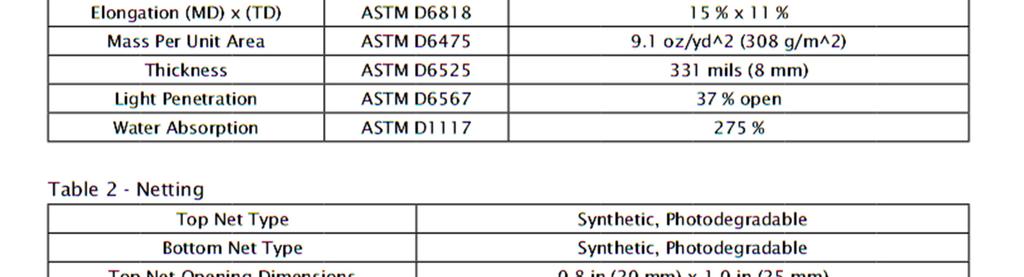
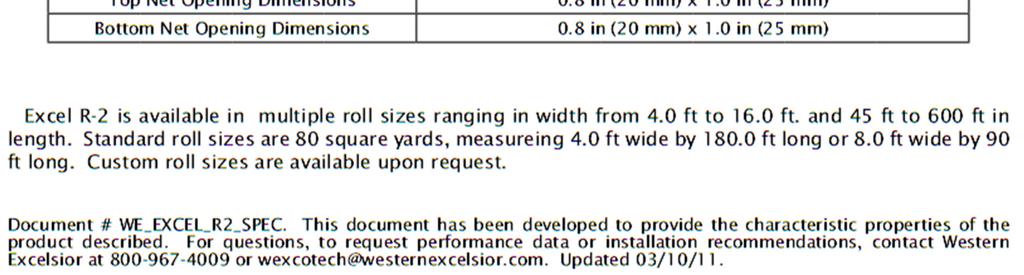
46 Figure A-3: Western Excelsior Excel R-2 data sheet 38


47 Figure A-4: Mirafi Miramesh GR data sheet 39
48 APPENDIX B COMPACTION VERIFICATION 40
49 Configuration Test Date Table B-1: Compaction testing results Test Location Wet Density Water Content Max. Dry Unit Wt. Dry Unit Weight Percent Compaction (pcf) (%) (pcf) (pcf) (%) 1 4/21/2009 S Side of Flume /21/2009 Middle of Flume /21/2009 N Side of Flume /21/2009 Middle of Flume /19/2009 Bottom /19/2009 Middle /19/2009 Top /1/2009 Bottom /1/2009 Middle /1/2009 Top /5/2009 Bottom /5/2009 Middle /5/2009 Bottom /5/2009 Top ASTM D6938 testing conducted by Terracon 41
50 APPENDIX C SUBGRADE PROPERTIES 42
51 Figure C-1: Sub-grade grain size distribution 43


52 Figure C-2: Sub-grade material properties 44
53 APPENDIX D CLOPPER SOIL LOSS INDEX 45
54 SOIL-LOSS ANALYSIS Soil loss at a given point was calculated for each test by computing the difference between the initial and final elevations. A cumulative soil loss was obtained by summing the previous test s soil loss with the current test. Equations D-1 and D-2 demonstrate the soil-loss calculations: Soil Loss = (Z - Z ) * 12 Equation D-1 i initial final where: Soil Loss i = incremental soil loss (in.); Z initial = initial bed elevation or point-gage reading ; and = final bed elevation or point-gage reading. Z final Cumulative Soil Loss i = Soil Loss 1 i Equation D-2 where: Cumulative Soil Loss Soil Loss i i = total soil loss (in.); = incremental soil loss (in.); and = number of discharges conveyed for test. The method for estimating soil loss used a procedure based on the Clopper Soil Loss Index () (as outlined in the ASTM (2000) D6460 Standard). The assigns a value of zero to any point in the control volume demonstrating a soil gain. The zero value is then averaged in with all other points in the control volume. This procedure is a compromise between including the increase in elevation as a gain and disregarding the point entirely. Once the soil loss and hydraulic conditions were computed, a preferred method of calculating shear stress and soil loss was determined. The was used in conjunction with Equation D-2, using regressed values for flow depth and cross-section average velocity. The was chosen as a more conservative alternative to including soil gain and less extreme as discounting soil gain altogether. 46
55 APPENDIX E TEST DATA 47
56 Horizontal Table E-1: Configuration 1 Test 1 hydraulic model and data (ft/s) (lb/ft 2 ) (in) Flow Horizontal Table E-2: Configuration 1 Test 2 hydraulic model and data (ft/s) (lb/ft 2 ) (in) Flow Horizontal Table E-3: Configuration 2 Test 3 hydraulic model and data (ft/s) (lb/ft 2 ) (in) Flow
57 Horizontal Table E-4: Configuration 2 Test 4 hydraulic model and data (ft/s) (lb/ft 2 ) (in) Flow Horizontal Table E-5: Configuration 3 Test 5 hydraulic model and data (ft/s) (lb/ft 2 ) (in) Flow Horizontal Table E-6: Configuration 3 Test 6 hydraulic model and data (ft/s) (lb/ft 2 ) (in) Flow
58 Horizontal Table E-7: Configuration 3 Test 7 hydraulic model and data (ft/s) (lb/ft 2 ) (in) Flow Horizontal Table E-8: Configuration 3 Test 8 hydraulic model and data (ft/s) (lb/ft 2 ) (in) Flow Horizontal Table E-9: Configuration 3 Test 9 hydraulic model and data (ft/s) (lb/ft 2 ) (in) Flow
59 Table E-10: Configuration 3 Test 10 hydraulic model and data Horizontal (ft/s) (lb/ft 2 ) (in) Flow Table E-11: Configuration 3 Test 11 hydraulic model and data Horizontal (ft/s) (lb/ft 2 ) (in) Flow Table E-12: Configuration 3 Test 12 hydraulic model and data Horizontal (ft/s) (lb/ft 2 ) (in) Flow
60 Table E-13: Configuration 3 Test 13 hydraulic model and data Horizontal (ft/s) (lb/ft 2 ) (in) Flow Table E-14: Configuration 3 Test 14 hydraulic model and data Horizontal (ft/s) (lb/ft 2 ) (in) Flow Table E-15: Configuration 3 Test 15 hydraulic model and data Horizontal (ft/s) (lb/ft 2 ) (in) Flow
61 Table E-16: Configuration 3 Test 16 hydraulic model and data Horizontal (ft/s) (lb/ft 2 ) (in) Flow Table E-17: Configuration 3 Test 17 hydraulic model and data Horizontal (ft/s) (lb/ft 2 ) (in) Flow Table E-18: Configuration 3 Test 18 hydraulic model and data Horizontal (ft/s) (lb/ft 2 ) (in) Flow
62 Table E-19: Configuration 3 Test 19 hydraulic model and data Horizontal (ft/s) (lb/ft 2 ) (in) Flow Table E-20: Configuration 4 Test 21 hydraulic model and data Horizontal (ft/s) (lb/ft 2 ) (in) Flow Table E-21: Configuration 4 Test 22 hydraulic model and data Horizontal (ft/s) (lb/ft 2 ) (in) Flow
Evaluation of Miramat Under High Velocity Flows
 Utah State University DigitalCommons@USU Reports Utah Water Research Laboratory January 1985 Evaluation of Miramat Under High Velocity Flows C. Earl Israelsen Frank W. Haws Follow this and additional works
Stone Outlet Sediment Trap
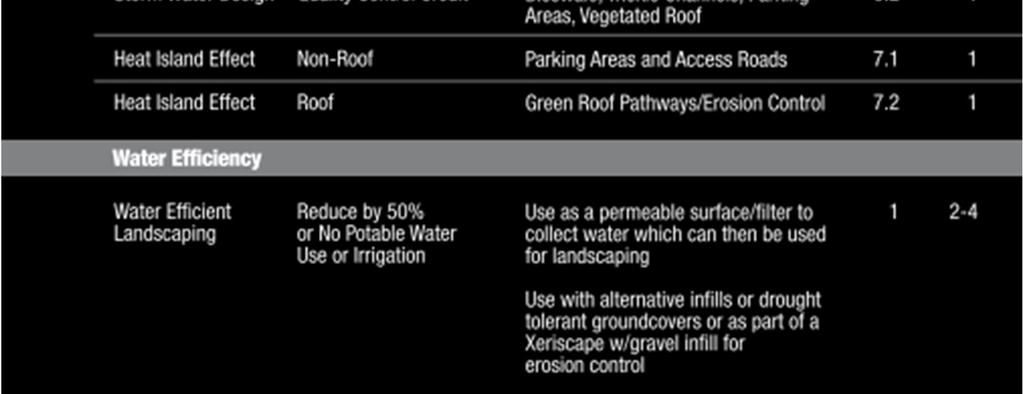
 3.12 Sediment Control Description: A stone outlet sediment trap is a small detention area formed by placing a stone embankment with an integral stone filter outlet across a drainage swale for the purpose
Module 5: Channel and Slope Protection Example Assignments
 Module 5: Channel and Slope Protection Example Assignments A) Example Project Assignment on Slope and Swale Design North America Green Software Example (Erosion Control Materials Design Software) The following
APPENDIX B HYDROLOGY
 APPENDIX B HYDROLOGY TABLE OF CONTENTS 1.0 INTRODUCTION... 1 2.0 PROBABLE MAXIMUM PRECIPITATION (PMP)... 1 3.0 DESIGN FLOW CALCULATION... 1 4.0 DIVERSION CHANNEL SIZING... 2 5.0 REFERENCES... 4 LIST OF
INFLOW DESIGN FLOOD CONTROL SYSTEM PLAN 40 C.F.R. PART PLANT YATES ASH POND 2 (AP-2) GEORGIA POWER COMPANY
 GEORGIA POWER COMPANY") INFLOW DESIGN FLOOD CONTROL SYSTEM PLAN 40 C.F.R. PART 257.82 PLANT YATES ASH POND 2 (AP-2) GEORGIA POWER COMPANY EPA s Disposal of Coal Combustion Residuals from Electric Utilities Final Rule (40 C.F.R.
INFLOW DESIGN FLOOD CONTROL SYSTEM PLAN 40 C.F.R. PART 257.82 PLANT YATES ASH POND 2 (AP-2) GEORGIA POWER COMPANY EPA s Disposal of Coal Combustion Residuals from Electric Utilities Final Rule (40 C.F.R.
APPENDIX B DESIGN CRITERIA FOR TEMPORARY WATER QUALITY BMPS USED DURING CONSTRUCTION
 APPENDIX B DESIGN CRITERIA FOR TEMPORARY WATER QUALITY BMPS USED DURING CONSTRUCTION This Appendix presents design criteria and example calculations for the following temporary water quality BMPs for use
FE Fluids Review March 23, 2012 Steve Burian (Civil & Environmental Engineering)
") Topic: Fluid Properties 1. If 6 m 3 of oil weighs 47 kn, calculate its specific weight, density, and specific gravity. 2. 10.0 L of an incompressible liquid exert a force of 20 N at the earth s surface.
Topic: Fluid Properties 1. If 6 m 3 of oil weighs 47 kn, calculate its specific weight, density, and specific gravity. 2. 10.0 L of an incompressible liquid exert a force of 20 N at the earth s surface.
NCMA TEK ARTICULATING CONCRETE BLOCK REVETMENT DESIGN FACTOR OF SAFETY METHOD TEK Provided by: EP Henry Corporation
 Provided by: EP Henry Corporation National Concrete Masonry Association an information series from the national authority on concrete masonry technology NCMA TEK ARTICUATING CONCRETE BOCK REVETMENT EIGN
HYDRAULIC EFFICIENCY OF GRATE AND CURB INLETS FOR URBAN STORM DRAINAGE
 HYDRAULIC EFFICIENCY OF GRATE AND CURB INLETS FOR URBAN STORM DRAINAGE Prepared for The Urban Drainage and Flood Control District Prepared by Brendan C. Comport Christopher I. Thornton Amanda L. Cox December
5. ROADSIDE AND MEDIAN CHANNELS
 5. ROADSIDE AND MEDIAN CHANNELS Roadside and median channels are open-channel systems which collect and convey stormwater from the pavement surface, roadside, and median areas. These channels may outlet
53:071 Principles of Hydraulics Laboratory Experiment #3 ANALYSIS OF OPEN-CHANNEL FLOW TRANSITIONS USING THE SPECIFIC ENERGY DIAGRAM
 53:071 Principles of Hydraulics Laboratory Experiment #3 ANALYSIS OF OPEN-CHANNEL FLOW TRANSITIONS USING THE SPECIFIC ENERGY DIAGRAM Principle Adaptation of the Bernoulli equation to open-channel flows
Large-Scale Sediment Retention Device Testing (ASTM D 7351) SedCatch Sediment Basket Inlet Filter Exposed to 6% Sediment Load
 SedCatch Sediment Basket Inlet Filter Exposed to 6% Sediment Load") Large-Scale Sediment Retention Device Testing (ASTM D 7351) of SedCatch Sediment Basket Inlet Filter Exposed to 6% Sediment Load February 2010 Submitted to: SedCatch Environmental Products 8380 Point O
Large-Scale Sediment Retention Device Testing (ASTM D 7351) of SedCatch Sediment Basket Inlet Filter Exposed to 6% Sediment Load February 2010 Submitted to: SedCatch Environmental Products 8380 Point O
Large-Scale Sediment Retention Device Testing (ASTM D 7351) SedCatch Sediment Basket Inlet Filter Exposed to 1.5% Sediment Load
 SedCatch Sediment Basket Inlet Filter Exposed to 1.5% Sediment Load") Large-Scale Sediment Retention Device Testing (ASTM D 7351) of SedCatch Sediment Basket Inlet Filter Exposed to 1.5% Sediment Load February 2010 Submitted to: SedCatch Environmental Products 8380 Point
Large-Scale Sediment Retention Device Testing (ASTM D 7351) of SedCatch Sediment Basket Inlet Filter Exposed to 1.5% Sediment Load February 2010 Submitted to: SedCatch Environmental Products 8380 Point
A-JACKS CONCRETE ARMOR UNITS Channel Lining and Pier Scour Design Manual
 A-JACKS CONCRETE ARMOR UNITS Channel Lining and Pier Scour Design Manual Prepared for Armortec, Inc. Bowling Green, Kentucky P.O. Box 270460 Fort Collins, Colorado 80527 (970) 223-5556, FAX (970) 223-5578
APPENDIX B WORKSHEETS & EXHIBITS
 APPENDIX B WORKSHEETS & EXHIBITS A worksheet provides the designer a representation of a measure that allows for input of specific design criteria. The plan designer will be required to assess field conditions
WATER DISTRIBUTION NETWORKS
 WATER DISTRIBUTION NETWORKS CE 370 1 Components of Water Supply System 2 1 Water Distribution System Water distribution systems are designed to adequately satisfy the water requirements for a combinations
Materials. Use materials meeting the following.
 208.01 Section 208. SOIL EROSION AND SEDIMENTATION CONTROL 208.01 Description. Install and maintain erosion and sedimentation controls to minimize soil erosion and to control sedimentation from affecting
Hydraulics of bendway weirs
 River Basin Management IV 389 Hydraulics of bendway weirs C. Thornton 1, S. Abt 1, D. Baird 2 & R. Padilla 3 1 Colorado State University, Fort Collins, CO, USA 2 U.S. Bureau of Reclamation, Denver, CO,
Open Channel Flow I - The Manning Equation and Uniform Flow COURSE CONTENT
 Open Channel Flow I - The Manning Equation and Uniform Flow Harlan H. Bengtson, PhD, P.E. COURSE CONTENT 1. Introduction Flow of a liquid may take place either as open channel flow or pressure flow. Pressure
Coarse Sediment Traps
 Coarse Sediment Traps SEDIMENT CONTROL TECHNIQUE Type 1 System Sheet Flow Sandy Soils Type 2 System [1] Concentrated Flow Clayey Soils [2] Type 3 System Supplementary Trap Dispersive Soils [1] Though primarily
VARIATION OF MANNING S ROUGHNESS COEFFICIENT WITH SEEPAGE IN SAND-BED CHANNEL *Satish Patel 1 and Bimlesh Kumar 2
 International Journal of Science, Environment and Technology, Vol. 5, No 6, 2016, 3678 3685 ISSN 2278-3687 (O) 2277-663X (P) VARIATION OF MANNING S ROUGHNESS COEFFICIENT WITH SEEPAGE IN SAND-BED CHANNEL
ALUMINUM STRUCTURAL PLATE HEADWALLS AASHTO LRFD BASIS OF DESIGN
 ALUMINUM STRUCTURAL PLATE EADWALLS AASTO LRFD BASIS OF DESIGN LANE ENTERPRISES, INC. www.lane-enterprises.com Required Backfill and Load Cases: ALUMINUM STRUCTURAL PLATE EADWALLS BASIS OF DESIGN Backfill
@Copyright 2016 SKAPS Industries.
 SKAPS INDUSTRIES 571 Industrial Pkwy, Commerce, GA 30529 Phone: (706) 336 7000 Fax: (706) 336 7007 E Mail: contact@skaps.com SKAPS GEOCOMPOSITE DROP IN SPECIFICATIONS @Copyright 2016 SKAPS Industries www.skaps.com
Provide sediment tubes for ditch check and Type A inlet structure filter applications that meet the minimum performance requirements of Table 1.
 Supplemental Technical Specification for SEDIMENT TUBES SCDOT Designation: SC-M-815-1 (03/08) 1.0 Sediment Tubes This Supplemental Specification replaces sections 815.1.1.2, 815.2.3, 815.4.5, 815.5, and
IN SITU SPECIFIC GRAVITY VS GRAIN SIZE: A BETTER METHOD TO ESTIMATE NEW WORK DREDGING PRODUCTION
 IN SITU SPECIFIC GRAVITY VS GRAIN SIZE: A BETTER METHOD TO ESTIMATE NEW WORK DREDGING PRODUCTION Nancy Case O Bourke, PE 1, Gregory L. Hartman, PE 2 and Paul Fuglevand, PE 3 ABSTRACT In-situ specific gravity
Pressure Head: Pressure head is the height of a column of water that would exert a unit pressure equal to the pressure of the water.
 Design Manual Chapter - Stormwater D - Storm Sewer Design D- Storm Sewer Sizing A. Introduction The purpose of this section is to outline the basic hydraulic principles in order to determine the storm
STRUCTURAL STABILITY ASSESSMENT
 STRUCTURAL STABILITY ASSESSMENT CFR 257.73(d) Bottom Ash Pond Complex Cardinal Plant Brilliant, Ohio October, 2016 Prepared for: Cardinal Operating Company Cardinal Plant Brilliant, Ohio Prepared by: Geotechnical
Stage Discharge Tabulation for Only Orifice Flow
 Stage Discharge Tabulation for Only Orifice Flow DEPTH STAGE DISCHARGE (meters) (feet) (meters) (feet) (m 3 /s) (ft 3 /s) 0 0.20 0.40 0.60 0.80 1.00 1.20 1.40 1.60 1.80 2.00 0.7 1.3 2.0 2.6 3.3 3.9 4.6
Open Channel Hydraulics I - Uniform Flow
 PDHonline Course H138 (2 PDH) Open Channel Hydraulics I - Uniform Flow Instructor: Harlan H. Bengtson, Ph.D., PE 2012 PDH Online PDH Center 5272 Meadow Estates Drive Fairfax, VA 22030-6658 Phone & Fax:
Countermeasure Calculations and Design
 Countermeasure Calculations and Design Summarized from Bridge Scour and Stream Instability Countermeasures, Experience, Selection, and Design Guidance, Second Edition, Publication No. FHWA NHI 01-003,
U-Shaped Sediment Traps
 U-Shaped Sediment Traps SEDIMENT CONTROL TECHNIQUE Type 1 System Sheet Flow Sandy Soils Type 2 System Concentrated Flow Clayey Soils [1] Type 3 System Supplementary Trap Dispersive Soils [1] Generally
Basic Math Concepts for Water and Wastewater Operators. Daniel B. Stephens & Associates, Inc.
 Basic Math Concepts for Water and Wastewater Operators Topics Hierarchy of operations Manipulating equations Unit/dimensional analysis and conversion factors Electricity Temperature Geometry Flow hydraulics
MODELING OF LOCAL SCOUR AROUND AL-KUFA BRIDGE PIERS Saleh I. Khassaf, Saja Sadeq Shakir
 ISSN 2320-9100 11 International Journal of Advance Research, IJOAR.org Volume 1, Issue 8,August 2013, Online: ISSN 2320-9100 MODELING OF LOCAL SCOUR AROUND AL-KUFA BRIDGE PIERS Saleh I. Khassaf, Saja Sadeq
PART 2:! FLUVIAL HYDRAULICS" HYDROEUROPE
 PART 2:! FLUVIAL HYDRAULICS" HYDROEUROPE 2009 1 HYDROEUROPE 2009 2 About shear stress!! Extremely complex concept, can not be measured directly!! Computation is based on very primitive hypotheses that
OPEN CHANNEL FLOW. One-dimensional - neglect vertical and lateral variations in velocity. In other words, Q v = (1) A. Figure 1. One-dimensional Flow
 A. Figure 1. One-dimensional Flow") OPEN CHANNEL FLOW Page 1 OPEN CHANNEL FLOW Open Channel Flow (OCF) is flow with one boundary exposed to atmospheric pressure. The flow is not pressurized and occurs because of gravity. Flow Classification
OPEN CHANNEL FLOW Page 1 OPEN CHANNEL FLOW Open Channel Flow (OCF) is flow with one boundary exposed to atmospheric pressure. The flow is not pressurized and occurs because of gravity. Flow Classification
Geosynthetics Applications and Performance Reviews Select Case Histories
 Geosynthetics Applications and Performance Reviews Select Case Histories Debora J. Miller, Ph.D., P.E.; Dean B. Durkee,, Ph.D., P.E.; Michael A. Morrison, P.E., David B. Wilson, P.E., and Kevin Smith,
3301 East 120 th Avenue Assited Living & Memory Care
 UTILITY REPORT FOR 3301 East 120 th Avenue Assited Living & Memory Care 1 st Submittal January 23, 2016 2 nd Submittal March 04, 2016 Prepared for: 3301 E. 120 th Ave, LLC. 8200 E. Maplewood Ave., Suite
Lesson 25. Static Pile Load Testing, O-cell, and Statnamic. Reference Manual Chapter 18
 Lesson 25 Static Pile Load Testing, O-cell, and Statnamic Reference Manual Chapter 18 STATIC LOAD TESTING Most accurate method to determine static pile capacity Perform at design or construction stage
GEOSYNTHETICS ENGINEERING: IN THEORY AND PRACTICE
 GEOSYNTHETICS ENGINEERING: IN THEORY AND PRACTICE Prof. J. N. Mandal Department of civil engineering, IIT Bombay, Powai, Mumbai 400076, India. Tel.022-25767328 email: cejnm@civil.iitb.ac.in Module - 4
WQ Outlet Design Single Orifice Orifice diameter = 24. Perforated riser/orifice Plate Outlet area per perforation row = 4
 These calculations should be used when designing the outlet structures for extended wet and dry detention basins (Sections 4. 7 and 4.8). The water quality outlet size and the trash rack design will vary
Advanced Hydraulics Prof. Dr. Suresh A Kartha Department of Civil Engineering Indian Institute of Technology, Guwahati
 Advanced Hydraulics Prof. Dr. Suresh A Kartha Department of Civil Engineering Indian Institute of Technology, Guwahati Module - 2 Uniform Flows Lecture - 6 Design of Channels for Uniform Flow (Refer Slide
Vegetation effects on river hydraulics. Johannes J. (Joe) DeVries David Ford Consulting Engineers, Inc. Sacramento, CA
 DeVries David Ford Consulting Engineers, Inc. Sacramento, CA") Vegetation effects on river hydraulics Johannes J. (Joe) DeVries David Ford Consulting Engineers, Inc. Sacramento, CA jjdevries@ford-consulting.com SAC05 D2P31 RM 99.0L VIEW UPSTREAM AT UPSTREAM END DWR
Vegetation effects on river hydraulics Johannes J. (Joe) DeVries David Ford Consulting Engineers, Inc. Sacramento, CA jjdevries@ford-consulting.com SAC05 D2P31 RM 99.0L VIEW UPSTREAM AT UPSTREAM END DWR
APPENDIX B ABBREVIATIONS, SYMBOLS AND CONVERSION FACTORS Abbreviations
 APPENDIX B ABBREVIATIONS, SYMBOLS AND CONVERSION FACTORS Abbreviations A ampere AASHTO American Association of State Highway & Transportation Officials ABS (%) Percent of Absorbed Moisture Abs. Vol. Absolute
[1] Performance of the sediment trap depends on the type of outlet structure and the settling pond surface area.
![[1] Performance of the sediment trap depends on the type of outlet structure and the settling pond surface area.](/thumbs/76/74245181.jpg "[1] Performance of the sediment trap depends on the type of outlet structure and the settling pond surface area.") Sediment Trench SEDIMENT CONTROL TECHNIQUE Type 1 System Sheet Flow Sandy Soils Type 2 System [1] Concentrated Flow Clayey Soils Type 3 System [1] Supplementary Trap Dispersive Soils [1] Performance of
Sediment Trench SEDIMENT CONTROL TECHNIQUE Type 1 System Sheet Flow Sandy Soils Type 2 System [1] Concentrated Flow Clayey Soils Type 3 System [1] Supplementary Trap Dispersive Soils [1] Performance of
ONE ROCK DAM ORD. capture more sediment. The original ORD becomes the splash apron for the new layer. STEP 4: When ORD fills in, add a new layer
 ONE ROCK DAM ORD A low grade control structure built with a single layer of rock on the bed of the channel. ORDs stabilize the bed of the channel by slowing the flow of water, increasing roughness, recruiting
Section 4: Model Development and Application
 Section 4: Model Development and Application The hydrologic model for the Wissahickon Act 167 study was built using GIS layers of land use, hydrologic soil groups, terrain and orthophotography. Within
Large-Scale Slope Erosion Testing (ASTM D 6459 modified) Hydromulch 2000 over Sandy Loam
 Hydromulch 2000 over Sandy Loam") Large-Scale Slope Erosion Testing (ASTM D 6459 modified) of Hydromulch 2000 over Sandy Loam December 2009 Submitted to: AASHTO/NTPEP 444 North Capitol Street, NW, Suite 249 Washington, D.C. 20001 Attn:
Large-Scale Slope Erosion Testing (ASTM D 6459 modified) of Hydromulch 2000 over Sandy Loam December 2009 Submitted to: AASHTO/NTPEP 444 North Capitol Street, NW, Suite 249 Washington, D.C. 20001 Attn:
B805 TEMPORARY EROSION AND SEDIMENT CONTROL MEASURES - OPSS 805
 B805 MEASURES - OPSS 805 805.1 GENERAL Construction activities frequently remove protective cover and expose soil to accelerated rates of erosion. Sediments generated thereby can be conveyed via runoff
APPENDIX H CONVERSION FACTORS
 APPENDIX H CONVERSION FACTORS A ampere American Association of State AASHTO Highway & Transportation Officials ABS (%) Percent of Absorbed Moisture Abs. Vol. Absolute Volume ACI American Concrete Institute
1.060 Engineering Mechanics II Spring Problem Set 8
 1.060 Engineering Mechanics II Spring 2006 Due on Monday, May 1st Problem Set 8 Important note: Please start a new sheet of paper for each problem in the problem set. Write the names of the group members
B-1 BORE LOCATION PLAN. EXHIBIT Drawn By: 115G BROOKS VETERINARY CLINIC CITY BASE LANDING AND GOLIAD ROAD SAN ANTONIO, TEXAS.
 N B-1 SYMBOLS: Exploratory Boring Location Project Mngr: BORE LOCATION PLAN Project No. GK EXHIBIT Drawn By: 115G1063.02 GK Scale: Checked By: 1045 Central Parkway North, Suite 103 San Antonio, Texas 78232
Sediment Trap. A temporary runoff containment area, which promotes sedimentation prior to discharge of the runoff through a stabilized spillway.
 Sediment Trap SC-15 Source: Caltrans Construction Site Best Management Practices Manual, 2003. Description A temporary runoff containment area, which promotes sedimentation prior to discharge of the runoff
Open Channel Flow Part 2. Ch 10 Young, notes, handouts
 Open Channel Flow Part 2 Ch 10 Young, notes, handouts Uniform Channel Flow Many situations have a good approximation d(v,y,q)/dx=0 Uniform flow Look at extended Bernoulli equation Friction slope exactly
UNIVERSITY OF BOLTON WESTERN INTERNATIONAL COLLEGE FZE. BEng (HONS) IN CIVIL ENGINEERING SEMESTER ONE EXAMINATION 2016/2017 GROUND AND WATER STUDIES 1
 IN CIVIL ENGINEERING SEMESTER ONE EXAMINATION 2016/2017 GROUND AND WATER STUDIES 1") OCD59 UNIVERSITY OF BOLTON WESTERN INTERNATIONAL COLLEGE FZE BEng (HONS) IN CIVIL ENGINEERING SEMESTER ONE EXAMINATION 2016/2017 GROUND AND WATER STUDIES 1 MODULE NO: CIE4009 Date: Saturday 14 January
OCD59 UNIVERSITY OF BOLTON WESTERN INTERNATIONAL COLLEGE FZE BEng (HONS) IN CIVIL ENGINEERING SEMESTER ONE EXAMINATION 2016/2017 GROUND AND WATER STUDIES 1 MODULE NO: CIE4009 Date: Saturday 14 January
TSEGI WASH 50% DESIGN REPORT
 TSEGI WASH 50% DESIGN REPORT 2/28/2014 Daniel Larson, Leticia Delgado, Jessica Carnes I Table of Contents Acknowledgements... IV 1.0 Project Description... 1 1.1 Purpose... 1 Figure 1. Erosion of a Headcut...
DATA REPORT FOR COMPLETED SPUR-DIKE CONFIGURATIONS WITHIN THE NATIVE TOPOGRAPHY MODEL
 DATA REPORT FOR COMPLETED SPUR-DIKE CONFIGURATIONS WITHIN THE NATIVE TOPOGRAPHY MODEL Prepared for the U. S. Department of the Interior Bureau of Reclamation Albuquerque Area Office 555 Broadway N.E.,
DEPARTMENT OF CIVIL AND ENVIRONMENTAL ENGINEERING Urban Drainage: Hydraulics. Solutions to problem sheet 2: Flows in open channels
 DEPRTMENT OF CIVIL ND ENVIRONMENTL ENGINEERING Urban Drainage: Hydraulics Solutions to problem sheet 2: Flows in open channels 1. rectangular channel of 1 m width carries water at a rate 0.1 m 3 /s. Plot
Restraining Thrust Forces. DIPRA Member Companies. DIPRA Website (www.dipra.org) DIPRA Computer Programs. AWWA Standards
 DIPRA Computer Programs. AWWA Standards") DIPRA Member Companies 1915 DIPRA Website (www.dipra.org) DIPRA Computer Programs Thickness Design of Ductile Iron PIpe Hydraulic Analysis of Ductile Iron Pipe Thrust Restraint Design for Ductile Iron
DIPRA Member Companies 1915 DIPRA Website (www.dipra.org) DIPRA Computer Programs Thickness Design of Ductile Iron PIpe Hydraulic Analysis of Ductile Iron Pipe Thrust Restraint Design for Ductile Iron
Scattergraph Principles and Practice Evaluating Self-Cleansing in Existing Sewers Using the Tractive Force Method
 Scattergraph Principles and Practice Evaluating Self-Cleansing in Existing Sewers Using the Tractive Force Method Kevin L. Enfinger, P.E. and Paul S. Mitchell, P.E. ADS Environmental Services 4940 Research
Landslide FE Stability Analysis
 Landslide FE Stability Analysis L. Kellezi Dept. of Geotechnical Engineering, GEO-Danish Geotechnical Institute, Denmark S. Allkja Altea & Geostudio 2000, Albania P. B. Hansen Dept. of Geotechnical Engineering,
Flow Measurement in Pipes and Ducts COURSE CONTENT
 Flow Measurement in Pipes and Ducts Dr. Harlan H. Bengtson, P.E. COURSE CONTENT 1. Introduction This course is about measurement of the flow rate of a fluid flowing under pressure in a closed conduit.
BACKFILL AND INTERFACE CHARACTERISTICS
 Chapter 5 BACKFILL AND INTERFACE CHARACTERISTICS This chapter introduces the properties of backfill and the distribution of soil density in the soil bin. The interface characteristics between the backfill
Lecture Note for Open Channel Hydraulics
 Chapter -one Introduction to Open Channel Hydraulics 1.1 Definitions Simply stated, Open channel flow is a flow of liquid in a conduit with free space. Open channel flow is particularly applied to understand
Large-Scale Slope Erosion Testing (ASTM D 6459 modified) Flexterra Ultra over Sandy Loam
 Flexterra Ultra over Sandy Loam") Large-Scale Slope Erosion Testing (ASTM D 6459 modified) of Flexterra Ultra over Sandy Loam December 2009 Submitted to: AASHTO/NTPEP 444 North Capitol Street, NW, Suite 249 Washington, D.C. 20001 Attn:
Large-Scale Slope Erosion Testing (ASTM D 6459 modified) of Flexterra Ultra over Sandy Loam December 2009 Submitted to: AASHTO/NTPEP 444 North Capitol Street, NW, Suite 249 Washington, D.C. 20001 Attn:
MEANDER MIGRATION MODEL ASSESSMENT FOR THE JANUARY 2005 STORM, WHITMAN PROPERTY, SAN ANTONIO CREEK, VENTURA COUNTY, CALIFORNIA
 MEANDER MIGRATION MODEL ASSESSMENT FOR THE JANUARY 2005 STORM, WHITMAN PROPERTY, SAN ANTONIO CREEK, VENTURA COUNTY, CALIFORNIA Prepared by Eric Larsen, Ph.D. Mark Rains, Ph.D. October 2006 INTRODUCTION
405 Compact Orifice Series and 1595 Conditioning Orifice Plate Flow Test Data Book and Flow Handbook
 405 Compact Orifice Series and 1595 Conditioning Orifice Plate Flow Test Book and Flow Handbook www.rosemount.com 405 Compact Orifice Series and 1595 Conditioning Orifice Plate Flow Test Book NOTICE Read
J. Paul Guyer, P.E., R.A.
 J. Paul Guyer, P.E., R.A. Paul Guyer is a registered mechanical engineer, civil engineer, fire protection engineer and architect with over 35 years experience in the design of buildings and related infrastructure.
Uniform Channel Flow Basic Concepts. Definition of Uniform Flow
 Uniform Channel Flow Basic Concepts Hydromechanics VVR090 Uniform occurs when: Definition of Uniform Flow 1. The depth, flow area, and velocity at every cross section is constant 2. The energy grade line,
CCR Rule Annual Inspection Report (cont.) 2
 2") The inspection findings consisted of maintenance items and items that were not observed to be signs or potential signs of significant structural weakness. No deficiencies or disrupting conditions that
The inspection findings consisted of maintenance items and items that were not observed to be signs or potential signs of significant structural weakness. No deficiencies or disrupting conditions that
Date: April 2, 2014 Project No.: Prepared For: Mr. Adam Kates CLASSIC COMMUNITIES 1068 E. Meadow Circle Palo Alto, California 94303
 City of Newark - 36120 Ruschin Drive Project Draft Initial Study/Mitigated Negative Declaration Appendix C: Geologic Information FirstCarbon Solutions H:\Client (PN-JN)\4554\45540001\ISMND\45540001 36120
Large-Scale Slope Erosion Testing (ASTM D 6459) American Excelsior s AEC Premier Straw Double Net FibreNet, Erosion Control Blanket (ECB) over Loam
 American Excelsior s AEC Premier Straw Double Net FibreNet, Erosion Control Blanket (ECB) over Loam") Large-Scale Slope Erosion Testing (ASTM D 6459) of American Excelsior s AEC Premier Straw Double Net FibreNet, Erosion Control Blanket (ECB) over Loam November 2016 Submitted to: AASHTO/NTPEP 444 North
Large-Scale Slope Erosion Testing (ASTM D 6459) of American Excelsior s AEC Premier Straw Double Net FibreNet, Erosion Control Blanket (ECB) over Loam November 2016 Submitted to: AASHTO/NTPEP 444 North
Summary of Hydraulic and Sediment-transport. Analysis of Residual Sediment: Alternatives for the San Clemente Dam Removal/Retrofit Project,
 Appendix N SUMMARY OF HYDRAULIC AND SEDIMENT-TRANSPORT ANALYSIS OF RESIDUAL SEDIMENT: ALTERNATIVES FOR THE SAN CLEMENTE DAM REMOVAL/RETROFIT PROJECT, CALIFORNIA the San Clemente Dam Removal/Retrofit Project,
Zainab Mohamed Yusof*, Syura Fazreen Hamzah 1 & Shahabuddin Amerudin 2
 Malaysian Journal of Civil Engineering 29 Special Issue (1):100-117 (2017) EROSION CHARACTERISTICS OF A MEDIUM SAND BREACHED EMBANKMENT Zainab Mohamed Yusof*, Syura Fazreen Hamzah 1 & Shahabuddin Amerudin
Experiment (4): Flow measurement
: Flow measurement") Experiment (4): Flow measurement Introduction: The flow measuring apparatus is used to familiarize the students with typical methods of flow measurement of an incompressible fluid and, at the same time
Experiment (4): Flow measurement Introduction: The flow measuring apparatus is used to familiarize the students with typical methods of flow measurement of an incompressible fluid and, at the same time
THE HYDRAULIC PERFORMANCE OF ORIENTED SPUR DIKE IMPLEMENTATION IN OPEN CHANNEL
 Tenth International Water Technology Conference, IWTC10 2006, Alexandria, Egypt 281 THE HYDRAULIC PERFORMANCE OF ORIENTED SPUR DIKE IMPLEMENTATION IN OPEN CHANNEL Karima Attia 1 and Gamal El Saied 2 1
Pressure and Flow Characteristics
 Pressure and Flow Characteristics Continuing Education from the American Society of Plumbing Engineers August 2015 ASPE.ORG/ReadLearnEarn CEU 226 READ, LEARN, EARN Note: In determining your answers to
Module 5: Channel and Slope Stability. Channel and Slope Protection. Upslope diversions Channel Protection. Slope Protection
 Massive Streambank Failure at New Outfall in a Suburban Area Module 5: Channel and Slope Stability Robert Pitt Department of Civil, Construction and Environmental Engineering University of Alabama Tuscaloosa,
Chutes Part 5: Rock linings
 Chutes Part 5: Rock linings DRAINAGE CONTROL TECHNIQUE Low Gradient Velocity Control Short-Term Steep Gradient Channel Lining Medium-Long Term Outlet Control [1] Soil Treatment Permanent [2] [1] Chutes
BACK. Stability design of a grass-lined stress requires the determination The first is the retardance curve potential of the vegetal cover to
 3. DETERMINATION OF CHANNEL DESIGN PARAMETERS By D.M. Temple BACK The conditions governing the stability of a grass-lined open channel are the channel geometry and slope, the erodibility of the soil boundary,
design, construction, operation, and maintenance of the BAP is consistent with recognized and generally accepted good engineering standards.
 design, construction, operation, and maintenance of the BAP is consistent with recognized and generally accepted good engineering standards. In addition to the field inspection, Associated Engineers, Inc.
Technical Memorandum. To: From: Copies: Date: 10/19/2017. Subject: Project No.: Greg Laird, Courtney Moore. Kevin Pilgrim and Travis Stroth
 Technical Memorandum To: From: Greg Laird, Courtney Moore Kevin Pilgrim and Travis Stroth 5777 Central Avenue Suite 228 Boulder, CO 80301 www.otak.com Copies: [Electronic submittal] Date: 10/19/2017 Subject:
405 Compact Orifice Series and 1595 Conditioning Orifice Plate Flow Test Data Book and Flow Handbook
 405 Compact Orifice Series and 1595 Conditioning Orifice Plate Flow Test Book and Flow Handbook www.rosemount.com 405 and 1595 405 Compact Orifice Series and 1595 Conditioning Orifice Plate Flow Test
THREE HOLE SPLICE CLEVIS FOR B52 Standard finishes: ZN, GRN Wt./C 126 Lbs. (57.1 kg)
") CLEVIS FITTINGS B169 TWO HOLE SPLICE Wt./C 84 Lbs. (38.1 kg) B168 THREE HOLE SPLICE Wt./C 126 Lbs. (57.1 kg) B167 Wt./C 178 Lbs. (80.7 kg) 3 1 /2 (88.9) B170 TWO HOLE SPLICE Wt./C 123 Lbs. (55.8 kg) 5
CLEVIS FITTINGS B169 TWO HOLE SPLICE Wt./C 84 Lbs. (38.1 kg) B168 THREE HOLE SPLICE Wt./C 126 Lbs. (57.1 kg) B167 Wt./C 178 Lbs. (80.7 kg) 3 1 /2 (88.9) B170 TWO HOLE SPLICE Wt./C 123 Lbs. (55.8 kg) 5
Project (Project No. US-CA-62-2) Maintenance Inspection and Reports (Subtask 14.1) Inspection Report No.2
 Maintenance Inspection and Reports (Subtask 14.1) Inspection Report No.2") MEMORANDUM TO: FROM: Jim Well, Ducks Unlimited Mike Harvey, PhD, PG SUBJECT: M&T/ Llano Seco Fish Screen Project (Project No. US-CA-62-2) Maintenance Inspection and Reports (Subtask 14.1) Inspection Report
MEMORANDUM TO: FROM: Jim Well, Ducks Unlimited Mike Harvey, PhD, PG SUBJECT: M&T/ Llano Seco Fish Screen Project (Project No. US-CA-62-2) Maintenance Inspection and Reports (Subtask 14.1) Inspection Report
CASE STUDIES. Introduction
 Introduction The City of Winston-Salem faces the challenge of maintaining public infrastructure (e.g., water and sewer lines, storm drains, roads, culverts and bridges) while minimizing the potential impacts
R.M.HARW & ASSOCIATES LTD. GEOTECHNICAL INVESTIGATION PROPOSED BRIDGE SITE. HELAVA CREEKl MILE MACKENZIE HIGHWAY E-2510 OCTOBER 16, 1973
 El R.M.HARW & ASSOCIATES LTD. GEOTECHNICAL INVESTIGATION PROPOSED BRIDGE SITE HELAVA CREEKl MILE 616.4 MACKENZIE HIGHWAY E-2510 OCTOBER 16, 1973 R,M,HARDV & ASSOCIATES LTD. CONSULTING ENGINEERING & TESTING
ISSUED FOR CONSTRUCTION
 PAGE No. DESCRIPTION 1 Cover Page 2 Overview Map 3 Western Road Plan View 4 Eastern Road Plan View West Road Profiles & Cross Sections 6-7 East Road Profiles 8- East Road Cross Sections 11-14 Campsite
B-1 SURFACE ELEVATION
 5A 5B LOGGED BY El. S. Bhangoo DRILLING CONTRACTOR Pitcher Drilling DRILLING METHOD Rotary Wash BEGIN DATE 12-14-12 SAMPLER TYPE(S) AND SIZE(S) (ID) SPT, MC BOREHOLE BACKFILL AND COMPLETION COMPLETION
Large-Scale Slope Erosion Testing (ASTM D 6459) East Coast Erosion Blanket ECC-2B, Double Net Coconut Fiber Blanket over Sandy Loam
 East Coast Erosion Blanket ECC-2B, Double Net Coconut Fiber Blanket over Sandy Loam") Large-Scale Slope Erosion Testing (ASTM D 6459) of East Coast Erosion Blanket ECC-2B, Double Net Coconut Fiber Blanket over Sandy Loam February 2010 Submitted to: AASHTO/NTPEP 444 North Capitol Street,
Large-Scale Slope Erosion Testing (ASTM D 6459) of East Coast Erosion Blanket ECC-2B, Double Net Coconut Fiber Blanket over Sandy Loam February 2010 Submitted to: AASHTO/NTPEP 444 North Capitol Street,
R09. d water surface. Prove that the depth of pressure is equal to p +.
 Code No:A109210105 R09 SET-1 B.Tech II Year - I Semester Examinations, December 2011 FLUID MECHANICS (CIVIL ENGINEERING) Time: 3 hours Max. Marks: 75 Answer any five questions All questions carry equal
B-1. Attachment B-1. Evaluation of AdH Model Simplifications in Conowingo Reservoir Sediment Transport Modeling
 Attachment B-1 Evaluation of AdH Model Simplifications in Conowingo Reservoir Sediment Transport Modeling 1 October 2012 Lower Susquehanna River Watershed Assessment Evaluation of AdH Model Simplifications
Large-Scale Slope Erosion Testing (ASTM D 6459) Winters Excelsior s Straw Bio, Double Biodegradable Net Straw Blanket over Loam
 Winters Excelsior s Straw Bio, Double Biodegradable Net Straw Blanket over Loam") Large-Scale Slope Erosion Testing (ASTM D 6459) of Winters Excelsior s Straw Bio, Double Biodegradable Net Straw Blanket over Loam June 2014 Submitted to: AASHTO/NTPEP 444 North Capitol Street, NW, Suite
Large-Scale Slope Erosion Testing (ASTM D 6459) of Winters Excelsior s Straw Bio, Double Biodegradable Net Straw Blanket over Loam June 2014 Submitted to: AASHTO/NTPEP 444 North Capitol Street, NW, Suite
Eastlake Assited Living & Memory Care
 UTILITY REPORT FOR Eastlake Assited Living & Memory Care 1 st Submittal January 23, 2016 2 nd Submittal March 04, 2016 June 7, 2016 Final Submittal August 08, 2016 Prepared for: 3301 E. 120 th Ave, LLC.
Factors affecting confluence scour
 & Wang (eds) River Sedimentation 1999., Balkema, Rotterdam. ISBN 9 9 3. 17 19 Factors affecting confluence scour R. B. Rezaur & A. W. Jayawardena. Department of Civil Engineering, The University of Hong
Analysis of laboratory and field pull-out tests of geosynthetics in clayey soils
 Louisiana State University LSU Digital Commons LSU Master's Theses Graduate School 2003 Analysis of laboratory and field pull-out tests of geosynthetics in clayey soils Ather Mohiuddin Louisiana State
25th International Conference on Ground Control in Mining
 ANALYTICAL INVESTIGATION OF SHAFT DAMAGES AT WEST ELK MINE Tim Ross, Senior Associate Agapito Associates, Inc. Golden, CO, USA Bo Yu, Senior Engineer Agapito Associates, Inc. Grand Junction, CO, USA Chris
Northern Lesson 2 Gear Pump Terminology. Gear Pump 101. Lesson 2: Gear Pump Terminology. When your reputation depends on it!
 Gear Pump 101 Lesson 2: Gear Pump Terminology When your reputation depends on it! Symbol Term Metric Unit Abbreviation US Customary Unit Abbreviation Conversion factor a A Area square millimeter mm2 square
Effect of Moisture on Shear Strength Characteristics of Geosynthetic Reinforcement Subgrade
 Journal of Geotechnical and Transportation Engineering Received 4/15/2015 Accepted 6/15/2015 Volume 1 Issue 1 Published 6/22/2015 Effect of Moisture on Shear Strength Characteristics of Geosynthetic Reinforcement
Appendix E. Phase 2A Geotechnical Data
 Appendix E Phase 2A Geotechnical Data Appendix E1 Geotechnical Testing of Sediment ApPENDIX El. GEOTECHNICAL TESTING OF SEDIMENT (Modified from Exponent, 20Q1c) E.I Introduction This appendix presents
Chapter 4 Seismic Design Requirements for Building Structures
 Chapter 4 Seismic Design Requirements for Building Structures where: F a = 1.0 for rock sites which may be assumed if there is 10 feet of soil between the rock surface and the bottom of spread footings