the binding profiles (tag density) as measured by ChIP-seq of NtrC (black) and RNAp (gray)
|
|
|
- Everett Gordon
- 5 years ago
- Views:
Transcription
 as measured by ChIP-seq of NtrC (black) and RNAp (gray) in N non-starved (denoted as N+) and N")
1 Supplementary Figure 1. Screenshots of Integrative Genome Viewer 1 with tracks showing the binding profiles (tag density) as measured by ChIP-seq of NtrC (black) and RNAp (gray) in N non-starved (denoted as N+) and N starved (denoted as N-) E. coli aligned against the upstream regions of all the transcription units shown in Table 1. Tracks with the input DNA control tag density (denoted as input) and with the genomic loci bound by NtrC identified by
2 the SISSRS peak-calling algorithm 2 at t=n- are also shown for comparison. Red arrow (panel Peaks 12 & 13 ) denotes peak upstream from argt gene miss-called by SISSRS.
 NtrC Input (0-999) NtrC N+ (0-999) NtrC N- (0-8196) RNAp N+ (0-8196) RNAp N- (0-100) NtrC N- SISSRS ygfb pepp zapa fau sibc ssrs sera NtrC-P (nm) 32")
 32 P-soxR probe 0-50 100 250 500 1000 (0-516) NtrC Input (0-516) NtrC N+ (0-516) NtrC N- (0-7171) RNAp N+ (0-7171) RNAp N- (0-100) NtrC N- SISSRS yjcc soxr yjcd soxs ryjr NtrC-P (nm) 0 50")
 0 (0-516) NtrC Input - 50 100 250 500 1000 (0-516) NtrC N+ (0-516) NtrC N- (0-7171) RNAp N+ (0-7171) RNAp N- (0-100) NtrC N- SISSRS 32 P- id probe iz ia ic id 32 P-yjcZ probe yjda yjcz prop")
 as measured by ChIP-seq of NtrC (black) and RNAp (gray) in N non-starved (denoted as N+) and N")

3 NtrC-P (nm) 32 P- gn probe (0-1025) NtrC Input (0-1025) NtrC N+ (0-1025) NtrC N- (0-4820) RNAp N+ (0-4820) RNAp N- (0-100) NtrC N- SISSRS murj gn gm ga gb gc NtrC-P (nm) 32 P-ssrS probe (0-999) NtrC Input (0-999) NtrC N+ (0-999) NtrC N- (0-8196) RNAp N+ (0-8196) RNAp N- (0-100) NtrC N- SISSRS ygfb pepp zapa fau sibc ssrs sera NtrC-P (nm) 32 P-dicC probe (0-614) NtrC Input (0-614) NtrC N+ (0-614) NtrC N- (0-6019) RNAp N+ (0-6019) RNAp N- (0-100) NtrC N- SISSRS ydfv xa intk dicc dica ydfa ydfc dicf dicb NtrC-P (nm) 32 P-soxR probe (0-516) NtrC Input (0-516) NtrC N+ (0-516) NtrC N- (0-7171) RNAp N+ (0-7171) RNAp N- (0-100) NtrC N- SISSRS yjcc soxr yjcd soxs ryjr NtrC-P (nm) NtrC (0-1352) Input NtrC Input NtrC (0-1352) N+ NtrC N+ NtrC (0-1352) N- NtrC N- RNAp (0-8395) N+ RNAp N+ RNAp N- (0-8395) RNAp N- NtrC (0-100) N- SISSRS NtrC N- SISSRS NtrC-P (nm) 0 (0-516) NtrC Input (0-516) NtrC N+ (0-516) NtrC N- (0-7171) RNAp N+ (0-7171) RNAp N- (0-100) NtrC N- SISSRS 32 P- id probe iz ia ic id 32 P-yjcZ probe yjda yjcz prop Supplementary Figure 2. Screenshots of Integrative Genome Viewer 1 with tracks showing the binding profiles (tag density) as measured by ChIP-seq of NtrC (black) and RNAp (gray) in N non-starved (denoted as N+) and N starved (denoted as N-) E. coli aligned against the upstream regions of transcription units flgmn, dicc, flic, ssrs, soxr and yjcz-prop. Here these are supplemented with representative autoradiographs of non-denaturing gels showing the binding of in situ phosphorylated NtrC to 32 P-labelled DNA probes with sequences corresponding to their respective upstream regions. Tracks with the input DNA control tag density (denoted as input) and with the genomic loci bound by NtrC identified by the SISSRS peak-calling algorithm 2 at t=n- are also shown for comparison.
 as measured by ChIP-seq of RNAp with Rifampicin treatment (red) and RNAp in the absence of Rifampicin")
4 Supplementary Figure 3. Screenshots of Integrative Genome Viewer 1 with tracks showing the binding profiles (tag density) as measured by ChIP-seq of RNAp with Rifampicin treatment (red) and RNAp in the absence of Rifampicin treatment (black) in N non-starved (denoted as N+) and N starved (denoted as N-) E. coli aligned against the upstream regions of all the transcription units shown in Table 1. Tracks with the input DNA control tag density (denoted as input) is shown for comparison.
 Left.")
5 Supplementary Figure 4. Transcription start site mapping and NtrC-activated σ 54 -dependent transcription of rela from novel promoter P4 (A) Left. Representative image of agarose gels showing the 5 -RACE PCR products amplified from cdna synthesised from total RNA
6 isolated from N starved wild-type NCM3722 and NCM3722:ΔglnG E. coli cells. The presence or absence of the different transcripts originating from promoters P1-4 in the N starved wild-type NCM3722 and NCM3722:ΔglnG E. coli is shown in the table below the agarose gel images. Right. DNA sequencing chromatograms (from FinchTV 3 ) showing the transcription start sites (boxed) originating from promoters P1-4 in the regulatory region of rela determined by 5 -RACE analysis. (B) The DNA sequence of the rela regulatory region (from +240 to 920 with respect to the translation start site of RelA). The consensus -10/-35 of P1 and P2 promoters and -12/-24 elements of the P3 and P4 are shown in bold typeface and underlined; the CRP binding site is indicated and underlined. The transcription start sites of P1-P4 and the translation start site of RelA are indicated. The sequences of primers A and B used for making the cdna for the 5 -RACE analysis are underlined and marked with an empty leftward pointing arrow. The DNA region (from -607 to -811 with respect to the translation start site of RelA) enriched in the immunoprecipitated sample by RNAp binding is highlighted in yellow. (C) Representative autoradiographs of 20% (w/v) denaturing urea gel showing the in situ phosphorylated NtrC dependent synthesis of CpUpGpG transcript (underlined nucleotides are α 32 P labelled) from the P4 promoter by σ 54 -RNAp. The reaction components present in each lane are given at the top of the autoradiographs; lanes 6 and 7 are control lanes and show that the synthesis of CpUpGpG can be initiated from P4 by a non- DNA binding and phosphorylation-independent form of the σ 54 -RNAp transcription activator PspF
7
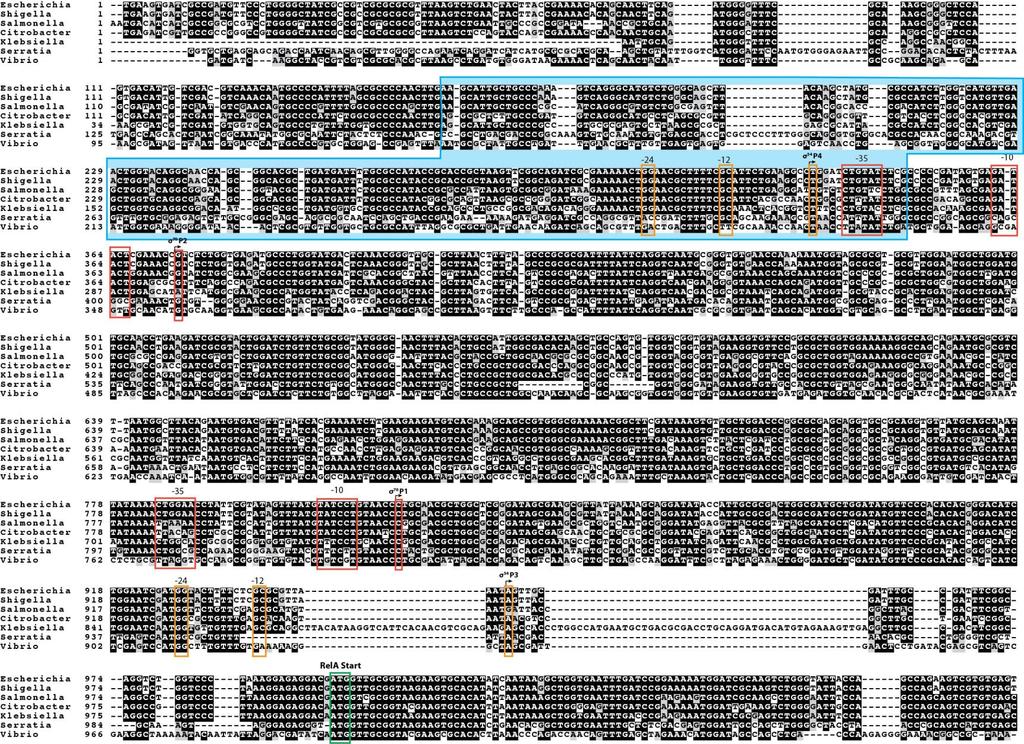
8 Supplementary Figure 5. The alignment of DNA sequences of rela regulatory regions (corresponding to positions 1,000 to +100 of RelA transcription start site of E. coli) from representatives of the Enterobacteriaceae family (Shigella, Salmonella, Citrobacter, Klebsiella, Serratia and Vibrio). The regions corresponding to the NtrC binding region and the promoters P1-4 are boxed in cyan (NtrC), red (P1 and P2) orange (P3 and P4) and the translation start site of RelA is indicated.
9

10
 as measured by ChIP-seq of RNAp binding in N nonstarved (denoted as N+) and N starved (denoted as N-)")
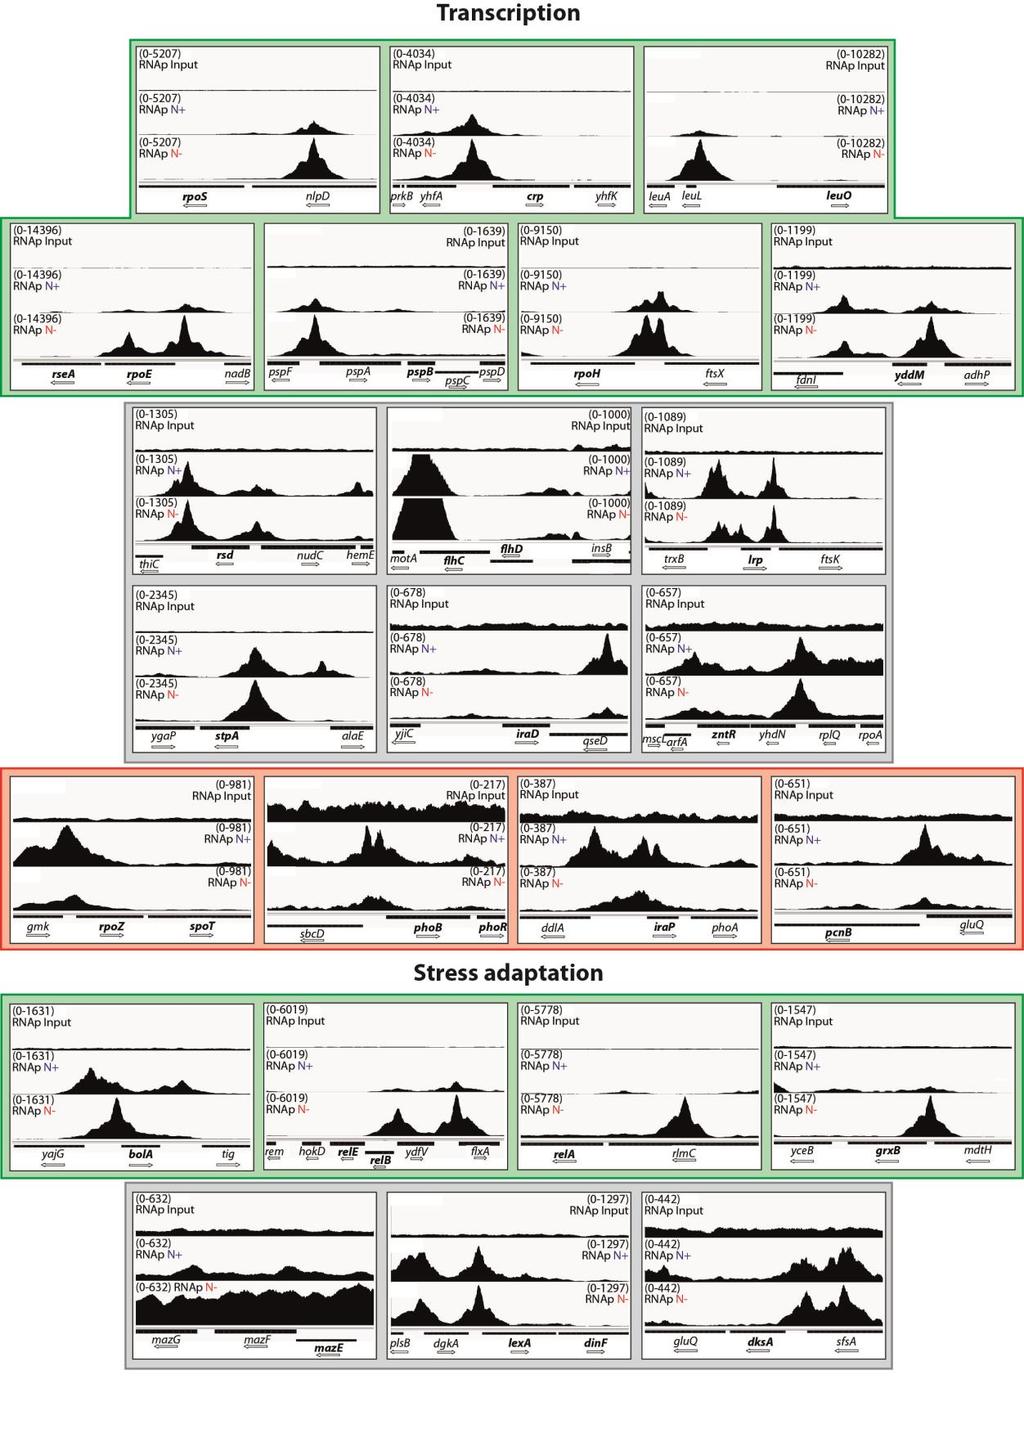
11 Supplementary Figure 6. Screenshots of Integrative Genome Viewer 1 with tracks showing the binding profiles (tag density) as measured by ChIP-seq of RNAp binding in N nonstarved (denoted as N+) and N starved (denoted as N-) E. coli aligned against the upstream regions of all known ppgpp responsive promoters grouped into key cellular processes. A track with the input DNA control tag density (denoted as input) is shown for comparison. The screenshots in the green and red boxes denote promoters at which RNAp binding is positively
12 and negatively, respectively, affected by ppgpp during N starvation. The screenshots in gray boxes denote promoters at which RNAp binding remains unchanged at t=n+ and N-.
 as measured by ChIP-seq of RNAp binding in N nonstarved (denoted as N+) and N starved (denoted as N-)")
13 Supplementary Figure 7. Screenshots of Integrative Genome Viewer 1 with tracks showing the binding profiles (tag density) as measured by ChIP-seq of RNAp binding in N nonstarved (denoted as N+) and N starved (denoted as N-) E. coli aligned against the upstream regions of toxin-antitoxin pair genes. A track with the input DNA control tag density (denoted as input) is shown for comparison. The screenshots in the green boxes denote promoters at which RNAp binding is positively affected by ppgpp during N starvation. The screenshots in gray boxes denote promoters at which RNAp binding remains unchanged at t=n+ and N-.
.")
14 Supplementary Figure 8. Entire gel image of the RelA Western blot showing expression of RelA proteins in cells sampled at t=n- (as in Fig. 2C). Lane 1 contains the molecular weight marker and lane 6 contains purified E. coli RelA-6xHis protein.
15 Supplementary Table 1. Gene expression analysis of ppgpp-dependent promoters Gene Functional group Increased ppgpp effect (predicted) a RNAp ChIP binding N- vs N+ Fold change gene expression N- vs N+ rpos Transcription ±0.75 crp Transcription ±0.36 leuo Transcription ±1.03 rpoe Transcription ±0.30 pspb Transcription ±1.05 rpoh Transcription ±1.04 yddm Transcription ±0.88 rsd Transcription + nc 2.77 ±0.60 flhd Transcription - nc 3.76 ±0.77 lrp Transcription + nc 0.67 ±0.14 stpa Transcription - nc 2.28 ±0.52 irad Transcription + nc 1.06 ±0.36 zntr Transcription + nc 2.81 ±0.76 rpoz Transcription ±0.21 phob Transcription ±0.09 irap Transcription ±1.29 pcnb Transcription ±0.06 bola Stress adaptation relb Stress adaptation ±1.50 rela Stress adaptation ±0.75 maze Stress adaptation - nc 3.68 ±0.50 grxb Stress adaptation ±0.18 lexa Stress adaptation + nc 6.01 ±0.58 dksa Stress adaptation - nc 1.31 ±0.40 rmf Translation ±1.84 rplj Translation ±1.30 fis Translation - nc ±3.52 rpsp Translation - nc 8.69 ±1.51 rpln Translation - nc 0.64 ±0.17 rpmh Translation ±1.78 rpsa Translation ±2.06 thrs Translation ±0.71 rpsu Translation ±3.36 rpsm Translation ±0.13 rrsh Translation - - No array data rpst Translation ±2.27 rpsj Translation ±6.99 rplk Translation ±1.81 rrsg Translation - - No array data dusb Translation ±4.17 rrsd Translation - - No array data rrsc Translation - - No array data rrsa Translation - - No array data
16 rrsb Translation - - No array data rrse Translation - - No array data rpsl Translation ±1.64 hisg Metabolism ±0.45 livj Metabolism ±1.71 thra Metabolism ±2.4 glgc Metabolism + nc 1.75 ±0.47 argi Metabolism + nc 2.52 ±0.60 ppx Metabolism ±0.74 pyrf Metabolism ±1.72 puru Metabolism ±0.10 apt Metabolism ±5.37 spec Metabolism ±0.05 pyrl Metabolism ±0.10 ftsq Cell Division + nc 1.10 ±0.18 ftsz Cell Division + nc 4.16 ±1.44 hola DNA replication - nc 3.04 ±0.56 Red indicates decrease, green indicates increase & grey indicates no change a Predictions of changes in gene expression from an increase in cellular ppgpp levels are derived from Ecocyc 4
17 Supplementary Table 2. TaqMan E. coli gene expression primer and probe sequences used in this study Gene Forward primer (5-3 ) Reverse Primer (5-3 ) FAM Reporter probe (5-3 ) glnk GGGCATGCCGAGCTGTA ATCAGCAATCGCCACATCAATTTT CAGCGTCAATTTCCTG rela CGGGACATGAAGACCGGATT ATCTCTTCCTGCCACGCAAT CCTGGCTGCGTAAACT 16S RNA CCCCCTGGACGAAGACTGA GTGGACTACCAGGGTATCTAATCCT TCCCCACGCTTTCG
18 Supplementary Table 3. EMSA probe and primer sequences Probe name glna probe (344bp) rela probe (336 bp) dicc probe (347 bp) flgmn probe (312 bp) ynfb probe (330 bp) flic probe (359 bp) ssrs probe (346 bp) sera probe (331 bp) yjcc probe (340 bp) Probe sequence 5-3 (Primer sequences bold and underlined) GTCCCTTTGTGATCGCTTTCACGGAGCATAAAAAGGGTTATCCAAAGGTCATTGCACCAA CATGGTGCTTAATGTTTCCATTGAAGCACTATATTGGTGCAACATTCACATCGTGGTGCA GCCCTTTTGCACGATGGTGCGCATGATAACGCCTTTTAGGGGCAATTTAAAAGTTGGCAC AGATTTCGCTTTATCTTTTTTACGGCGACACGGCCAAAATAATTGCAGATTTCGTTACCA CGACGACCATGACCAATCCAGGAGAGTTAAAGTATGTCCGCTGAACACGTACTGACGATG CTGAACGAGCACGAAGTGAAGTTTGTTGATTTGCGCTTCACCGA CACAGCAACTTCAGATGGGGTTTCGCAAAGCGGGCTCCAGTGACATTGTCGACGTCAAAC AATGCCCCATTTTAGCGCCCCAACTTGAAGCATTGCTGCCCAAAGTCAGGGCATGTCTGG GCAGCTTACAAGCTATGCGCCATCTTGGTCATGTTGAACTGGTACAGGCAACCAGCGGCA CGCTGATGATTTTGCGCCATACCGCACCGCTAAGTTCGGCAGATCGCGAAAAACTGGAAC GCTTTTCGCATTCTGAAGGCCTGGATCTGTATCTCGCCCCCGATAGTGAGATACTCGAAA CCGTCTCTGGTGAGATGCCCTGGTATGACTCAAACG ACGAATACCTGCTGCTTGTGCAAGTTTTGTTTTTGAACCGAAATACAAAAGAGCGTCAGT TTTAAGCATTTAAAACACCTTTATTGTTAGTCATAACTAACAAGATAGATGTTAACAAAA ACATAGTCAATACGATTTAGCATTAGCTAACTATGGAAACAAAAAATTTAACTATCGGCG AACGCATCAGGTATCGTCGGAAAAACCTCAAACACACCCAAAGGTCTCTTGCTAAAGCCC TGAAAATCTCCCATGTGTCTGTATCACAATGGGAACGGGGTGATAGTGAACCTACAGGGA AGAACCTTTTTGCCCTCAGTAAAGTATTGCAATGCTCACCAACATGG CTTGCTGCGCTTCGTTGATCAGCGCATCGGCAATTTTGCCGGTGTCCATTTTTAGTTCAC CGTTACGAATCGCCAGTTTTAACGCTTCGACACGTTCAAGATTGATATCACTGCTGCCGG GTTGCATCAGTTTTGCTTGCGCGTCGCTTAACGTCACACTGGTGCTGGTGGAGGCGGTTG TTTTTGCCGCCCGGCTGTTCGTTACCGGCGCGTCAGTGGTTTCGCGCGGTTGAACGGTGC TTACAGGCTTCAGAGGCGAAGTGCGATCAATACTCATGGTTTATTCCTCATTGAGGGCGC TTTTATCATGTG ATCACTCTCAGCAAACGAATCGGCCTGCTCGCTATTCTGCTGCCTTGCGCACTGGCATTG AGCACAACTGTTCATGCCGAAACTAACAAACTGGTGATTGAGTCTGGCGACAGTGCACAA AGCCGCCAGCACGCCGCTATGGAAAAAGAGCAATGGAATGACACGCGCAATCTGCGCCAG AAAGTGAATAAACGCACTGAAAAAGAGTGGGATAAAGCCGACGCCGCTTTTGATAACCGC GATAAATGTGAGCAAAGCGCCAACATCAATGCCTACTGGGAGCCCAATACTTTGCGCTGC CTGGACCGTCGAACTGGCCGCGTTATTACC TTAGTACCGGTAGTGGCCTGTACCGTCAGTTCACGCACACGCTGTAAGTTGTTGTTGATT TCGGACAGCGCGCCTTCGGTGGTCTGCGCAACGGAGATACCGTCGTTGGCGTTACGGGCC GCCTGAGTCAGGCCTTTAATGTTAGAGGTGAAACGGTTAGCAATCGCCTGACCCGCTGCG TCATCCTTCGCGCTGTTAATACGCAAGCCAGAAGACAGACGCTCGATAGAACTCGACAGC GCAGACTGGTTCTTGTTGATATTATTTTGAGTGATCAGCGAGAGGCTGTTGGTATTAATG ACTTGTGCCATGATTCGTTATCCTATATTGCAAGTCGTTGATTACGTATTGGGTTTCCA TTGAACAAGGTCGCATCACCGAAAAAACTAACCAAAACTTTGAATGACACTTTTCGGTTT ACTGTGGTAGAGTAACCGTGAAGACAAAATTTCTCTGAGATGTTCGCAAGCGGGCCAGTC CCCTGAGCCGATATTTCATACCACAAGAATGTGGCGCTCCGCGGTTGGTGAGCATGCTCG GTCCGTCCGAGAAGCCTTAAAACTGCGACGACACATTCACCTTGAACCAAGGGTTCAAGG GTTACAGCCTGCGGCGGCATCTCGGAGATTCCCTTCTTATCTGGCACCAGCCATGACGCA ACTACCAGAACTCCCACTGACATTATCCCGACAAGAAATCCGCAAA TCAGCCAGAATGCCCAATTGCGTACCAATATGACCGTAGCCGATGATACCCAGCTTTTTG CCGCGCGCTTCAAAAGAACCCGCCGCCAGTTTGTTCCACACGCCACGGTGCGCTTTAGCA TTGGCTTCCGGCACGCCGCGCAATAGCAGCAGCAGTTCGCCAATCACCAGCTCCGCAACA GAGCGCGTATTTGAGAACGGTGCGTTAAATACCGGGATCCCGCGCTTTGCCGCCGCATCC AGATCAACCTGGTTTGTTCCGATACAGAAACAGCCAATAGCGACCAGTTTTTCTGCGGCG TTGATCACGTCTTCAGTCAGATGGGTACGGG CGGAACACATCATCGAGCTGGCGCACAGCCTGGGGTTAAAAACGATCGCTGAAGGCGTCG AAACTGAGGAGCAGGTTAACTGGCTGCGCAAACGCGGCGTGCGCTATTGCCAGGGATGGT TCTTTGCGAAGGCGATGCCGCCGCAGGTGTTTATGCAATGGATGGAGCAATTACCCGCGC GGGAGTTAACGCGCGGGCAATAAAATTACAGGCGGTGGCGATAATCGCTGGGAGTGCGAT CAAACTGCCGACGGAAAACGCGGGAGAAGGTCTGCTGCGAGACATAACCCAGGTCCATTG CGATATCAAAAATCGGACGCTCGGTGGTGCGCAACTCAAC
19 Supplementary Table 4. Primer sequences for 5 RACE PCR used in this study Primer Primer sequence (5-3 ) GSP1_relA (set A) CGTGTCAATGTCCATACT GSP2_relA (set A) CGAGAGGATCTCCACCATCTCA GSP3_relA (set A) CATCTCAACACCACGCCAC GSP1_relA2 (set B) CCAGCAACACTTTATCG GSP2_relA2 (set B) GGCTGCTTTGTGACATCTTCTTC GSP3_relA2 (set B) CTGTAAGCCATTAAGACGCGC Supplementary References 1 Thorvaldsdóttir, H., Robinson, J. T. & Mesirov, J. P. Integrative Genomics Viewer (IGV): highperformance genomics data visualization and exploration. Briefings in bioinformatics 14, , doi: /bib/bbs017 (2013). 2 Narlikar, L. & Jothi, R. ChIP-Seq data analysis: identification of protein-dna binding sites with SISSRs peak-finder. Methods in molecular biology (Clifton, N.J.) 802, , doi: / _20 (2012). 3 FinchTV (Geospiza Inc. 4 Keseler, I. M. et al. EcoCyc: fusing model organism databases with systems biology. Nucleic acids research 41, D , doi: /nar/gks1027 (2013).
Three types of RNA polymerase in eukaryotic nuclei
 Three types of RNA polymerase in eukaryotic nuclei Type Location RNA synthesized Effect of α-amanitin I Nucleolus Pre-rRNA for 18,.8 and 8S rrnas Insensitive II Nucleoplasm Pre-mRNA, some snrnas Sensitive
Supplementary Figure 1
 Supplementary Figure 1 Supplementary Figure 1. HSP21 expression in 35S:HSP21 and hsp21 knockdown plants. (a) Since no T- DNA insertion line for HSP21 is available in the publicly available T-DNA collections,
ydci GTC TGT TTG AAC GCG GGC GAC TGG GCG CGC AAT TAA CGG TGT GTA GGC TGG AGC TGC TTC
 Table S1. DNA primers used in this study. Name ydci P1ydcIkd3 Sequence GTC TGT TTG AAC GCG GGC GAC TGG GCG CGC AAT TAA CGG TGT GTA GGC TGG AGC TGC TTC Kd3ydcIp2 lacz fusion YdcIendP1 YdcItrgP2 GAC AGC
Structure and RNA-binding properties. of the Not1 Not2 Not5 module of the yeast Ccr4 Not complex
 Structure and RNA-binding properties of the Not1 Not2 Not5 module of the yeast Ccr4 Not complex Varun Bhaskar 1, Vladimir Roudko 2,3, Jerome Basquin 1, Kundan Sharma 4, Henning Urlaub 4, Bertrand Seraphin
Illegitimate translation causes unexpected gene expression from on-target out-of-frame alleles
 Illegitimate translation causes unexpected gene expression from on-target out-of-frame alleles created by CRISPR-Cas9 Shigeru Makino, Ryutaro Fukumura, Yoichi Gondo* Mutagenesis and Genomics Team, RIKEN
Gene regulation II Biochemistry 302. Bob Kelm February 28, 2005
 Gene regulation II Biochemistry 302 Bob Kelm February 28, 2005 Catabolic operons: Regulation by multiple signals targeting different TFs Catabolite repression: Activity of lac operon is restricted when
Characterizing the interplay between multiple levels of organization within bacterial sigma factor regulatory networks
 Supplementary Information Characterizing the interplay between multiple levels of organization within bacterial sigma factor regulatory networks Yu Qiu 1, Harish Nagarajan 1, Mallory Embree 1, Wendy Shieu
Fitness constraints on horizontal gene transfer
 Fitness constraints on horizontal gene transfer Dan I Andersson University of Uppsala, Department of Medical Biochemistry and Microbiology, Uppsala, Sweden GMM 3, 30 Aug--2 Sep, Oslo, Norway Acknowledgements:
Design of an Enterobacteriaceae Pan-genome Microarray Chip
 Design of an Enterobacteriaceae Pan-genome Microarray Chip Oksana Lukjancenko and David W. Ussery DTU CBS 2010 2 Background Pan-genome complete collection of variuos genes located within populations at
Checking Consistency Between Expression Data and Large Scale Regulatory Networks: A Case Study
 Checking Consistency Between Expression Data and Large Scale Regulatory Networks: A Case Study Carito Guziolowski, Philippe Veber, Michel Le Borgne, Ovidiu Radulescu, Anne Siegel Project Symbiose - IRISA
Biology. Biology. Slide 1 of 26. End Show. Copyright Pearson Prentice Hall
 Biology Biology 1 of 26 Fruit fly chromosome 12-5 Gene Regulation Mouse chromosomes Fruit fly embryo Mouse embryo Adult fruit fly Adult mouse 2 of 26 Gene Regulation: An Example Gene Regulation: An Example
Welcome to Class 21!
 Welcome to Class 21! Introductory Biochemistry! Lecture 21: Outline and Objectives l Regulation of Gene Expression in Prokaryotes! l transcriptional regulation! l principles! l lac operon! l trp attenuation!
BMD645. Integration of Omics
 BMD645 Integration of Omics Shu-Jen Chen, Chang Gung University Dec. 11, 2009 1 Traditional Biology vs. Systems Biology Traditional biology : Single genes or proteins Systems biology: Simultaneously study
JMJ14-HA. Col. Col. jmj14-1. jmj14-1 JMJ14ΔFYR-HA. Methylene Blue. Methylene Blue
 Fig. S1 JMJ14 JMJ14 JMJ14ΔFYR Methylene Blue Col jmj14-1 JMJ14-HA Methylene Blue Col jmj14-1 JMJ14ΔFYR-HA Fig. S1. The expression level of JMJ14 and truncated JMJ14 with FYR (FYRN + FYRC) domain deletion
Gene regulation II Biochemistry 302. February 27, 2006
 Gene regulation II Biochemistry 302 February 27, 2006 Molecular basis of inhibition of RNAP by Lac repressor 35 promoter site 10 promoter site CRP/DNA complex 60 Lewis, M. et al. (1996) Science 271:1247
CONJOINT 541. Translating a Transcriptome at Specific Times and Places. David Morris. Department of Biochemistry
 CONJOINT 541 Translating a Transcriptome at Specific Times and Places David Morris Department of Biochemistry http://faculty.washington.edu/dmorris/ Lecture 1 The Biology and Experimental Analysis of mrna
Supplemental Information
 Molecular Cell, Volume 52 Supplemental Information The Translational Landscape of the Mammalian Cell Cycle Craig R. Stumpf, Melissa V. Moreno, Adam B. Olshen, Barry S. Taylor, and Davide Ruggero Supplemental
Complete all warm up questions Focus on operon functioning we will be creating operon models on Monday
 Complete all warm up questions Focus on operon functioning we will be creating operon models on Monday 1. What is the Central Dogma? 2. How does prokaryotic DNA compare to eukaryotic DNA? 3. How is DNA
(starvation). Description a. Predicted operon members b. Gene no. a. Relative change in expression (n-fold) mutant vs. wild type.
. Description a. Predicted operon members b. Gene no. a. Relative change in expression (n-fold) mutant vs. wild type.") 1 Table S1. Genes whose expression differ in the phyr mutant 8402 and/or in the ecfg mutant 8404 compared with the wild type when grown to the mid-exponential phase (OD600 0.5-0.7) in rich medium (PSY)
1 Table S1. Genes whose expression differ in the phyr mutant 8402 and/or in the ecfg mutant 8404 compared with the wild type when grown to the mid-exponential phase (OD600 0.5-0.7) in rich medium (PSY)
Gene regulation I Biochemistry 302. Bob Kelm February 25, 2005
 Gene regulation I Biochemistry 302 Bob Kelm February 25, 2005 Principles of gene regulation (cellular versus molecular level) Extracellular signals Chemical (e.g. hormones, growth factors) Environmental
L3.1: Circuits: Introduction to Transcription Networks. Cellular Design Principles Prof. Jenna Rickus
 L3.1: Circuits: Introduction to Transcription Networks Cellular Design Principles Prof. Jenna Rickus In this lecture Cognitive problem of the Cell Introduce transcription networks Key processing network
Gene expression in prokaryotic and eukaryotic cells, Plasmids: types, maintenance and functions. Mitesh Shrestha
 Gene expression in prokaryotic and eukaryotic cells, Plasmids: types, maintenance and functions. Mitesh Shrestha Plasmids 1. Extrachromosomal DNA, usually circular-parasite 2. Usually encode ancillary
Introduction to Bioinformatics
 CSCI8980: Applied Machine Learning in Computational Biology Introduction to Bioinformatics Rui Kuang Department of Computer Science and Engineering University of Minnesota kuang@cs.umn.edu History of Bioinformatics
Genomics and bioinformatics summary. Finding genes -- computer searches
 Genomics and bioinformatics summary 1. Gene finding: computer searches, cdnas, ESTs, 2. Microarrays 3. Use BLAST to find homologous sequences 4. Multiple sequence alignments (MSAs) 5. Trees quantify sequence
RNA Synthesis and Processing
 RNA Synthesis and Processing Introduction Regulation of gene expression allows cells to adapt to environmental changes and is responsible for the distinct activities of the differentiated cell types that
Supplemental Materials
 JOURNAL OF MICROBIOLOGY & BIOLOGY EDUCATION, May 2013, p. 107-109 DOI: http://dx.doi.org/10.1128/jmbe.v14i1.496 Supplemental Materials for Engaging Students in a Bioinformatics Activity to Introduce Gene
Supplementary Material. Overexpression of a cytochrome P450 and a UDP-glycosyltransferase is associated with
 Supplementary Material Overexpression of a cytochrome P450 and a UDP-glycosyltransferase is associated with imidacloprid resistance in the Colorado potato beetle, Leptinotarsa decemlineata Emine Kaplanoglu
SUPPLEMENTARY INFORMATION
 reverse 3175 3175 F L C 318 318 3185 3185 319 319 3195 3195 315 8 1 315 3155 315 317 Supplementary Figure 3. Stability of expression of the GFP sensor constructs return to warm conditions. Semi-quantitative
Motifs and Logos. Six Introduction to Bioinformatics. Importance and Abundance of Motifs. Getting the CDS. From DNA to Protein 6.1.
 Motifs and Logos Six Discovering Genomics, Proteomics, and Bioinformatics by A. Malcolm Campbell and Laurie J. Heyer Chapter 2 Genome Sequence Acquisition and Analysis Sami Khuri Department of Computer
Supplemental Material
 Supplemental Material S1. Alignment of promoter sequences Figure S1 shows the alignment of the promoter regions of the E. coli wild isolates sequenced. Figure S1. Promoter alignment of the sequenced strains.
RNA Polymerase I Contains a TFIIF-Related DNA-Binding Subcomplex
 Molecular Cell, Volume 39 Supplemental Information RNA Polymerase I Contains a TFIIFRelated DNABinding Subcomplex Sebastian R. Geiger, Kristina Lorenzen, Amelie Schreieck, Patrizia Hanecker, Dirk Kostrewa,
BME 5742 Biosystems Modeling and Control
 BME 5742 Biosystems Modeling and Control Lecture 24 Unregulated Gene Expression Model Dr. Zvi Roth (FAU) 1 The genetic material inside a cell, encoded in its DNA, governs the response of a cell to various
Chapter 15 Active Reading Guide Regulation of Gene Expression
 Name: AP Biology Mr. Croft Chapter 15 Active Reading Guide Regulation of Gene Expression The overview for Chapter 15 introduces the idea that while all cells of an organism have all genes in the genome,
The Research Plan. Functional Genomics Research Stream. Transcription Factors. Tuning In Is A Good Idea
 Functional Genomics Research Stream The Research Plan Tuning In Is A Good Idea Research Meeting: March 23, 2010 The Road to Publication Transcription Factors Protein that binds specific DNA sequences controlling
Proteomics. Areas of Interest
 Introduction to BioMEMS & Medical Microdevices Proteomics and Protein Microarrays Companion lecture to the textbook: Fundamentals of BioMEMS and Medical Microdevices, by Prof., http://saliterman.umn.edu/
Supplemental Data. Hou et al. (2016). Plant Cell /tpc
. Plant Cell /tpc") Supplemental Data. Hou et al. (216). Plant Cell 1.115/tpc.16.295 A Distance to 1 st nt of start codon Distance to 1 st nt of stop codon B Normalized PARE abundance 8 14 nt 17 nt Frame1 Arabidopsis inflorescence
Supplemental Data. Hou et al. (216). Plant Cell 1.115/tpc.16.295 A Distance to 1 st nt of start codon Distance to 1 st nt of stop codon B Normalized PARE abundance 8 14 nt 17 nt Frame1 Arabidopsis inflorescence
Supplemental Table 1. Primers used for cloning and PCR amplification in this study
 Supplemental Table 1. Primers used for cloning and PCR amplification in this study Target Gene Primer sequence NATA1 (At2g393) forward GGG GAC AAG TTT GTA CAA AAA AGC AGG CTT CAT GGC GCC TCC AAC CGC AGC
Computational Biology: Basics & Interesting Problems
 Computational Biology: Basics & Interesting Problems Summary Sources of information Biological concepts: structure & terminology Sequencing Gene finding Protein structure prediction Sources of information
What is the central dogma of biology?
 Bellringer What is the central dogma of biology? A. RNA DNA Protein B. DNA Protein Gene C. DNA Gene RNA D. DNA RNA Protein Review of DNA processes Replication (7.1) Transcription(7.2) Translation(7.3)
MiGA: The Microbial Genome Atlas
 December 12 th 2017 MiGA: The Microbial Genome Atlas Jim Cole Center for Microbial Ecology Dept. of Plant, Soil & Microbial Sciences Michigan State University East Lansing, Michigan U.S.A. Where I m From
Translation Part 2 of Protein Synthesis
 Translation Part 2 of Protein Synthesis IN: How is transcription like making a jello mold? (be specific) What process does this diagram represent? A. Mutation B. Replication C.Transcription D.Translation
SoyBase, the USDA-ARS Soybean Genetics and Genomics Database
 SoyBase, the USDA-ARS Soybean Genetics and Genomics Database David Grant Victoria Carollo Blake Steven B. Cannon Kevin Feeley Rex T. Nelson Nathan Weeks SoyBase Site Map and Navigation Video Tutorials:
(Lys), resulting in translation of a polypeptide without the Lys amino acid. resulting in translation of a polypeptide without the Lys amino acid.
, resulting in translation of a polypeptide without the Lys amino acid. resulting in translation of a polypeptide without the Lys amino acid.") 1. A change that makes a polypeptide defective has been discovered in its amino acid sequence. The normal and defective amino acid sequences are shown below. Researchers are attempting to reproduce the
1. A change that makes a polypeptide defective has been discovered in its amino acid sequence. The normal and defective amino acid sequences are shown below. Researchers are attempting to reproduce the
SUPPLEMENTARY INFORMATION
 doi:10.1038/nature10244 a O07391_MYCAV/127-243 NLPC_HAEIN/80-181 SPR_SHIFL/79-183 P74160_SYNY3/112-245 O24914_HELPY/301-437 Q51835_PORGI/68-178 DPP6_BACSH/163-263 YKFC_BACSU/185-292 YDHO_ECOLI/153-263
A DNA Sequence 2017/12/6 1
 A DNA Sequence ccgtacgtacgtagagtgctagtctagtcgtagcgccgtagtcgatcgtgtgg gtagtagctgatatgatgcgaggtaggggataggatagcaacagatgagc ggatgctgagtgcagtggcatgcgatgtcgatgatagcggtaggtagacttc gcgcataaagctgcgcgagatgattgcaaagragttagatgagctgatgcta
Topic 4 - #14 The Lactose Operon
 Topic 4 - #14 The Lactose Operon The Lactose Operon The lactose operon is an operon which is responsible for the transport and metabolism of the sugar lactose in E. coli. - Lactose is one of many organic
Computational Genomics. Reconstructing dynamic regulatory networks in multiple species
 02-710 Computational Genomics Reconstructing dynamic regulatory networks in multiple species Methods for reconstructing networks in cells CRH1 SLT2 SLR3 YPS3 YPS1 Amit et al Science 2009 Pe er et al Recomb
Introduction to Bioinformatics. Shifra Ben-Dor Irit Orr
 Introduction to Bioinformatics Shifra Ben-Dor Irit Orr Lecture Outline: Technical Course Items Introduction to Bioinformatics Introduction to Databases This week and next week What is bioinformatics? A
BLAST. Varieties of BLAST
 BLAST Basic Local Alignment Search Tool (1990) Altschul, Gish, Miller, Myers, & Lipman Uses short-cuts or heuristics to improve search speed Like speed-reading, does not examine every nucleotide of database
10-810: Advanced Algorithms and Models for Computational Biology. microrna and Whole Genome Comparison
 10-810: Advanced Algorithms and Models for Computational Biology microrna and Whole Genome Comparison Central Dogma: 90s Transcription factors DNA transcription mrna translation Proteins Central Dogma:
Introduction. Summary. genetic strategies of survival and cellular adaptation to the environment used by Salmonella.
 Molecular Microbiology(2014) doi:10.1111/mmi.12610 The Salmonella enterica serovar Typhi ltrr-ompr-ompc-ompf genes are involved in resistance to the bile salt sodium deoxycholate and in bacterial transformation
Introduction. Gene expression is the combined process of :
 1 To know and explain: Regulation of Bacterial Gene Expression Constitutive ( house keeping) vs. Controllable genes OPERON structure and its role in gene regulation Regulation of Eukaryotic Gene Expression
Supplemental Data. Perea-Resa et al. Plant Cell. (2012) /tpc
 /tpc") Supplemental Data. Perea-Resa et al. Plant Cell. (22)..5/tpc.2.3697 Sm Sm2 Supplemental Figure. Sequence alignment of Arabidopsis LSM proteins. Alignment of the eleven Arabidopsis LSM proteins. Sm and
Supplemental Data. Perea-Resa et al. Plant Cell. (22)..5/tpc.2.3697 Sm Sm2 Supplemental Figure. Sequence alignment of Arabidopsis LSM proteins. Alignment of the eleven Arabidopsis LSM proteins. Sm and
Name: SBI 4U. Gene Expression Quiz. Overall Expectation:
 Gene Expression Quiz Overall Expectation: - Demonstrate an understanding of concepts related to molecular genetics, and how genetic modification is applied in industry and agriculture Specific Expectation(s):
The geneticist s questions. Deleting yeast genes. Functional genomics. From Wikipedia, the free encyclopedia
 From Wikipedia, the free encyclopedia Functional genomics..is a field of molecular biology that attempts to make use of the vast wealth of data produced by genomic projects (such as genome sequencing projects)
Bio 119 Bacterial Genomics 6/26/10
 BACTERIAL GENOMICS Reading in BOM-12: Sec. 11.1 Genetic Map of the E. coli Chromosome p. 279 Sec. 13.2 Prokaryotic Genomes: Sizes and ORF Contents p. 344 Sec. 13.3 Prokaryotic Genomes: Bioinformatic Analysis
Regulation of Gene Expression at the level of Transcription
 Regulation of Gene Expression at the level of Transcription (examples are mostly bacterial) Diarmaid Hughes ICM/Microbiology VT2009 Regulation of Gene Expression at the level of Transcription (examples
GCD3033:Cell Biology. Transcription
 Transcription Transcription: DNA to RNA A) production of complementary strand of DNA B) RNA types C) transcription start/stop signals D) Initiation of eukaryotic gene expression E) transcription factors
REGULATION OF GENE EXPRESSION. Bacterial Genetics Lac and Trp Operon
 REGULATION OF GENE EXPRESSION Bacterial Genetics Lac and Trp Operon Levels of Metabolic Control The amount of cellular products can be controlled by regulating: Enzyme activity: alters protein function
Comparative RNA-seq analysis of transcriptome dynamics during petal development in Rosa chinensis
 Title Comparative RNA-seq analysis of transcriptome dynamics during petal development in Rosa chinensis Author list Yu Han 1, Huihua Wan 1, Tangren Cheng 1, Jia Wang 1, Weiru Yang 1, Huitang Pan 1* & Qixiang
Chapter 20. Initiation of transcription. Eukaryotic transcription initiation
 Chapter 20. Initiation of transcription Eukaryotic transcription initiation 2003. 5.22 Prokaryotic vs eukaryotic Bacteria = one RNA polymerase Eukaryotes have three RNA polymerases (I, II, and III) in
3.B.1 Gene Regulation. Gene regulation results in differential gene expression, leading to cell specialization.
 3.B.1 Gene Regulation Gene regulation results in differential gene expression, leading to cell specialization. We will focus on gene regulation in prokaryotes first. Gene regulation accounts for some of
UNIT 6 PART 3 *REGULATION USING OPERONS* Hillis Textbook, CH 11
 UNIT 6 PART 3 *REGULATION USING OPERONS* Hillis Textbook, CH 11 REVIEW: Signals that Start and Stop Transcription and Translation BUT, HOW DO CELLS CONTROL WHICH GENES ARE EXPRESSED AND WHEN? First of
Phylogenetic Gibbs Recursive Sampler. Locating Transcription Factor Binding Sites
 A for Locating Transcription Factor Binding Sites Sean P. Conlan 1 Lee Ann McCue 2 1,3 Thomas M. Smith 3 William Thompson 4 Charles E. Lawrence 4 1 Wadsworth Center, New York State Department of Health
Topic 4: Equilibrium binding and chemical kinetics
 Topic 4: Equilibrium binding and chemical kinetics Outline: Applications, applications, applications use Boltzmann to look at receptor-ligand binding use Boltzmann to look at PolII-DNA binding and gene
12-5 Gene Regulation
 12-5 Gene Regulation Fruit fly chromosome 12-5 Gene Regulation Mouse chromosomes Fruit fly embryo Mouse embryo Adult fruit fly Adult mouse 1 of 26 12-5 Gene Regulation Gene Regulation: An Example Gene
Biological Roles of Cytokinins
 Direct Control of Shoot Meristem Activity by a Cytokinin-Activating Enzyme By Kurakawa et. Al. Published in Nature Presented by Boyana Grigorova Biological Roles of Cytokinins Cytokinins are positive regulators
Supplementary Materials for
 www.advances.sciencemag.org/cgi/content/full/1/5/e1500358/dc1 Supplementary Materials for Transplantability of a circadian clock to a noncircadian organism Anna H. Chen, David Lubkowicz, Vivian Yeong,
How much non-coding DNA do eukaryotes require?
 How much non-coding DNA do eukaryotes require? Andrei Zinovyev UMR U900 Computational Systems Biology of Cancer Institute Curie/INSERM/Ecole de Mine Paritech Dr. Sebastian Ahnert Dr. Thomas Fink Bioinformatics
Exhaustive search. CS 466 Saurabh Sinha
 Exhaustive search CS 466 Saurabh Sinha Agenda Two different problems Restriction mapping Motif finding Common theme: exhaustive search of solution space Reading: Chapter 4. Restriction Mapping Restriction
Chapter 12. Genes: Expression and Regulation
 Chapter 12 Genes: Expression and Regulation 1 DNA Transcription or RNA Synthesis produces three types of RNA trna carries amino acids during protein synthesis rrna component of ribosomes mrna directs protein
Discovering molecular pathways from protein interaction and ge
 Discovering molecular pathways from protein interaction and gene expression data 9-4-2008 Aim To have a mechanism for inferring pathways from gene expression and protein interaction data. Motivation Why
2. Yeast two-hybrid system
 2. Yeast two-hybrid system I. Process workflow a. Mating of haploid two-hybrid strains on YPD plates b. Replica-plating of diploids on selective plates c. Two-hydrid experiment plating on selective plates
Unit 3: Control and regulation Higher Biology
 Unit 3: Control and regulation Higher Biology To study the roles that genes play in the control of growth and development of organisms To be able to Give some examples of features which are controlled
Предсказание и анализ промотерных последовательностей. Татьяна Татаринова
 Предсказание и анализ промотерных последовательностей Татьяна Татаринова Eukaryotic Transcription 2 Initiation Promoter: the DNA sequence that initially binds the RNA polymerase The structure of promoter-polymerase
Supplementary Information. Drought response transcriptomics are altered in poplar with reduced tonoplast sucrose transporter expression
 Supplementary Information Drought response transcriptomics are altered in poplar with reduced tonoplast sucrose transporter expression Liang Jiao Xue, Christopher J. Frost, Chung Jui Tsai, Scott A. Harding
Control of Gene Expression in Prokaryotes
 Why? Control of Expression in Prokaryotes How do prokaryotes use operons to control gene expression? Houses usually have a light source in every room, but it would be a waste of energy to leave every light
1. In most cases, genes code for and it is that
 Name Chapter 10 Reading Guide From DNA to Protein: Gene Expression Concept 10.1 Genetics Shows That Genes Code for Proteins 1. In most cases, genes code for and it is that determine. 2. Describe what Garrod
2. Mathematical descriptions. (i) the master equation (ii) Langevin theory. 3. Single cell measurements
 the master equation (ii) Langevin theory. 3. Single cell measurements") 1. Why stochastic?. Mathematical descriptions (i) the master equation (ii) Langevin theory 3. Single cell measurements 4. Consequences Any chemical reaction is stochastic. k P d φ dp dt = k d P deterministic
1. Why stochastic?. Mathematical descriptions (i) the master equation (ii) Langevin theory 3. Single cell measurements 4. Consequences Any chemical reaction is stochastic. k P d φ dp dt = k d P deterministic
Supplementary Information. Characteristics of Long Non-coding RNAs in the Brown Norway Rat and. Alterations in the Dahl Salt-Sensitive Rat
 Supplementary Information Characteristics of Long Non-coding RNAs in the Brown Norway Rat and Alterations in the Dahl Salt-Sensitive Rat Feng Wang 1,2,3,*, Liping Li 5,*, Haiming Xu 5, Yong Liu 2,3, Chun
BLAST Database Searching. BME 110: CompBio Tools Todd Lowe April 8, 2010
 BLAST Database Searching BME 110: CompBio Tools Todd Lowe April 8, 2010 Admin Reading: Read chapter 7, and the NCBI Blast Guide and tutorial http://www.ncbi.nlm.nih.gov/blast/why.shtml Read Chapter 8 for
Supplemental Materials Molecular Biology of the Cell
 Supplemental Materials Molecular iology of the Cell Figure S1 Krüger et al. Arabidopsis Plasmodium H. sapiens* 1) Xenopus* 1) Drosophila C.elegans S.cerevisae S.pombe L.major T.cruzi T.brucei DCP5 CITH
Microbiome: 16S rrna Sequencing 3/30/2018
 Microbiome: 16S rrna Sequencing 3/30/2018 Skills from Previous Lectures Central Dogma of Biology Lecture 3: Genetics and Genomics Lecture 4: Microarrays Lecture 12: ChIP-Seq Phylogenetics Lecture 13: Phylogenetics
Written Exam 15 December Course name: Introduction to Systems Biology Course no
 Technical University of Denmark Written Exam 15 December 2008 Course name: Introduction to Systems Biology Course no. 27041 Aids allowed: Open book exam Provide your answers and calculations on separate
Regulation of gene expression. Premedical - Biology
 Regulation of gene expression Premedical - Biology Regulation of gene expression in prokaryotic cell Operon units system of negative feedback positive and negative regulation in eukaryotic cell - at any
The Developmental Transcriptome of the Mosquito Aedes aegypti, an invasive species and major arbovirus vector.
 The Developmental Transcriptome of the Mosquito Aedes aegypti, an invasive species and major arbovirus vector. Omar S. Akbari*, Igor Antoshechkin*, Henry Amrhein, Brian Williams, Race Diloreto, Jeremy
Technologie w skali genomowej 2/ Algorytmiczne i statystyczne aspekty sekwencjonowania DNA
 Technologie w skali genomowej 2/ Algorytmiczne i statystyczne aspekty sekwencjonowania DNA Expression analysis for RNA-seq data Ewa Szczurek Instytut Informatyki Uniwersytet Warszawski 1/35 The problem
Meiothermus ruber Genome Analysis Project
 Augustana College Augustana Digital Commons Meiothermus ruber Genome Analysis Project Biology 2018 Predicted ortholog pairs between E. coli and M. ruber are b3456 and mrub_2379, b3457 and mrub_2378, b3456
ChIP-seq analysis M. Defrance, C. Herrmann, S. Le Gras, D. Puthier, M. Thomas.Chollier
 ChIP-seq analysis M. Defrance, C. Herrmann, S. Le Gras, D. Puthier, M. Thomas.Chollier Data visualization, quality control, normalization & peak calling Peak annotation Presentation () Practical session
15.2 Prokaryotic Transcription *
 OpenStax-CNX module: m52697 1 15.2 Prokaryotic Transcription * Shannon McDermott Based on Prokaryotic Transcription by OpenStax This work is produced by OpenStax-CNX and licensed under the Creative Commons
Lecture 7: Simple genetic circuits I
 Lecture 7: Simple genetic circuits I Paul C Bressloff (Fall 2018) 7.1 Transcription and translation In Fig. 20 we show the two main stages in the expression of a single gene according to the central dogma.
RGP finder: prediction of Genomic Islands
 Training courses on MicroScope platform RGP finder: prediction of Genomic Islands Dynamics of bacterial genomes Gene gain Horizontal gene transfer Gene loss Deletion of one or several genes Duplication
Tiffany Samaroo MB&B 452a December 8, Take Home Final. Topic 1
 Tiffany Samaroo MB&B 452a December 8, 2003 Take Home Final Topic 1 Prior to 1970, protein and DNA sequence alignment was limited to visual comparison. This was a very tedious process; even proteins with
Genome Assembly. Sequencing Output. High Throughput Sequencing
 Genome High Throughput Sequencing Sequencing Output Example applications: Sequencing a genome (DNA) Sequencing a transcriptome and gene expression studies (RNA) ChIP (chromatin immunoprecipitation) Example
Browsing Genomic Information with Ensembl Plants
 Browsing Genomic Information with Ensembl Plants Etienne de Villiers, PhD (Adapted from slides by Bert Overduin EMBL-EBI) Outline of workshop Brief introduction to Ensembl Plants History Content Tutorial
Types of biological networks. I. Intra-cellurar networks
 Types of biological networks I. Intra-cellurar networks 1 Some intra-cellular networks: 1. Metabolic networks 2. Transcriptional regulation networks 3. Cell signalling networks 4. Protein-protein interaction
BIOINFORMATICS LAB AP BIOLOGY
 BIOINFORMATICS LAB AP BIOLOGY Bioinformatics is the science of collecting and analyzing complex biological data. Bioinformatics combines computer science, statistics and biology to allow scientists to
Characterisation of abiotic stress inducible plant promoters and bacterial genes for osmotolerance using transgenic approach
 Characterisation of abiotic stress inducible plant promoters and bacterial genes for osmotolerance using transgenic approach ABSTRACT SUBMITTED TO JAMIA MILLIA ISLAMIA NEW DELHI IN PARTIAL FULFILMENT OF
Supplemental Data. Perrella et al. (2013). Plant Cell /tpc
. Plant Cell /tpc") Intensity Intensity Intensity Intensity Intensity Intensity 150 50 150 0 10 20 50 C 150 0 10 20 50 D 0 10 20 Distance (μm) 50 20 40 E 50 F 0 10 20 50 0 15 30 Distance (μm) Supplemental Figure 1: Co-localization
Intensity Intensity Intensity Intensity Intensity Intensity 150 50 150 0 10 20 50 C 150 0 10 20 50 D 0 10 20 Distance (μm) 50 20 40 E 50 F 0 10 20 50 0 15 30 Distance (μm) Supplemental Figure 1: Co-localization
Formative/Summative Assessments (Tests, Quizzes, reflective writing, Journals, Presentations)
") Biology Curriculum Map 2017-18 2 Weeks- Introduction to Biology: Scientific method, lab safety, organizing and analyzing data, and psuedoscience. This unit establishes the fundamental nature of scientific
Biology Curriculum Map 2017-18 2 Weeks- Introduction to Biology: Scientific method, lab safety, organizing and analyzing data, and psuedoscience. This unit establishes the fundamental nature of scientific