Patrick Baskfield. Scott Matteson. Minnesota Pollution Control Agency. Minnesota State University Water Resource Center
|
|
|
- Aubrey Bradley
- 6 years ago
- Views:
Transcription

1 Regression Analysis of Total Suspended Solids Concentrations to Estimate Streambank, Upland Field, and Classic Gully Sediment Contributions to Minnesota River Tributaries Patrick Baskfield Minnesota Pollution Control Agency Scott Matteson Minnesota State University Water Resource Center
2 Acknowledgements Scott Matteson High Island CWP, MNSU Water Resouce Center Paul Wymar Chippewa River CWP Watonwan River CWP Maple River CWP Scott MacLean Little Cottonwood River, Seven Mile Creek CWP s USGS Bill VanRyswyk - MDA

3 Sediment source contributions: what are the percentages? Chetomba Creek Photos courtesy of Stephanie Klamm Hawk Creek CWP


4 Sediment Sources: Streambanks and Bluffs Construction Sites Classic Gullies Urban Stormwater Agricultural Fields (includes sediment from open tile intakes)


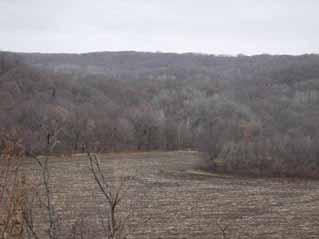
5 The Link Between Runoff Source and Sediment Source Contributions to Rivers Field Erosion Runoff Type Overland Flow


6 The Link Between Runoff Type and Sediment Source Contributions to Classic gully Erosion Runoff Sources: overland flow drainage tile, interflow Rivers Bottom of ravine 10/18/07 Top of ravine 10/18/07


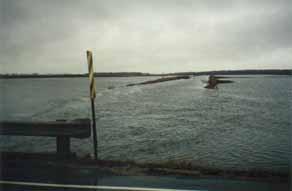
7 The Link Between Runoff Type and Sediment Source Contributions to Rivers Streambank Erosion Runoff Sources overland flow, drainage tile, groundwater, interflow Maple River Lower Monitoring Site


8 TSS Streambank Erosion Regression Method Example: Maple River Watershed slope Map courtesy of Eileen Campbell - MPCA Map courtesy of Scott Matteson MNSU Water Resource Center

9 Sampling Frequency
10 TSS Streambank Erosion Regression Method Hypothesis Lower Maple River Stream Bank Erosion Regression Samples Total Suspended Solids (mg/l) y = 0.081x R 2 = N Non-SBE TSS Samples SBE TSS samples Linear (SBE TSS samples) Discharge (cfs)
11 Step 1: Select Samples For SBE Regression Sample Discharge Example: Samples used in the 600 to 900 cfs sample category: 21 samples in entire sample set, 4 used in the SBE regression (19%) Discharge Range of Sample Categories Lower Maple River cfs Flow TSS 4/22/ /6/ /23/ /27/ /09/04 Each sample category 111contains approximately 3/29/ % of the total number 115 of water quality /4/2005 samples collected 134 from (247 samples) 06/15/ /03/ /12/ From each sample category approximately 08/06/ % of the samples 282 with the lowest TSS 5/12/2005 concentrations are 330 used in the stream bank /31/2005 erosion regression /12/ /11/ /10/ /21/ Example category /30/ cfs /21/ /12/ /09/ Note- sub-samples selected represent 0% 9% the 16% full range 24% of flows 31% in 40% this category 47% 55% 62% 71% 78% 85% 93% Cumulative Percentage of Total Number of Samples 4037
12 Step 2: Create SBE Regression Stream Bank Erosion Regression Lower Maple River Total Suspended Solids (mg/l) y = 0.081x R 2 = TSS (mg/l) Linear (TSS (mg/l)) Discharge (cfs)
13 5000 Stream Bank Erosion Regression Samples and Daily Average Discharge Lower Maple River 4500 Daily Average Discharge (cfs) Flow SBE Samples /14/ /01/ /17/ /05/ /24/ /10/ /28/ /14/2007 Date
14 Step 2: Compute Daily Streambank 1000 Erosion (SBE) Loads Total Suspended Solids (mg/l) With a Daily Average Discharge of 100 cfs, the estimated SBE TSS concenetration using this regression would be 16.8 mg/l. The Daily TSS load from stream bank erosion is estimated to be 4114 kg (load = concentration x flow) 16.8 mg/l y = 0.081x R 2 = TSS (mg/l) Linear (TSS (mg/l)) Discharge (cfs) Daily Average Flow x SBE TSS Concentration = Daily SBE Load
15 Step 3: Compute Seasonal Streambank Erosion Load (generally 4/1 through 9/30) Sum of Daily SBE loads = Seasonal SBE load
16 Step 4: Compute the Streambank Erosion Proportion of Seasonal TSS Loads Lower Maple River Streambak Erosion Contribution Year Seasonal TSS Load (tons) Seasonal Stream Bank Erosion TSS Load (tons) % of Seasonal TSS Load from Stream Bank Erosion % % % % % Numeric 5 year average SBE contribution 40%
17 Percentage of Seasonal TSS Loads from Streambank Erosion Using TSS Flow Weighted Mean Concentrations Year Lower Maple River Streambak Erosion Contributions monitoring season dates Lower Maple Seasonal TSS FWMC Lower Maple Stream Bank Erosion TSS FWMC % of TSS load from Streambank Erosion /24-10/ % /21-10/ % /1-10/ % /31-10/ % /20-10/ % Numeric 5 year average SBE contribution 40%
18 Summary Table Average Streambank Erosion Proportion of Seasonal TSS Loads by Watershed Watershed Data Years Average streambank erosion proportion of seasonal TSS load Watonwan R. 7 41% High Island Cr. 5 31% Little Cottonwood R. 7 20% Chippewa R. 8 38% 7 Mile Cr. 8 20% Maple River 5 40%

19 Computing Field and Classic gully TSS Load Proportions Upper Maple River Site
20 Upper Maple River SBE Regression 500 Total Suspended Solids Concentration (mg/l) y = x R 2 = Discharge (cfs) Non - SBE TSS SBE TSS Samples Linear (SBE TSS Samples)
21 Streambank Erosion Proportion of Seasonal TSS Load by Year Upper Maple River Year Upper Maple River - TSS Source Contributions Seasonal TSS FWMC. Streambank Erosion TSS FWMC Field Erosion TSS FWMC % of Seasonal TSS Load from SBE % of TSS Load from Field Erosion % 48.1% % 57.2% Two Year numeric Average SBE contribution 47%
22 Year Upper Maple River - TSS Source Contributions Seasonal TSS FWMC. Streambank Erosion TSS FWMC Field Erosion TSS FWMC % of Seasonal TSS Load from SBE % of TSS Load from Field Erosion % 48.1% % 57.2% Two Year numeric Average SBE contribution 47%
23 TSS Load Source Proportions for the Lower Maple River Year Lower Maple Seasonal TSS FWMC Lower Maple River Source Contributions Lower Maple SBE TSS FWMC Field Erosion TSS FWMC (computed from Upper Maple site) % of TSS load from SBE % of TSS load from Field Erosion % of TSS load from Classic Gulleys % % % % 17.5% 9.3% % 20.6% 33.5%
24 Caveats and Criticisms Streambank Erosion from ice Rainfall on streambanks is not included Ephemeral gully erosion from tile outlets is included in the SBE calculation Too many samples: over-predicting SBE contributions More SBE occurs when flows are rising
25 Conclusions For the analyzed watersheds, on average no more than 40% of TSS load can be from SBE SBE proportions are variable from year to year: climate, timing of events affect TSS source contributions When field and gully erosion are the dominant sediment sources, streams are the dirtiest In some watersheds all major sediment source contributions can be determined with this method.
26 Daily Rainfall 2006 Lower and Upper Maple River Monitoring sites Red bars are the Lower Maple 1.5
27 minute rainfall intensities and discharge at the Lower Maple site. During the early April rains (the two big events at the beginning of this hydrograph), the maximum one hour rainfall intensity was about 0.25 /hr. The maximum value on the scale is 0.5. Note how little influence large intense rains have on these systems after crop canopies close. 0.1

28 Streambank/Bluff Erosion Estimates for High Island Creek Watershed High Island Creek Watershed Rush River Watershed

29 Percentage of Land with Slopes Greater than 12% by Watershed

30 Site 5P Site 10P

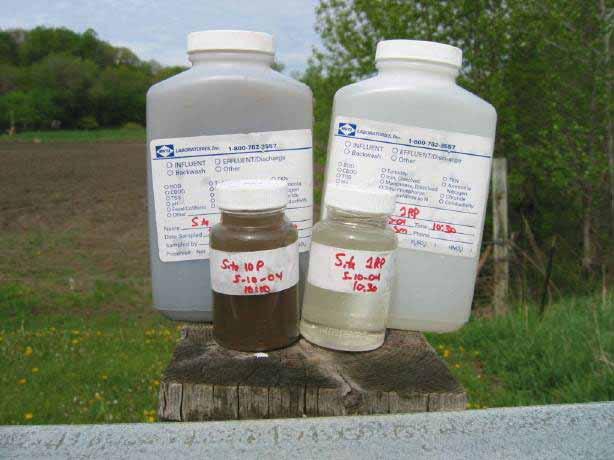
31 Site 5P Site 10P
32 Discharge (cfs) 2002 High Island Creek Daily Average Discharge and Total Suspended Solids Concentrations fold difference fold difference % of the TSS at a higher flow /30 4/19 5/9 5/29 6/18 7/8 7/28 8/17 9/6 9/ Date 30 fold difference 4.5 times less sediment at a higher flow Flow smpl collected 327

33 2001 High Island Creek Total Suspended Solids Load
low turbidity high turbidity
 What is Turbidity? Turbidity refers to how clear the water is. The greater the amount of total suspended solids (TSS) in the water, the murkier it appears and the higher the measured turbidity. Excessive
the path to studying tile drainage
 Fingerprinting Sources of Suspended Sediments Mean 210 Pb Flux (pci/cm 2 /yr) 2.5 2 1.5 1 0.5 Sagatagan Kreighle Henderson George Long Diamond Duck Stahl Reference Lakes y = 0.65 + 4.8x R 2 = 0.58 Hook
Minnesota River Turbidity Stakeholder Committee New Ulm Library, August 27, 20090
 Identifying sediment sources in the Minnesota River Basin Peter Wilcock Dept of Geography & Environmental Engineering National Center for Earth Surface Dynamics Johns Hopkins University Minnesota River
Modeling Upland and Channel Sources of Sediment in the Le Sueur River Watershed, Minnesota
 Modeling Upland and Channel Sources of Sediment in the Le Sueur River Watershed, Minnesota Solomon Folle and David Mulla Department of Soil, Water and Climate University of Minnesota August 6, 2009 5 th
Overview of fluvial and geotechnical processes for TMDL assessment
 Overview of fluvial and geotechnical processes for TMDL assessment Christian F Lenhart, Assistant Prof, MSU Research Assoc., U of M Biosystems Engineering Fluvial processes in a glaciated landscape Martin
5/4/2017 Fountain Creek. Gage Analysis. Homework 6. Clifton, Cundiff, Pour, Queen, and Zey CIVE 717
 5/4/2017 Fountain Creek Gage Analysis Homework 6 Clifton, Cundiff, Pour, Queen, and Zey CIVE 717 Introduction: The CIVE 717 class members, Nate Clifton, Susan Cundiff, Ali Reza Nowrooz Pour, Robbie Queen
Science of Natural Disasters: RIVERS& FLOODS! 27 April 2016
 Science of Natural Disasters: RIVERS& FLOODS! 27 April 2016 Rebecca Clotts Department of Geology, University of St Thomas Flood in St Paul, 2014, Star Tribune 1 2 What is a watershed? 3 4 5 6 7 What is
Disentangling Impacts of Climate & Land Use Changes on the Quantity & Quality of River Flows in Southern Ontario
 Disentangling Impacts of Climate & Land Use Changes on the Quantity & Quality of River Flows in Southern Ontario by Trevor Dickinson & Ramesh Rudra, Water Resources Engineering University of Guelph Acknowledgements
Watershed Conservation Management Planning Using the Integrated Field & Channel Technology of AnnAGNPS & CONCEPTS
 Watershed Conservation Management Planning Using the Integrated Field & Channel Technology of AnnAGNPS & CONCEPTS Eddy Langendoen Ron Bingner USDA-ARS National Sedimentation Laboratory, Oxford, Mississippi
Great Lakes Tributary Modeling: Canaseraga Creek Watershed
 Great Lakes Tributary Modeling: Canaseraga Creek Watershed SWAT Model Authority: Section 516(e) of WRDA 1996 US Army Corps of Engineers Canaseraga Creek Project Location - Encompasses portions of Livingston,
Erosion Surface Water. moving, transporting, and depositing sediment.
 + Erosion Surface Water moving, transporting, and depositing sediment. + Surface Water 2 Water from rainfall can hit Earth s surface and do a number of things: Slowly soak into the ground: Infiltration
Squaw Creek. General Information
 General Information is a tributary to the Salmon River. It enters the north side of the river about 0 miles downstream of North Fork, Idaho. The study reach is about a 30 ft length of stream about 2 miles
Application of SWAT Model to Estimate the Runoff and Sediment Load from the Right Bank Valleys of Mosul Dam Reservoir
 Application of SWAT Model to Estimate the Runoff and Sediment Load from the Right Bank Valleys of Mosul Dam Reservoir Dr Mohammad Ezeel Deen Prof. Nadhir Al-Ansari Prof Sven Knutsson Figure 1.Map of Iraq
Assessment of Streambank and Bluff Erosion in the Knife River Watershed. Final Report Submitted to Minnesota Pollution Control Agency
 Assessment of Streambank and Bluff Erosion in the Knife River Watershed Final Report Submitted to Minnesota Pollution Control Agency by John L. Nieber Bruce N. Wilson Jason S. Ulrich Bradley J. Hansen
NREM 407/507 April Jordan River today Danube on Tuesday. 2. Quiz. 3. Discuss Stream Bank Stabilization
 NREM 407/507 April 9 1. Jordan River today Danube on Tuesday 2. Quiz 3. Discuss Stream Bank Stabilization 4. Lab Tuesday bring gloves, waders if you have them & be ready to get muddy, learn & have fun.
Laboratory Exercise #3 The Hydrologic Cycle and Running Water Processes
 Laboratory Exercise #3 The Hydrologic Cycle and Running Water Processes page - 1 Section A - The Hydrologic Cycle Figure 1 illustrates the hydrologic cycle which quantifies how water is cycled throughout
Chris Lenhart, John Nieber, Ann Lewandowski, Jason Ulrich TOOLS AND STRATEGIES FOR REDUCING CHANNEL EROSION IN MINNESOTA
 Chris Lenhart, John Nieber, Ann Lewandowski, Jason Ulrich TOOLS AND STRATEGIES FOR REDUCING CHANNEL EROSION IN MINNESOTA Background and approach Channel loading major source of sediment in much of MN River
Understanding the effects of roads in upland settings on hydrology, geomorphology and water quality
 Understanding the effects of roads in upland settings on hydrology, geomorphology and water quality Beverley Wemple Department of Geography and Rubenstein School of Environment & Natural Resources The
Geog Lecture 19
 Geog 1000 - Lecture 19 Fluvial Geomorphology and River Systems http://scholar.ulethbridge.ca/chasmer/classes/ Today s Lecture (Pgs 346 355) 1. What is Fluvial Geomorphology? 2. Hydrology and the Water
Technical Memorandum No Sediment Model
 Pajaro River Watershed Study in association with Technical Memorandum No. 1.2.9 Sediment Model Task: Development of Sediment Model To: PRWFPA Staff Working Group Prepared by: Gregory Morris and Elsie Parrilla
Typical Hydrologic Period Report (Final)
") (DELCORA) (Final) November 2015 (Updated April 2016) CSO Long-Term Control Plant Update REVISION CONTROL REV. NO. DATE ISSUED PREPARED BY DESCRIPTION OF CHANGES 1 4/26/16 Greeley and Hansen Pg. 1-3,
(DELCORA) (Final) November 2015 (Updated April 2016) CSO Long-Term Control Plant Update REVISION CONTROL REV. NO. DATE ISSUED PREPARED BY DESCRIPTION OF CHANGES 1 4/26/16 Greeley and Hansen Pg. 1-3,
Near Real-Time Runoff Estimation Using Spatially Distributed Radar Rainfall Data. Jennifer Hadley 22 April 2003
 Near Real-Time Runoff Estimation Using Spatially Distributed Radar Rainfall Data Jennifer Hadley 22 April 2003 Introduction Water availability has become a major issue in Texas in the last several years,
Estimation of Ravine Sediment Production and Sediment Dynamics in the Lower Le Sueur River Watershed, Minnesota
 Florida International University FIU Digital Commons FIU Electronic Theses and Dissertations University Graduate School 11-12-2009 Estimation of Ravine Sediment Production and Sediment Dynamics in the
Water Quality and Water Quantity: Two sides of the Same Coin. Chris Jones
 Water Quality and Water Quantity: Two sides of the Same Coin Chris Jones Unit of the College of Engineering Director: Larry Weber 90 Graduate Students from 16 countries 61 Research Engineers and Scientists
Introduction Fluvial Processes in Small Southeastern Watersheds
 Introduction Fluvial Processes in Small Southeastern Watersheds L. Allan James Scott A. Lecce Lisa Davis Southeastern Geographer, Volume 50, Number 4, Winter 2010, pp. 393-396 (Article) Published by The
Statement of Impact and Objectives. Watershed Impacts. Watershed. Floodplain. Tumblin Creek Floodplain:
 Tumblin Creek Floodplain: Impacts Assessment and Conceptual Restoration Plan Casey A. Schmidt Statement of Impact and Objectives Urbanization has increased stormflow rate and volume and increased sediment,
Rabbit River Turbidity Total Maximum Daily Load Report (Impaired River Reach AUID )
") Rabbit River Turbidity Total Maximum Daily Load Report (Impaired River Reach AUID 09020101-502) Submitted to: U.S. Environmental Protection Agency Region 5, Chicago, Illinois Submitted by: June 2010 Table
Rabbit River Turbidity Total Maximum Daily Load Report (Impaired River Reach AUID 09020101-502) Submitted to: U.S. Environmental Protection Agency Region 5, Chicago, Illinois Submitted by: June 2010 Table
REDWOOD VALLEY SUBAREA
 Independent Science Review Panel Conceptual Model of Watershed Hydrology, Surface Water and Groundwater Interactions and Stream Ecology for the Russian River Watershed Appendices A-1 APPENDIX A A-2 REDWOOD
Fresh Water: Streams, Lakes Groundwater & Wetlands
 Fresh Water:, Lakes Groundwater & Wetlands Oct 27 Glaciers and Ice Ages Chp 13 Nov 3 Deserts and Wind and EXAM #3 Slope hydrologic cycle P = precip I = precip intercepted by veg ET = evapotranspiration
Stream Geomorphology. Leslie A. Morrissey UVM July 25, 2012
 Stream Geomorphology Leslie A. Morrissey UVM July 25, 2012 What Functions do Healthy Streams Provide? Flood mitigation Water supply Water quality Sediment storage and transport Habitat Recreation Transportation
Appendix D. Model Setup, Calibration, and Validation
 . Model Setup, Calibration, and Validation Lower Grand River Watershed TMDL January 1 1. Model Selection and Setup The Loading Simulation Program in C++ (LSPC) was selected to address the modeling needs
How Do Human Impacts and Geomorphological Responses Vary with Spatial Scale in the Streams and Rivers of the Illinois Basin?
 How Do Human Impacts and Geomorphological Responses Vary with Spatial Scale in the Streams and Rivers of the Illinois Basin? Bruce Rhoads Department of Geography University of Illinois at Urbana-Champaign
Stream Discharge and the Water Budget
 Regents Earth Science Unit 6: Water Cycle & Climate Name: Lab # Stream Discharge and the Water Budget Introduction: The United States Geological Survey (USGS) measures and publishes values for the daily
WELCOME Lake Wabukayne OPEN HOUSE
 WELCOME Lake Wabukayne Sediment Removal Project OPEN HOUSE We are here to: Update you, the community, on recent developments and activities at Lake Wabukayne Present the preferred alternative and receive
WATER ON AND UNDER GROUND. Objectives. The Hydrologic Cycle
 WATER ON AND UNDER GROUND Objectives Define and describe the hydrologic cycle. Identify the basic characteristics of streams. Define drainage basin. Describe how floods occur and what factors may make
Sediment Supply & Hydraulic Continuity: Workshop Review
 Sediment Supply & Hydraulic Continuity: Workshop Review Joe Magner, Ph.D., P.H., P.S.Sc. Minnesota Pollution Control Agency Adjunct Faculty, University of Minnesota Denudation Globally, conventional plowing
Technical Memorandum FINAL
 Technical Memorandum FINAL To: Project File A previous effort to develop and calibrate a Soil and Water Assessment Tool (SWAT) watershed model for the Cedar River basin included a limited representation
Riparian Assessment. Steps in the right direction... Drainage Basin/Watershed: Start by Thinking Big. Riparian Assessment vs.
 Riparian Assessment vs. Monitoring Riparian Assessment What is a healthy stream? Determine stream/riparian health Determine change or trend, especially in response to mgmt Classification = designation
Each basin is surrounded & defined by a drainage divide (high point from which water flows away) Channel initiation
 Channel initiation") DRAINAGE BASINS A drainage basin or watershed is defined from a downstream point, working upstream, to include all of the hillslope & channel areas which drain to that point Each basin is surrounded &
DRAINAGE BASINS A drainage basin or watershed is defined from a downstream point, working upstream, to include all of the hillslope & channel areas which drain to that point Each basin is surrounded &
ENGINEERING HYDROLOGY
 ENGINEERING HYDROLOGY Prof. Rajesh Bhagat Asst. Professor Civil Engineering Department Yeshwantrao Chavan College Of Engineering Nagpur B. E. (Civil Engg.) M. Tech. (Enviro. Engg.) GCOE, Amravati VNIT,
Watershed Processes and Modeling
 Watershed Processes and Modeling Pierre Y. Julien Hyeonsik Kim Department of Civil Engineering Colorado State University Fort Collins, Colorado Kuala Lumpur - May Objectives Brief overview of Watershed
STUDY GUIDE FOR CONTENT MASTERY. Surface Water Movement
 Surface Water SECTION 9.1 Surface Water Movement In your textbook, read about surface water and the way in which it moves sediment. Complete each statement. 1. An excessive amount of water flowing downslope
Section 4: Model Development and Application
 Section 4: Model Development and Application The hydrologic model for the Wissahickon Act 167 study was built using GIS layers of land use, hydrologic soil groups, terrain and orthophotography. Within
Measuring Streambank Erosion Bank Profiles to more Robustly Estimate Recession Rates and Calibration of the AnnAGNPS-CEAP Model
 Measuring Streambank Erosion Bank Profiles to more Robustly Estimate Recession Rates and Calibration of the AnnAGNPS-CEAP Model Clare Prestwich, P.E. 1 & W. Barry Southerland, Ph.D. 2 Water Quality and
Watershed concepts for community environmental planning
 Purpose and Objectives Watershed concepts for community environmental planning Dale Bruns, Wilkes University USDA Rural GIS Consortium May 2007 Provide background on basic concepts in watershed, stream,
3/3/2013. The hydro cycle water returns from the sea. All "toilet to tap." Introduction to Environmental Geology, 5e
 Introduction to Environmental Geology, 5e Running Water: summary in haiku form Edward A. Keller Chapter 9 Rivers and Flooding Lecture Presentation prepared by X. Mara Chen, Salisbury University The hydro
Surface Water and Stream Development
 Surface Water and Stream Development Surface Water The moment a raindrop falls to earth it begins its return to the sea. Once water reaches Earth s surface it may evaporate back into the atmosphere, soak
Influence of the timing of flood events on sediment yield in the north-western Algeria
 Calabria, 5-7 Septembre 2 4th International Workshop on Hydrological Extremes Session A : Modelling and forecast of hydrological extreme event Influence of the timing of flood events on sediment yield
7.3 Sediment Delivery Analysis
 7.3 Sediment Delivery Analysis In order to evaluate potential changes in sedimentation patterns that could occur due to impacts from the FCP and LPP alignments, sediment assessment models were constructed
Figure 0-18: Dendrogeomorphic analysis of streambank erosion and floodplain deposition (from Noe and others, 2015a)
") Appendix 9A: Stream to River During the development of the Phase 6 Watershed Model, multiple methods for determining coefficients were often attempted. In some cases, the methods are averaged or otherwise
Appendix 9A: Stream to River During the development of the Phase 6 Watershed Model, multiple methods for determining coefficients were often attempted. In some cases, the methods are averaged or otherwise
Application of an Enhanced, Fine-Scale SWAT Model to Target Land Management Practices for Maximizing Pollutant Reduction and Conservation Benefits
 Application of an Enhanced, Fine-Scale SWAT Model to Target Land Management Practices for Maximizing Pollutant Reduction and Conservation Benefits Amanda Flynn, Todd Redder, Joe DePinto, Derek Schlea Brian
12 SWAT USER S MANUAL, VERSION 98.1
 12 SWAT USER S MANUAL, VERSION 98.1 CANOPY STORAGE. Canopy storage is the water intercepted by vegetative surfaces (the canopy) where it is held and made available for evaporation. When using the curve
Stormwater Guidelines and Case Studies. CAHILL ASSOCIATES Environmental Consultants West Chester, PA (610)
") Stormwater Guidelines and Case Studies CAHILL ASSOCIATES Environmental Consultants West Chester, PA (610) 696-4150 www.thcahill.com Goals and Challenges for Manual State Stormwater Policy More Widespread
Stormwater Guidelines and Case Studies CAHILL ASSOCIATES Environmental Consultants West Chester, PA (610) 696-4150 www.thcahill.com Goals and Challenges for Manual State Stormwater Policy More Widespread
Predicting daily total phosphorus and suspended solids across Wisconsin stream reaches for impairment assessment
 Predicting daily total phosphorus and suspended solids across Wisconsin stream reaches for impairment assessment Alex Latzka & Matt Diebel AWRA WI 10 March 2017 Alexander.Latzka@wisconsin.gov Matthew.Diebel@wisconsin.gov
GEOL 1121 Earth Processes and Environments
 GEOL 1121 Earth Processes and Environments Wondwosen Seyoum Department of Geology University of Georgia e-mail: seyoum@uga.edu G/G Bldg., Rm. No. 122 Seyoum, 2015 Chapter 6 Streams and Flooding Seyoum,
Which map shows the stream drainage pattern that most likely formed on the surface of this volcano? A) B)
 B)") 1. When snow cover on the land melts, the water will most likely become surface runoff if the land surface is A) frozen B) porous C) grass covered D) unconsolidated gravel Base your answers to questions
1. When snow cover on the land melts, the water will most likely become surface runoff if the land surface is A) frozen B) porous C) grass covered D) unconsolidated gravel Base your answers to questions
Assessment of Lake Forest Lake Sediment Trapping Efficiency and Capacity. Marlon R. Cook Groundwater Assessment Program Geological Survey of Alabama
 Assessment of Lake Forest Lake Sediment Trapping Efficiency and Capacity Marlon R. Cook Groundwater Assessment Program Geological Survey of Alabama Impacts of the Lake at Lake Forest on the connectivity
Technical Memorandum. Stream Erosion Methodology. Consolidated TMDL Implementation Plan Comprehensive Baseline Analysis.
 Technical Memorandum Stream Erosion Methodology Table of Contents 1 Introduction...1 2 Purpose...1 3 Technical Approach...1 4 Results and Discussion... 8 References... 9 Attachments... 10 Consolidated
A distributed runoff model for flood prediction in ungauged basins
 Predictions in Ungauged Basins: PUB Kick-off (Proceedings of the PUB Kick-off meeting held in Brasilia, 2 22 November 22). IAHS Publ. 39, 27. 267 A distributed runoff model for flood prediction in ungauged
Illinois State Water Survey Division
 Illinois State Water Survey Division SURFACE WATER SECTION SWS Miscellaneous Publication 108 SEDIMENT YIELD AND ACCUMULATION IN THE LOWER CACHE RIVER by Misganaw Demissie Champaign, Illinois June 1989
Monitoring of suspended sediment concentration in discharge from regulated lakes in glacial deposits
 Erosion and Sediment Transport Monitoring Programmes in River Basins (Proceedings of the Oslo Symposium, August 1992). IAHS Publ. no. 210, 1992. 269 Monitoring of suspended sediment concentration in discharge
In the space provided, write the letter of the description that best matches the term or phrase. a. any form of water that falls to Earth s
 Skills Worksheet Concept Review In the space provided, write the letter of the description that best matches the term or phrase. 1. condensation 2. floodplain 3. watershed 4. tributary 5. evapotranspiration
Conservation Planning evaluate land management alternatives to reduce soil erosion to acceptable levels. Resource Inventories estimate current and
 Conservation Planning evaluate land management alternatives to reduce soil erosion to acceptable levels. Resource Inventories estimate current and projected erosion levels and their impact on natural resource
Stream Water Quality Assessment of Long Point Gully, Graywood Gully, and Sand Point Gully: Conesus Lake Tributaries Spring 2012
 The College at Brockport: State University of New York Digital Commons @Brockport Technical Reports Studies on Water Resources of New York State and the Great Lakes 6-2012 Stream Water Quality Assessment
Memorandum. 1 Introduction. To: Dr. Chuck Regan, Tim Larson (MPCA) Date: 03/17/2016 (Revised)
 Date: 03/17/2016 (Revised)") 1 Park Drive, Suite 200 PO Box 14409 Research Triangle Park, NC 27709 Tel 919-485-8278 Fax 919-485-8280 Memorandum To: Dr. Chuck Regan, Tim Larson (MPCA) Date: 03/17/2016 (Revised) From: J. Wyss, H.I.T;
1 Park Drive, Suite 200 PO Box 14409 Research Triangle Park, NC 27709 Tel 919-485-8278 Fax 919-485-8280 Memorandum To: Dr. Chuck Regan, Tim Larson (MPCA) Date: 03/17/2016 (Revised) From: J. Wyss, H.I.T;
Upper Truckee River Restoration Lake Tahoe, California Presented by Brendan Belby Sacramento, California
 Upper Truckee River Restoration Lake Tahoe, California Presented by Brendan Belby Sacramento, California Mike Rudd (Project Manager), Charley Miller & Chad Krofta Declines in Tahoe s Water Clarity The
Big Wood River. General Information
 General Information The flows out of the southern portion of the Sawtooth National Recreation Area in central Idaho. The study reach is about a,200 ft length of river about.5 miles upstream from the discontinued
STREAM SYSTEMS and FLOODS
 STREAM SYSTEMS and FLOODS The Hydrologic Cycle Precipitation Evaporation Infiltration Runoff Transpiration Earth s Water and the Hydrologic Cycle The Hydrologic Cycle The Hydrologic Cycle Oceans not filling
Precipitation Evaporation Infiltration Earth s Water and the Hydrologic Cycle. Runoff Transpiration
 STREAM SYSTEMS and FLOODS The Hydrologic Cycle Precipitation Evaporation Infiltration Earth s Water and the Hydrologic Cycle Runoff Transpiration The Hydrologic Cycle The Hydrologic Cycle Oceans not filling
SPECIFIC DEGRADATION AND RESERVOIR SEDIMENTATION. By Renee Vandermause & Chun-Yao Yang
 SPECIFIC DEGRADATION AND RESERVOIR SEDIMENTATION By Renee Vandermause & Chun-Yao Yang Outline Sediment Degradation - Erosion vs Sediment Yield - Sediment Yield - Methods for estimation - Defining Sediment
What do you need for a Marathon?
 What do you need for a Marathon? Water and a snack? What about just a normal day? 1 flush = 3.5 gallons 1 flush = 3.5 gallons 10 minute shower = 20 gal 1 flush = 3.5 gallons 10 minute shower = 20 gal Jeans
Differentiating Mining and Non-mining Sourced Contaminants in the San Juan River Delta of Lake Powell, USA
 Differentiating Mining and Non-mining Sourced Contaminants in the San Juan River Delta of Lake Powell, USA Logan Frederick, Thure Cerling, Diego Fernandez, James VanDerslice, William P. Johnson San Juan
Quantifying River Bank Erosion with Scanning Laser Altimetry
 Quantifying River Bank Erosion with Scanning Laser Altimetry David P. Thoma, Satish C. Gupta, Marvin E. Bauer Department of Soil, Water and Climate and Department of Forestry University of Minnesota U.S.A.
CSSR: Collaborative for Sediment Source Reduction Greater Blue Earth River Basin. Final Report
 Nonpoint Source Water Pollution Project Grants CSSR: Collaborative for Sediment Source Reduction Greater Blue Earth River Basin Final Report 31 October 2016 Peter Wilcock 1, Se Jong Cho 2, Karen Gran 3,
Lidar data in water resources applications. Paola Passalacqua CE 374K Lecture, April 5 th, 2012
 Lidar data in water resources applications Paola Passalacqua CE 374K Lecture, April 5 th, 2012 Airborne Lidar Airborne laser altimetry technology (LiDAR, Light Detection And Ranging) provides high-resolution
Hydrology and Hydraulics Design Report. Background Summary
 To: National Park Services Montezuma Castle National Monument Richard Goepfrich, Facility Manager From: Multicultural Technical Engineers Date: Tuesday - February 13, 2018 Subject: 30% Hydrology and Hydraulics
Diagnostic Geomorphic Methods for Understanding Future Behavior of Lake Superior Streams What Have We Learned in Two Decades?
 Diagnostic Geomorphic Methods for Understanding Future Behavior of Lake Superior Streams What Have We Learned in Two Decades? Faith Fitzpatrick USGS WI Water Science Center, Middleton, WI fafitzpa@usgs.gov
The Yellow River Initiative: The Birth of a System Approach to Challenges Facing the Everglades of the North
 The Yellow River Initiative: The Birth of a System Approach to Challenges Facing the Everglades of the North Robert Barr and Siavash Beik 2016 INAFSM Annual Conference Belterra Conference Center, Indiana
Surface Water. Chapter 2. Water Year Data Summary, photo by John Hoxmeier. photo by Michele Hanson. photo by Michele Hanson
 Water Year Data Summary, 25-26 Surface Water photo by Michele Hanson photo by Michele Hanson photo by John Hoxmeier photo by Judy Boudreau Chapter 2 16 Water Year Data Summary, 25-26 Stream Flow Introduction
Use of SWAT to Scale Sediment Delivery from Field to Watershed in an Agricultural Landscape with Depressions
 Use of SWAT to Scale Sediment Delivery from Field to Watershed in an Agricultural Landscape with Depressions James E. Almendinger St. Croix Watershed Research Station, Science Museum of Minnesota Marylee
Stop 1: Marmot Dam Stop 1: Marmot Dam
 Stop 1: Marmot Dam Stop 1: Marmot Dam Following the removal of Marmot Dam in 2007, the fate of the reservoir sediments has been monitored through a series of surveys and sediment transport measurements.
Lake Tahoe Watershed Model. Lessons Learned through the Model Development Process
 Lake Tahoe Watershed Model Lessons Learned through the Model Development Process Presentation Outline Discussion of Project Objectives Model Configuration/Special Considerations Data and Research Integration
Rivers and Streams. Streams. Hydrologic Cycle. Drainage Basins and Divides. Colorado River Drainage Basin. Colorado Drainage Basins.
 Chapter 14 Hydrologic Cycle Rivers and Streams Streams A stream is a body of water that is confined in a channel and moves downhill under the influence of gravity. This definition includes all sizes of
Sediment Characteristics of Northwestern
 Prepared in cooperation with the Wisconsin Department of Natural Resources Sediment Characteristics of Northwestern Wisconsin s Nemadji River, 1973-2016 By Faith A. Fitzpatrick Open-File Report 2017-XXXX
Chapter 3 Erosion in the Las Vegas Wash
 Chapter 3 Erosion in the Las Vegas Wash Introduction As described in Chapter 1, the Las Vegas Wash (Wash) has experienced considerable change as a result of development of the Las Vegas Valley (Valley).
Impacts of Upstream Disturbances on Downstream Sediment Yield and Morphology in the Presence of Best Management Practices
 Impacts of Upstream Disturbances on Downstream Sediment Yield and Morphology in the Presence of Best Management Practices Ilkim Cavus M.S. Student Dr. Latif Kalin Professor Auburn University, School of
STREUVER FIDELCO CAPPELLI, LLC YONKERS DOWNTOWN DEVELOPMENT PHASE 1. DRAFT ENVIRONMENTAL IMPACT STATEMENT For: PALISADES POINT
 STREUVER FIDELCO CAPPELLI, LLC YONKERS DOWNTOWN DEVELOPMENT PHASE 1 DRAFT ENVIRONMENTAL IMPACT STATEMENT For: PALISADES POINT Prepared by: PAULUS, SOKOLOWSKI & SARTOR STORMWATER MANAGEMENT 1. Methodology
The origin of Rivers Erosion:
 The origin of Rivers Erosion: is the action of surface processes (such as water flow or wind) that removes soil, rock, or dissolved material from one location on the Earth's crust, and then transport it
NREM 407/507 - March 26. International Rivers Project. 1. Yellow River Presentation today Nile River next Tuesday
 NREM 407/507 - March 26 1. Yellow River Presentation today Nile River next Tuesday 2. Calculate stream bank erosion, gully erosion and sheet and rill erosion for the Swenson Farm that we visited on Tuesday
Subject Name: SOIL AND WATER CONSERVATION ENGINEERING 3(2+1) COURSE OUTLINE
 COURSE OUTLINE") Subject Name: SOIL AND WATER CONSERVATION ENGINEERING 3(2+1) COURSE OUTLINE (Name of Course Developer: Prof. Ashok Mishra, AgFE Department, IIT Kharagpur, Kharagpur 721 302) Module 1: Introduction and
Subject Name: SOIL AND WATER CONSERVATION ENGINEERING 3(2+1) COURSE OUTLINE (Name of Course Developer: Prof. Ashok Mishra, AgFE Department, IIT Kharagpur, Kharagpur 721 302) Module 1: Introduction and
INFLOW DESIGN FLOOD CONTROL SYSTEM PLAN 40 C.F.R. PART PLANT YATES ASH POND 2 (AP-2) GEORGIA POWER COMPANY
 GEORGIA POWER COMPANY") INFLOW DESIGN FLOOD CONTROL SYSTEM PLAN 40 C.F.R. PART 257.82 PLANT YATES ASH POND 2 (AP-2) GEORGIA POWER COMPANY EPA s Disposal of Coal Combustion Residuals from Electric Utilities Final Rule (40 C.F.R.
INFLOW DESIGN FLOOD CONTROL SYSTEM PLAN 40 C.F.R. PART 257.82 PLANT YATES ASH POND 2 (AP-2) GEORGIA POWER COMPANY EPA s Disposal of Coal Combustion Residuals from Electric Utilities Final Rule (40 C.F.R.
Gully Erosion Part 1 GULLY EROSION AND ITS CAUSES. Introduction. The mechanics of gully erosion
 Gully Erosion Part 1 GULLY EROSION AND ITS CAUSES Gully erosion A complex of processes whereby the removal of soil is characterised by incised channels in the landscape. NSW Soil Conservation Service,
Simulating the groundwater discharge to wetlands. Mukwonago Basin Example and Potential Application in Dane County
 Simulating the groundwater discharge to wetlands Mukwonago Basin Example and Potential Application in Dane County Conceptual Model Topography is major control on flow to wetlands Land Surface Water Table
Implementing a Project with 319 Funds: The Spring Brook Meander Project. Leslie A. Berns
 Implementing a Project with 319 Funds: The Spring Brook Meander Project Leslie A. Berns "...to acquire... and hold lands... for the purpose of protecting and preserving the flora, fauna and scenic beauties...
Chapter 6 Mapping and Online Tools
 Chapter 6 Mapping and Online Tools The stream site you monitor is just part of a much larger system. When analyzing stream health, it is important to take a holistic view by considering the entire watershed.
Nutrient and Sediment Cycling and Retention in Urban Floodplain Wetlands
 Nutrient and Sediment Cycling and Retention in Urban Floodplain Wetlands Greg Noe, Cliff Hupp, Nancy Rybicki, Ed Schenk, and Jackie Batson National Research Program, Reston VA U.S. Department of the Interior
CR AAO Bridge. Dead River Flood & Natural Channel Design. Mitch Koetje Water Resources Division UP District
 CR AAO Bridge Dead River Flood & Natural Channel Design Mitch Koetje Water Resources Division UP District Old County Road AAO Bridge Map courtesy of Marquette County Silver Lake Basin McClure Basin
Water Erosion (pages )
") Water Erosion (pages 272 281) Runoff and Erosion (pages 273 274) Key Concept: Moving water is the major agent of the erosion that has shaped Earth s land surface. Falling raindrops can loosen and pick
Water Erosion (pages 272 281) Runoff and Erosion (pages 273 274) Key Concept: Moving water is the major agent of the erosion that has shaped Earth s land surface. Falling raindrops can loosen and pick
Table (6): Annual precipitation amounts as recorded by stations X and Y. No. X Y
: Annual precipitation amounts as recorded by stations X and Y. No. X Y") Example: X and Y are two neighboring rainfall stations. Station X has complete records and station Y has some missing values. Find the linear correlation equation between the two series as mentioned in
Example: X and Y are two neighboring rainfall stations. Station X has complete records and station Y has some missing values. Find the linear correlation equation between the two series as mentioned in
SILT FENCE EFFECTIVENESS
 SILT FENCE EFFECTIVENESS Michelle G. Holloway, Department of Earth Sciences, University of South Alabama, Mobile, AL 36688. E-mail: MLG@jaguar1.usouthal.edu. Sediment is the number one pollutant in Dog