Modeling Upland and Channel Sources of Sediment in the Le Sueur River Watershed, Minnesota
|
|
|
- Oscar Farmer
- 6 years ago
- Views:
Transcription
1 Modeling Upland and Channel Sources of Sediment in the Le Sueur River Watershed, Minnesota Solomon Folle and David Mulla Department of Soil, Water and Climate University of Minnesota August 6, th International SWAT Conference Boulder, Colorado
 is one LRW 7% of the MRB area 53% of the MRB TSS Lake Pepin Downstream of")
2 Introduction and Background Minnesota River Basin (MRB) Contains headwaters of the Mississippi River basin Drains 4.4 million ha in Minnesota Impaired for sediment 12 major watersheds Le Sueur River Watershed (LRW) is one LRW 7% of the MRB area 53% of the MRB TSS Lake Pepin Downstream of the MRB Impaired for sediment 85% from the MRB 45% from LRW
3 Objective of the study To quantify sediment loads from upland sources of the LRW using physically based spatially distributed model, SWAT To investigate sediment source areas in the LRW To estimate the relative proportions of upland versus channel sources of sediment

4 The Le Sueur River Watershed (LRW) Le Sueur River August 29/2007 2,850 sq. km 87% Agric. Land: Corn-Soybean Slope 82% with 0-2% 14% has 2-6% Soils Very deep & poorly drained Fine textured Mollisols Extensive tile drainage
5 LRW Cont d Three major subwatersheds 302,000 tons annual sed. yield Major source of sediment that polluted the MRB and Lake Pepin


6 Where does the LRW sediment comes from? 3 major sources i. Soil erosion from uplands ii. Head-cut and knick point migration of ravines iii. Stream bank erosion and river bluff slumping
7 Modeling Sediment losses of the LRW SWAT model: to estimate sediment losses from the uplands only SWAT model routines to estimate the channel sources are not good enough Estimating sediment load from channel sources Channel degradation was set zero Indirect methods Channel SYLD = Measured SYLD - Predicted Upland SYLD
8 SWAT Model Input Data Data Type 30m DEM SSURGO soil Land use/ USDA NASS CLD Stream network Weather Point Sources Flow and Water Quality Source USGS, MN Metropolitan Council, MPCA, DNR and MDA USGS USDA USDA MRBDC U of M MPCA LOADEST program was used to estimate missing water quality data


9 84 sub-watersheds 4818 HRUs USGS 30 m DEM Minnesota DNR watershed subdivisions Model Setup
 Calibrated model input parameters transferred to the")
10 Model Calibration and Validation Calibration sub-watershed Beauford Sub-watershed Has no bluffs or ravines Only upland sediment sources Calibration year 2000 Validation Model simulation efficiency: Nash Sutcliffe coefficient (NSE) Calibrated model input parameters transferred to the entire LRW
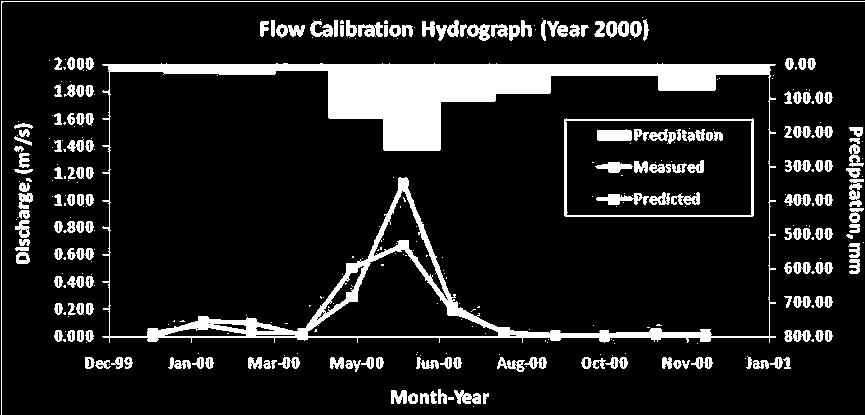
11 Flow Calibration and Validation in Beauford NSE = 0.77 NSE = 0.89
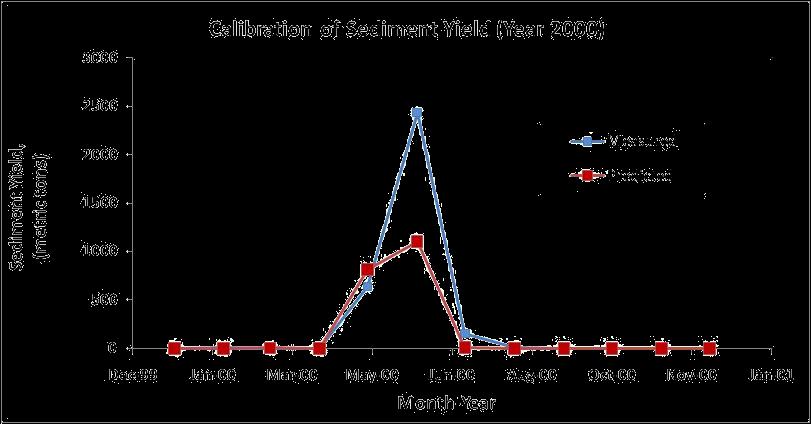
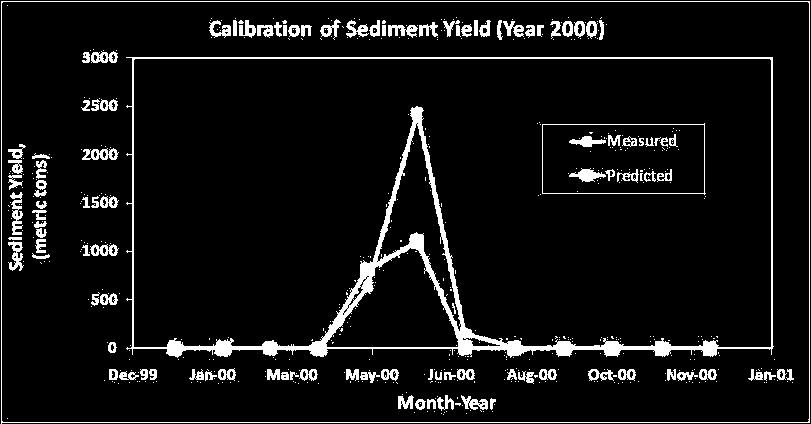
12 SYLD Calibration and Validation in Beauford NSE = 0.67 NSE = 0.76
13 SWAT model was well parameterized Calibrated model parameters can satisfactorily be applied to the entire LRW

14 Application of SWAT Model to LRW Big Cobb Maple Upper Le Sueur Entire Le Sueur

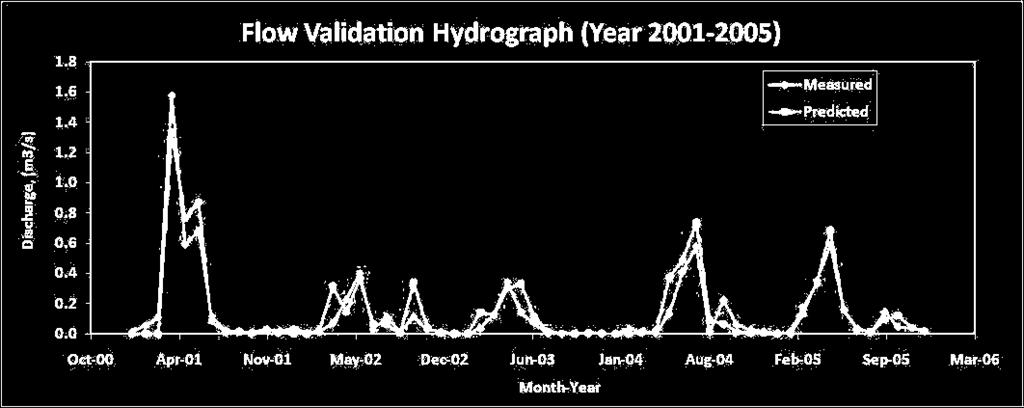
15 Validation of Flow in LRW Model predicted discharge was accurate NSE value of 0.73
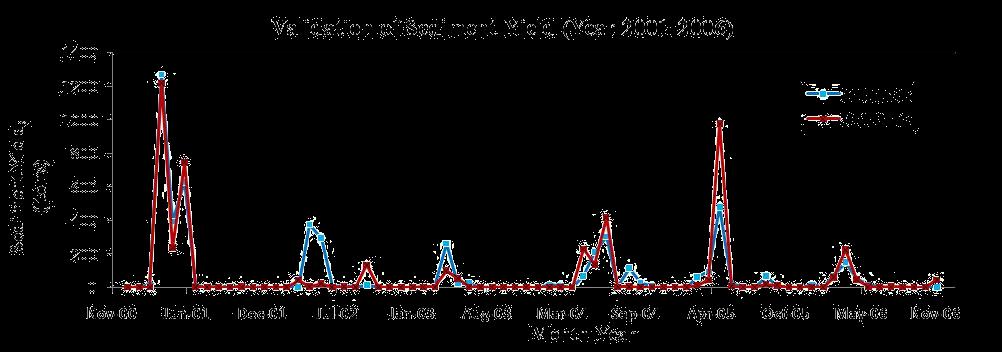
16 Validation of Sediment Yield in LRW


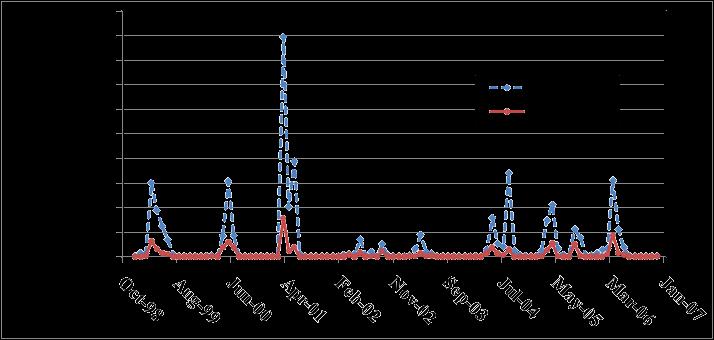
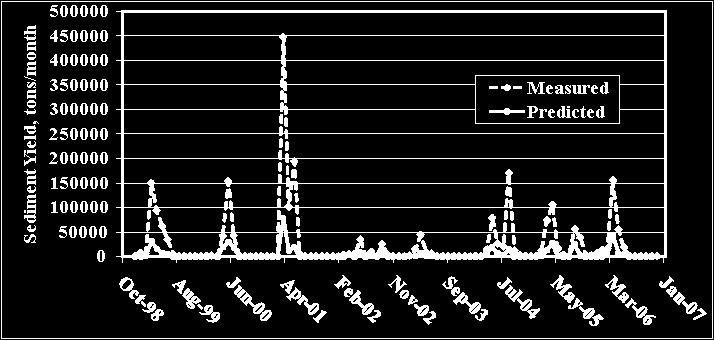
17 Channel Sources of Sediment in LRW
18 Model predicted SYLD was much smaller than measured This is expected result Only upland sources The difference was contributed by channel sources River bluffs, stream banks and ravines Example: Year 2006 measured LRW = 230,502 tons Model predicted = 32,893 tons Upland contribution = 14% Channel Sources = 86%
19 LRW Upland Sediment Source Areas SYLD, ton/ha Area, ha Area, % < to to > Total
20 LRW Upland Sediment Source Areas---Cont d
21 LRW Upland Sediment Source Areas---Cont d Sub-watershed Predicted Upland Sediment Load Channel Erosion (estimated by difference) Measured Total Sediment Load Average Sed. Yield tons % tons % tons tons/ha Beauford Big Cobb Maple Upper Le Sueur LRW
22 Channel Vs Upland Sources Percent SYLD Upland Sources Channel Sources Percent SYLD Percent Contributing Area

23 LRW Upland Sediment Source Areas---cont d Subwatershed Percent SYLD Contribution Upland Channel Total Percent Area Big Cobb Maple Upper Le Sueur LRW
24 Conclusions SWAT model was found to be very accurate at predicting discharge and sediment losses from upland agricultural regions of LRW A small proportion of the LRW uplands (55%) contributes disproportionally high sediment yields (80%) Upland sediment sources are a small fraction of the total sediment losses Only 14% arises from upland agricultural areas 86% from river bluffs, ravines and eroding stream channels 69% of the sediment comes from the Upper Le Sueur Has 40% the LRW area
25 Acknowledgments Minnesota Department of Agriculture (MDA)
26 Questions?
Patrick Baskfield. Scott Matteson. Minnesota Pollution Control Agency. Minnesota State University Water Resource Center
 Regression Analysis of Total Suspended Solids Concentrations to Estimate Streambank, Upland Field, and Classic Gully Sediment Contributions to Minnesota River Tributaries Patrick Baskfield Minnesota Pollution
low turbidity high turbidity
 What is Turbidity? Turbidity refers to how clear the water is. The greater the amount of total suspended solids (TSS) in the water, the murkier it appears and the higher the measured turbidity. Excessive
Minnesota River Turbidity Stakeholder Committee New Ulm Library, August 27, 20090
 Identifying sediment sources in the Minnesota River Basin Peter Wilcock Dept of Geography & Environmental Engineering National Center for Earth Surface Dynamics Johns Hopkins University Minnesota River
Overview of fluvial and geotechnical processes for TMDL assessment
 Overview of fluvial and geotechnical processes for TMDL assessment Christian F Lenhart, Assistant Prof, MSU Research Assoc., U of M Biosystems Engineering Fluvial processes in a glaciated landscape Martin
Application of an Enhanced, Fine-Scale SWAT Model to Target Land Management Practices for Maximizing Pollutant Reduction and Conservation Benefits
 Application of an Enhanced, Fine-Scale SWAT Model to Target Land Management Practices for Maximizing Pollutant Reduction and Conservation Benefits Amanda Flynn, Todd Redder, Joe DePinto, Derek Schlea Brian
the path to studying tile drainage
 Fingerprinting Sources of Suspended Sediments Mean 210 Pb Flux (pci/cm 2 /yr) 2.5 2 1.5 1 0.5 Sagatagan Kreighle Henderson George Long Diamond Duck Stahl Reference Lakes y = 0.65 + 4.8x R 2 = 0.58 Hook
Erosion Surface Water. moving, transporting, and depositing sediment.
 + Erosion Surface Water moving, transporting, and depositing sediment. + Surface Water 2 Water from rainfall can hit Earth s surface and do a number of things: Slowly soak into the ground: Infiltration
Limitation to qualitative stability indicators. the real world is a continuum, not a dichotomy ~ 100 % 30 % ~ 100 % ~ 40 %
 Stream Stability Assessment & BEHI Surveys Joe Rathbun MDEQ Water Resources Division rathbunj@michigan.gov 517--373 517 373--8868 Stability Stream can transport its water and sediment inputs without changing
Illinois State Water Survey Division
 Illinois State Water Survey Division SURFACE WATER SECTION SWS Miscellaneous Publication 108 SEDIMENT YIELD AND ACCUMULATION IN THE LOWER CACHE RIVER by Misganaw Demissie Champaign, Illinois June 1989
How Do Human Impacts and Geomorphological Responses Vary with Spatial Scale in the Streams and Rivers of the Illinois Basin?
 How Do Human Impacts and Geomorphological Responses Vary with Spatial Scale in the Streams and Rivers of the Illinois Basin? Bruce Rhoads Department of Geography University of Illinois at Urbana-Champaign
Lidar data in water resources applications. Paola Passalacqua CE 374K Lecture, April 5 th, 2012
 Lidar data in water resources applications Paola Passalacqua CE 374K Lecture, April 5 th, 2012 Airborne Lidar Airborne laser altimetry technology (LiDAR, Light Detection And Ranging) provides high-resolution
Vulnerability assessment of Sta.Rosa-Silang subwatershed using SWAT
 Vulnerability assessment of Sta.Rosa-Silang subwatershed using SWAT Damasa B. Magcale-Macandog, Charles Gunay and Milben A. Bragais Institute of Biological Sciences, University of the Philippines Los Baños,
Evaluation of the two stage ditch as a best management practice. A. Hodaj, L.C. Bowling, C. Raj, I. Chaubey
 Evaluation of the two stage ditch as a best management practice A. Hodaj, L.C. Bowling, C. Raj, I. Chaubey Two-stage ditch: Stage 1 : main channel Stage 2 : flood plain bench Traditional ditch Twostage
Application of SWAT Model to Estimate the Runoff and Sediment Load from the Right Bank Valleys of Mosul Dam Reservoir
 Application of SWAT Model to Estimate the Runoff and Sediment Load from the Right Bank Valleys of Mosul Dam Reservoir Dr Mohammad Ezeel Deen Prof. Nadhir Al-Ansari Prof Sven Knutsson Figure 1.Map of Iraq
Water Quality and Water Quantity: Two sides of the Same Coin. Chris Jones
 Water Quality and Water Quantity: Two sides of the Same Coin Chris Jones Unit of the College of Engineering Director: Larry Weber 90 Graduate Students from 16 countries 61 Research Engineers and Scientists
Diagnostic Geomorphic Methods for Understanding Future Behavior of Lake Superior Streams What Have We Learned in Two Decades?
 Diagnostic Geomorphic Methods for Understanding Future Behavior of Lake Superior Streams What Have We Learned in Two Decades? Faith Fitzpatrick USGS WI Water Science Center, Middleton, WI fafitzpa@usgs.gov
Estimation of Ravine Sediment Production and Sediment Dynamics in the Lower Le Sueur River Watershed, Minnesota
 Florida International University FIU Digital Commons FIU Electronic Theses and Dissertations University Graduate School 11-12-2009 Estimation of Ravine Sediment Production and Sediment Dynamics in the
Chris Lenhart, John Nieber, Ann Lewandowski, Jason Ulrich TOOLS AND STRATEGIES FOR REDUCING CHANNEL EROSION IN MINNESOTA
 Chris Lenhart, John Nieber, Ann Lewandowski, Jason Ulrich TOOLS AND STRATEGIES FOR REDUCING CHANNEL EROSION IN MINNESOTA Background and approach Channel loading major source of sediment in much of MN River
Use of SWAT to Scale Sediment Delivery from Field to Watershed in an Agricultural Landscape with Depressions
 Use of SWAT to Scale Sediment Delivery from Field to Watershed in an Agricultural Landscape with Depressions James E. Almendinger St. Croix Watershed Research Station, Science Museum of Minnesota Marylee
Technical Memorandum FINAL
 Technical Memorandum FINAL To: Project File A previous effort to develop and calibrate a Soil and Water Assessment Tool (SWAT) watershed model for the Cedar River basin included a limited representation
Nutrient Delivery from the Mississippi River to the Gulf of Mexico and Effects of Cropland Conservation
 Nutrient Delivery from the Mississippi River to the Gulf of Mexico and Effects of Cropland Conservation Mike White, Jeff Arnold, Lee Norfleet, Santhi Chinnasamy, and Mauro DiLuzio USDA-ARS Grassland, Soil
Modeling the Effects of Climate and Land Cover Change in the Stoney Brook Subbasin of the St. Louis River Watershed
 Modeling the Effects of Climate and Land Cover Change in the Stoney Brook Subbasin of the St. Louis River Watershed Joe Johnson and Jesse Pruette 214 NASA Research Internship Geospatial Technologies Program
Roger Andy Gaines, Research Civil Engineer, PhD, P.E.
 Roger Andy Gaines, Research Civil Engineer, PhD, P.E. Research Civil Engineer/Regional Technical Specialist Memphis District August 24, 2010 Objectives Where we have been (recap of situation and what s
Modeling of a River Basin Using SWAT Model and SUFI-2
 Modeling of a River Basin Using SWAT Model and SUFI-2 NINA OMANI MASOUD TAJRISHY AHMAD ABRISHAMCHI Sharif University of Technology, Tehran, Iran Karkheh Dam, Iran 1 Area of Gharasu Sub-basin : 5793 km2
Summary. Streams and Drainage Systems
 Streams and Drainage Systems Summary Streams are part of the hydrologic cycle and the chief means by which water returns from the land to the sea. They help shape the Earth s surface and transport sediment
Hydrologic and Water Quality Modeling for the Missouri River Basin (MORB)
") 2016 International SWAT Conference in Beijing, China Hydrologic and Water Quality Modeling for the Missouri River Basin (MORB) Zhonglong Zhang, PhD, PE, May Wu, PhD Courtesy of USACE Outline Missouri River
2016 International SWAT Conference in Beijing, China Hydrologic and Water Quality Modeling for the Missouri River Basin (MORB) Zhonglong Zhang, PhD, PE, May Wu, PhD Courtesy of USACE Outline Missouri River
Great Lakes Tributary Modeling: Canaseraga Creek Watershed
 Great Lakes Tributary Modeling: Canaseraga Creek Watershed SWAT Model Authority: Section 516(e) of WRDA 1996 US Army Corps of Engineers Canaseraga Creek Project Location - Encompasses portions of Livingston,
Building a European-wide hydrological model
 Building a European-wide hydrological model 2010 International SWAT Conference, Seoul - South Korea Christine Kuendig Eawag: Swiss Federal Institute of Aquatic Science and Technology Contribution to GENESIS
Predicting daily total phosphorus and suspended solids across Wisconsin stream reaches for impairment assessment
 Predicting daily total phosphorus and suspended solids across Wisconsin stream reaches for impairment assessment Alex Latzka & Matt Diebel AWRA WI 10 March 2017 Alexander.Latzka@wisconsin.gov Matthew.Diebel@wisconsin.gov
Quantifying River Bank Erosion with Scanning Laser Altimetry
 Quantifying River Bank Erosion with Scanning Laser Altimetry David P. Thoma, Satish C. Gupta, Marvin E. Bauer Department of Soil, Water and Climate and Department of Forestry University of Minnesota U.S.A.
Bank Erosion and Morphology of the Kaskaskia River
 Bank Erosion and Morphology of the Kaskaskia River US Army Corps Of Engineers St. Louis District Fayette County Soil and Water Conservation District Team Partners : Carlyle Lake Ecosystem Partnership Vicinity
Targeted water storage to maintain productive land and restore clean water
 Targeted water storage to maintain productive land and restore clean water Patrick Belmont Department of Watershed Sciences Utah State University Photo credit: Carrie Jennings None of our work would be
Streamflow, Sediment, and Nutrient Simulation of the Bitterroot Watershed using SWAT
 Streamflow, Sediment, and Nutrient Simulation of the Bitterroot Watershed using SWAT by Dr. Michael Van Liew Montana Department of Environmental Quality Helena, Montana, USA Site Map of SWAT Watersheds
Black Gore Creek 2013 Sediment Source Monitoring and TMDL Sediment Budget
 Black Gore Creek 2013 Sediment Source Monitoring and TMDL Sediment Budget Prepared for: Prepared By: - I. Introduction The Black Gore Creek Total Maximum Daily Load (TMDL) was developed in collaboration
Geomorphic evolution of the Le Sueur River, Minnesota, USA, and implications for current sediment loading
 spe 451-08 1st pgs page 1 The Geological Society of America Special Paper 451 2009 Geomorphic evolution of the Le Sueur River, Minnesota, USA, and implications for current sediment loading Karen B. Gran
Rivers and Streams. Streams. Hydrologic Cycle. Drainage Basins and Divides. Colorado River Drainage Basin. Colorado Drainage Basins.
 Chapter 14 Hydrologic Cycle Rivers and Streams Streams A stream is a body of water that is confined in a channel and moves downhill under the influence of gravity. This definition includes all sizes of
SWAT 2015 International Conference:
 SWAT 2015 International Conference: Comparative Analysis of Spatial Resolution Effects on Standard and Grid-based SWAT Models Presented by: Garett Pignotti Co-authors: Dr. Hendrik Rathjens, Dr. Cibin Raj,
Lidar data in water resources applications
 Lidar data in water resources applications Paola Passalacqua CE 394K 3 Guest Lecture, November 15 th, 2012 Airborne Lidar Airborne laser altimetry technology (lidar, Light Detection And Ranging) provides
Influence of the Major Drainages to the Mississippi River and Implications for System Level Management
 Influence of the Major Drainages to the Mississippi River and Implications for System Level Management Brian M. Vosburg Geologist Louisiana Coastal Protection and Restoration Authority brian.vosburg@la.gov
Laboratory Exercise #3 The Hydrologic Cycle and Running Water Processes
 Laboratory Exercise #3 The Hydrologic Cycle and Running Water Processes page - 1 Section A - The Hydrologic Cycle Figure 1 illustrates the hydrologic cycle which quantifies how water is cycled throughout
Web-based Tools for Soil Erosion Assessment/Management
 Web-based Tools for Soil Erosion Assessment/Management Glenn O Neil GIS Specialist Institute of Water Research Michigan State University Managing and Understanding Sediments in Your Watershed Workshop
Nina Omani, Raghavan Srinivasan, and Taesoo Lee. Spatial Sciences Laboratory, Texas A&M University
 Nina Omani, Raghavan Srinivasan, and Taesoo Lee Spatial Sciences Laboratory, Texas A&M University This project was initiated to develop and apply the SWAT model to two Texas estuaries in order to estimate
Floods Lecture #21 20
 Floods 20 Lecture #21 What Is a Flood? Def: high discharge event along a river! Due to heavy rain or snow-melt During a flood, a river:! Erodes channel o Deeper & wider! Overflows channel o Deposits sediment
5/4/2017 Fountain Creek. Gage Analysis. Homework 6. Clifton, Cundiff, Pour, Queen, and Zey CIVE 717
 5/4/2017 Fountain Creek Gage Analysis Homework 6 Clifton, Cundiff, Pour, Queen, and Zey CIVE 717 Introduction: The CIVE 717 class members, Nate Clifton, Susan Cundiff, Ali Reza Nowrooz Pour, Robbie Queen
Sediment Deposition LET THE RIVER RUN T E A C H E R. Activity Overview. Activity at a Glance. Time Required. Level of Complexity.
 Activity at a Glance Grade: 6 9 Subject: Science Category: Physical Science, Earth Science Topic: Deposition, River Systems Time Required Two 45-minute periods Level of Complexity Medium Materials* TI-73
Surface Processes Focus on Mass Wasting (Chapter 10)
") Surface Processes Focus on Mass Wasting (Chapter 10) 1. What is the distinction between weathering, mass wasting, and erosion? 2. What is the controlling force in mass wasting? What force provides resistance?
Surface Processes Focus on Mass Wasting (Chapter 10) 1. What is the distinction between weathering, mass wasting, and erosion? 2. What is the controlling force in mass wasting? What force provides resistance?
7.3 Sediment Delivery Analysis
 7.3 Sediment Delivery Analysis In order to evaluate potential changes in sedimentation patterns that could occur due to impacts from the FCP and LPP alignments, sediment assessment models were constructed
Surface Water and Stream Development
 Surface Water and Stream Development Surface Water The moment a raindrop falls to earth it begins its return to the sea. Once water reaches Earth s surface it may evaporate back into the atmosphere, soak
Assessment of Streambank and Bluff Erosion in the Knife River Watershed. Final Report Submitted to Minnesota Pollution Control Agency
 Assessment of Streambank and Bluff Erosion in the Knife River Watershed Final Report Submitted to Minnesota Pollution Control Agency by John L. Nieber Bruce N. Wilson Jason S. Ulrich Bradley J. Hansen
Liliana Pagliero June, 15 th 2011
 Liliana Pagliero liliana.pagliero@jrc.ec.europa.eu June, 15 th 2011 2/18 SWAT MODELLING AT PAN EUROPEAN SCALE: THE DANUBE BASIN PILOT STUDY Introduction The Danube Model Available databases Model set up
Watershed Conservation Management Planning Using the Integrated Field & Channel Technology of AnnAGNPS & CONCEPTS
 Watershed Conservation Management Planning Using the Integrated Field & Channel Technology of AnnAGNPS & CONCEPTS Eddy Langendoen Ron Bingner USDA-ARS National Sedimentation Laboratory, Oxford, Mississippi
Modelling Runoff with Satellite Data. Nyandwaro Gilbert Nyageikaro Patrick Willems Joel Kibiiy
 Modelling Runoff with Satellite Data Nyandwaro Gilbert Nyageikaro Patrick Willems Joel Kibiiy 1 Outline Background information SWAT model development The model sensitivity analysis and calibration Calibration
Assessing Spatial and Temporal Distribution of Sediment, Nitrogen and Phosphorous Loading in the Missouri River Basin (MORB)
") Assessing Spatial and Temporal Distribution of Sediment, Nitrogen and Phosphorous Loading in the Missouri River Basin (MORB) Zhonglong Zhang, PhD, PE, May Wu, PhD LimnoTech, Environmental Laboratory, ERDC,
Assessing Spatial and Temporal Distribution of Sediment, Nitrogen and Phosphorous Loading in the Missouri River Basin (MORB) Zhonglong Zhang, PhD, PE, May Wu, PhD LimnoTech, Environmental Laboratory, ERDC,
Landscape Development
 Landscape Development Slopes Dominate Natural Landscapes Created by the interplay of tectonic and igneous activity and gradation Deformation and uplift Volcanic activity Agents of gradation Mass wasting
GLACIER AND SNOWMELT MODELLING USING SWAT: GANGA BASIN CASE STUDY. INRM Consultants Pvt. Ltd.
 GLACIER AND SNOWMELT MODELLING USING SWAT: GANGA BASIN CASE STUDY INRM Consultants Pvt. Ltd. Introduction Snowmelt Runoff contribution in the Himalayan Rivers Estimation of Average contribution of Snowmelt
Development and testing of improved physically based streambank erosion and sediment routing routines in SWAT
 Development and testing of improved physically based streambank erosion and sediment routing routines in SWAT Balaji Narasimhan, P. M. Allen, Stephanie Capello, and Dave Coffman, J.G. Arnold, and R. Srinivasan
Study Area. Aerial View of Potholes after Rain. Concern
 Airborne Laser Scanning for Riverbank Erosion Assessment- Implications for Water Quality Satish Gupta Professor Department of Soil, Water, & Climate University of Minnesota, St. Paul, MN Lake Pepin Sedimentation
CSSR: Collaborative for Sediment Source Reduction Greater Blue Earth River Basin. Final Report
 Nonpoint Source Water Pollution Project Grants CSSR: Collaborative for Sediment Source Reduction Greater Blue Earth River Basin Final Report 31 October 2016 Peter Wilcock 1, Se Jong Cho 2, Karen Gran 3,
STUDY GUIDE FOR CONTENT MASTERY. Surface Water Movement
 Surface Water SECTION 9.1 Surface Water Movement In your textbook, read about surface water and the way in which it moves sediment. Complete each statement. 1. An excessive amount of water flowing downslope
Assessing Differences in Ravine Erosion in Seven Mile Creek Park and the Surrounding Area: Implications for Sediment in the Minnesota River
 Assessing Differences in Ravine Erosion in Seven Mile Creek Park and the Surrounding Area: Implications for Sediment in the Minnesota River By Laura Danczyk A thesis submitted in partial fulfillment of
Erosion Rate is a Function of Erodibility and Excess Shear Stress = k ( o - c ) From Relation between Shear Stress and Erosion We Calculate c and
 From Relation between Shear Stress and Erosion We Calculate c and") Equilibrium, Shear Stress, Stream Power and Trends of Vertical Adjustment Andrew Simon USDA-ARS, Oxford, MS asimon@msa-oxford.ars.usda.gov Non-Cohesive versus Cohesive Materials Non-cohesive: sands and
Equilibrium, Shear Stress, Stream Power and Trends of Vertical Adjustment Andrew Simon USDA-ARS, Oxford, MS asimon@msa-oxford.ars.usda.gov Non-Cohesive versus Cohesive Materials Non-cohesive: sands and
Spatial resolution of soil data and channel erosion effects on SWAT model predictions of flow and sediment
 doi:10.2489/jswc.65.2.92 Spatial resolution of soil data and channel erosion effects on SWAT model predictions of flow and sediment R. Mukundan, D.E. Radcliffe, and L.M. Risse Abstract: Water quality modeling
River Response. Sediment Water Wood. Confinement. Bank material. Channel morphology. Valley slope. Riparian vegetation.
 River Response River Response Sediment Water Wood Confinement Valley slope Channel morphology Bank material Flow obstructions Riparian vegetation climate catchment vegetation hydrological regime channel
REVIEW. There are 2 types of WEATHERING: 1. CHEMICAL 2. PHYSICAL. What is WEATHERING? The breakdown of rocks at or near Earth s surface
 REVIEW What is WEATHERING? Def: The breakdown of rocks at or near Earth s surface There are 2 types of WEATHERING: 1. CHEMICAL 2. PHYSICAL CHEMICAL WEATHERING EXAMPLES: 1. OXIDATION (rust) CHEMICAL WEATHERING
Watershed concepts for community environmental planning
 Purpose and Objectives Watershed concepts for community environmental planning Dale Bruns, Wilkes University USDA Rural GIS Consortium May 2007 Provide background on basic concepts in watershed, stream,
Variability in discharge, stream power, and particlesize distributions in ephemeral-stream channel systems
 Variability in Stream Erosion and Sediment Transport (Proceedings of the Canberra Symposium December 1994). IAHS Publ. no. 224, 1994. 335 Variability in discharge, stream power, and particlesize distributions
Assessment of solid load and siltation potential of dams reservoirs in the High Atlas of Marrakech (Moorcco) using SWAT Model
 using SWAT Model") Assessment of solid load and siltation potential of dams reservoirs in the High Atlas of Marrakech (Moorcco) using SWAT Model Amal Markhi: Phd Student Supervisor: Pr :N.Laftrouhi Contextualization Facing
Assessment of solid load and siltation potential of dams reservoirs in the High Atlas of Marrakech (Moorcco) using SWAT Model Amal Markhi: Phd Student Supervisor: Pr :N.Laftrouhi Contextualization Facing
Problems and Solutions in Applying SWAT in the Upper Midwest USA
 Problems and Solutions in Applying SWAT in the Upper Midwest USA J.E. Almendinger 1, M.S. Murphy 2 1 Senior Scientist, St. Croix Watershed Research Station, Science Museum of Minnesota, Marine on St. Croix,
3/3/2013. The hydro cycle water returns from the sea. All "toilet to tap." Introduction to Environmental Geology, 5e
 Introduction to Environmental Geology, 5e Running Water: summary in haiku form Edward A. Keller Chapter 9 Rivers and Flooding Lecture Presentation prepared by X. Mara Chen, Salisbury University The hydro
High-Gradient Streams
 Chapter 4 Surface Processes Section 4 High-Gradient Streams What Do You See? Learning Outcomes In this section, you will Use models and real-time streamflow data to understand the characteristics of highgradient
Effect of GIS data quality on small watershed stream flow and sediment simulations
 HYDROLOGICAL PROCESSES Hydrol. Process. 19, 629 650 (2005) Published online in Wiley InterScience (www.interscience.wiley.com). DOI: 10.1002/hyp.5612 Effect of GIS data quality on small watershed stream
Streams. Stream Water Flow
 CHAPTER 14 OUTLINE Streams: Transport to the Oceans Does not contain complete lecture notes. To be used to help organize lecture notes and home/test studies. Streams Streams are the major geological agents
Earth Science Chapter 6 Section 2 Review
 Name: Class: Date: Earth Science Chapter 6 Section Review Multiple Choice Identify the choice that best completes the statement or answers the question. 1. Most streams carry the largest part of their
Stream Geomorphology. Leslie A. Morrissey UVM July 25, 2012
 Stream Geomorphology Leslie A. Morrissey UVM July 25, 2012 What Functions do Healthy Streams Provide? Flood mitigation Water supply Water quality Sediment storage and transport Habitat Recreation Transportation
A Post Processing Tool to Assess Sediment and Nutrient Source Allocations from SWAT Simulations
 A Post Processing Tool to Assess Sediment and Nutrient Source Allocations from SWAT Simulations Michael Van Liew William Puknat Montana Department of Environmental Quality Helena, Montana, USA PROBLEM:
Detroit 516 Activities
 Detroit 516 Activities Dam Capacity Study Sediment Workshop in Traverse City START 2.0 Saginaw River Study Dam Capacity Study A progress report Outline Study Objective (Why are we doing this?) Reservoir
Simulation of sedimentation rates using the SWAT model A case study of the Tarbela Dam, Upper Indus Basin
 Simulation of sedimentation rates using the SWAT model A case study of the Tarbela Dam, Upper Indus Basin Ahammad, H. I 1., Crosato A 2,3., Maskey, S 2., Masih, I 2,*, McClain, M 2. 1 Punjab Irrigation
Introduction Fluvial Processes in Small Southeastern Watersheds
 Introduction Fluvial Processes in Small Southeastern Watersheds L. Allan James Scott A. Lecce Lisa Davis Southeastern Geographer, Volume 50, Number 4, Winter 2010, pp. 393-396 (Article) Published by The
Little Swan Lake. Dam Inspection & Siltation Study Prepared By: William Klingner, P.E., CFM October 28, 2018
 Little Swan Lake Dam Inspection & Siltation Study Prepared By: William Klingner, P.E., CFM October 28, 2018 Agenda Little Swan Lake Dam Inspection Theoretical Little Swan Lake Siltation Rate Calculations
Squaw Creek. General Information
 General Information is a tributary to the Salmon River. It enters the north side of the river about 0 miles downstream of North Fork, Idaho. The study reach is about a 30 ft length of stream about 2 miles
Remaining Capacity in Great Lakes Reservoirs
 US Army Corps of Engineers Detroit District Remaining Capacity in Great Lakes Reservoirs Storage Capacity Behind Great Lakes Dams Field Data and Modeling Motivation for project Project overview Data and
Monitoring Headwater Streams for Landscape Response to
 Monitoring Headwater Streams for Landscape Response to Climate Change Matthew Connor, PhD Connor nvironmental, nc. www.oe-i.com icom Healdsburg, California verview Headwater stream geomorphology Response
Big Wood River. General Information
 General Information The flows out of the southern portion of the Sawtooth National Recreation Area in central Idaho. The study reach is about a,200 ft length of river about.5 miles upstream from the discontinued
Running Water Earth - Chapter 16 Stan Hatfield Southwestern Illinois College
 Running Water Earth - Chapter 16 Stan Hatfield Southwestern Illinois College Hydrologic Cycle The hydrologic cycle is a summary of the circulation of Earth s water supply. Processes involved in the hydrologic
Impact of different types of meteorological data inputs on predicted hydrological and erosive responses to projected land use change
 Impact of different types of meteorological data inputs on predicted hydrological and erosive responses to projected land use change Suman Bhattacharyya 1 & Joy Sanyal * 1 2 1 Department of Geography,
Black Gore Creek Sediment Source Monitoring and TMDL Sediment Budget
 Black Gore Creek 2012 Sediment Source Monitoring and TMDL Sediment Budget Prepared for: The Eagle River Watershed Council Prepared By: RiverRestoration.org - I. Introduction Interstate 70 is a major highway
Measuring Streambank Erosion Bank Profiles to more Robustly Estimate Recession Rates and Calibration of the AnnAGNPS-CEAP Model
 Measuring Streambank Erosion Bank Profiles to more Robustly Estimate Recession Rates and Calibration of the AnnAGNPS-CEAP Model Clare Prestwich, P.E. 1 & W. Barry Southerland, Ph.D. 2 Water Quality and
The Effect of Land Use Change to Land Erosion and Sediment Transported on The Cacthment Area of Mrica Reservoir
 The Effect of Land Use Change to Land Erosion and Sediment Transported on The Cacthment Area of Mrica Reservoir Lukman Hidayat 1, Putu Sudira 2, Sahid Susanto 2, and Rachmad Jayadi 3 1 Agricultural Technology
WATER ON AND UNDER GROUND. Objectives. The Hydrologic Cycle
 WATER ON AND UNDER GROUND Objectives Define and describe the hydrologic cycle. Identify the basic characteristics of streams. Define drainage basin. Describe how floods occur and what factors may make
Hydrological Cycle Rain and rivers OUTLINE
 Hydrological Cycle Rain and rivers The Hydrosphere Rain and rivers OUTLINE 1 Generalizations (non-political conservatism) Conservative (not affected) and Non-Conservative (affected) Ions Distinction: whether
Wetland & Floodplain Functional Assessments and Mapping To Protect and Restore Riverine Systems in Vermont. Mike Kline and Laura Lapierre Vermont DEC
 Wetland & Floodplain Functional Assessments and Mapping To Protect and Restore Riverine Systems in Vermont Mike Kline and Laura Lapierre Vermont DEC NWI+ Hydro-Geomorphic Characterization of Wetlands and
to set actual loading goals for each indi
 Prepared by:. for the Minnesota Pollution Control Agency Red River Biotic Impairment Assessment June 2009 to set actual loading goals for each indi wat er e c ology communit y CHAPTER 5.3 - isolated from
mountain rivers fixed channel boundaries (bedrock banks and bed) high transport capacity low storage input output
 high transport capacity low storage input output") mountain rivers fixed channel boundaries (bedrock banks and bed) high transport capacity low storage input output strong interaction between streams & hillslopes Sediment Budgets for Mountain Rivers Little
mountain rivers fixed channel boundaries (bedrock banks and bed) high transport capacity low storage input output strong interaction between streams & hillslopes Sediment Budgets for Mountain Rivers Little
Exploring the role of channel processes and legacy sediment in nutrient and sediment delivery, Upper Pecatonica River, Wisconsin
 Exploring the role of channel processes and legacy sediment in nutrient and sediment delivery, Upper Pecatonica River, Wisconsin Faith Fitzpatrick and Rebecca Carvin (USGS WI Water Science Center), Robert
Watershed Application of WEPP and Geospatial Interfaces. Dennis C. Flanagan
 Watershed Application of WEPP and Geospatial Interfaces Dennis C. Flanagan Research Agricultural Engineer USDA-Agricultural Research Service Adjunct Professor Purdue Univ., Dept. of Agric. & Biol. Eng.
Memorandum. 1 Introduction. To: Dr. Chuck Regan, Tim Larson (MPCA) Date: 03/17/2016 (Revised)
 Date: 03/17/2016 (Revised)") 1 Park Drive, Suite 200 PO Box 14409 Research Triangle Park, NC 27709 Tel 919-485-8278 Fax 919-485-8280 Memorandum To: Dr. Chuck Regan, Tim Larson (MPCA) Date: 03/17/2016 (Revised) From: J. Wyss, H.I.T;
1 Park Drive, Suite 200 PO Box 14409 Research Triangle Park, NC 27709 Tel 919-485-8278 Fax 919-485-8280 Memorandum To: Dr. Chuck Regan, Tim Larson (MPCA) Date: 03/17/2016 (Revised) From: J. Wyss, H.I.T;
Watershed Assessment of River Stability and Sediment Supply: Advancing the Science of Watershed Analysis
 Watershed Assessment of River Stability and Sediment Supply: Advancing the Science of Watershed Analysis 2009 MWEA Annual Conference Rob Myllyoja, CET rmyllyoja@hrc-engr.com Watershed Assessment of River
Appendix K.2: Sediment Management Excerpt from South Orange County Hydromodification Management Plan
 Appendix K.2: Sediment Management Excerpt from South Orange County Hydromodification Management Plan 4 Sediment Supply Management Requirements Permit Order R9-2013-0001 as amended by Order No. R9-2015-0001Section
Appendix D. Model Setup, Calibration, and Validation
 . Model Setup, Calibration, and Validation Lower Grand River Watershed TMDL January 1 1. Model Selection and Setup The Loading Simulation Program in C++ (LSPC) was selected to address the modeling needs
Great Lakes Dam Capacity Study
 Great Lakes Dam Capacity Study Project Team: USACE, Detroit District Wayne State University, Detroit, Michigan Great Lakes Environmental Center, Traverse City, Michigan BUILDING STRONG Study Objectives