Chapter - 1 Concept of Geo-informatics
|
|
|
- Eric Luke Parks
- 5 years ago
- Views:
Transcription
1 Chapter - 1 Concept of Geo-informatics Key words: Remote sensing, Map Generation, Digitization, Software 1.1 Advent of Spatial Information Technologies While microcomputer made their first appearance three decades ago, it is only in the last 15 years they have become "seriously useable" machines. This situation has occurred as the consequence of a series of developments which includes: faster processing facility; large capacity, high performance and relatively inexpensive hard discs; high resolution colour monitors; CD-ROM players becoming near universal; and availability of inexpensive, high quality colour output devices and colour scanners. These hardware technology changes have gone in parallel with changes in better data conversion, software for scanners, better software for image manipulation and storage, and improvements in database management system. The innovation and development in computer, communication and software is contributing towards the growth of information technology. The present day low cost single user personal computer made its debut in the world in early The net result of these changes is that it is now relatively easy to create, store, retrieve, and analyze large quantities of spatial and non-spatial data of urban and transportation system. A related change is the rapid development of spatial information technologies such as Remote Sensing (RS), Global Positioning System (GPS) and Geographical Information System (GIS). The relevance of spatial information technologies such as RS, GPS and GIS to transportation field is described in subsequent sections. For understanding the basics of these spatial technologies in detail, readers are suggested to refer some other basic books or online study material on spatial information technologies. 1.2 Remote Sensing (RS) The advent of Remote Sensing through space borne and air-borne platforms and sensors has opened new vistas for modern, scientific surveying of earth s natural resources. Remote sensing data is the name given to any data where information about a location is collected remotely, i.e. from a different location, such as collecting information about the ground surface from inside an aircraft. Remote sensing is the science (and to some extent, art) of acquiring information about the earth surface without actually being in contact with it. This is done by sensing and recording the reflected or emitted energy and processing, analyzing, and 1

2 applying that information. The main components of Remote Sensing are shown in the figure 1.1. Figure 1.1: Components of Remote Sensing Where: A - Energy source or illumination B Radiation and atmosphere C Interaction with the target D Recording of the energy by the sensor E Transmission, reception and processing F Interpretation and analysis G - Application Remote sensing provides valuable terrain data over vast areas with repetitive coverage in multi-spectral range, adequate resolutions and also stereoscopic coverage. All these facilities have greatly enhanced the scope for improved terrain mapping, mapping inaccessible areas, monitoring of developments, planning field traverses, land use quantification, as well as urban and transportation system surveys for development & management. Conventional ground methods of land use mapping are labour intensive, time consuming and are done relatively infrequently. These maps soon become outdated with passage of time, particularly in a rapidly changing urban environment. In recent years, satellite remote sensing techniques have been developed, which have proved to be of immense value for preparing accurate land-use and land cover maps and monitoring changes at regular intervals of time. In 2
3 case of urban areas, this technique is perhaps the suitable method of obtaining the required data on a cost and time- effective basis. Since the status of land such as built up area, area available for future development is an important input for land use - transportation studies, the land cover analysis on satellite imageries is very relevant and useful. In a past study, the RS technology was adopted to assess the area under various land uses as input for preparation of Indore City development plan. Similarly, land use/land cover mapping was carried out for Saharanpur City using RS and GIS techniques to find the land use status. More recently, the complete land use quantification at Traffic Analysis Zone (TAZ) level for Mumbai Metropolitan Region was carried out using RS satellite imageries and GIS for the comprehensive transport study. 1.3 Global Positioning System (GPS) Global Positioning System (GPS) has tremendous potential for better transport management/planning. Traffic management, emergency services (fire service, accident relief, ambulance service, policing, etc.), are the few areas where GPS can play significant role due to its capability to provide near accurate location (latitude, longitude, altitude) and other details. Traffic routing, movement of vehicles, VIP movement, taxi service, fleet management for passenger and cargo services etc. becomes easier by using GPS receivers on vehicles. Use of GPS along with GIS database of the city can help to perform the above tasks more effectively. GPS is also very useful in creating accurate spatial databases. Global positioning system is an earth-orbiting Satellite based system that provides signals anywhere on or above earth, 24 hours a day, round the year, and irrespective of weather, and that can be used to determine precise time and the position of a GPS receiver in three dimensions. This technology is increasingly used as input for GIS particularly for precise positioning of geo-spatial data and for collection of data from the field. One major advantage is its capability of forming a powerful building block in an integrated system. GPS together with a co-ordinate system and GIS produces a map and the map facilitates navigation. GPS is rapidly becoming an important tool to the GIS and Remote sensing industries Concept of GPS GPS consists of a constellation of radio navigation satellite and a ground control segment. It manages satellite operation and users with specialized receivers who use the satellite data to satisfy a broad range of positioning requirements. 3

4 In brief, following are the key features of GPS:- 1 The basis of GPS is triangulation more precisely trilateration from satellites 2 A GPS receiver measures distance using the travel time of radio signals. 3 To measure travel time GPS needs very accurate timing that is achieved with some techniques. 4 Along with distance, one needs to know exactly where the satellites are in space. 5 Finally one must correct for any delays, the signal experience as it travels through the atmosphere. The whole idea behind GPS is to use satellites in space as reference points for location here on earth. By very accurately measuring the distances from at least three satellites, we can triangulate our position anywhere on the earth by resection method GPS Elements GPS has 3 parts: the space segment, the user segment, and the control segment, Figure-1.2 illustrates the same. The space segment consists of a constellation of 24 satellites, each in its own orbit, which is 11,000 nautical miles above the Earth. The user segment consists of receivers, which can be held in hand or mount in the vehicle. The control segment consists of ground stations (six of them, located around the world) that make sure the satellites are working properly. More details on each of these elements can be referred from any standard book or online literature on GPS. Figure 1.2: GPS segments 4
5 1.3.3 GPS Satellite Navigation System GPS is funded and controlled by the U. S. Department of Defense (DOD). While there are many thousands of civil users of GPS worldwide, the system was designed for and is operated by the U. S. military. It provides specially coded satellite signals that can be processed in a GPS receiver, enabling the receiver to compute position, velocity and time. Four GPS satellite signals are used to compute positions in three dimensions and the time offset in the receiver clock GPS Positioning Techniques GPS positioning techniques may be categorized as being predominantly based on code or carrier measurements. Code techniques are generally simple and produce low accuracy, while carrier techniques are more complex and produce higher accuracy. There exist a variety of positioning methods for both code and carrier measurements. The suitability of each for a specific application is dependent on the desired accuracy, logistical constraints and costs. Many variables affect this accuracy, such as the baseline lengths, ionospheric conditions, magnitude of selective availability, receiver types used, and processing strategies adopted Differential GPS (DGPS) The technique used to augment GPS is known as differential. The basic idea is to locate one or more reference GPS receivers at known locations in users vicinities and calibrate ranging errors as they occur. These errors are transmitted to the users in near real time. The errors are highly correlated across tens of kilometers and across many minutes. Use of such corrections can greatly improve the accuracy and integrity. To increase the accuracy of positioning, Differential-GPS (D-GPS) was introduced. The idea is as follows: a reference station is located at a known and accurately surveyed point. The GPS reference station determines its GPS position using four or more satellites. Given that the position of the GPS reference station is exactly known, the deviation of the measured position to the actual position and more importantly the measured pseudo range to each of the individual satellites can be calculated. The differences are either transmitted immediately by radio or used 5
6 afterwards for correction after carrying out the measurements. The man made error like Selective Availability can be corrected using this GPS applications in Transportation Due to the high accuracy, usability, ease and economy of operations in all weather, offered by GPS, it has found numerous applications in many fields ranging from accuracy level of mm for the high precision geodesy to several meters for navigational positioning. Some of the applications in urban and transportation field are: i) establishment of ground control points for imageries / map registration, ii) determination of a precise geo ID using GPS data, iii) survey control for topographical and cadastral surveys, iv) air, road, rail, and marine navigation, v) intelligent traffic management system, vi) vehicle tracking system etc. Some of these applications will be described in detail in subsequent chapters. 1.4 Geographical Information System (GIS) In the highly dynamic and complex world 'information' has become a critical resource for effective and efficient management of organisation. Information Technology in its various forms is enabling organizations to churn raw data into meaningful information for effective decision making. One such form of Information Technology (IT) is Geographic Information System (GIS). It is described as: An organized collection of computer hardware, software, geographic data and personnel designed to efficiently capture, store, update, manipulate, analyze, and display all forms of geographically referenced information. According to this definition and as shown in Figure.1.3, GIS includes not only computing capability and data, but also manages the users, and organizations within which they function and institutional relationships that govern their management and use of information. GIS system design and implementation planning are not a separate process. They must occur in conjunctions with one another Elements of GIS The major elements of GIS are geography-the actual location, information- the description of the location, and the system to integrate and perform the required GIS functions. 6

7 Figure 1.3: Domains of GIS i) Geographic: The system is concerned with data relating to geography and geographic scales of measurement. This is referenced by some coordinate system to locations on the surface of the earth. ii) Information: The system allows for the storage and extraction of specific and meaningful attributes information. These data are connected to some geography and are organized around a model of the real world. Spatial and non-spatial queries are made possible. iii) System: An automated system should include an integrated set of procedures for the input, storage, manipulations and output of geographic information. GIS is an integrated single platform of three areas viz. the relational database management system to store spatial and non-spatial data; cartographic capabilities to depict, graph and plot geographic information; and spatial analytical capabilities to facilitate manipulation and spatial analysis Components of GIS There are four components of GIS: (1) data, (2) hardware, (3) software, and (4) users. As shown in Figure 1.4, the components must be integrated to support the management and analysis of spatial or mapped data. Data tends to be at the center of any GIS system, while the computer components of the system support the data management and analysis. 7

8 Figure 1.4: Components of GIS Data GIS components are dynamic; there has been rapid change in the computing industry as well as turnover of personnel involved in GIS projects. For this reason, GIS developers are often encouraged to adopt a data-centered approach. Simply stated, a data-centered approach views data as the central resource in the GIS. Though data may be shared among multiple users and multiple hardware/software environments, the data is collected and compiled by a person or organization to support the goal of that user. The other components provide the support needed to process that data. All data in a GIS are either spatial data or attribute data. As discussed above, spatial data tells us where something occurs. Attribute data tells what occurs; it tells us the nature or characteristics of the spatial data. Every GIS provides the ability to store and manipulate both the spatial data and the associated attribute data. Spatial data includes information pertaining to location of objects of interest, their distribution and extent, adjacency, proximity and connectivity, verses, attribute data, or observations about features Hardware Computer hardware used to support GIS is a highly variable part of the overall system. Users will customize their hardware environment to best meet their own individual needs. In all cases, however, a fully functional GIS must contain hardware to support data input, output, storage, retrieval, display, and analysis. 8
9 Software Software is also a highly dynamic part of the system with large number of GIS software packages existing now. These systems are available for almost all types of hardware platforms and come with a wide variety of functional capabilities. The range in software options goes from generic turnkey systems that are ready for use "right out of the box" to customized installations designed to support specific user needs, like TransCAD (a GIS software tailor made for transport applications). Given that sometimes-bewildering array of choices for hardware and software, selection and use of a GIS should be approached strategically. In all cases, anyone considering a GIS software package should consider needs carefully and consult various references, including other users, vendors, and technical publications Users The final component required for a true GIS is users. The term "user" may refer to any individual who will use GIS to support project or program goals, or to an entire organization that will employ GIS in support of its overall mission. GIS users are often envisioned as hands-on computer processing people. While this is in part true, we choose to define a broader spectrum of GIS users. One classification scheme classifies users into two groups: system users and end users. System users are those persons who have actual hands-on use of the GIS hardware and software. These persons have advanced technical skills in the application of GIS to problem solving. System users tend to be responsible not only for the day-to-day use of the system, but also for system maintenance and upkeep. End users are those persons who do not have actual hands-on use of the system but who do make use of the information products generated via the GIS. End users do not necessarily have to possess hands-on technical skills. However, they must be able to communicate effectively and interact with system users in order to make requests for information products, and must also understand the limitations and requirements of GIS-based processing. 9

 information, or infrastructure such as roads, Traffic Analysis Zones (TAZ), pipelines, power lines, or")
10 1.4.3 Conceptualization of GIS Conceptually, a GIS can be envisioned as a stacked set of map layers, where each layer is aligned or registered to all other layers. Typically, each layer will contain a unique geographic theme or data type. The GIS database stores both the spatial data (where something occurs) and the attribute data (characteristics of the spatial data) for all of the features shown on each layer. These themes may include, for example, topography, soils, land-use, cadastral (land ownership) information, or infrastructure such as roads, Traffic Analysis Zones (TAZ), pipelines, power lines, or sewer networks. Figure 1.5 gives a schematic view of geographic layer system in GIS. By sharing mutual geography, all layers in the GIS can be combined or overlaid in any user-specified combination. Figure 1.5: Mapping layers of GIS Maps and Map Data Handling Before examining the individual components and functions of GIS, it will be helpful to consider the nature of maps and mapped data. A GIS works with observations or measurements that can be tied to a specific geographic location on the ground. Another common term for mapped data is spatial data. Spatial data vary with location, so the nature of the data that we collect, measure, and interpret will change as we consider various locations on the earth's surface. Observations of the earth's surface are recorded on maps to portray the 10
11 spatial data in a format that is easy for humans to comprehend. Maps, as devices used to communicate the nature of spatial data, are the focus of the next section. All maps are simplifications of the real world. The true earth is infinitely complex and it is not possible to depict on a map all of the real earth features that we might be interested in. As a simplified image of the earth, maps can be called models of reality. Though they are simplifications, these models are quite sophisticated, and the science of map making, called cartography, is a formal geographic science. A true map must accurately show not only what the nature of the mapped variable is (in correct proportion), but also must correctly place all mapped data in their true geographic locations. The geographic location of spatial data can be classified into two types: absolute and relative. Absolute location refers to a unique and standardized place or position, while relative location defines position based on the location of other variables or phenomena. Absolute geographic position is specified using a universal coordinate system such as Latitude/Longitude or Universal Transverse Mercator (UTM) coordinates. These universal coordinate systems allow both the mapmaker and the map user to specify a unique and definite position for every location on both the earth and maps of the earth. This unique location, which is "tagged" to all spatial data, is critical to being able to store and analyze data in a GIS. It is this geographic tag or characteristic that distinguishes GIS as a technology that focuses on mapped data. Generally there are three classes or families of map projections. Each geometric shape is used to transform the globe (a curved surface) to a plane (the map surface). These three families are called "developable" surfaces because planes, cones, and cylinders can be "flattened" without distortion (Figure 1.6). Azimuthal or planar projections use a flat two-dimensional surface to develop the map, conical projections are transformed onto a cone wrapped around the globe, which is then flattened, and the cylindrical family of maps is projected onto a cylinder wrapped around the globe. Different projections are selected to minimize specific types of distortions in distance, direction, shape and area found on all flat maps. 11
 to that same distance as it is shown on a map. This relationship is often stated as a ratio of the two distances.")

12 Figure 1.6: Map Projection GIS developers and users must also concern themselves with map scale. Scale is the mathematical relationship of real earth distance (ground distance) to that same distance as it is shown on a map. This relationship is often stated as a ratio of the two distances. As mentioned above, all maps are models or simplifications of reality. Maps also are reductions of reality. That is, the ratio of map to ground distance is normally much less than one. Maps to be stored in a GIS must be similar in scale if they are to be manipulated together. Maps with widely varying scales cannot be accurately combined. Thus, the user of either traditional paper maps or computerized GIS maps is fundamentally restricted by the degree of scale difference between map manuscripts. Maps with large differences in scale (e.g., 1: 2, 50,000 vs. 1: 9,600) cannot be registered and overlaid without serious distortion and probable error Functions of GIS As stated earlier in the chapter: a GIS is a computerized, integrated system used to compile, store, manipulate, and output mapped data. This section will examine each of these functions Data Compilation Data compilation involves assembling all the spatial and attributes data that are to be stored in a computerized format within the GIS. Map data with common projections, scales, and coordinate systems must be pulled together in order to establish the centralized GIS database. Data must also be examined for compatibility in terms of content and time of data collection. Ultimately, the data will be stored in a GIS according to the specific format requirements set by both the user and the chosen GIS software/hardware environment. 12

13 When all of the common data requirements are set by the GIS user, a "base map" has been established. A base map is a set of standard requirements for data. It provides accurate standards for geographic control, and also defines a model or template that is used to shape all data into a compatible form. A base map is not necessarily a map; rather, it is a comprehensive set of standards established and enacted to ensure quality control for the spatial and attribute data contained in the GIS. Once the data are assembled and base map parameters are set; the user must translate the map and attribute data into computer-compatible form. This conversion process referred to as "conversion" or "digitizing" converts paper maps into numerical digits that can be stored in the computer. Digitizing can be performed using various techniques. Scanning is one technique. Another technique of digitization uses a tablet and a tracing stylus (Figure 1.7). Digitizing simplifies map data into sets of points, lines, or cells that can be stored in the GIS computer. Each GIS software package will impose a specific form and design on the way that these sets of points, lines, and cells are stored as digital map files. Figure 1.7: Digitizer Digitization is a simplification process that converts all spatial data to a point (e.g., traffic intersection), a line (e.g., a transport link), a polygon formed by a closed, complex line [e.g., Traffic Analysis Zone (TAZ)], or a grid cell. Digitization reduces all spatial entities to these simple forms because they are easy to store in the computer. A GIS database cannot readily recognize features or entities as human map users do. For example, we cannot enter the entity 13
14 "TAZ" into a GIS. Rather, we enter the spatial data coordinates for the TAZ's boundary as a polygon. Later, the attributes of the TAZ will be entered into the GIS database and will be associated with the polygon. Following the digitization of map features, the user completes the compilation phase by relating all spatial features to their respective attributes, and by cleaning up and correcting errors introduced as a result of the data conversion process. The end result of compilation is a set of digital files each accurately representing all of the spatial and attributes data of interest contained on the original map manuscripts. These digital files contain geographic coordinates for spatial objects (points, lines, polygons, and cells) that represent mapped features Storage Once the data have been digitally compiled, digital map files in the GIS are stored on magnetic or other (e.g., optical) digital media. Again, different GIS software packages will employ different storage formats. In most cases, however, data storage will be based on a generic data model that is used to convert map data into a digital form. The two most common types of data models are raster and vector. Both types are used to simplify the data shown on a map into a more basic form that can be easily and efficiently stored in the computer Raster Image The raster approach for storing map data in a GIS is perhaps the most intuitive. Figure 1.8 shows the essential step involved in converting a map to a raster format. First, a gridded matrix is registered to and overlaid on the original map manuscript. The row and column coordinates of each cell define location in the grid. To encode the map data for each cell in the raster format, three pieces of data are recorded: the row coordinate, the column coordinate, and the attribute. Thus a triplet of data is recorded for each cell in the array, which is termed a raster. After map data are stored in a raster format, each cell in the raster corresponds to a location on the map and each cell's location in the raster is identified by row and column coordinates. By assigning a value to each cell, the corresponding attribute data for that location are also stored. The end result of this conversion process is a set of cells, each with a specified location and an attribute value. These data can then be entered into a computer-compatible file and stored in the GIS database. 14
 and storage requirements (increasing the number of rows and columns causes")

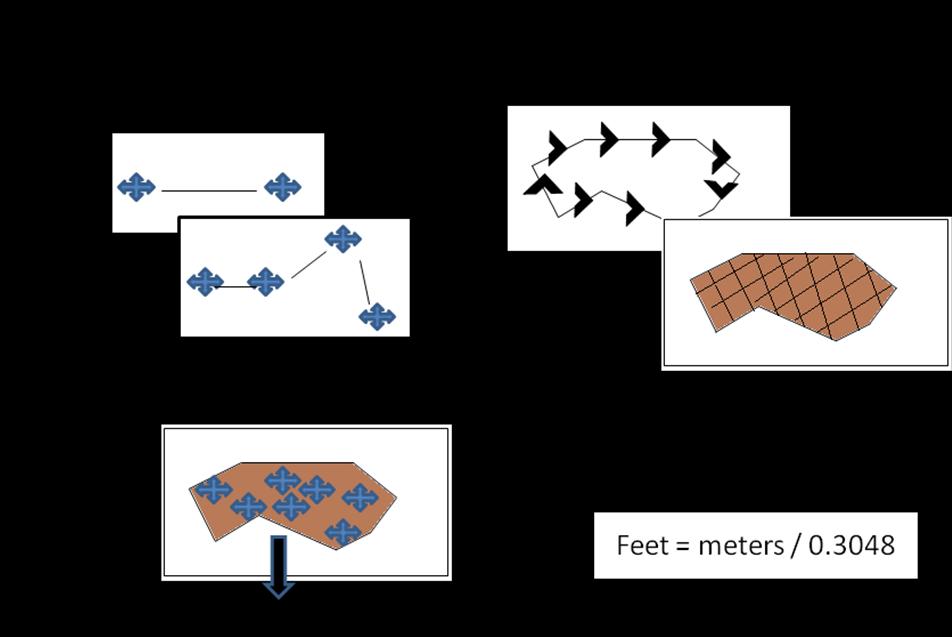
15 Figure 1.8: Raster Image Perhaps the most critical issue in using a raster GIS is the selection of an appropriate grid cell size. The user is forced to examine the trade-off between data resolution (how small grid cells are in the raster array) and storage requirements (increasing the number of rows and columns causes exponential increase in storage requirements). The use of smaller cells records greater detail in the GIS, so the user would normally attempt to select the smallest practical cell size. The choice of cell size depends on many factors, including the resolution of the original map data, the degree of resolution needed in the GIS analysis, the time and money available for data compilation, available storage space on the GIS computer, and cell sizes already employed for previously existing raster data that the user may want to incorporate into the GIS database Vector Image A vector data structure is very different from a raster data model. Whereas the raster data model uses sets of grid cells to record all data, a vector model stores all spatial data as a point, line, or polygon. These three types of spatial data are referred to as features, and a vector GIS can be termed a feature-based technology. Figure 1.9 shows an example of a vector data model. When a vector model represents an entity as a point (e.g., a traffic intersection or a bus stop location), a single coordinate pair is used to specify its location. A feature represented as a line (e.g., a road or rail link) uses a linked set of coordinates, and a feature represented as a polygon, which is an alternative form of a line (e.g., a TAZ), must 15

16 have the same beginning and ending point coordinates. In a raster model, a point is a single cell, a line is a linked set of cells, and a polygon is a group or neighborhood of similarly encoded cells. For all three types of features stored in a vector GIS, an attribute code is entered into the GIS files to identify the object. For example, a TAZ would be vectorized (added to the database as a vector map) as a polygon by storing the linked set of coordinates for the boundary line and the attribute code "TAZ" would be entered in the GIS files to identify that group of cells. Figure 1.9: Vector Data Manipulation Once data are stored in a GIS, many retrieval, analysis, and output options are available to users. These functions are often available in the form of "toolkits." A toolkit is a set of generic functions that a GIS user can employ to manipulate and analyze geographic data. Toolkits provide processing functions such as data retrieval, measuring area and perimeter, overlaying maps, performing map algebra, and reclassifying map data. A GIS usually includes a basic set of computer programs or "tools." The functions provided by the toolkit vary with the software package. Figures 1.10 and Fig 1.11 provides an overview of various tool functions. Data manipulation tools include coordinate change, projection, and edge matching, which allow a GIS to reconcile irregularities between map layers or adjacent map sheets called "tiles." Query and windowing are spatial retrieval tools. Query provides a way 16


17 to retrieve user-specified data from the database. Windowing allows the user to select a specified area from a map displayed on the monitor to examine it in greater detail as shown in Figure


18 Figure 1.10: Manipulation tools of GIS Data analysis tools shown in Figure 1.11 include aggregation, classification, measurement, overlay, buffering, networks, and map algebra. Aggregation helps the user in interpreting the data, classification allows the user to classify areas within a map, and measurement can be used to determine the size of any area. The overlay function allows the user to "stack" map layers on one another. Buffering examines an area that surrounds a feature of interest such as a point. Network functions examine the movement of objects along an interconnected pathway (e.g., traffic flow along a map of highway segments). Map algebra utilities allow the user to specify mathematical relationships between map layers. 18


19 19


20 Figure 1.11: Data Analysis Tools of GIS Output The final functional task of a GIS is to generate output; usually a map. GIS-generated maps are compiled from the many data sets contained in the digital GIS and match exact user specifications. Map output may employ several color and symbology schemes, and will be sized and scaled to meet user needs. These output products resemble hand-drafted maps and fulfill essentially the same purposes. However, it is incorrect to refer to GIS simply as a mapping system. Although GIS is able to generate high-quality map output, its ability to perform analysis and management sets it apart from the more limited computer-mapping packages. Another form of output from a GIS is tabular or reports information. Data summarized according to user-defined classes or within user-defined areas can readily be generated in a textual format. This output may also be routed to another computer application such as a statistical analysis package or a graphing package for subsequent analysis and display Common terms in GIS The followings are the very frequently used terms in the context of GIS. i) Map: Usually a two-dimensional representation of all or part of the earth s surface. ii) Map Projection: The basic system of coordinates used to describe the spatial distribution of elements in a GIS. 20
21 iii) Layer: A logical separation of mapped information according to theme. Many geographical information systems and CAD/CAM systems allow user to choose and work on a single layer or any combination of layers at a time. iv) Mosaic: Process of putting various parts of the study area together, or the result of putting various parts together. v) Overlay: A record on a transparent medium to be superimposed on another record. vi) Thematic map: A map displaying selected kinds of information relating to specific themes, such as land use, population, vehicle ownership, and so on. vii) Topology: The way in which geographical elements are linked together and relate to one another in space. Topological structure essentially maintains the spatial relationships inherent in the terrain data and that is obvious to the human mind when visually examining a graphic representation of data. viii) Network: In general, this term refers to a set of components connected by channels. In the context of transportation, it normally refers to a network of highways, arterial roads, public transport, rail etc. 1.5 Spatial Information Technology & Transportation GIS, since its inception about 30 years ago, has enjoyed an esoteric status. It had to wait till the '90s before its application in the various sectors has started to be exploited. Many organizations now spend large amount of money on GIS and on geographic data. The reason being; the cost of computer hardware needed for the task is dropping rapidly and, thus affordable to an increasingly wider sector. More importantly, geography (and the data describing it) is part of our everyday world; almost every decision we make is constrained, influenced or dictated by some fact of geography. Traffic impact assessment due to change in land use, transport network modification to meet the requirement of contemporary needs of the society, sending fire fighting trucks by shortest available path, feasibility study for introduction of new transportation system and critical analysis of utility planning/renewal in the complex urban streets are all associated with configuration of urban area and transport network. Since city development organizations are responsible for formulating, planning, implementing and monitoring of development of urban 21
 conceived from the point of view of union of an enhanced Transportation Information System (TIS) and an enhanced GIS.")
22 areas and transportation system, they should logically be natural client of GIS technology tools. Figure.1.12 depicts GIS for Transportation (GIS-T) conceived from the point of view of union of an enhanced Transportation Information System (TIS) and an enhanced GIS. The necessary enhancement to existing TIS is the structuring of the attribute data base to provide consistent location reference data in a form compatible with the GIS, which in turn has been enhanced to represent and process geographic data in the forms required for transportation application. This does not imply that databases must be redesigned according to the constraints imposed by the software. In fact, one of the required enhancements to off- the shelf GIS software is the ability to link with and utilize all or nearly all of the linearly referenced transportation data collected and maintained by the transportation organization. Figure 1.12: GIS T (Enhanced GIS and TIS) 1.6 GIS and RS Soft ware s for Transportation There are software packages like Arc GIS, Intergraph MGE, Auto desk Map, Atlas GIS, MapInfo, Geo SQL, GRASS, Small world GIS, Erdas Imagine, TransCAD etc. available for application of Land use and Transportation Planning and monitoring, TransCAD is a GIS software package developed exclusively for planning, management operation and analysis of transportation systems and facilities. The salient features of TransCAD and Erdas Imagine are described below. 22

23 1.6.1 TransCAD TransCAD is the Geographic Information System (GIS) designed specifically for use by transportation professionals to store, display, manage, and analyze transportation data. TransCAD combines GIS and transportation modeling capabilities in a single integrated platform, providing capabilities that may not be available in other packages. TransCAD can be used for all modes of transportation, at any scale or level of detail. Some transportation themes and charts are shown in Figure 1.13 Figure 1.13: Themes and Charts in TransCAD It is a powerful GIS engine with special extensions for transportation mapping, visualization, and analysis tools designed for transportation applications. It also provides application modules for routing, travel demand forecasting, public transit, logistics, site location, and territory management. TransCAD has applications for all types of transportation data and for all modes of transportation, and is ideal for building transportation information and decision support systems. TransCAD runs on readily available hardware under Microsoft Windows and embraces virtually all desktop-computing standards. It is the only software package that fully integrates GIS with demand modeling and logistics functionality. There are many reasons why it is valuable to have a GIS as part of a planning or routing and logistics package. 23
24 First, GIS makes it possible for models to be much more accurate. Network distances and travel times are based on the actual shape of the road network and a correct representation of highway interchanges. Also, with networks one can specify complex road attributes such as truck exclusions, delays at intersections, one-way streets, and construction zones. Second, the entire modeling process is more efficient. Data preparation is greatly facilitated and the database and visualization capabilities catch errors before they cause problems. A third advantage is the GIS itself. In TransCAD, different modeling equations can easily be derived and applied for different geographic subareas. Similarly, TransCAD brings new and much-needed capabilities for measuring geographic accessibility. Lastly, the GIS approach provides a graphical solution that is easily understood. Users can convey highly technical information to the non-practitioner in a very straightforward and understandable manner Erdas Imagine Imagery is far more than pictures of the earth s surface. It is a valuable source of data that captures actual events at specific times and places in the world so that we can study how the earth changes over time. ERDAS IMAGINE gives you the tools to manipulate and understand this data Comprehensive Toolbox ERDAS IMAGINE is a broad collection of software tools designed specifically to process imagery. It allows the user to extract data from images like a seasoned professional, regardless of the experience or education Easy to Use With its large and easy-to-use selection of image processing tools, ERDAS IMAGINE both simplifies and streamlines the workflow. It also allows the user to keep in-house many of the functions we may have needed to outsource before Imagery 24
25 Historically, imagery has been difficult to obtain and even more difficult to process. Now, however, the world of imagery has changed so dramatically over the past ten years, that there is really no reason for a GIS professional not to use it on a regular basis Geospatial Information Up-to-date imagery from satellites or aerial photography can dramatically increase the success of many GIS projects Geospatial Information: Improved Decision-Making Using GIS Data Geographic imaging professionals use a wide variety of data and image analysis tools to solve geographically related problems every day. Data derived from imagery is analyzed and applied to result in better, more informed decision making through this software Planning Future Land Use Erdas Imagine software is powerful software for satellite imagery analysis. Since the initial important input for transportation planning is based on land use / land cover characteristics, the digital image processing such as classification, grouping of land uses etc can be done efficiently. Map registration and mosaicking tools are useful for geo-referencing of satellite imageries to the Ground Control Points (GCP) acquired through Global Positioning System Survey. Exercise 1. Write a short note on remote sensing? 2. Discuss about GIS and its applications? 3. What is GPS and what are its functions? 4. What are the different types of data models in GIS? 5. Explain digitization? What is map projection and what are the different types of map projections? Assignments 1. Study typical GIS related software and prepare a comparative report. 2. Study a GPS instrument and use it for recording coordinates of various features. 25
DATA SOURCES AND INPUT IN GIS. By Prof. A. Balasubramanian Centre for Advanced Studies in Earth Science, University of Mysore, Mysore
 DATA SOURCES AND INPUT IN GIS By Prof. A. Balasubramanian Centre for Advanced Studies in Earth Science, University of Mysore, Mysore 1 1. GIS stands for 'Geographic Information System'. It is a computer-based
GIS = Geographic Information Systems;
 What is GIS GIS = Geographic Information Systems; What Information are we talking about? Information about anything that has a place (e.g. locations of features, address of people) on Earth s surface,
What are the five components of a GIS? A typically GIS consists of five elements: - Hardware, Software, Data, People and Procedures (Work Flows)
") LECTURE 1 - INTRODUCTION TO GIS Section I - GIS versus GPS What is a geographic information system (GIS)? GIS can be defined as a computerized application that combines an interactive map with a database
LECTURE 1 - INTRODUCTION TO GIS Section I - GIS versus GPS What is a geographic information system (GIS)? GIS can be defined as a computerized application that combines an interactive map with a database
What is GIS? Introduction to data. Introduction to data modeling
 What is GIS? Introduction to data Introduction to data modeling 2 A GIS is similar, layering mapped information in a computer to help us view our world as a system A Geographic Information System is a
Understanding Geographic Information System GIS
 Understanding Geographic Information System GIS What do we know about GIS? G eographic I nformation Maps Data S ystem Computerized What do we know about maps? Types of Maps (Familiar Examples) Street Maps
a system for input, storage, manipulation, and output of geographic information. GIS combines software with hardware,
 Introduction to GIS Dr. Pranjit Kr. Sarma Assistant Professor Department of Geography Mangaldi College Mobile: +91 94357 04398 What is a GIS a system for input, storage, manipulation, and output of geographic
Overview key concepts and terms (based on the textbook Chang 2006 and the practical manual)
") Introduction Geo-information Science (GRS-10306) Overview key concepts and terms (based on the textbook 2006 and the practical manual) Introduction Chapter 1 Geographic information system (GIS) Geographically
Introduction Geo-information Science (GRS-10306) Overview key concepts and terms (based on the textbook 2006 and the practical manual) Introduction Chapter 1 Geographic information system (GIS) Geographically
Introduction to GIS. Dr. M.S. Ganesh Prasad
 Introduction to GIS Dr. M.S. Ganesh Prasad Department of Civil Engineering The National Institute of Engineering, MYSORE ganeshprasad.nie@gmail.com 9449153758 Geographic Information System (GIS) Information
INTRODUCTION TO GEOGRAPHIC INFORMATION SYSTEM By Reshma H. Patil
 INTRODUCTION TO GEOGRAPHIC INFORMATION SYSTEM By Reshma H. Patil ABSTRACT:- The geographical information system (GIS) is Computer system for capturing, storing, querying analyzing, and displaying geospatial
FUNDAMENTALS OF GEOINFORMATICS PART-II (CLASS: FYBSc SEM- II)
") FUNDAMENTALS OF GEOINFORMATICS PART-II (CLASS: FYBSc SEM- II) UNIT:-I: INTRODUCTION TO GIS 1.1.Definition, Potential of GIS, Concept of Space and Time 1.2.Components of GIS, Evolution/Origin and Objectives
FUNDAMENTALS OF GEOINFORMATICS PART-II (CLASS: FYBSc SEM- II) UNIT:-I: INTRODUCTION TO GIS 1.1.Definition, Potential of GIS, Concept of Space and Time 1.2.Components of GIS, Evolution/Origin and Objectives
GIS (GEOGRAPHIC INFORMATION SYSTEMS)
") GIS (GEOGRAPHIC INFORMATION SYSTEMS) 1 1. DEFINITION SYSTEM Any organised assembly of resources and procedures united and regulated by interaction or interdependence to complete a set of specific functions.
GIS (GEOGRAPHIC INFORMATION SYSTEMS) 1 1. DEFINITION SYSTEM Any organised assembly of resources and procedures united and regulated by interaction or interdependence to complete a set of specific functions.
GIS Workshop Data Collection Techniques
 GIS Workshop Data Collection Techniques NOFNEC Conference 2016 Presented by: Matawa First Nations Management Jennifer Duncan and Charlene Wagenaar, Geomatics Technicians, Four Rivers Department QA #: FRG
An Introduction to Geographic Information System
 An Introduction to Geographic Information System PROF. Dr. Yuji MURAYAMA Khun Kyaw Aung Hein 1 July 21,2010 GIS: A Formal Definition A system for capturing, storing, checking, Integrating, manipulating,
GEOGRAPHIC INFORMATION SYSTEMS Session 8
 GEOGRAPHIC INFORMATION SYSTEMS Session 8 Introduction Geography underpins all activities associated with a census Census geography is essential to plan and manage fieldwork as well as to report results
Techniques for Science Teachers: Using GIS in Science Classrooms.
 Techniques for Science Teachers: Using GIS in Science Classrooms. After ESRI, 2008 GIS A Geographic Information System A collection of computer hardware, software, and geographic data used together for
GIS INTEGRATION OF DATA COLLECTED BY MOBILE GPSSIT
 GIS INTEGRATION OF DATA COLLECTED BY MOBILE GPSSIT S.Savaş DURDURAN, Özşen ÇORUMLUOĞLU, Đbrahim KALAYCI and Fatih GÜL Selcuk University, Geodesy and Photogrammetry Dept. Konya-TURKĐYE ABSTRACT: Rapid developments
Geographical Information System (GIS) Prof. A. K. Gosain
 Prof. A. K. Gosain") Geographical Information System (GIS) Prof. A. K. Gosain gosain@civil.iitd.ernet.in Definition of GIS GIS - Geographic Information System or a particular information system applied to geographical data
Geographical Information System (GIS) Prof. A. K. Gosain gosain@civil.iitd.ernet.in Definition of GIS GIS - Geographic Information System or a particular information system applied to geographical data
Syllabus Reminders. Geographic Information Systems. Components of GIS. Lecture 1 Outline. Lecture 1 Introduction to Geographic Information Systems
 Syllabus Reminders Geographic Information s Lecture Introduction to Geographic Information s. Class Info: www.saigis.com/class/ 2. Office T / TH (8:00-9:30 a.m.) and (2:30 3:30pm) or Appt 3. Email: burgerpr@unk.edu
Introduction to GIS I
 Introduction to GIS Introduction How to answer geographical questions such as follows: What is the population of a particular city? What are the characteristics of the soils in a particular land parcel?
M.Y. Pior Faculty of Real Estate Science, University of Meikai, JAPAN
 GEOGRAPHIC INFORMATION SYSTEM M.Y. Pior Faculty of Real Estate Science, University of Meikai, JAPAN Keywords: GIS, rasterbased model, vectorbased model, layer, attribute, topology, spatial analysis. Contents
STEREO ANALYST FOR ERDAS IMAGINE Stereo Feature Collection for the GIS Professional
 STEREO ANALYST FOR ERDAS IMAGINE Stereo Feature Collection for the GIS Professional STEREO ANALYST FOR ERDAS IMAGINE Has Your GIS Gone Flat? Hexagon Geospatial takes three-dimensional geographic imaging
INTRODUCTION AND PRINCIPLES OF GIS. Sunil Kumar. Introduction
 INTRODUCTION AND PRINCIPLES OF GIS Introduction Sunil Kumar Director, NWA Geographic Information System (GIS) is a computer based system designed to accept large volume of spatial data derived from a variety
Key Issue #1. How do geographers describe where things are? 2014 Pearson Education, Inc.
 Key Issue #1 How do geographers describe where things are? Learning Outcomes 1.1.1: Explain differences between early maps and contemporary maps. 1.1.2: Describe the role of map scale and projections and
Basics of GIS. by Basudeb Bhatta. Computer Aided Design Centre Department of Computer Science and Engineering Jadavpur University
 Basics of GIS by Basudeb Bhatta Computer Aided Design Centre Department of Computer Science and Engineering Jadavpur University e-governance Training Programme Conducted by National Institute of Electronics
Geometric Algorithms in GIS
 Geometric Algorithms in GIS GIS Visualization Software Dr. M. Gavrilova GIS Software for Visualization ArcView GEO/SQL Digital Atmosphere AutoDesk Visual_Data GeoMedia GeoExpress CAVE? Visualization in
ESRI Survey Summit August Clint Brown Director of ESRI Software Products
 ESRI Survey Summit August 2006 Clint Brown Director of ESRI Software Products Cadastral Fabric How does Cadastral fit with Survey? Surveyors process raw field observations Survey measurements define high-order
Geographers Perspectives on the World
 What is Geography? Geography is not just about city and country names Geography is not just about population and growth Geography is not just about rivers and mountains Geography is a broad field that
FIRE DEPARMENT SANTA CLARA COUNTY
 DEFINITION FIRE DEPARMENT SANTA CLARA COUNTY GEOGRAPHIC INFORMATION SYSTEM (GIS) ANALYST Under the direction of the Information Technology Officer, the GIS Analyst provides geo-spatial strategic planning,
Applications: Introduction Task 1: Introduction to ArcCatalog Task 2: Introduction to ArcMap Challenge Question References
 CHAPTER 1 INTRODUCTION 1.1 GIS? 1.1.1 Components of a GIS 1.1.2 A Brief History of GIS 1.1.3 GIS Software Products Box 1.1 A List of GIS Software Producers and Their Main Products 1.2 GIS Applications
Dr. ABOLGHASEM AKBARI Faculty of Civil Engineering & Earth Resources, University Malaysia Pahang (UMP)
") Workshop on : Dr. ABOLGHASEM AKBARI Faculty of Civil Engineering & Earth Resources, University Malaysia Pahang (UMP) 14-15 April 2016 Venue: Tehran, Iran GIS definitions GIS: A simplified view of the real
Workshop on : Dr. ABOLGHASEM AKBARI Faculty of Civil Engineering & Earth Resources, University Malaysia Pahang (UMP) 14-15 April 2016 Venue: Tehran, Iran GIS definitions GIS: A simplified view of the real
Introduction to Geographic Information Systems Dr. Arun K Saraf Department of Earth Sciences Indian Institute of Technology, Roorkee
 Introduction to Geographic Information Systems Dr. Arun K Saraf Department of Earth Sciences Indian Institute of Technology, Roorkee Lecture 01 What is Geographic Information Systems? I welcome to this
Unit 1 The Basics of Geography. Chapter 1 The Five Themes of Geography Page 5
 Unit 1 The Basics of Geography Chapter 1 The Five Themes of Geography Page 5 Geography comes from the Greek word geographia, which means to describe the earth. Geography is the study of the distribution
Advanced Algorithms for Geographic Information Systems CPSC 695
 Advanced Algorithms for Geographic Information Systems CPSC 695 Think about Geography What is Geography The 3 W s of Geography What is where Why is it there Why do I care Data - Data - Data We all got
Display data in a map-like format so that geographic patterns and interrelationships are visible
 Vilmaliz Rodríguez Guzmán M.S. Student, Department of Geology University of Puerto Rico at Mayagüez Remote Sensing and Geographic Information Systems (GIS) Reference: James B. Campbell. Introduction to
Outline. Geographic Information Analysis & Spatial Data. Spatial Analysis is a Key Term. Lecture #1
 Geographic Information Analysis & Spatial Data Lecture #1 Outline Introduction Spatial Data Types: Objects vs. Fields Scale of Attribute Measures GIS and Spatial Analysis Spatial Analysis is a Key Term
Introduction-Overview. Why use a GIS? What can a GIS do? Spatial (coordinate) data model Relational (tabular) data model
 data model Relational (tabular) data model") Introduction-Overview Why use a GIS? What can a GIS do? How does a GIS work? GIS definitions Spatial (coordinate) data model Relational (tabular) data model intro_gis.ppt 1 Why use a GIS? An extension
Introduction-Overview Why use a GIS? What can a GIS do? How does a GIS work? GIS definitions Spatial (coordinate) data model Relational (tabular) data model intro_gis.ppt 1 Why use a GIS? An extension
NR402 GIS Applications in Natural Resources
 NR402 GIS Applications in Natural Resources Lesson 1 Introduction to GIS Eva Strand, University of Idaho Map of the Pacific Northwest from http://www.or.blm.gov/gis/ Welcome to NR402 GIS Applications in
Geographic Information Systems (GIS) in Environmental Studies ENVS Winter 2003 Session III
 in Environmental Studies ENVS Winter 2003 Session III") Geographic Information Systems (GIS) in Environmental Studies ENVS 6189 3.0 Winter 2003 Session III John Sorrell York University sorrell@yorku.ca Session Purpose: To discuss the various concepts of space,
Geographic Information Systems (GIS) in Environmental Studies ENVS 6189 3.0 Winter 2003 Session III John Sorrell York University sorrell@yorku.ca Session Purpose: To discuss the various concepts of space,
Version 1.1 GIS Syllabus
 GEOGRAPHIC INFORMATION SYSTEMS CERTIFICATION Version 1.1 GIS Syllabus Endorsed 1 Version 1 January 2007 GIS Certification Programme 1. Target The GIS certification is aimed at: Those who wish to demonstrate
APPLICATION OF GIS IN ELECTRICAL DISTRIBUTION NETWORK SYSTEM
 See discussions, stats, and author profiles for this publication at: https://www.researchgate.net/publication/305263658 APPLICATION OF GIS IN ELECTRICAL DISTRIBUTION NETWORK SYSTEM Article October 2015
Course Syllabus. Geospatial Data & Spatial Digital Technologies: Assessing Land Use/Land Cover Change in the Ecuadorian Amazon.
 Course Syllabus Geospatial Data & Spatial Digital Technologies: Assessing Land Use/Land Cover Change in the Ecuadorian Amazon Co- Instructors Dr. Carlos F. Mena, Universidad San Francisco de Quito, Ecuador
INDOT Office of Traffic Safety
 Intro to GIS Spatial Analysis INDOT Office of Traffic Safety Intro to GIS Spatial Analysis INDOT Office of Traffic Safety Kevin Knoke Section 130 Program Manager Highway Engineer II Registered Professional
Bentley Map Advancing GIS for the World s Infrastructure
 Bentley Map Advancing GIS for the World s Infrastructure Presentation Overview Why would you need Bentley Map? What is Bentley Map? Where is Bentley Map Used? Why would you need Bentley Map? Because your
ENV208/ENV508 Applied GIS. Week 1: What is GIS?
 ENV208/ENV508 Applied GIS Week 1: What is GIS? 1 WHAT IS GIS? A GIS integrates hardware, software, and data for capturing, managing, analyzing, and displaying all forms of geographically referenced information.
Lecture 9: Reference Maps & Aerial Photography
 Lecture 9: Reference Maps & Aerial Photography I. Overview of Reference and Topographic Maps There are two basic types of maps? Reference Maps - General purpose maps & Thematic Maps - maps made for a specific
History of Cartography,
 Maps History of Cartography, the art and science of making maps ~2300 BC ~600 BC Early oldest known maps: Babylonian clay tablets. Greek and Roman Ptolemy s (about AD 85-165) "world map" depicted the Old
netw rks Guided Reading Activity Essential Question: How does geography influence the way people live? What Is Geography?
 Guided Reading Activity What Is Geography? Lesson 1 Thinking Like a Geographer Essential Question: How does geography influence the way people live? Directions: Read the lesson and use your textbook to
AP Human Geography Chapter 1: Thinking Geographically Key Issue 1: How do Geographers describe where things are?
 AP Human Geography Chapter 1: Thinking Geographically Key Issue 1: How do Geographers describe where things are? Studying Human Geography Physical Geography Physical geography deals with Earth s natural
Imagery and the Location-enabled Platform in State and Local Government
 Imagery and the Location-enabled Platform in State and Local Government Fred Limp, Director, CAST Jim Farley, Vice President, Leica Geosystems Oracle Spatial Users Group Denver, March 10, 2005 TM TM Discussion
THE DEVELOPMENT OF ROAD ACCIDENT DATABASE MANAGEMENT SYSTEM FOR ROAD SAFETY ANALYSES AND IMPROVEMENT
 THE DEVELOPMENT OF ROAD ACCIDENT DATABASE MANAGEMENT SYSTEM FOR ROAD SAFETY ANALYSES AND IMPROVEMENT By T. H. Law Radin Umar R. S. (Road Safety Research Center, Faculty of Engineering, University Putra
The Road to Data in Baltimore
 Creating a parcel level database from high resolution imagery By Austin Troy and Weiqi Zhou University of Vermont, Rubenstein School of Natural Resources State and local planning agencies are increasingly
Projections & GIS Data Collection: An Overview
 Projections & GIS Data Collection: An Overview Projections Primary data capture Secondary data capture Data transfer Capturing attribute data Managing a data capture project Geodesy Basics for Geospatial
These modules are covered with a brief information and practical in ArcGIS Software and open source software also like QGIS, ILWIS.
 Online GIS Training and training modules covered are: 1. ArcGIS, Analysis, Fundamentals and Implementation 2. ArcGIS Web Data Sharing 3. ArcGIS for Desktop 4. ArcGIS for Server These modules are covered
THE CADASTRAL INFORMATION SYSTEM IN THE REPUBLIC OP SOUTH AFRICA
 I $:? Distr.: LIMITED ECA/NRD/CART.9/ORG.27 November 1996 Original: ENGLISH Ninth United Nations Regional Cartographic Conference for Africa Addis Ababa, Ethiopia 11-15 November 1996 THE CADASTRAL INFORMATION
Learning Computer-Assisted Map Analysis
 Learning Computer-Assisted Map Analysis by Joseph K. Berry* Old-fashioned math and statistics can go a long way toward helping us understand GIS Note: This paper was first published as part of a three-part
Combining Geospatial and Statistical Data for Analysis & Dissemination
 Combining Geospatial and Statistical Data for Analysis & Dissemination (with Special Reference to Qatar Census 2010) Presentation by Mansoor Al Malki, Director of IT Department Qatar Statistics Authority
Introduction to Cartography Part II
 Introduction to Cartography Part II Introduction to Cartography Map Projections GIS GPS Remote Sensing Misrepresentation with Maps Map Projections Mathematical method for systematically transforming a
A Basic Introduction to Geographic Information Systems (GIS) ~~~~~~~~~~
 ~~~~~~~~~~") A Basic Introduction to Geographic Information Systems (GIS) ~~~~~~~~~~ Rev. Ronald J. Wasowski, C.S.C. Associate Professor of Environmental Science University of Portland Portland, Oregon 3 September
A Basic Introduction to Geographic Information Systems (GIS) ~~~~~~~~~~ Rev. Ronald J. Wasowski, C.S.C. Associate Professor of Environmental Science University of Portland Portland, Oregon 3 September
8/28/2011. Contents. Lecture 1: Introduction to GIS. Dr. Bo Wu Learning Outcomes. Map A Geographic Language.
 Contents Lecture 1: Introduction to GIS Dr. Bo Wu lsbowu@polyu.edu.hk Department of Land Surveying & Geo-Informatics The Hong Kong Polytechnic University 1. Learning outcomes 2. GIS definition 3. GIS examples
Diffusion of GIS in Public Policy Doctoral Program
 Diffusion of GIS in Public Policy Doctoral Program By Fulbert Namwamba PhD Southern University This presentation demonstrate how GIS was introduced in the Public Policy Doctoral Program at Southern University,
Geographical Information System GIS
 Geographical Information System GIS LOOM.02.331 anto.aasa@ut.ee Scale GIS and spatial planning National Regional Local Strategic (National Dev. Plan) National Goals and development policy Tactical (Regional
You are Building Your Organization s Geographic Knowledge
 You are Building Your Organization s Geographic Knowledge And Increasingly Making it Available Sharing Data Publishing Maps and Geo-Apps Developing Collaborative Approaches Citizens Knowledge Workers Analysts
Applications of GIS in Electrical Power System
 Applications of GIS in Electrical Power System Abdulrahman M. AL-Sakkaf 201102310 CRP 514 May 2013 Dr. Baqer M. AL-Ramadan Abstract GIS has been widely used in various areas and disciplines. This paper
WHAT IS GIS? Source: Longley et al (2005) Geographic Information Systems and Science. 2nd Edition. John Wiley and Sons Ltd.
 Geographic Information Systems and Science. 2nd Edition. John Wiley and Sons Ltd.") WHAT IS GIS? Geographical Information Systems (GIS) are a special class of information systems that keep track not only of events, activities, and things, but also of where these events, activities, and
WHAT IS GIS? Geographical Information Systems (GIS) are a special class of information systems that keep track not only of events, activities, and things, but also of where these events, activities, and
Chapter 5. GIS The Global Information System
 Chapter 5 GIS The Global Information System What is GIS? We have just discussed GPS a simple three letter acronym for a fairly sophisticated technique to locate a persons or objects position on the Earth
Eyes in the Sky & Data Analysis.
 Eyes in the Sky & Data Analysis How can we collect Information about Earth Climbing up Trees & Mountains Gathering Food Self Protection Understanding Surroundings By Travelling Collected Information Converted
USING GIS IN WATER SUPPLY AND SEWER MODELLING AND MANAGEMENT
 USING GIS IN WATER SUPPLY AND SEWER MODELLING AND MANAGEMENT HENRIETTE TAMAŠAUSKAS*, L.C. LARSEN, O. MARK DHI Water and Environment, Agern Allé 5 2970 Hørsholm, Denmark *Corresponding author, e-mail: htt@dhigroup.com
CLICK HERE TO KNOW MORE
 CLICK HERE TO KNOW MORE GENERALIZATION OF TOPOGRAPHIC DATABASE FOR SERVING GEOSPATIAL DATA FOR MILITARY AND SOCIO-ECONOMIC TASKS IN VIETNAM Speaker: Lieutenant Colonel, Nguyen Dinh Minh GENERAL STAFF -
REVIEW MAPWORK EXAM QUESTIONS 31 JULY 2014
 REVIEW MAPWORK EXAM QUESTIONS 31 JULY 2014 Lesson Description In this lesson we: Focus on key concepts and exam questions relating to GIS. Question 1 Test Yourself The most important component of a GIS
Exploring the boundaries of your built and natural world. Geomatics
 Exploring the boundaries of your built and natural world Geomatics Before the Luxor brought magic to the Las Vegas strip and before the South LRT extension in Edmonton gave residents a new route to travel,
INSTITUTE OF AERONAUTICAL ENGINEERING (Autonomous) Dundigal, Hyderabad
 Dundigal, Hyderabad") INSTITUTE OF AERONAUTICAL ENGINEERING (Autonomous) Dundigal, Hyderabad -00 0 CIVIL ENGINEERING TUTORIAL QUESTION BANK Course Name : Remote Sensing and GIS Course Code : A00 Class : IV B. Tech I Semester
INSTITUTE OF AERONAUTICAL ENGINEERING (Autonomous) Dundigal, Hyderabad -00 0 CIVIL ENGINEERING TUTORIAL QUESTION BANK Course Name : Remote Sensing and GIS Course Code : A00 Class : IV B. Tech I Semester
GIS Geographical Information Systems
 Chapter Two GIS Geographical Information Systems Chapter Two GIS Geographical Information Systems Chapter Two GIS (Geographical Information Systems) 2.1 Introduction In most cases of our day life, information
Applied Cartography and Introduction to GIS GEOG 2017 EL. Lecture-1 Chapters 1 and 2
 Applied Cartography and Introduction to GIS GEOG 2017 EL Lecture-1 Chapters 1 and 2 What is GIS? A Geographic Information System (GIS) is a computer system for capturing, storing, querying, analyzing and
GEOGRAPHIC INFORMATION SYSTEMS
 GEOGRAPHIC INFORMATION SYSTEMS 4-H Round-Up Community Transitions Workshop Daniel Hanselka June 14, 2011 Goals of the Workshop Answer the question: What is GIS? Uses of GIS. Some of the Common Terminology
Applied Cartography and Introduction to GIS GEOG 2017 EL. Lecture-2 Chapters 3 and 4
 Applied Cartography and Introduction to GIS GEOG 2017 EL Lecture-2 Chapters 3 and 4 Vector Data Modeling To prepare spatial data for computer processing: Use x,y coordinates to represent spatial features
How GIS can be used for improvement of literacy and CE programmes
 How GIS can be used for improvement of literacy and CE programmes Training Workshop for Myanmar Literacy Resource Center (MLRC) ( Yangon, Myanmar, 11 20 October 2000 ) Presented by U THEIN HTUT GEOCOMP
ArcGIS. for Server. Understanding our World
 ArcGIS for Server Understanding our World ArcGIS for Server Create, Distribute, and Manage GIS Services You can use ArcGIS for Server to create services from your mapping and geographic information system
GIS Based Transit Information System for Metropolitan Cities in India
 PAPER REFERENCE NO.: PN-250 GIS Based Transit Information System for Metropolitan Cities in India Pal, Sarvjeet. a and Singh, Varun. b a M. Tech. (GIS & Remote Sensing); GIS Cell; Motilal Nehru National
Office of Geographic Information Systems
 Winter 2007 Department Spotlight SWCD GIS by Dave Holmen, Dakota County Soil and Water Conservation District The Dakota County Soil and Water Conservation District (SWCD) has collaborated with the Dakota
How to Pick a GIS. GIS Software Chapter 8 in Longley, Goodchild, Maguire, and Rhind,, 2001
 How to Pick a GIS GIS Software Chapter 8 in Longley, Goodchild, Maguire, and Rhind,, 2001 How to Pick a GIS Evolution of GIS software Architecture of GIS software Types of software Example products The
Chapter 3 Models of the Earth. 3.1 Finding Locations on the Earth. 3.1 Objectives
 Chapter 3 Models of the Earth 3.1 Finding Locations on the Earth 3.1 Objectives Explain latitude and longitude. How can latitude and longitude be used to find locations on Earth? How can a magnetic compass
ArcGIS for Desktop. ArcGIS for Desktop is the primary authoring tool for the ArcGIS platform.
 ArcGIS for Desktop ArcGIS for Desktop ArcGIS for Desktop is the primary authoring tool for the ArcGIS platform. Beyond showing your data as points on a map, ArcGIS for Desktop gives you the power to manage
Erdvinës informacinës sistemos. Spatial Information Systems
 Erdvinës informacinës sistemos Spatial Information Systems Spatial Context The conceptual view of spatial information systems emphasizes the comprehensive nature of spatial data use and organization. Spatial
CENSUS MAPPING WITH GIS IN NAMIBIA. BY Mrs. Ottilie Mwazi Central Bureau of Statistics Tel: October 2007
 CENSUS MAPPING WITH GIS IN NAMIBIA BY Mrs. Ottilie Mwazi Central Bureau of Statistics E-mail: omwazi@npc.gov.na Tel: + 264 61 283 4060 October 2007 Content of Presentation HISTORICAL BACKGROUND OF CENSUS
Application of GIS in Public Transportation Case-study: Almada, Portugal
 Case-study: Almada, Portugal Doutor Jorge Ferreira 1 FSCH/UNL Av Berna 26 C 1069-061 Lisboa, Portugal +351 21 7908300 jr.ferreira@fcsh.unl.pt 2 FSCH/UNL Dra. FCSH/UNL +351 914693843, leite.ines@gmail.com
Representation of Geographic Data
 GIS 5210 Week 2 The Nature of Spatial Variation Three principles of the nature of spatial variation: proximity effects are key to understanding spatial variation issues of geographic scale and level of
Illustrator: Vector base Each line/point store some sort of information Mapping Representation of the world
 Illustrator: Vector base Each line/point store some sort of information Mapping Representation of the world Photoshop Raster base Images can be overlaid Pixel vector data model: [data models] A representation
Developing Spatial Awareness :-
 Developing Spatial Awareness :- We begin to exercise our geographic skill by examining he types of objects and features we encounter. Four different spatial objects in the real world: Point, Line, Areas
The Elements of GIS. Organizing Data and Information. The GIS Database. MAP and ATRIBUTE INFORMATION
 GIS s Roots in Cartography Getting Started With GIS Chapter 2 Dursun Z. Seker MAP and ATRIBUTE INFORMATION Data (numbers and text) store as files refer to them collectively as a database gather inform.
Features and Benefits
 Autodesk LandXplorer Features and Benefits Use the Autodesk LandXplorer software family to help improve decision making, lower costs, view and share changes, and avoid the expense of creating physical
GIS Geographical Information Systems. GIS Management
 GIS Geographical Information Systems GIS Management Difficulties on establishing a GIS Funding GIS Determining Project Standards Data Gathering Map Development Recruiting GIS Professionals Educating Staff
SRJC Applied Technology 54A Introduction to GIS
 SRJC Applied Technology 54A Introduction to GIS Overview Lecture of Geographic Information Systems Fall 2004 Santa Rosa Junior College Presented By: Tim Pudoff, GIS Coordinator, County of Sonoma, Information
APPLICATION OF GIS-GPS FOR MAPPING SOIL INDEX PROPERTIES
 IGC 2009, Guntur, INDIA Application of GIS-GPS for Mapping Soil Index Properties APPLICATION OF GIS-GPS FOR MAPPING SOIL INDEX PROPERTIES Sumedh Yamaji Mhaske Ph.D. Student, Department of Civil Engineering,
COURSE SCHEDULE, GRADING, and READINGS
 COURSE SCHEDULE, GRADING, and READINGS Note: All academic classes will be held in the GIS lab at Royal Thimphu College. These dates are listed here. Other days will involve travel or days off, and the
Geography involves the study of places: their locations, their characteristics, and how humans use and move around them.
 Physical Geography Looking at the Earth Geography involves the study of places: their locations, their characteristics, and how humans use and move around them. NEXT Physical Geography Looking at the Earth
IMPLEMENTAION OF GIS TECHNOLOGY IN THE NILE AND ITS WADIS ABSTRACT
 IMPLEMENTAION OF GIS TECHNOLOGY IN THE NILE AND ITS WADIS Eng. NADIA M. ABD EI- SALAM 1 Dr. ABDEL AZIZ TAREK M. 2 ABSTRACT Traditional methods have been used for several years for map production of the
Steve Pietersen Office Telephone No
 Steve Pietersen Steve.Pieterson@durban.gov.za Office Telephone No. 031 311 8655 Overview Why geography matters The power of GIS EWS GIS water stats EWS GIS sanitation stats How to build a GIS system EWS
Louisiana Transportation Engineering Conference. Monday, February 12, 2007
 Louisiana Transportation Engineering Conference Monday, February 12, 2007 Agenda Project Background Goal of EIS Why Use GIS? What is GIS? How used on this Project Other site selection tools I-69 Corridor
Oregon Department of Transportation. Geographic Information Systems Strategic Plan
 Oregon Department of Transportation Geographic Information Systems Strategic Plan Adopted May, 2000 By the GIS Steering Committee Last printed 10/2/2012 4:20:00 PM Page Geographic Information Systems Strategic
Welcome to GST 101: Introduction to Geospatial Technology. This course will introduce you to Geographic Information Systems (GIS), cartography,
, cartography,") Welcome to GST 101: Introduction to Geospatial Technology. This course will introduce you to Geographic Information Systems (GIS), cartography, remote sensing, and spatial analysis through a series of
Welcome to GST 101: Introduction to Geospatial Technology. This course will introduce you to Geographic Information Systems (GIS), cartography, remote sensing, and spatial analysis through a series of