Representation of Geographic Data
|
|
|
- Conrad Lindsey
- 5 years ago
- Views:
Transcription
1 GIS 5210 Week 2
2 The Nature of Spatial Variation Three principles of the nature of spatial variation: proximity effects are key to understanding spatial variation issues of geographic scale and level of detail are key to building appropriate representations of the world different measures of the world co-vary, and understanding the nature of co-variation can help us to predict
3 The Task Representing spatial and temporal phenomena in the real world: since the real world is complex, this task is difficult and error prone! small things (i.e. human lives) are very intricate in detail viewed in aggregate human activity exhibits structure across geographic spaces

4 Digital Representation of Life
5 The Fundamental Problem Deciding what data/information can be discarded as the inessential while retaining the salient characteristics of the observable world Distinguishes between controlled variation, which oscillates around a steady state, and uncontrolled variation: controlled variation like utility management uncontrolled variation climate change
6 Autocorrelation Informally, it is the similarity between observations as a function of the time lag between them 1 Our behavior in space often reflects past patterns of behavior thus it is one-dimensional, need only look in the past However, spatial events can potentially have consequences anywhere in two-dimensional or even three-dimensional space How and why does spatial and temporal context affect what we do? 1 Thanks to the TA!

7 Tobler s First Law of Geography Everything is related to everything else, but near things are more related than distant things Tobler, 1970
8 Spatial Autocorrelation Autocorrelation is the similarity between observations as a function of the time Spatial autocorrelation is similarity in the location of spatial objects and their attributes manifestation of Tobler s Law! Is a measure of the degree to which a set of spatial features and their associated data values tend to be clustered (positive spatial autocorrelation) or dispersed (negative autocorrelation)
9 Spatial Autocorrelation Understanding spatial variation, the scale of spatial variation, and the way in which geographic phenomena co-vary tells us: how we should represent the real world in our digital GIS Spatial autocorrelation is determined both by similarities in position, and by similarities in attributes: positive, zero, or negative

10 Contiguous Spatial Autocorrelation
11 Distance-based Spatial Autocorrelation (A) linear distance decay (B) negative power distance decay (C) negative exponential distance decay
12 Representation All representation: are needed to convey information fit information into a standard form or model almost always simplify the truth that is being represented Digital representation: digital & binary (1s and 0s) The basis of almost all modern human communication
13 The Fundamental Problem (Again) Geographic data are built up from atomic elements, or facts about the geographic world At its most primitive, an atom of geographic data (strictly, a datum) links a place, often a time, and some descriptive property The fundamental problem: the world is infinitely complex, but computer systems are finite

14 What is a Data Model? Levels of abstractions that convert reality to data in the computer Conceptual models discrete objects vs continuous fields Logical models rasters vs vectors Physical models Too many
15 Discrete Objects vs Continuous Fields Discrete Objects the world is empty, except where it is occupied by objects with well-defined boundaries that are instances of generally recognized categories: objects can be counted objects have dimensionality: 0-dimension points 1-dimension lines 2-dimensions areas
16 Discrete Objects vs Continuous Fields Continuous Field a finite number of variables, each one defined at every possible position: omnipresent, everywhere dense can be distinguished by what varies, and how smoothly In this perspective, value (A) is a function of location (X): A = f (X ) Contrast with the discrete object view define the location of the boundary of objects, or X = f (A)
17 Rasters vs Vectors There are two methods that are used to reduce geographic phenomena to forms that can be coded in computer databases Each can be used to represent both fields and discrete objects: usually raster is used to represent fields and vector for discrete objects Raster is faster, but vector is correcter
18 Raster In a raster representation geographic space is divided into an array of cells, each of which is usually square, but sometimes rectangular: all geographic variation is then expressed by assigning properties or attributes to these cells cells are called pixels (short for picture elements) In the raster data model, individual grid cells have one value that represent a single phenomenon IMPORTANT: Raster accuracy is limited by the resolution of the cell

19 Raster Representation Each color represents a different value of a nominal-scale variable denoting land-cover class
 the largest share rule (B) the central point")
20 Raster Representation Effect of a raster representation using: (A) the largest share rule (B) the central point rule
21 Vector In a vector representation, features are captured as a series of points or vertices connected by straight lines: areas are often called polygons lines are often called polylines In the vector data model, discrete features can have many different attributes representing numerous phenomena
22 Vector Representation Effect of a vector representation: solid purple line represents an area dashed blue line approximation by a polygon

23 A Complete Representation of Geography? Conceptual and logical levels of representing geographic reality A hierarchy of abstraction A big question to think about GIS provides the mean to do this, by organizing data by their spatial distribution
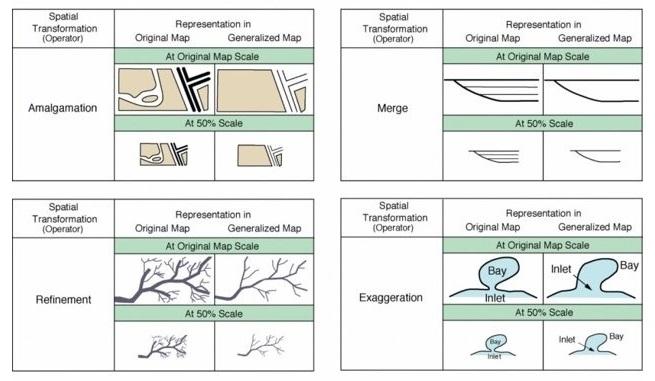
24 Generalization Simplifying the view of the world: describe entire areas, attributing uniform characteristics to them, even when areas are not strictly uniform identify features on the ground and describe their characteristics, again assuming them to be uniform some degree of generalization is almost inevitable in all geographic data A geographic database cannot contain a perfect description; instead, its contents must be carefully selected to fit within the limited capacity of computer storage devices!
25 Simplification Examples
 50-km step approximation (D) 25-km step")
26 Simplification of Coastlines (A) the actual coastline (B) approximation using 100-km steps (C) 50-km step approximation (D) 25-km step approximation
27 Data Information In the context of computing, both data and information refer to facts and statistics collected But data is the quantities, characters, or symbols on which operations are performed by a computer, and information is the context or meaning of data GIS can deal with data easily GIS can handle information too But GIS often has trouble to effectively process knowledge and wisdom
28 Data Types Data is organized in a GIS database based on whether it is a collection of text symbols, numbers, or dates Numbers are further classified into one of four data types:
29 Data Types Why does this matter? because GIS databases can include tens of thousands of records, it is useful to try and limit the memory allocated to each record With numerical values, you can designate: precision the length of the field scale the number of decimal places in the field Number Precision Scale ??
30 GI Attribute Types Attribute Types: nominal used to categorize ordinal ordered categories interval difference between values are constant ratio ratios between values are meaningful Spatially Extensive vs. Spatially Intensive: extensive values aggregated over entire area intensive true for any sub-region of the area

31 Soils Ranked by FCC Limiting Factors Soils with a high number of limiting factors are problematic and require remediation for agricultural production The best soils for agriculture have no or few limiting factors
 is misleading and that spatially extensive variables should always be converted to spatially intensive form before being displayed as choropleth maps.")
32 Choropleth Mapping (A) a spatially extensive variable, total population (B) a spatially intensive variable, population density Many cartographers would argue that (A) is misleading and that spatially extensive variables should always be converted to spatially intensive form before being displayed as choropleth maps.
33 For Next Time! Read Chapter 4 from Longley et al. 2 Finish Lab 1 Bring Lab book with you on Tuesday! 2 Lecture slides adapted from Longley et al.
Geographers Perspectives on the World
 What is Geography? Geography is not just about city and country names Geography is not just about population and growth Geography is not just about rivers and mountains Geography is a broad field that
Lecture 5. Symbolization and Classification MAP DESIGN: PART I. A picture is worth a thousand words
 Lecture 5 MAP DESIGN: PART I Symbolization and Classification A picture is worth a thousand words Outline Symbolization Types of Maps Classifying Features Visualization Considerations Symbolization Symbolization
Types of spatial data. The Nature of Geographic Data. Types of spatial data. Spatial Autocorrelation. Continuous spatial data: geostatistics
 The Nature of Geographic Data Types of spatial data Continuous spatial data: geostatistics Samples may be taken at intervals, but the spatial process is continuous e.g. soil quality Discrete data Irregular:
The Nature of Geographic Data
 4 The Nature of Geographic Data OVERVIEW Elaborates on the spatial is special theme Focuses on how phenomena vary across space and the general nature of geographic variation Describes the main principles
Outline. Geographic Information Analysis & Spatial Data. Spatial Analysis is a Key Term. Lecture #1
 Geographic Information Analysis & Spatial Data Lecture #1 Outline Introduction Spatial Data Types: Objects vs. Fields Scale of Attribute Measures GIS and Spatial Analysis Spatial Analysis is a Key Term
Lecture 8. Spatial Estimation
 Lecture 8 Spatial Estimation Lecture Outline Spatial Estimation Spatial Interpolation Spatial Prediction Sampling Spatial Interpolation Methods Spatial Prediction Methods Interpolating Raster Surfaces
Introduction to Geographic Information Science. Updates/News. Last Lecture 1/23/2017. Geography 4103 / Spatial Data Representations
 Geography 4103 / 5103 Introduction to Geographic Information Science Spatial Data Representations Updates/News Waitlisted students First graded lab this week: skills learning Instructional labs vs. independence
Intro to GIS Summer 2012 Data Visualization
 Intro to GIS Summer 2012 Data Visualization UNDERSTANDING YOUR MAP DATA Qualitative vs. Quantitative Data Qualitative Data classified by category e.g. Soil types, Animal Species Quantitative Data grouped
What are the five components of a GIS? A typically GIS consists of five elements: - Hardware, Software, Data, People and Procedures (Work Flows)
") LECTURE 1 - INTRODUCTION TO GIS Section I - GIS versus GPS What is a geographic information system (GIS)? GIS can be defined as a computerized application that combines an interactive map with a database
LECTURE 1 - INTRODUCTION TO GIS Section I - GIS versus GPS What is a geographic information system (GIS)? GIS can be defined as a computerized application that combines an interactive map with a database
Introducing GIS analysis
 1 Introducing GIS analysis GIS analysis lets you see patterns and relationships in your geographic data. The results of your analysis will give you insight into a place, help you focus your actions, or
Physical Geography Lab Activity #15
 Physical Geography Lab Activity #15 Due date Name Choropleth Maps COR Objective 1 & 7, SLOs 1 & 3 15.1. Introduction Up until this point we have used maps to find locations on the Earth. While they are
GEOGRAPHY 350/550 Final Exam Fall 2005 NAME:
 1) A GIS data model using an array of cells to store spatial data is termed: a) Topology b) Vector c) Object d) Raster 2) Metadata a) Usually includes map projection, scale, data types and origin, resolution
Lecture 5 Geostatistics
 Lecture 5 Geostatistics Lecture Outline Spatial Estimation Spatial Interpolation Spatial Prediction Sampling Spatial Interpolation Methods Spatial Prediction Methods Interpolating Raster Surfaces with
Cartography and Geovisualization. Chapters 12 and 13 of your textbook
 Cartography and Geovisualization Chapters 12 and 13 of your textbook Why cartography? Maps are the principle means of displaying spatial data Exploration: visualization, leading to conceptualization of
Statistical Perspectives on Geographic Information Science. Michael F. Goodchild University of California Santa Barbara
 Statistical Perspectives on Geographic Information Science Michael F. Goodchild University of California Santa Barbara Statistical geometry Geometric phenomena subject to chance spatial phenomena emphasis
0 Maps are the principle means of displaying spatial data
 Why cartography? 0 Maps are the principle means of displaying spatial data 0 Exploration: visualization, leading to conceptualization of patterns and processes. (Chap 13) 0 Communication: convey information
GEOGRAPHIC INFORMATION SYSTEM (GES203)
") GEOGRAPHIC INFORMATION SYSTEM (GES203) GIS Components Level 2:1 By: Mrs Mupfiga Presentation Layout Recap Learning Objectives Components of GIS GIS Data References Lecture Evaluation Learning Objectives
GEOGRAPHIC INFORMATION SYSTEM (GES203) GIS Components Level 2:1 By: Mrs Mupfiga Presentation Layout Recap Learning Objectives Components of GIS GIS Data References Lecture Evaluation Learning Objectives
Michael Harrigan Office hours: Fridays 2:00-4:00pm Holden Hall
 Announcement New Teaching Assistant Michael Harrigan Office hours: Fridays 2:00-4:00pm Holden Hall 209 Email: michael.harrigan@ttu.edu Guofeng Cao, Texas Tech GIST4302/5302, Lecture 2: Review of Map Projection
The Basics COPYRIGHTED MATERIAL. chapter. Algebra is a very logical way to solve
 chapter 1 The Basics Algebra is a very logical way to solve problems both theoretically and practically. You need to know a number of things. You already know arithmetic of whole numbers. You will review
1. Define map: 2. Name and define the five concepts that guide geographers a) 3. Define cartography: MAPS 4. A map serves two purposes a)
 3. Define cartography: MAPS 4. A map serves two purposes a)") 1. Define map: 2. Name and define the five concepts that guide geographers c) d) e) 3. Define cartography: MAPS 4. A map serves two purposes 5. Give two examples of early mapmaking and its (unusual?) materials
1. Define map: 2. Name and define the five concepts that guide geographers c) d) e) 3. Define cartography: MAPS 4. A map serves two purposes 5. Give two examples of early mapmaking and its (unusual?) materials
Sampling The World. presented by: Tim Haithcoat University of Missouri Columbia
 Sampling The World presented by: Tim Haithcoat University of Missouri Columbia Compiled with materials from: Charles Parson, Bemidji State University and Timothy Nyerges, University of Washington Introduction
2.2 Geographic phenomena
 2.2. Geographic phenomena 66 2.2 Geographic phenomena 2.2. Geographic phenomena 67 2.2.1 Defining geographic phenomena A GIS operates under the assumption that the relevant spatial phenomena occur in a
Geog183: Cartographic Design and Geovisualization Winter Quarter 2017 Lecture 6: Map types and Data types
 Geog183: Cartographic Design and Geovisualization Winter Quarter 2017 Lecture 6: Map types and Data types Data types Data dimension: Point, Line, Area, Volume (Text) Data continuity: Discrete, Point, Polygon:
Geography 360 Principles of Cartography. April 17, 2006
 Geography 360 Principles of Cartography April 17, 2006 Outlines Cartographic design principles Enhancing visual hierarchies on maps Kinds of numerical data and color scheme What is proportional symbol
GIST 4302/5302: Spatial Analysis and Modeling
 GIST 4302/5302: Spatial Analysis and Modeling Lecture 2: Review of Map Projections and Intro to Spatial Analysis Guofeng Cao http://thestarlab.github.io Department of Geosciences Texas Tech University
GIST 4302/5302: Spatial Analysis and Modeling Lecture 2: Review of Map Projections and Intro to Spatial Analysis
 GIST 4302/5302: Spatial Analysis and Modeling Lecture 2: Review of Map Projections and Intro to Spatial Analysis Guofeng Cao http://www.spatial.ttu.edu Department of Geosciences Texas Tech University guofeng.cao@ttu.edu
Luc Anselin Spatial Analysis Laboratory Dept. Agricultural and Consumer Economics University of Illinois, Urbana-Champaign
 GIS and Spatial Analysis Luc Anselin Spatial Analysis Laboratory Dept. Agricultural and Consumer Economics University of Illinois, Urbana-Champaign http://sal.agecon.uiuc.edu Outline GIS and Spatial Analysis
Spatial Analysis and Modeling (GIST 4302/5302) Guofeng Cao Department of Geosciences Texas Tech University
 Guofeng Cao Department of Geosciences Texas Tech University") Spatial Analysis and Modeling (GIST 4302/5302) Guofeng Cao Department of Geosciences Texas Tech University TTU Graduate Certificate Geographic Information Science and Technology (GIST) 3 Core Courses and
Spatial Analysis and Modeling (GIST 4302/5302) Guofeng Cao Department of Geosciences Texas Tech University TTU Graduate Certificate Geographic Information Science and Technology (GIST) 3 Core Courses and
Lecture 1: Geospatial Data Models
 Lecture 1: GEOG413/613 Dr. Anthony Jjumba Introduction Course Outline Journal Article Review Projects (and short presentations) Final Exam (April 3) Participation in class discussions Geog413/Geog613 A
Basics of GIS. by Basudeb Bhatta. Computer Aided Design Centre Department of Computer Science and Engineering Jadavpur University
 Basics of GIS by Basudeb Bhatta Computer Aided Design Centre Department of Computer Science and Engineering Jadavpur University e-governance Training Programme Conducted by National Institute of Electronics
Outline. 15. Descriptive Summary, Design, and Inference. Descriptive summaries. Data mining. The centroid
 Outline 15. Descriptive Summary, Design, and Inference Geographic Information Systems and Science SECOND EDITION Paul A. Longley, Michael F. Goodchild, David J. Maguire, David W. Rhind 2005 John Wiley
Chapter 1 Learning Guide Thinking Geographically
 Chapter 1 Learning Guide Thinking Geographically Key Issue 1 How Do Geographers Address Where Things Are? Pgs. 2 13 1. Define map: 2. Define cartography: Maps 3. Give an example of early mapmaking and
SPATIAL DATA MINING. Ms. S. Malathi, Lecturer in Computer Applications, KGiSL - IIM
 SPATIAL DATA MINING Ms. S. Malathi, Lecturer in Computer Applications, KGiSL - IIM INTRODUCTION The main difference between data mining in relational DBS and in spatial DBS is that attributes of the neighbors
Overview key concepts and terms (based on the textbook Chang 2006 and the practical manual)
") Introduction Geo-information Science (GRS-10306) Overview key concepts and terms (based on the textbook 2006 and the practical manual) Introduction Chapter 1 Geographic information system (GIS) Geographically
Introduction Geo-information Science (GRS-10306) Overview key concepts and terms (based on the textbook 2006 and the practical manual) Introduction Chapter 1 Geographic information system (GIS) Geographically
6. Provide an example of developments in geography for each of the following:
 Thinking Geographically: Key Issue 1 How Do Geographers Describe Where Things Are? Rubenstein, p. 5-13 1. Define map: 2. Define cartography: MAPS 3. Give two examples of developments in early mapmaking.
Intro to GIS In Review
 Intro to GIS In Review GIS Analysis Winter 2016 GIS A quarter in review Geographic data types Acquiring GIS data Projections / Coordinate systems Working with attribute tables Data classification Map design
Introduction to GIS. Phil Guertin School of Natural Resources and the Environment GeoSpatial Technologies
 Introduction to GIS Phil Guertin School of Natural Resources and the Environment dguertin@cals.arizona.edu Mapping GeoSpatial Technologies Traditional Survey Global Positioning Systems (GPS) Remote Sensing
Appropriate Selection of Cartographic Symbols in a GIS Environment
 Appropriate Selection of Cartographic Symbols in a GIS Environment Steve Ramroop Department of Information Science, University of Otago, Dunedin, New Zealand. Tel: +64 3 479 5608 Fax: +64 3 479 8311, sramroop@infoscience.otago.ac.nz
ENV208/ENV508 Applied GIS. Week 1: What is GIS?
 ENV208/ENV508 Applied GIS Week 1: What is GIS? 1 WHAT IS GIS? A GIS integrates hardware, software, and data for capturing, managing, analyzing, and displaying all forms of geographically referenced information.
Raster Spatial Analysis Specific Theory
 RSATheory.doc 1 Raster Spatial Analysis Specific Theory... 1 Spatial resampling... 1 Mosaic... 3 Reclassification... 4 Slicing... 4 Zonal Operations... 5 References... 5 Raster Spatial Analysis Specific
Basic principles of cartographic design. Makram Murad-al-shaikh M.S. Cartography Esri education delivery team
 Basic principles of cartographic design Makram Murad-al-shaikh M.S. Cartography Esri education delivery team Cartographic concepts Cartography defined The communication channel - Why maps fail Objectives
Class 9. Query, Measurement & Transformation; Spatial Buffers; Descriptive Summary, Design & Inference
 Class 9 Query, Measurement & Transformation; Spatial Buffers; Descriptive Summary, Design & Inference Spatial Analysis Turns raw data into useful information by adding greater informative content and value
Tutorial 8 Raster Data Analysis
 Objectives Tutorial 8 Raster Data Analysis This tutorial is designed to introduce you to a basic set of raster-based analyses including: 1. Displaying Digital Elevation Model (DEM) 2. Slope calculations
[Figure 1 about here]
![[Figure 1 about here]](/thumbs/87/95828660.jpg "[Figure 1 about here]") TITLE: FIELD-BASED SPATIAL MODELING BYLINE: Michael F. Goodchild, University of California, Santa Barbara, www.geog.ucsb.edu/~good SYNONYMS: None DEFINITION: A field (or continuous field) is defined as
TITLE: FIELD-BASED SPATIAL MODELING BYLINE: Michael F. Goodchild, University of California, Santa Barbara, www.geog.ucsb.edu/~good SYNONYMS: None DEFINITION: A field (or continuous field) is defined as
3. Give two examples of early mapmaking and its (unusual?) materials for the maps. (a)
 materials for the maps. (a)") Thinking Geographically: Key Issue 1 How Do Geographers Describe Where Things Are? Rubenstein Ch. 1 pp. 4 12 1. Define map: 2. Define cartography: MAPS 3. Give two examples of early mapmaking and its (unusual?)
Thinking Geographically: Key Issue 1 How Do Geographers Describe Where Things Are? Rubenstein Ch. 1 pp. 4 12 1. Define map: 2. Define cartography: MAPS 3. Give two examples of early mapmaking and its (unusual?)
GED 554 IT & GIS. Lecture 6 Exercise 5. May 10, 2013
 GED 554 IT & GIS Lecture 6 Exercise 5 May 10, 2013 Free GIS data sources ******************* Mapping numerical data & Symbolization ******************* Exercise: Making maps for presentation GIS DATA SOFTWARE
Ø Set of mutually exclusive categories. Ø Classify or categorize subject. Ø No meaningful order to categorization.
 Statistical Tools in Evaluation HPS 41 Dr. Joe G. Schmalfeldt Types of Scores Continuous Scores scores with a potentially infinite number of values. Discrete Scores scores limited to a specific number
Nature of Spatial Data. Outline. Spatial Is Special
 Nature of Spatial Data Outline Spatial is special Bad news: the pitfalls of spatial data Good news: the potentials of spatial data Spatial Is Special Are spatial data special? Why spatial data require
Uncertainty in Geographic Information: House of Cards? Michael F. Goodchild University of California Santa Barbara
 Uncertainty in Geographic Information: House of Cards? Michael F. Goodchild University of California Santa Barbara Starting points All geospatial data leave the user to some extent uncertain about the
Chapter 7: Making Maps with GIS. 7.1 The Parts of a Map 7.2 Choosing a Map Type 7.3 Designing the Map
 Chapter 7: Making Maps with GIS 7.1 The Parts of a Map 7.2 Choosing a Map Type 7.3 Designing the Map What is a map? A graphic depiction of all or part of a geographic realm in which the real-world features
GEO-DATA INPUT AND CONVERSION. Christos G. Karydas,, Dr. Lab of Remote Sensing and GIS Director: Prof. N. Silleos
 Christos G. Karydas,, Dr. xkarydas@agro.auth.gr http://users.auth.gr/xkarydas Lab of Remote Sensing and GIS Director: Prof. N. Silleos School of Agriculture Aristotle University of Thessaloniki, GR 1 0.
GIS Institute Center for Geographic Analysis
 GIS Institute Center for Geographic Analysis Welcome Intensive training in the application of GIS to research Collection, management, analysis, and communication of spatial data Topics include: data collection,
UNCERTAINTY AND ERRORS IN GIS
 Christos G. Karydas,, Dr. xkarydas@agro.auth.gr http://users.auth.gr/xkarydas Lab of Remote Sensing and GIS Director: Prof. N. Silleos School of Agriculture Aristotle University of Thessaloniki, GR 1 UNCERTAINTY
Geographic Information Systems (GIS) in Environmental Studies ENVS Winter 2003 Session III
 in Environmental Studies ENVS Winter 2003 Session III") Geographic Information Systems (GIS) in Environmental Studies ENVS 6189 3.0 Winter 2003 Session III John Sorrell York University sorrell@yorku.ca Session Purpose: To discuss the various concepts of space,
Geographic Information Systems (GIS) in Environmental Studies ENVS 6189 3.0 Winter 2003 Session III John Sorrell York University sorrell@yorku.ca Session Purpose: To discuss the various concepts of space,
GIS Data Structure: Raster vs. Vector RS & GIS XXIII
 Subject Paper No and Title Module No and Title Module Tag Geology Remote Sensing and GIS GIS Data Structure: Raster vs. Vector RS & GIS XXIII Principal Investigator Co-Principal Investigator Co-Principal
Spatial Concepts: Data Models 2
 Spatial Concepts: Data Models 2 2009/2010 CGI GIRS 2/31 Data modeling in 4 steps 1. Geographical perception Continuous phenomenon Discrete phenomena Virtual boundaries Tangible boundaries altitude, EM
30 YEARS SINCE Z_GIS FOUNDING: PROVIDING SOLUTIONS FOR SOCIETY AND BUSINESS
 30 YEARS SINCE Z_GIS FOUNDING: PROVIDING SOLUTIONS FOR SOCIETY AND BUSINESS Michael F Goodchild Emeritus Professor of Geography University of California, Santa Barbara Keynote GIScience Symposium, Salzburg,
Contents. Learning Outcomes 2012/2/26. Lecture 6: Area Pattern and Spatial Autocorrelation. Dr. Bo Wu
 01//6 LSGI 1: : GIS Spatial Applications Analysis Lecture 6: Lecture Area Pattern 1: Introduction and Spatial to GIS Autocorrelation Applications Contents Lecture 6: Area Pattern and Spatial Autocorrelation
David Tenenbaum GEOG 090 UNC-CH Spring 2005
 Statistical Thinking, Data Types, and Geographical Primitives The scientific method in geography, two kinds of approaches, and the sorts of statistics used to support those approaches Some characteristics
GIS Lecture 4: Data. GIS Tutorial, Third Edition GIS 1
 GIS Lecture 4: Data GIS 1 Outline Data Types, Tables, and Formats Geodatabase Tabular Joins Spatial Joins Field Calculator ArcCatalog Functions GIS 2 Data Types, Tables, Formats GIS 3 Directly Loadable
What should you consider concerning colors in maps in order to illustrate qualitative data, and quantitative data, respectively? Exemplify.
 1, Cartography, 10 p (HA) _ When doing a map based on quantitative data you have for example to decide upon the classification. Three common classifications are Equal interval, Quantiles (percentiles)
Introduction-Overview. Why use a GIS? What can a GIS do? Spatial (coordinate) data model Relational (tabular) data model
 data model Relational (tabular) data model") Introduction-Overview Why use a GIS? What can a GIS do? How does a GIS work? GIS definitions Spatial (coordinate) data model Relational (tabular) data model intro_gis.ppt 1 Why use a GIS? An extension
Introduction-Overview Why use a GIS? What can a GIS do? How does a GIS work? GIS definitions Spatial (coordinate) data model Relational (tabular) data model intro_gis.ppt 1 Why use a GIS? An extension
from Euclid to Einstein
 WorkBook 2. Space from Euclid to Einstein Roy McWeeny Professore Emerito di Chimica Teorica, Università di Pisa, Pisa (Italy) A Pari New Learning Publication Book 2 in the Series WorkBooks in Science (Last
Process Control and Instrumentation Prof. D. Sarkar Department of Chemical Engineering Indian Institute of Technology, Kharagpur
 Process Control and Instrumentation Prof. D. Sarkar Department of Chemical Engineering Indian Institute of Technology, Kharagpur Lecture - 35 Instrumentation: General Principles of Measurement Systems
Susan Cutter et al. Aug, 2002, The Professional Geographer, 54(3): David Tenenbaum GEOG 070 UNC-CH Spring 2005
: David Tenenbaum GEOG 070 UNC-CH Spring 2005") What is Geography? Geography is not just about city and country names Geography is not just about population and growth Geography is not just about rivers and mountains Geography is a broad field that
What is Geography? Geography is not just about city and country names Geography is not just about population and growth Geography is not just about rivers and mountains Geography is a broad field that
Application of eigenvector-based spatial filtering approach to. a multinomial logit model for land use data
 Presented at the Seventh World Conference of the Spatial Econometrics Association, the Key Bridge Marriott Hotel, Washington, D.C., USA, July 10 12, 2013. Application of eigenvector-based spatial filtering
AP Human Geography Chapter 1: Thinking Geographically Key Issue 1: How do Geographers describe where things are?
 AP Human Geography Chapter 1: Thinking Geographically Key Issue 1: How do Geographers describe where things are? Studying Human Geography Physical Geography Physical geography deals with Earth s natural
Field data acquisition
 Lesson : Primary sources Unit 3: Field data B-DC Lesson / Unit 3 Claude Collet D Department of Geosciences - Geography Content of Lesson Unit 1: Unit : Unit 3: Unit 4: Digital sources Remote sensing Field
Finite and infinite sets, and cardinality
 (1/17) MA180/186/190 : Semester 2 Calculus http://www.maths.nuigalway.ie/ma180-2 Niall Madden (Niall.Madden@NUIGalway.ie) Finite and infinite sets, and cardinality Lecture 02: Tuesday, 8 January 2013 Today:
Geog 469 GIS Workshop. Data Analysis
 Geog 469 GIS Workshop Data Analysis Outline 1. What kinds of need-to-know questions can be addressed using GIS data analysis? 2. What is a typology of GIS operations? 3. What kinds of operations are useful
Testing a Hash Function using Probability
 Testing a Hash Function using Probability Suppose you have a huge square turnip field with 1000 turnips growing in it. They are all perfectly evenly spaced in a regular pattern. Suppose also that the Germans
Wednesday, 10 September 2008
 MA211 : Calculus, Part 1 Lecture 2: Sets and Functions Dr Niall Madden (Mathematics, NUI Galway) Wednesday, 10 September 2008 MA211 Lecture 2: Sets and Functions 1/33 Outline 1 Short review of sets 2 Sets
Outline. Wednesday, 10 September Schedule. Welcome to MA211. MA211 : Calculus, Part 1 Lecture 2: Sets and Functions
 Outline MA211 : Calculus, Part 1 Lecture 2: Sets and Functions Dr Niall Madden (Mathematics, NUI Galway) Wednesday, 10 September 2008 1 Short review of sets 2 The Naturals: N The Integers: Z The Rationals:
An Introduction to Geographic Information System
 An Introduction to Geographic Information System PROF. Dr. Yuji MURAYAMA Khun Kyaw Aung Hein 1 July 21,2010 GIS: A Formal Definition A system for capturing, storing, checking, Integrating, manipulating,
GIS Methodology in Determining Population Centers and Distances to Nuclear Power Plants
 GIS Methodology in Determining Population Centers and Distances to Nuclear Power Plants Tine Ningal & Finbarr Brereton The methods used to determine the population centres are described below. The default
Interpolating Raster Surfaces
 Interpolating Raster Surfaces You can use interpolation to model the surface of a feature or a phenomenon all you need are sample points, an interpolation method, and an understanding of the feature or
Mathematical Logic Prof. Arindama Singh Department of Mathematics Indian Institute of Technology, Madras. Lecture - 15 Propositional Calculus (PC)
") Mathematical Logic Prof. Arindama Singh Department of Mathematics Indian Institute of Technology, Madras Lecture - 15 Propositional Calculus (PC) So, now if you look back, you can see that there are three
Mathematical Logic Prof. Arindama Singh Department of Mathematics Indian Institute of Technology, Madras Lecture - 15 Propositional Calculus (PC) So, now if you look back, you can see that there are three
DATA 301 Introduction to Data Analytics Geographic Information Systems
 DATA 301 Introduction to Data Analytics Geographic Information Systems Dr. Ramon Lawrence University of British Columbia Okanagan ramon.lawrence@ubc.ca DATA 301: Data Analytics (2) Why learn Geographic
SPATIAL ANALYSIS. Transformation. Cartogram Central. 14 & 15. Query, Measurement, Transformation, Descriptive Summary, Design, and Inference
 14 & 15. Query, Measurement, Transformation, Descriptive Summary, Design, and Inference Geographic Information Systems and Science SECOND EDITION Paul A. Longley, Michael F. Goodchild, David J. Maguire,
Terms GIS GPS Vector Data Model Raster Data Model Feature Attribute Table Point Line Polygon Pixel RGB Overlay Function
 FINAL REVIEW FOR GIS (2016) PRACTICAL COMPONENT The first 40 mins of the exam will be open book and will require you to make a map using all the techniques learned over the semester. This map will be e-mailed
Water Resources Systems Prof. P. P. Mujumdar Department of Civil Engineering Indian Institute of Science, Bangalore
 Water Resources Systems Prof. P. P. Mujumdar Department of Civil Engineering Indian Institute of Science, Bangalore Module No. # 05 Lecture No. # 22 Reservoir Capacity using Linear Programming (2) Good
MAP SCALE, ELEMENTS & USE
 MAP SCALE, ELEMENTS & USE Maps & Geospatial Concepts Fall 2015 What cartographic elements affect a map? Scale Elements Layout Data Representation Data Accuracy & Misuse Scale Scale http://micro.magnet.fsu.edu/primer/java/scienceop
Spatial Analysis using Vector GIS THE GOAL: PREPARATION:
 PLAN 512 GIS FOR PLANNERS Department of Urban and Environmental Planning University of Virginia Fall 2006 Prof. David L. Phillips Spatial Analysis using Vector GIS THE GOAL: This tutorial explores some
Logical data integration into digital landscape model 1
 Logical data integration into digital landscape model 1 1 Lecture contents: 1. Overview of geodata applicable in the modelling in the landscape. 2. Introduction into the models and modelling. 3. Classification
Spatial Data Mining. Regression and Classification Techniques
 Spatial Data Mining Regression and Classification Techniques 1 Spatial Regression and Classisfication Discrete class labels (left) vs. continues quantities (right) measured at locations (2D for geographic
OBEUS. (Object-Based Environment for Urban Simulation) Shareware Version. Itzhak Benenson 1,2, Slava Birfur 1, Vlad Kharbash 1
 Shareware Version. Itzhak Benenson 1,2, Slava Birfur 1, Vlad Kharbash 1") OBEUS (Object-Based Environment for Urban Simulation) Shareware Version Yaffo model is based on partition of the area into Voronoi polygons, which correspond to real-world houses; neighborhood relationship
OBEUS (Object-Based Environment for Urban Simulation) Shareware Version Yaffo model is based on partition of the area into Voronoi polygons, which correspond to real-world houses; neighborhood relationship
Cell-based Model For GIS Generalization
 Cell-based Model For GIS Generalization Bo Li, Graeme G. Wilkinson & Souheil Khaddaj School of Computing & Information Systems Kingston University Penrhyn Road, Kingston upon Thames Surrey, KT1 2EE UK
Lecture 3: Exploratory Spatial Data Analysis (ESDA) Prof. Eduardo A. Haddad
 Prof. Eduardo A. Haddad") Lecture 3: Exploratory Spatial Data Analysis (ESDA) Prof. Eduardo A. Haddad Key message Spatial dependence First Law of Geography (Waldo Tobler): Everything is related to everything else, but near things
Lecture 3: Exploratory Spatial Data Analysis (ESDA) Prof. Eduardo A. Haddad Key message Spatial dependence First Law of Geography (Waldo Tobler): Everything is related to everything else, but near things
Accuracy and Uncertainty
 Accuracy and Uncertainty Accuracy and Uncertainty Why is this an issue? What is meant by accuracy and uncertainty (data vs rule)? How things have changed in a digital world. Spatial data quality issues
The Choropleth Map Slide #2: Choropleth mapping enumeration units
 The Choropleth Map Slide #2: Choropleth mapping is a common technique for representing enumeration data These are maps where enumeration units, such as states or countries, are shaded a particular color
Sets. Alice E. Fischer. CSCI 1166 Discrete Mathematics for Computing Spring, Outline Sets An Algebra on Sets Summary
 An Algebra on Alice E. Fischer CSCI 1166 Discrete Mathematics for Computing Spring, 2018 Alice E. Fischer... 1/37 An Algebra on 1 Definitions and Notation Venn Diagrams 2 An Algebra on 3 Alice E. Fischer...
The Elements of GIS. Organizing Data and Information. The GIS Database. MAP and ATRIBUTE INFORMATION
 GIS s Roots in Cartography Getting Started With GIS Chapter 2 Dursun Z. Seker MAP and ATRIBUTE INFORMATION Data (numbers and text) store as files refer to them collectively as a database gather inform.
Lecture 3: Exploratory Spatial Data Analysis (ESDA) Prof. Eduardo A. Haddad
 Prof. Eduardo A. Haddad") Lecture 3: Exploratory Spatial Data Analysis (ESDA) Prof. Eduardo A. Haddad Key message Spatial dependence First Law of Geography (Waldo Tobler): Everything is related to everything else, but near things
Lecture 3: Exploratory Spatial Data Analysis (ESDA) Prof. Eduardo A. Haddad Key message Spatial dependence First Law of Geography (Waldo Tobler): Everything is related to everything else, but near things
NR402 GIS Applications in Natural Resources
 NR402 GIS Applications in Natural Resources Lesson 1 Introduction to GIS Eva Strand, University of Idaho Map of the Pacific Northwest from http://www.or.blm.gov/gis/ Welcome to NR402 GIS Applications in
Computation Theory Finite Automata
 Computation Theory Dept. of Computing ITT Dublin October 14, 2010 Computation Theory I 1 We would like a model that captures the general nature of computation Consider two simple problems: 2 Design a program
Uncertainty, Error, and Precision in Quantitative Measurements an Introduction 4.4 cm Experimental error
 Uncertainty, Error, and Precision in Quantitative Measurements an Introduction Much of the work in any chemistry laboratory involves the measurement of numerical quantities. A quantitative measurement
B L U E V A L L E Y D I S T R I C T C U R R I C U L U M Science Physics
 B L U E V A L L E Y D I S T R I C T C U R R I C U L U M Science Physics ORGANIZING THEME/TOPIC UNIT 1: KINEMATICS Mathematical Concepts Graphs and the interpretation thereof Algebraic manipulation of equations
Software. People. Data. Network. What is GIS? Procedures. Hardware. Chapter 1
 People Software Data Network Procedures Hardware What is GIS? Chapter 1 Why use GIS? Mapping Measuring Monitoring Modeling Managing Five Ms of Applied GIS Chapter 2 Geography matters Quantitative analyses
Welcome to NR502 GIS Applications in Natural Resources. You can take this course for 1 or 2 credits. There is also an option for 3 credits.
 Welcome to NR502 GIS Applications in Natural Resources. You can take this course for 1 or 2 credits. There is also an option for 3 credits. The 1st credit consists of a series of readings, demonstration,
Lecture 10 Mapping Quantities: Dot Density Maps
 Lecture 10 Mapping Quantities: Dot Density Maps Introduction Creating maps of features based on quantity are some of the most common and important types of maps. In order to create maps that show quantity