Snow, Snowpacks and Runoff. David G Tarboton Charles H Luce
|
|
|
- Posy Warren
- 5 years ago
- Views:
Transcription
1 Snow, Snowpacks and Runoff David G Tarboton Charles H Luce


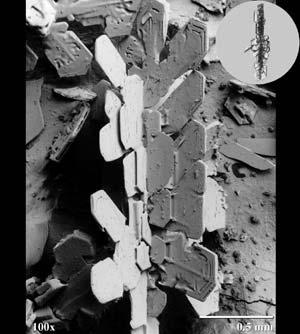
2 Show and Tell Images from
3 Potential effects of climate change on snow Advance in snowmelt timing Smaller snow pack area Uncertainty in regional variability (need more research to examine trends, patterns, feedback and nonlinear dynamics. e.g. Mote, 2003, GRL) It may be obvious to this audience, but just to set the stage, in considering snow and runoff some of the potential effects of climate change are: (read from slide). These speak to the need to examine trends and understand the interactions involved.
4 Quantifying snowmelt runoff requires knowledge of the quantity of water held in snow packs the magnitude and rate of water lost to the atmosphere by sublimation the timing, rate, and magnitude of snow melt the fate of melt water If we are to quantify snowmelt runoff we need to know the following four things: (read from slide). These involve combining observation and modeling, so a theme that I will promote is learning through integration of observation and modeling.
5 Attributes of Snow Important in Runoff Snow Water Equivalent Heterogeneity Thermal properties In understanding snow and runoff it is important to quantify these things. Snow water equivalent is the depth of water that results when a snowpack melts and it is the basic quantity used to quantify the amount of snow water present. We do not have a good way to measure or predict snow water equivalent over a large watershed due in large part to spatial heterogeneity. We can measure SWE at a point, but over an area it is difficult. I'll talk about some of the methods in a minute, but measuring SWE patterns over large areas is a significant limitation that needs attention. Snow is also a very interesting substance. Being comprised of ice crystals and air it acts as an insulator to the conduction of heat. Heat transport processes also modify the medium itself. These properties need to be understood and reflected in models to correctly estimate snow melt surface water inputs. I'll talk about some of the recent ideas and improvements in modeling snow thermal properties.

.")
6 Quantifying Snow Water Equivalent Field Snow Surveys (courses, pits, tubes) SNOTEL system Stereo photo interpretation Gamma radiation LIDAR Gravity Microwave Remote sensing Model + data assimilation This reviews some of the methods for quantifying snow water equivalent. Ground based methods include field snow surveys and the SNOTEL system based on snow pillows. These have the disadvantage of being point measurements that are hard to extend over a large watershed. Remote sensing offers the only real opportunity to obtain spatial snow water equivalent and here are some of the methods. (Discuss advantages and limitations). I think that to make real progress in quantifying SWE we really need to integrate models with measurements, an assimilation approach. NOHRSC has made quite a bit of progress in this area, but more is needed.

7 Heterogeneity of snow cover at multiple scales Precipitation Drifting. Topography and vegetation / shrubs Avalanching / Sloughing Variable exposure to melt energy Reynolds Creek. Photograph Keith Cooley Now I would like to really focus on heterogeneity of snow at multiple scales. Heterogeneity is caused by a number of processes - listed here. Quantifying and understanding heterogeneity is a major challenge for snow science.

8 Hydrologic Importance of Heterogeneity Sustains surface water input late into season Limits exposure of snow surface to sublimation Upper Sheep Creek, Photograph Keith Cooley
9 Approaches to spatially distributed modeling of snow over a catchment Effective or representative parameters. Variability parameterized using distribution functions. Combination of representative points (e.g. fuzzy membership). Indexed semi-distributed (e.g. elevation zones or HRU's). Detailed spatially explicit (e.g. grid cells).
10 Modeling spatial heterogeneity examples (a) Streamflow mm/hr Oct Nov Dec Jan Feb Mar Apr May Jun Jul Aug Drift Factors C D E F G H I J K L M N B m $ Weir N $ Upper Sheep Creek Accumulation Factors (b) Surface Water Input Rate -- Distributed Solar and Drift mm/hr Oct Nov Dec Jan Feb Mar Apr May Jun Jul Aug Detailed spatially explicit (c) Surface Water Input Rate -- Single Point Representation mm/hr Oct Nov Dec Jan Feb Mar Apr May Jun Jul Aug Point Luce, C. H., D. G. Tarboton and K. R. Cooley, (1998), "The Influence of the Spatial Distribution of Snow on Basin-Averaged Snowmelt," Hydrological Processes, 12(10-11): I now go through a series of examples to illustrate the state of the art and future challenges. This slide shows the difference between applying a point model and detailed spatially explicit model over a small area to estimate surface water input. The spatially distributed model sustains surface water input from the drift areas much later in to the spring, more consistent with the observed timing of snowmelt runoff. The spatially distributed model used the accumulation factor concept to relate measured precipitation to accumulation at each location accounting for redistribution due to drifting. In this example at Upper Sheep Creek, accumulation factor was estimated from measurements of SWE at each grid point.


11 Estimating Accumulation Factor from Snow Covered Area Images W Range of AF AF lower bound Snow observed Snow Covered Area Images AF upper bound Snow free T 1 T 2 Time dw = Prain + AF Psnow M S dt Estimated Accumulation Factor Green Lakes Valley Accumulation Factors. Jinsheng You, Unpublished PhD 2004 Measurements of SWE are hard to obtain over a larger area so other approaches are needed to estimate accumulation factor. This work from Jinsheng You uses a method based on snow covered area to estimate accumulation factor. The idea is that at each point there is a time/date at which snowcover was last observed and a later date at which a snow free surface was first observed. The accumulation factor in the mass balance equation can be used to adjust a model to have it predicting snow disappearance on either of these dates. This gives the range of AF. Now if we look at edge grid cells in the images and make the assumption that if they are snow covered, they are about to become snow free, or if they are snow free that they just became snow free then one of the bounds on AF can be selected for a subset of the domain. This subset of edge cells is used to calibrate a regression model related to topographic attributed to estimate AF over the entire domain.
12 Estimating Accumulation Factor from Blowing Snow Model SnowTran-3D: Wind modeled over topography producing deposition and erosion outputs snow depth accumulation factors defined as the ratio of simulated SWE to the water equivalent of snowfall Liston, G. E. and M. Sturm, (1998), "A Snow-Transport Model for Complex Terrain," Journal of Glaciology, 44(148): Another approach to modeling the spatial variability of SWE is to use a blowing snow model to physically quantify the effect of snow drifting. This slide illustrates the Snowtran 3D model developed by Liston and Sturm that represents the processes listed.
13 SnowTran-3D Simulations at Reynolds Creek Point March 3, 1993 USC Precip., LANDSAT Veg. 1.6 NS = R SnowTran-3D SWE (m) 2 = 0.19 comparison Distribution comparison 0.2 Cumulative probability Observed SWE (m) Observed SW E SnowTran-3D SW E (USC Precip, LANDSAT Veg) SnowTran-3D SW E (USC Precip, Uniform Veg) 0.0 Prasad, R., D. G. Tarboton, G. E. Liston, C. H. Luce and M. S. Seyfried, (2001), "Testing a Blowing Snow Model against Distributed Snow Measurements at Upper Sheep Creek, Idaho, USA," Water Resources Research, 37(5): Snow water equivalence (m) Here is an example of application of this model over the upper portion of the Reynolds Creek experimental watershed. Point comparisons were disappointing, but the overall distribution of SWE compared not too badly between model and observations. In some applications it is only this distribution that is needed so these results are still useful. They also point to the need for improving blowing snow models. 13
, \"Distributed Snowmelt Simulations in an Alpine Catchment. 1. Model Evaluation on the Basis of Snow Cover Patterns,\" Water Resources Research, 27(12): 3171-3179.")
14 Accumulation Factor estimated from topography using empirical rules (a 1 +a 2 z)*(1-f(slope)) *(1+a 3 curv) Blöschl, G., R. Kirnbauer and D. Gutnecht, (1991), "Distributed Snowmelt Simulations in an Alpine Catchment. 1. Model Evaluation on the Basis of Snow Cover Patterns," Water Resources Research, 27(12): This slide illustrates an empirical approach based on topography developed by Günter Blöschl.
15 Subgrid Variability Parameterization Resolved Element-to-Element Resolved by Subgrid Scale Parameterizations Spectral Power 2/ x Spacing Frequency (after Blöschl and Kirnbauer, 1994) This is also a slide from Blöschl's work. In snow modeling the scale of model elements controls the extent to which spatial variability can be explicitly represented by the model. Here in this spectral density function the variability associated with each scale or frequency is depicted. On the left at spacings larger than the element size variability is explicitly represented by differences between model elements. On the right at spacings smaller than the model element size variability has to be represented within a model element, i.e. subgrid variability. The representation of subgrid variability has been the focus of much work in snow and other modeling.
16 Depletion curve for parameterization of subgrid variability in accumulation and melt Relative Frequency Accumulation variability Relative Frequency Melt variability 1 A f or A f* 0 A f (W) = A f * (W/W amax ) B W w 0 W* = W/W max Depletion curve W max 1 A w Af (m) = fg( w + m) dw 0 = fg w dw = 1 Fg m m ( ) ( ) Luce, C. H., D. G. Tarboton and K. R. Cooley, (1999), "Subgrid Parameterization Of Snow Distribution For An Energy And Mass Balance Snow Cover Model," Hydrological Processes, 13: This slide shows a method we developed to use a depletion curve to represent subgrid variability.
17 Depletion curve parameterization of a point snowmelt model Surface energy fluxes Q sn Q li Q p Q h Q e Q le Wsc = Wa / Af (Wa / Wa max ) Snowfall Point model with per unit area snow water equivalent W sc and Energy content U Q g Snow covered area fraction A f du Qsn + Qli Qle + Qe = dt + Qh + Qg + Qp Qm dwsc dt = Pr + Ps Mr E This slide shows how a depletion curve is used to evolve a point model using energy and mass fluxes over only the snow covered area.
18 Basin Average Snow Water Equivalence (m) Upper Sheep Creek. Observed Distributed Model Subgrid Parameterization Oct-92 Nov-92 Dec-92 Jan-93 Feb-93 Mar-93 Apr-93 May-93 Jun-93 Luce, C. H., D. G. Tarboton and K. R. Cooley, (1999), "Subgrid Parameterization Of Snow Distribution For An Energy And Mass Balance Snow Cover Model," Hydrological Processes, 13: This shows how this works, in comparison to observations and a spatially explicit fully distributed model.
19 Af Depletion curves derived using distributions of surrogate variables Distributed modeled model reference reference Elevation, only z Accumulation factor factor, only Φ Elevation Peak accumulation and factor regression combining Φ, z W a /W amax Jinsheng You, Unpublished PhD 2004 In the slide just presented the depletion curve was derived based upon detailed spatially distributed measurements. This is impractical for large areas so we need ways to relate the depletion curves to surrogate measures of variability. This slide shows depletion curves derived from the following surrogate variables. (1) Elevation, (2) accumulation factor, in this case estimated from the snow covered area images, and (3) a peak accumulation estimate based on regression with accumulation factor and elevation as predictor variables. The regression parameters were calibrated against peak accumulation from a spatially explicit model. The spatially explicit distributed model is used as a reference. We see that it is possible to get depletion curves that approach the reference depletion curve based on surrogate variables, but that the better estimates still require some reliance on spatially explicit modeling.
20 Time Stability of Depletion Curves Af W* = W a/w amax Depletion curves from several years of data at Upper Sheep Creek (data provided by K. Cooley) In this slide we examine the time stability of depletion curves. One of the foundations of the depletion curve approach is that the same shape of depletion curve is assumed for low and high snow years. The rescaling based on maximum accumulation is important for the ease of practical implementation free from specific date assumptions for peak accumulation. This shows in data from Keith Cooley at Upper sheep creek for 9 years that the depletion curve (at least here) appears to be relatively stable across years. This stability is the basis for another idea for the use of depletion curves. Snow covered area is relatively easy to measure, and if one during a melt season observed Af, one can infer from a depletion curve the fraction of basin average snow water equivalent that has melted and the fraction that remains in the basin. One then just needs an index of scale to infer the actual melt amounts or water equivalent remaining. Potential indices include point measurements, e.g. from SNOTEL, or measurements of melt runoff at a stream gage. This idea is developed further in a minute.
21 Practical estimation of depletion curves remains a challenge A suggestion Assimilate observed snow covered area with modeling to derive depletion curve and surface water input t 1 t 2 t 3 t 4 t 5 t 6 t 7 A f A f (t) t 1 t 2 t 3 t 4 t 5 t 6 t 7 Time There are still challenges in the estimation of depletion curves and following is a suggestion (not tested) that we put forth for possibly doing this. Again this relies on the idea that snow covered area is relatively easy to measure. One can take measurements of snow covered area over time to establish Af(t).
22 Point model initialized with sufficient snow to sustain snowcover to season end mm/hr ( ) p g p Melt Rate Oct Nov Dec Jan Feb Mar Apr May Jun Jul Aug Cumulative Melt m(t) t 1 t 2 t 3 t 4 t 5 t 6 t 7 Time Next one can initialize a model with sufficient snow to sustain snow cover over a season to obtain potential melt over time.
23 Combining A f A f (t) Time & Cumulative Melt m(t) Time A f (m) A f W a = shaded area w m Wa ( m) = Af m (w) dw W a (A f ) or A f (W a ) Combining these gives Af(m). The relationship between snow covered area and potential melt is at the heart of the derivation of depletion curves from the spatial distribution of snow as illustrated here. Given an initial spatially variable snow distribution subject to potential melt m, the remaining snow water equivalent is the integral of snow water equivalent over the area with depths greater than m. This establishes the relationship between basin average snow covered area Wa and melt m. This can be used to establish the depletion curve Wa(Af) or its inverse.
24 Potential results Post season reconstruction of W a (t) (Similar to Cline, D. W., R. C. Bales and J. Dozier, (1998), "Estimating the Spatial Distribution of Snow in Mountain Basins Using Remote Sensing and Energy Balance Modeling," Water Resources Research, 34(5): who suggested post season reconstruction of spatially distributed peak snow accumulation based on a spatially distributed model) A f (W a ) for future modeling and surface water input estimation Once depletion curve is in hand observations of A f give fraction of W that has been depleted/is remaining This idea has potential to provide for post season reconstruction of time series of basin average snow water equivalent. Don Cline and colleagues used a similar idea to reconstruct spatially distributed snow water equivalent based on a spatially distributed model. This is also similar to the idea Jinsheng You's results that I showed earlier for estimating accumulation factor from a sequence of images. In these methods I think that uncertainty will be reduced when the function is well defined by frequent snow covered area images. MODIS may be good sensor to try with this method. Once the depletion curve is established through this approach it can be used for future modeling and surface water estimation, as well as in real time to give the fraction of snow remaining in a watershed for operational purposes.
, \"A Modified Force-Restore Approach to Modeling Snow-Surface Heat Fluxes,\" Proceedings of the 69th Annual Western Snow Conference, Sun Valley, Idaho.")
25 Snow's role in energy fluxes Temperature fluctuations with depth and insulating effects Luce, C. H. and D. G. Tarboton, (2001), "A Modified Force-Restore Approach to Modeling Snow-Surface Heat Fluxes," Proceedings of the 69th Annual Western Snow Conference, Sun Valley, Idaho. The role that snow plays in energy fluxes also deserves some attention. This shows thermocouple measurements of snow temperature at different depths in a snowpack as well as infrared measurements of surface temperature. The dampening of fluctuations with depth illustrate the thermal insulating effect of snow.
26 Heat conduction theory Semi infinite domain 2 T T λ = k 2 k = t z Cρ For diurnal fluctuations at surface z d1 ( T z, t) =< T > + Ae ω 1 = 2π/24hr sin ω1t d = 1 z d 1 2k ω 1 z d e 1 Amplitude Q cs dt = λ dz z= 0 λ dt = d ω dt 1 1 s λ + d 1 ( T < T > ) s These observations can be understood using heat conduction theory over a semi-infinite domain. For diurnal fluctuations at the surface the dampening depth is dependent upon snow properties. This idea was used in the UEB snowmelt model we developed to parameterize the surface temperature without having to resort to layering in the model. These observations can also be used to infer thermal properties of the snow for use in models.
27 Inference of thermal properties Amplitude decrease used to evaluate effective conductivity to each depth z Amplitude exp(z/d 1 ) z/d 1 d 1 k λ cm C cm cm 2 /hr W/m/K This slide shows some snow properties estimated from these measurements.
28 Snow temperature measurements useful to track and validate model energy content needed to predict for the onset of snowmelt Observed Energy Content Estimated from Tave Model Estimated from Force Restore Estimated from Modified Force Restore Energy Content (kj/m 2 ) /26/93 0:00 1/28/93 0:00 1/30/93 0:00 2/1/93 0:00 2/3/93 0:00 2/5/93 0:00 2/7/93 0:00 2/9/93 0:00 Luce, C. H. and D. G. Tarboton, (2001), "A Modified Force-Restore Approach to Modeling Snow-Surface Heat Fluxes," Proceedings of the 69th Annual Western Snow Conference, Sun Valley, Idaho. This slide shows comparisons of modeled and measured snow energy content. We found these measurements of snow temperature useful to validate modeled energy content and correct energy content modeling discrepancies.
29 Important issues not mentioned Sublimation Interception and the role of vegetation Local advection effects on energy balance Within snow flow processes resulting in Fingers Ice columns and lenses Implications for runoff generation of concentrated surface water input I have in this presentation focused on the importance of measuring, understanding and modeling heterogeneity, and to a lesser extent touched on some of the thermal properties of snow. There are also many things that I did not mention because of time limitations that are also important and are listed here.
30 Challenges to understanding snow and runoff processes in a variable climate Quantifying and measuring input precipitation/snowfall basin average and spatial patterns Measuring SWE over large areas spatial patterns Integration of remote sensing and ground observations and modeling Let me try wrap up some of these ideas. Here is a list of some of the challenges I see where additional snow hydrology research is needed.
31 Challenges contd. Quantifying and understanding heterogeneity Improve blowing snow models Improve relationships with topography (generalization) Improve representations of sub grid variability (watershed scale and up) Better quantify snow thermal properties
SPATIALLY DISTRIBUTED SNOWMELT INPUTS TO A SEMI-ARID MOUNTAIN WATERSHED
 SPATIALLY DISTRIBUTED SNOWMELT INPUTS TO A SEMI-ARID MOUNTAIN WATERSHED ABSTRACT Charles H. Luce 1, David G. Tarboton 2, Keith R. Cooley 3 Spatial variability in snow accumulation and melt due to topographic
Snowcover interaction with climate, topography & vegetation in mountain catchments
 Snowcover interaction with climate, topography & vegetation in mountain catchments DANNY MARKS Northwest Watershed Research Center USDA-Agricultural Agricultural Research Service Boise, Idaho USA RCEW
Testing a blowing snow model against distributed snow measurements at Upper Sheep Creek, Idaho, United States of America
 WATER RESOURCES RESEARCH, VOL. 37, NO. 5, PAGES 1341 1350, MAY 2001 Testing a blowing snow model against distributed snow measurements at Upper Sheep Creek, Idaho, United States of America Rajiv Prasad,
Quenching the Valley s thirst: The connection between Sierra Nevada snowpack & regional water supply
 Quenching the Valley s thirst: The connection between Sierra Nevada snowpack & regional water supply Roger Bales, UC Merced Snow conditions Snow & climate change Research directions Sierra Nevada snow
SUBGRID PARAMETERIZATION OF SNOW DISTRIBUTION FOR AN ENERGY AND MASS BALANCE SNOW COVER MODEL
 SUBGRID PARAMETERIZATION OF SNOW DISTRIBUTION FOR AN ENERGY AND MASS BALANCE SNOW COVER MODEL CHARLES H. LUCE USDA Forest Service, Rocky Mtn. Research Station, 316 E. Myrtle, Boise, Idaho 83702 DAVID G.
A SIMPLE GIS-BASED SNOW ACCUMULATION AND MELT MODEL. Erin S. Brooks 1 and Jan Boll 2 ABSTRACT
 A SIMPLE GIS-BASED SNOW ACCUMULATION AND MELT MODEL Erin S. Brooks 1 and Jan Boll 2 ABSTRACT A simple distributed snow accumulation and melt (SAM) model was developed for use in GIS-based hydrologic models.
APPLICATION OF AN ARCTIC BLOWING SNOW MODEL
 APPLICATION OF AN ARCTIC BLOWING SNOW MODEL J.W. Pomero l, P. ~arsh' and D.M. Gray2 -Hydrology Research Institute Saskatoon, Saskatchewan, Canada S7N 3H5 '~ivision of Hydrology, University of Saskatchewan
MARMOT CREEK BASIN: MANAGING FORESTS FOR WATER
 MARMOT CREEK BASIN: MANAGING FORESTS FOR WATER CABIN AND TWIN CREEK EXPERIMENTS 1962-1987 MARMOT CREEK SUBBASINS Subbasin Drainage Treatment Area (ha) (completion date) Cabin Creek 212 (50%)* Commercial
Novel Snotel Data Uses: Detecting Change in Snowpack Development Controls, and Remote Basin Snow Depth Modeling
 Novel Snotel Data Uses: Detecting Change in Snowpack Development Controls, and Remote Basin Snow Depth Modeling OVERVIEW Mark Losleben and Tyler Erickson INSTAAR, University of Colorado Mountain Research
Snowcover along elevation gradients in the Upper Merced and Tuolumne River basin of the Sierra Nevada of California from MODIS and blended ground data
 Snowcover along elevation gradients in the Upper Merced and Tuolumne River basin of the Sierra Nevada of California from MODIS and blended ground data Robert Rice a, Roger Bales a, Thomas H. Painter b,
The in uence of the spatial distribution of snow on basin-averaged snowmelt
 Hydrological Processes Hydrol. Process. 12, 1671±1683 (1998) The in uence of the spatial distribution of snow on basin-averaged snowmelt Charles H. Luce, 1 * David G. Tarboton 2 and Keith R. Cooley 3 1
THE ROLE OF MICROSTRUCTURE IN FORWARD MODELING AND DATA ASSIMILATION SCHEMES: A CASE STUDY IN THE KERN RIVER, SIERRA NEVADA, USA
 MICHAEL DURAND (DURAND.8@OSU.EDU), DONGYUE LI, STEVE MARGULIS Photo: Danielle Perrot THE ROLE OF MICROSTRUCTURE IN FORWARD MODELING AND DATA ASSIMILATION SCHEMES: A CASE STUDY IN THE KERN RIVER, SIERRA
Surface & subsurface processes in mountain environments
 Surface & subsurface processes in mountain environments evapotranspiration snowmelt precipitation infiltration Roger Bales Martha Conklin Robert Rice Fengjing Liu Peter Kirchner runoff sublimation ground
Inter-linkage case study in Pakistan
 7 th GEOSS Asia Pacific Symposium GEOSS AWCI Parallel Session: 26-28 May, 2014, Tokyo, Japan Inter-linkage case study in Pakistan Snow and glaciermelt runoff modeling in Upper Indus Basin of Pakistan Maheswor
ESTIMATING SNOWMELT CONTRIBUTION FROM THE GANGOTRI GLACIER CATCHMENT INTO THE BHAGIRATHI RIVER, INDIA ABSTRACT INTRODUCTION
 ESTIMATING SNOWMELT CONTRIBUTION FROM THE GANGOTRI GLACIER CATCHMENT INTO THE BHAGIRATHI RIVER, INDIA Rodney M. Chai 1, Leigh A. Stearns 2, C. J. van der Veen 1 ABSTRACT The Bhagirathi River emerges from
Modeling of peak inflow dates for a snowmelt dominated basin Evan Heisman. CVEN 6833: Advanced Data Analysis Fall 2012 Prof. Balaji Rajagopalan
 Modeling of peak inflow dates for a snowmelt dominated basin Evan Heisman CVEN 6833: Advanced Data Analysis Fall 2012 Prof. Balaji Rajagopalan The Dworshak reservoir, a project operated by the Army Corps
A Review of the 2007 Water Year in Colorado
 A Review of the 2007 Water Year in Colorado Nolan Doesken Colorado Climate Center, CSU Mike Gillespie Snow Survey Division, USDA, NRCS Presented at the 28 th Annual AGU Hydrology Days, March 26, 2008,
Climate also has a large influence on how local ecosystems have evolved and how we interact with them.
 The Mississippi River in a Changing Climate By Paul Lehman, P.Eng., General Manager Mississippi Valley Conservation (This article originally appeared in the Mississippi Lakes Association s 212 Mississippi
Lake Tahoe Watershed Model. Lessons Learned through the Model Development Process
 Lake Tahoe Watershed Model Lessons Learned through the Model Development Process Presentation Outline Discussion of Project Objectives Model Configuration/Special Considerations Data and Research Integration
Climate Change and Arizona s Rangelands: Management Challenges and Opportunities
 Climate Change and Arizona s Rangelands: Management Challenges and Opportunities Mike Crimmins Climate Science Extension Specialist Dept. of Soil, Water, & Env. Science & Arizona Cooperative Extension
Disentangling Impacts of Climate & Land Use Changes on the Quantity & Quality of River Flows in Southern Ontario
 Disentangling Impacts of Climate & Land Use Changes on the Quantity & Quality of River Flows in Southern Ontario by Trevor Dickinson & Ramesh Rudra, Water Resources Engineering University of Guelph Acknowledgements
Impacts of snowpack accumulation and summer weather on alpine glacier hydrology
 Impacts of snowpack accumulation and summer weather on alpine glacier hydrology Caroline Aubry-Wake, Dhiraj Pradhananga, John W. Pomeroy GEWEX 8 th Open Science Meeting, Canmore AB, May 3-11 2018 Canadian
Remote Sensing of Snow GEOG 454 / 654
 Remote Sensing of Snow GEOG 454 / 654 What crysopheric questions can RS help to answer? 2 o Where is snow lying? (Snow-covered area or extent) o How much is there? o How rapidly is it melting? (Area, depth,
Terrestrial Snow Cover: Properties, Trends, and Feedbacks. Chris Derksen Climate Research Division, ECCC
 Terrestrial Snow Cover: Properties, Trends, and Feedbacks Chris Derksen Climate Research Division, ECCC Outline Three Snow Lectures: 1. Why you should care about snow: Snow and the cryosphere Classes of
Snowcover accumulation and soil temperature at sites in the western Canadian Arctic
 Snowcover accumulation and soil temperature at sites in the western Canadian Arctic Philip Marsh 1, C. Cuell 1, S. Endrizzi 1, M. Sturm 2, M. Russell 1, C. Onclin 1, and J. Pomeroy 3 1. National Hydrology
Climate Variability. Eric Salathé. Climate Impacts Group & Department of Atmospheric Sciences University of Washington. Thanks to Nathan Mantua
 Climate Variability Eric Salathé Climate Impacts Group & Department of Atmospheric Sciences University of Washington Thanks to Nathan Mantua Northwest Climate: the mean Factors that influence local/regional
Missouri River Basin Water Management Monthly Update
 Missouri River Basin Water Management Monthly Update Participating Agencies 255 255 255 237 237 237 0 0 0 217 217 217 163 163 163 200 200 200 131 132 122 239 65 53 80 119 27 National Oceanic and Atmospheric
Sub-grid parameterization of snow distribution for an energy and mass balance snow cover model
 HYDROLOGICAL PROCESSES Hydrol. Process. 13, 1921±1933 (1999) Sub-grid parameterization of snow distribution for an energy and mass balance snow cover model Charles H. Luce, 1 * David G. Tarboton 2 and
Why modelling? Glacier mass balance modelling
 Why modelling? Glacier mass balance modelling GEO 4420 Glaciology 12.10.2006 Thomas V. Schuler t.v.schuler@geo.uio.no global mean temperature Background Glaciers have retreated world-wide during the last
Effects of forest cover and environmental variables on snow accumulation and melt
 Effects of forest cover and environmental variables on snow accumulation and melt Mariana Dobre, William J. Elliot, Joan Q. Wu, Timothy E. Link, Ina S. Miller Abstract The goal of this study was to assess
NRC Workshop Probabilistic Flood Hazard Assessment (PFHA) Jan 29-31, Mel Schaefer Ph.D. P.E. MGS Engineering Consultants, Inc.
 Jan 29-31, Mel Schaefer Ph.D. P.E. MGS Engineering Consultants, Inc.") Stochastic Event Flood Model (SEFM) Stochastic Modeling of Extreme Floods A Hydrological Tool for Analysis of Extreme Floods Mel Schaefer Ph.D. P.E. MGS Engineering Consultants, Inc. Olympia, WA NRC Workshop
Stochastic Event Flood Model (SEFM) Stochastic Modeling of Extreme Floods A Hydrological Tool for Analysis of Extreme Floods Mel Schaefer Ph.D. P.E. MGS Engineering Consultants, Inc. Olympia, WA NRC Workshop
Prediction of Snow Water Equivalent in the Snake River Basin
 Hobbs et al. Seasonal Forecasting 1 Jon Hobbs Steve Guimond Nate Snook Meteorology 455 Seasonal Forecasting Prediction of Snow Water Equivalent in the Snake River Basin Abstract Mountainous regions of
A High Elevation Climate Monitoring Network
 A High Elevation Climate Monitoring Network Kelly T. Redmond Western Regional Climate Center Desert Research Institute Reno Nevada AGU San Francisco WRCC / OSU Nevada Precip-Elevation Distribution 100%
Central Asia Regional Flash Flood Guidance System 4-6 October Hydrologic Research Center A Nonprofit, Public-Benefit Corporation
 http://www.hrcwater.org Central Asia Regional Flash Flood Guidance System 4-6 October 2016 Hydrologic Research Center A Nonprofit, Public-Benefit Corporation FFGS Snow Components Snow Accumulation and
SNOW PACK PATTERNS, IN THE ALPINE TUNDRA, NIWOT RIDGE, FRONT RANGE COLORADOl. James C. Halfpenny, Oren D. Pollak, and Michael W.
 155 SNOW PACK PATTRNS, N TH ALPN TUNDRA, NWOT RDG, FRONT RANG COLORADOl James C. Halfpenny, Oren D. Pollak, and Michael W. Heffernan2 Abstract.--Snowpack was monitored from April 1982 to August 1983 in
GLACIER AND SNOWMELT MODELLING USING SWAT: GANGA BASIN CASE STUDY. INRM Consultants Pvt. Ltd.
 GLACIER AND SNOWMELT MODELLING USING SWAT: GANGA BASIN CASE STUDY INRM Consultants Pvt. Ltd. Introduction Snowmelt Runoff contribution in the Himalayan Rivers Estimation of Average contribution of Snowmelt
CoCoRaHS Monitoring Colorado s s Water Resources through Community Collaborations
 CoCoRaHS Monitoring Colorado s s Water Resources through Community Collaborations Nolan Doesken Colorado Climate Center Atmospheric Science Department Colorado State University Presented at Sustaining
Scaling snow observations from the point to the grid element: Implications for observation network design
 WATER RESOURCES RESEARCH, VOL. 41, W11421, doi:10.1029/2005wr004229, 2005 Scaling snow observations from the point to the grid element: Implications for observation network design Noah P. Molotch Cooperative
RELATIVE IMPORTANCE OF GLACIER CONTRIBUTIONS TO STREAMFLOW IN A CHANGING CLIMATE
 Proceedings of the Second IASTED International Conference WATER RESOURCE MANAGEMENT August 20-22, 2007, Honolulu, Hawaii, USA ISGN Hardcopy: 978-0-88986-679-9 CD: 978-0-88-986-680-5 RELATIVE IMPORTANCE
Water Year Day 2010
 mm mm SCA, % Storage, mm Sto, 1 mm Sat def, 1 mm 25 2 15 1 5 4 3 2 1 2 5 25 2 Saturation deficit depth (water table) Saturation deficit volume Root zone storage Unsaturated soil storage Groundwater storage
Missouri River Basin Water Management Monthly Update
 Missouri River Basin Water Management Monthly Update Participating Agencies 255 255 255 237 237 237 0 0 0 217 217 217 163 163 163 200 200 200 131 132 122 239 65 53 80 119 27 National Oceanic and Atmospheric
Basic Hydrologic Science Course Understanding the Hydrologic Cycle Section Six: Snowpack and Snowmelt Produced by The COMET Program
 Basic Hydrologic Science Course Understanding the Hydrologic Cycle Section Six: Snowpack and Snowmelt Produced by The COMET Program Snow and ice are critical parts of the hydrologic cycle, especially at
HYDROLOGICAL MODELING OF HIGHLY GLACIERIZED RIVER BASINS. Nina Omani, Raghavan Srinivasan, Patricia Smith, Raghupathy Karthikeyan, Gerald North
 HYDROLOGICAL MODELING OF HIGHLY GLACIERIZED RIVER BASINS Nina Omani, Raghavan Srinivasan, Patricia Smith, Raghupathy Karthikeyan, Gerald North Problem statement Glaciers help to keep the earth cool High
Hydro-meteorological Analysis of Langtang Khola Catchment, Nepal
 Hydro-meteorological Analysis of Langtang Khola Catchment, Nepal Tirtha R. Adhikari 1, Lochan P. Devkota 1, Suresh.C Pradhan 2, Pradeep K. Mool 3 1 Central Department of Hydrology and Meteorology Tribhuvan
Using MODIS imagery to validate the spatial representation of snow cover extent obtained from SWAT in a data-scarce Chilean Andean watershed
 Using MODIS imagery to validate the spatial representation of snow cover extent obtained from SWAT in a data-scarce Chilean Andean watershed Alejandra Stehr 1, Oscar Link 2, Mauricio Aguayo 1 1 Centro
Climate Change and Water Supply Research. Drought Response Workshop October 8, 2013
 Climate Change and Water Supply Research Drought Response Workshop October 8, 2013 DWR Photo Oroville Reservoir, 2009 Talk Overview Expectations History Atmospheric Rivers and Water Supply Current Research
Webinar and Weekly Summary February 15th, 2011
 Webinar and Weekly Summary February 15th, 2011 -Assessment of current water conditions - Precipitation Forecast - Recommendations for Drought Monitor Upper Colorado Normal Precipitation Upper Colorado
Funding provided by NOAA Sectoral Applications Research Project CLIMATE. Basic Climatology Colorado Climate Center
 Funding provided by NOAA Sectoral Applications Research Project CLIMATE Basic Climatology Colorado Climate Center Remember These? Factor 1: Our Energy Source Factor 2: Revolution & Tilt Factor 3: Rotation!
GAMINGRE 8/1/ of 7
 FYE 09/30/92 JULY 92 0.00 254,550.00 0.00 0 0 0 0 0 0 0 0 0 254,550.00 0.00 0.00 0.00 0.00 254,550.00 AUG 10,616,710.31 5,299.95 845,656.83 84,565.68 61,084.86 23,480.82 339,734.73 135,893.89 67,946.95
Drought and Future Water for Southern New Mexico
 Drought and Future Water for Southern New Mexico David S. Gutzler University of New Mexico gutzler@unm.edu * The big drought of 2018 * Longer term challenges for water supply * Forecasting streamflow Elephant
Studying snow cover in European Russia with the use of remote sensing methods
 40 Remote Sensing and GIS for Hydrology and Water Resources (IAHS Publ. 368, 2015) (Proceedings RSHS14 and ICGRHWE14, Guangzhou, China, August 2014). Studying snow cover in European Russia with the use
Water information system advances American River basin. Roger Bales, Martha Conklin, Steve Glaser, Bob Rice & collaborators UC: SNRI & CITRIS
 Water information system advances American River basin Roger Bales, Martha Conklin, Steve Glaser, Bob Rice & collaborators UC: SNRI & CITRIS Opportunities Unprecedented level of information from low-cost
4. THE HBV MODEL APPLICATION TO THE KASARI CATCHMENT
 Application of HBV model to the Kasari River, 1994 Page 1 of 6 Application of the HBV model to the Kasari river for flow modulation of catchments characterised by specific underlying features by R. Vedom,
Remote Sensing of SWE in Canada
 Remote Sensing of SWE in Canada Anne Walker Climate Research Division, Environment Canada Polar Snowfall Hydrology Mission Workshop, June 26-28, 2007 Satellite Remote Sensing Snow Cover Optical -- Snow
Flood Forecasting Tools for Ungauged Streams in Alberta: Status and Lessons from the Flood of 2013
 Flood Forecasting Tools for Ungauged Streams in Alberta: Status and Lessons from the Flood of 2013 John Pomeroy, Xing Fang, Kevin Shook, Tom Brown Centre for Hydrology, University of Saskatchewan, Saskatoon
Climatic and Ecological Conditions in the Klamath Basin of Southern Oregon and Northern California: Projections for the Future
 Climatic and Ecological Conditions in the Klamath Basin of Southern Oregon and Northern California: Projections for the Future A Collaborative Effort by: CLIMATE LEADERSHIP INITIATIVE INSTITUTE FOR A SUSTAINABLE
APPLICATIONS OF DOWNSCALING: HYDROLOGY AND WATER RESOURCES EXAMPLES
 APPLICATIONS OF DOWNSCALING: HYDROLOGY AND WATER RESOURCES EXAMPLES Dennis P. Lettenmaier Department of Civil and Environmental Engineering For presentation at Workshop on Regional Climate Research NCAR
Lecture 8: Snow Hydrology
 GEOG415 Lecture 8: Snow Hydrology 8-1 Snow as water resource Snowfall on the mountain ranges is an important source of water in rivers. monthly pcp (mm) 100 50 0 Calgary L. Louise 1 2 3 4 5 6 7 8 9 10
P. Marsh and J. Pomeroy National Hydrology Research Institute 11 Innovation Blvd., Saskatoon, Sask. S7N 3H5
 WATER AND ENERGY FLUXES DURING THE SNOWMELT PERIOD AT AN ARCTIC TREELINE SITE P. Marsh and J. Pomeroy National Hydrology Research Institute 11 Innovation Blvd., Saskatoon, Sask. S7N 3H5 marshp@nhrisv.nhrc.skdoe.ca
What is the difference between Weather and Climate?
 What is the difference between Weather and Climate? Objective Many people are confused about the difference between weather and climate. This makes understanding the difference between weather forecasts
Subgrid variability of snow water equivalent at operational snow stations in the western USA
 HYDROLOGICAL PROCESSES Hydrol. Process. (212) Published online in Wiley Online Library (wileyonlinelibrary.com) DOI: 1.12/hyp.9355 Subgrid variability of snow water equivalent at operational snow stations
Hydrologic Analysis and Process-Based Modeling for the Upper Cache La Poudre Basin
 Hydrologic Analysis and Process-Based Modeling for the Upper Cache La Poudre Basin Stephanie K. Kampf Eric E. Richer October 2010 Completion Report No. 222 Acknowledgements The authors thank the Colorado
Presentation Overview. Southwestern Climate: Past, present and future. Global Energy Balance. What is climate?
 Southwestern Climate: Past, present and future Mike Crimmins Climate Science Extension Specialist Dept. of Soil, Water, & Env. Science & Arizona Cooperative Extension The University of Arizona Presentation
Overview on the modelling setup Seven new features in the modelling framework First results for the Alpine Rhine and Engadin Conclusions and Outlook
 SUB PROJECT: Natural water balance of Switzerland and its most important large river basins Overview on the modelling setup Seven new features in the modelling framework First results for the Alpine Rhine
Direction and range of change expected in the future
 Direction and range of Air Temperature Over the past 30 years, air Across the greater PNW and temperature has been Columbia Basin, an ensemble increasing an average of forecast from ten of the best 0.13
A Report on a Statistical Model to Forecast Seasonal Inflows to Cowichan Lake
 A Report on a Statistical Model to Forecast Seasonal Inflows to Cowichan Lake Prepared by: Allan Chapman, MSc, PGeo Hydrologist, Chapman Geoscience Ltd., and Former Head, BC River Forecast Centre Victoria
Climate Variability in South Asia
 Climate Variability in South Asia V. Niranjan, M. Dinesh Kumar, and Nitin Bassi Institute for Resource Analysis and Policy Contents Introduction Rainfall variability in South Asia Temporal variability
Science Standard 1: Students analyze monthly precipitation and temperature records, displayed in bar charts, collected in metric units (mm).
.") Title: Precipitation Patterns across the Globe NSF GK-12 Fellow: Terry Legg Type of Lesson: STEM Grade Level(s): 4 th - 7 th grade This activity can be tailored to older, more advanced students by having
Title: Precipitation Patterns across the Globe NSF GK-12 Fellow: Terry Legg Type of Lesson: STEM Grade Level(s): 4 th - 7 th grade This activity can be tailored to older, more advanced students by having
San Francisco Public Utilities Commission Hydrological Conditions Report For March 2016
 San Francisco Public Utilities Commission Hydrological Conditions Report For March 2016 J. Chester, C. Graham, A. Mazurkiewicz, & M. Tsang, April 7, 2016 Snow Surveyor Chris Graham crossing Huckleberry
Highlights of the 2006 Water Year in Colorado
 Highlights of the 2006 Water Year in Colorado Nolan Doesken, State Climatologist Atmospheric Science Department Colorado State University http://ccc.atmos.colostate.edu Presented to 61 st Annual Meeting
What Does It Take to Get Out of Drought?
 What Does It Take to Get Out of Drought? Nolan J. Doesken Colorado Climate Center Colorado State University http://ccc.atmos.colostate.edu Presented at the Insects, Diseases and Drought Workshop, May 19,
Jet Propulsion Laboratory California Institute of Technology. ASO In The Tuolumne: 3 Years Of Basin SWE, and PRMS Assimilation Results
 ASO In The Tuolumne: 3 Years Of Basin SWE, and PRMS Assimilation Results Bruce J. McGurk and Thomas H. Painter & ASO Team Hydroclimate Workshop, 8 Oct. 2015 Need frequent, dense SWE data at all elevations
DEVELOPMENT OF AN AREAL SNOW DEPLETION CURVE IN THE DRY CREEK EXPERIMENTAL WATERSHED USING MODIS SATELLITE IMAGERY
 DEVELOPMENT OF AN AREAL SNOW DEPLETION CURVE IN THE DRY CREEK EXPERIMENTAL WATERSHED USING MODIS SATELLITE IMAGERY AND THE UTAH ENERGY BALANCE SNOW ACCUMULATION AND MELT MODEL by Michael Procsal A thesis
Spatially-Distributed Simulation of the Snowpack within the GSSHA Hydrologic Model for Areas with Limited Data
 Spatially-Distributed Simulation of the Snowpack within the GSSHA Hydrologic Model for Areas with Limited Data 2016 AWRA Specialty Conference Sacramento, CA 13 July 2016 Michael L. Follum*, Charles W.
Spectral Albedos. a: dry snow. b: wet new snow. c: melting old snow. a: cold MY ice. b: melting MY ice. d: frozen pond. c: melting FY white ice
 Spectral Albedos a: dry snow b: wet new snow a: cold MY ice c: melting old snow b: melting MY ice d: frozen pond c: melting FY white ice d: melting FY blue ice e: early MY pond e: ageing ponds Extinction
2. PHYSICAL SETTING FINAL GROUNDWATER MANAGEMENT PLAN. 2.1 Topography. 2.2 Climate
 FINAL GROUNDWATER MANAGEMENT PLAN 2. PHYSICAL SETTING Lassen County is a topographically diverse area at the confluence of the Cascade Range, Modoc Plateau, Sierra Nevada and Basin and Range geologic provinces.
Let s Talk Climate! Nolan Doesken Colorado Climate Center Colorado State University. Yampatika Seminar February 16, 2011 Steamboat Springs, Colorado
 Let s Talk Climate! Nolan Doesken Colorado Climate Center Colorado State University Yampatika Seminar February 16, 2011 Steamboat Springs, Colorado First -- A short background In 1973 the federal government
ESTIMATION OF NEW SNOW DENSITY USING 42 SEASONS OF METEOROLOGICAL DATA FROM JACKSON HOLE MOUNTAIN RESORT, WYOMING. Inversion Labs, Wilson, WY, USA 2
 ESTIMATION OF NEW SNOW DENSITY USING 42 SEASONS OF METEOROLOGICAL DATA FROM JACKSON HOLE MOUNTAIN RESORT, WYOMING Patrick J. Wright 1 *, Bob Comey 2,3, Chris McCollister 2,3, and Mike Rheam 2,3 1 Inversion
Mapping the extent of temperature-sensitive snowcover and the relative frequency of warm winters in the western US
 Mapping the extent of temperature-sensitive snowcover and the relative frequency of warm winters in the western US Anne Nolin Department of Geosciences Oregon State University Acknowledgements Chris Daly,
Forecast Challenges for the Colorado Basin River Forecast Center
 Forecast Challenges for the Colorado Basin River Forecast Center John Lhotak, Development and Operations Hydrologist Improving Sub-Seasonal to Seasonal (S2S) Workshop May 16th, 2018 1 River Forecast Centers
Regional Climate Change: Current Impacts and Perspectives Greater Lake Nipissing Stewardship Council Annual Meeting Wednesday April 16, 2014
 Regional Climate Change: Current Impacts and Perspectives Greater Lake Nipissing Stewardship Council Annual Meeting Wednesday April 16, 2014 Speaker: Peter Bullock, Stantec Consulting Information Source:
Climate Update. Wendy Ryan and Nolan Doesken Colorado Climate Center. Atmospheric Science Department Colorado State University
 Climate Update Wendy Ryan and Nolan Doesken Colorado Climate Center Atmospheric Science Department Colorado State University Presented to Water Availability Task Force June 26, 2008 Denver, CO Prepared
Joseph M. Shea 1, R. Dan Moore, Faron S. Anslow University of British Columbia, Vancouver, BC, Canada. 1 Introduction
 17th Conference on Applied Climatology, American Meteorological Society, 11-1 August, 28, Whistler, BC, Canada P2. - Estimating meteorological variables within glacier boundary layers, Southern Coast Mountains,
9. PROBABLE MAXIMUM PRECIPITATION AND PROBABLE MAXIMUM FLOOD
 9. PROBABLE MAXIMUM PRECIPITATION AND PROBABLE MAXIMUM FLOOD 9.1. Introduction Due to the size of Watana Dam and the economic importance of the Project to the Railbelt, the Probable Maximum Flood (PMF)
San Francisco Public Utilities Commission Hydrological Conditions Report For April 2014
 San Francisco Public Utilities Commission Hydrological Conditions Report For April 2014 J. Chester, C. Graham, A. Mazurkiewicz, & M. Tsang, May 13, 2014 Snow in the High Country The view from Bond Pass
INVISIBLE WATER COSTS
 Every Drop Every Counts... Drop Counts... INVISIBLE WATER COSTS Corn - 108.1 gallons per pound How much water it takes to produce... Apple - 18.5 gallons to grow Beef - 1,581 gallons per pound Oats - 122.7
Drought in Southeast Colorado
 Drought in Southeast Colorado Nolan Doesken and Roger Pielke, Sr. Colorado Climate Center Prepared by Tara Green and Odie Bliss http://climate.atmos.colostate.edu 1 Historical Perspective on Drought Tourism
Investigating the influences of climate on the high elevation snowpack hydrology in the upper Colorado region.
 University of Louisville ThinkIR: The University of Louisville's Institutional Repository Electronic Theses and Dissertations 5-2016 Investigating the influences of climate on the high elevation snowpack
Persistence of Soil Moisture in the Cariboo Mountains, BC
 Persistence of Soil Moisture in the Cariboo Mountains, BC Tullia Leona Upton University of Northern Brithish Columbia M.Sc. Candidate Natural Resources and Environmental Studies upton@unbc.ca Overview
Colorado s 2003 Moisture Outlook
 Colorado s 2003 Moisture Outlook Nolan Doesken and Roger Pielke, Sr. Colorado Climate Center Prepared by Tara Green and Odie Bliss http://climate.atmos.colostate.edu How we got into this drought! Fort
Spatiotemporal variations of alpine climate, snow cover and phenology
 Spatiotemporal variations of alpine climate, snow cover and phenology S. Asam, M. Callegari, M. Matiu, G. Fiore, L. De Gregorio, A. Jacob, A. Menzel, C. Notarnicola, M. Zebisch Asam et al., Spatiotemporal
Appendix A Calibration Memos
 Appendix A Calibration Memos University of Washington Department of Civil and Environmental Engineering TO: Joe Dvorak FROM: Margaret Hahn and Richard Palmer RE: DVSVM Calibration DATE: June 28, 21 This
The Colorado Drought : 2003: A Growing Concern. Roger Pielke, Sr. Colorado Climate Center.
 The Colorado Drought 2001-2003: 2003: A Growing Concern Roger Pielke, Sr. Colorado Climate Center Prepared by Tara Green and Odie Bliss http://climate.atmos.colostate.edu 2 2002 Drought History in Colorado
Changing Hydrology under a Changing Climate for a Coastal Plain Watershed
 Changing Hydrology under a Changing Climate for a Coastal Plain Watershed David Bosch USDA-ARS, Tifton, GA Jeff Arnold ARS Temple, TX and Peter Allen Baylor University, TX SEWRU Objectives 1. Project changes
Snow Distribution and Melt Modeling for Mittivakkat Glacier, Ammassalik Island, Southeast Greenland
 808 J O U R N A L O F H Y D R O M E T E O R O L O G Y VOLUME 7 Snow Distribution and Melt Modeling for Mittivakkat Glacier, Ammassalik Island, Southeast Greenland SEBASTIAN H. MERNILD Institute of Geography,
Technical note on seasonal adjustment for M0
 Technical note on seasonal adjustment for M0 July 1, 2013 Contents 1 M0 2 2 Steps in the seasonal adjustment procedure 3 2.1 Pre-adjustment analysis............................... 3 2.2 Seasonal adjustment.................................
Jessica Lundquist 1, Paul Neiman 3, Brooks Martner 2,3, Allen White 2,3, Dan Gottas 2,3, Marty Ralph 3
 PRELIMINARY STUDY RESULTS Rain versus Snow in the Sierra Nevada, CA: Comparing free-air observations of melting level with surface measurements Jessica Lundquist 1, Paul Neiman 3, Brooks Martner 2,3, Allen
HyMet Company. Streamflow and Energy Generation Forecasting Model Columbia River Basin
 HyMet Company Streamflow and Energy Generation Forecasting Model Columbia River Basin HyMet Inc. Courthouse Square 19001 Vashon Hwy SW Suite 201 Vashon Island, WA 98070 Phone: 206-463-1610 Columbia River
ACCUMULATED PRECIPITATION IN INCHES
 CUMULATIVE PRECIPITATION WATER YEAR COLUMBIA BASIN ABOVE GRAND COULEE 84% of Normal 1971- Average ACCUMULATED PRECIPITATION IN INCHES 8 6 82% of Normal 85% of Normal 82% of Normal SNAKE RIVER BASIN ABOVE
The Climate of Oregon Climate Zone 4 Northern Cascades
 /05 E55 Unbound issue No. 9/ is Does not circulate Special Report 916 May 1993 The Climate of Oregon Climate Zone 4 Property of OREGON STATE UNIVERSITY Library Serials Corvallis, OR 97331-4503 Agricultural