The WegenerNet observing weather and climate at 1 km-scale resolution: a new look at convective precipitation and other local-scale processes
|
|
|
- Amie Clarke
- 6 years ago
- Views:
Transcription
 and Inst. for Geophysics, Astrophysics, and Meteorology (IGAM)/Inst. of Physics, University of Graz, Graz, Austria (gottfried.")
1 The WegenerNet observing weather and climate at 1 km-scale resolution: a new look at convective precipitation and other local-scale processes G. Kirchengast, T. Kabas, A. Leuprecht, C. Stieb, and C. Bichler Wegener Center for Climate and Global Change (WegCenter) and Inst. for Geophysics, Astrophysics, and Meteorology (IGAM)/Inst. of Physics, University of Graz, Graz, Austria (gottfried.kirchengast@uni-graz.at, Session GI2 Atmosphere, Ocean, Meteorological Instruments and Ocean Observatory EGU General Assembly 2009; Apr 2009, Vienna, Austria

 WegenerNet Web and Data Portal Welcome WegenerNet, Session GI2, 21 Apr 2009, EGU Vienna,")
2 Outline WegenerNet Team & Sponsors One-slide Overview & Research Applications Station Setup & Measured Parameters WegenerNet Processing System & Data Product Generator First Results: Convective Precipitation (and Temperature) at 1km-scale & 5-min Resolution a new look (example cases from summer 2007, 2008) WegenerNet Web and Data Portal Welcome WegenerNet, Session GI2, 21 Apr 2009, EGU Vienna, Austria 1/19


3 WegenerNet Team & Sponsors WegenerNet Core Team: G. Kirchengast T. Kabas A. Leuprecht C. Stieb C. Bichler Further Contributors: H. Truhetz M. Suklitsch A. Pilz R.²Gsöls A.²Neuwirth and more Thanks BK Feldbach 1 and Thanks to many sponsors (those with logo here, and all others as well!) WegenerNet, Session GI2, 21 Apr 2009, EGU Vienna, Austria 2/

; several special main stations automatic near-real-time observation of parameters such as")

4 What is the WegenerNet? a pioneering experiment for high-resolution weather & climate observations, supporting monitoring, modeling, and prediction joint funds of federal, provincial, municipal, region partner & university levels (total ~800 k, 4-yrs mid-2005 to mid-2009) 151 quality stations in ~20 km x 15 km region (1 station per ~2 km 2 ); several special main stations automatic near-real-time observation of parameters such as temperature, humidity, precipitation, wind, pressure, radiation, complemented by soil moisture (pf) and temperature; also high-res lightning, weather radar data (more extensions considered: hail, air quality, hydrological parameters, cloud properties, GPS water vapor, etc.) a whole new data set for research & practical use by the region itself WegenerNet, Session GI2, 21 Apr 2009, EGU Vienna, Austria 3/19
5 For what is the WegenerNet? Research Applications Many research projects investigating climate and environmental change and their impact, as well as local weather (extremes), will benefit from WegenerNet data covering the local scales from 1-10 km. This is a key domain for future high-resolution climate modeling and analysis, for meeting the needs of climate impact models and studies in heterogenous orography such as the Alpine region. Possible applications include: Model Testing and Validation at Local-scale Resolution: testing and validation of high-res non-hydrostatic climate models (NHCMs) used for dynamical downscaling to 1-10 km resolution testing and validation of statistical climate downscaling techniques, in particular of downscaling of precipitation to 1-10 km resolution validation and calibration of high-resolution atmospheric & hydrologic Earth Observation data from satellites validation and calibration of weather radar rain rate estimates Local-scale Weather and Climate Studies: study of weather and climate extremes monitoring and study of orography-local climate relationships basin-scale and local water balance assessments study of local meteorological condition-air quality relationships and many others WegenerNet, Session GI2, 21 Apr 2009, EGU Vienna, Austria 4/19
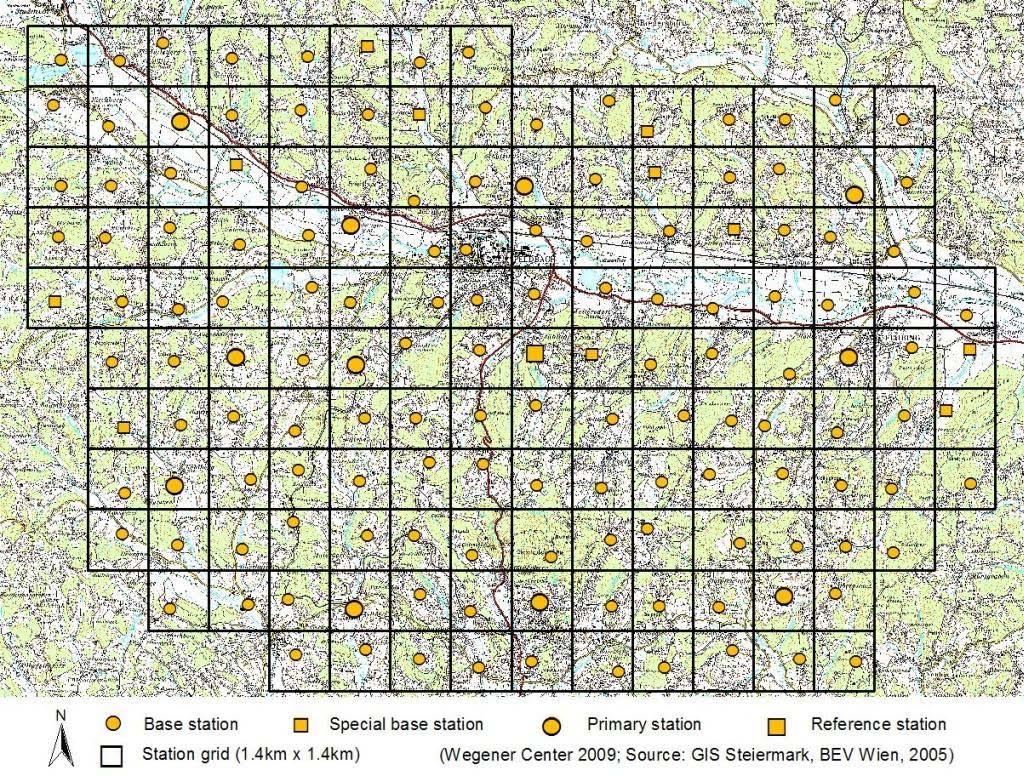
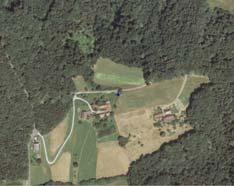
6 WegernerNet Station Grid WegenerNet, Session GI2, 21 Apr 2009, EGU Vienna, Austria 5/19
 [one station just temp&rel.")
![humi] 11 stations 1 station temperature, precipitation (all T incl. T < 0 C), rel.humidity, wind parameters (incl. wind gusts) temperature, precipitation (all T), rel.](/docs-images/75/72077309/images/7-1.jpg "humidity, wind parameters, soil temperature & pf, net radiation, air pressure Time Resolution temperature: 5min precipitation: 5min rel.")
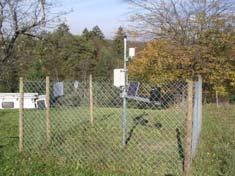
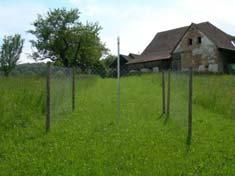
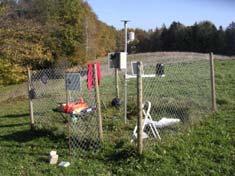
7 Station Types & Measured Parameters Base Stations Special Base Stations Primary Stations Reference Station 127 stations temperature, precipitation, rel.humidity 12 stations temperature, precipitation, rel.humidity, soil temperature & pf (yielding soil moisture) [one station just temp&rel.humi] 11 stations 1 station temperature, precipitation (all T incl. T < 0 C), rel.humidity, wind parameters (incl. wind gusts) temperature, precipitation (all T), rel.humidity, wind parameters, soil temperature & pf, net radiation, air pressure Time Resolution temperature: 5min precipitation: 5min rel.humidity: 5min wind params: 5min soil temp&pf: 30min net radiation: 5min air pressure: 5min WegenerNet, Session GI2, 21 Apr 2009, EGU Vienna, Austria 6/19


8 Cooperation/some additional (planned) measurements LiNet Lightning detection network Cooperation with the Inst. of Physics/ University of Munich & nowcast GmbH Hailpad measurements (planned) Cooperation with the Inst. BBComm./Graz Univ. of Technology, Styrian Hail Protection Society, Styrian Chamber of Agriculture (Source: O. Svabik) (Source: nowcast GmbH, Stations in - Raabau/Feldbach (WegenerNet region) - Graz (at roof of the Wegener Center) WegenerNet, Session GI2, 21 Apr 2009, EGU Vienna, Austria 7/19
 Overview NRT transfer")
 data")


9 WegenerNet Processing System (WPS) Overview NRT transfer of measured data (GPRS mobile communications) data processing data base raw data processed data data users access to data presentation of data visualization, download WegenerNet, Session GI2, 21 Apr 2009, EGU Vienna, Austria 8/19
10 WPS More Technical System View WPS Core System WPS User I/F System WPS-L0P-CRAS Command Receive Archiving System WPS-L1P-QCS Qualitiy Control System User side/l1-l3: Internal WegC + External Users work WPS-L2P-DPG Data Product Generator WPS-L3P-VAPP Value Added Products Processing WPS-VIS-WWP Visualization and Information System - WegenerNet Web Portal in GPRS L0P LEVEL-0 L1P LEVEL-1 L2P LEVEL-2 L3P VIS Stations i-log per station n=1 N L0 data: incoming raw station data P n =T n, q n, r n ; f Sn [pf], T Sn ; U n, V n ; p n, S n L1 data: qualitiycontrolled station data (with QC Flags) station measurement data station metadata L2 data: gridded & single station data products (with QC Flags) progress LEVEL-3 L3 data: value added products OTHER DATABASES Data Volume Ratio: LEVEL-0 LEVEL-1 LEVEL-2 1 : ~2 : ~10 WegenerNet, Session GI2, 21 Apr 2009, EGU Vienna, Austria 9/19
, using a 10m x 10m DEM Parameters: temperature, rel.humidity, precipitation,( ) Initial experiments Coordinate systems and geogr.")
 Altitude options: - zterrain (temperature: also zavgterr, z300m) Data Types Basic data (no averaging/summation, raw 5-min resolution) (half)hourly/ daily/ monthly/")
11 WPS Data Product Generator (DPG) WPS-L2P-DPG Data Product Generator L2P LEVEL-2 Data Products Level 2 station data timeseries, interpolated and/or flagged data gaps Level 2 grid data 2 interpolated grids (~22kmx15km), using a 10m x 10m DEM Parameters: temperature, rel.humidity, precipitation,( ) Initial experiments Coordinate systems and geogr. resolution: - UTM: 1km x 1km (22x15km 2, WGS84, Zone 33N) - GEO: 0.01 x 0.01 (~1.1km lat x 0.7km lon) Altitude options: - zterrain (temperature: also zavgterr, z300m) Data Types Basic data (no averaging/summation, raw 5-min resolution) (half)hourly/ daily/ monthly/ seasonal/ annual data in different views WegenerNet, Session GI2, 21 Apr 2009, EGU Vienna, Austria 10/19

 WegenerNet, Session GI2, 21 Apr 2009, EGU Vienna,")
12 First Results: 1-km & 5-min Resolution a new look Two example cases with (heavy) rainfall from summers 2007, 2008: temperature & precipitation shown for 9 th -10 th July 2007 (focus: heavy precip evening of 9 th July) 24 th June 2008 (focus: heavy precip late afternoon/early evening) WegenerNet, Session GI2, 21 Apr 2009, EGU Vienna, Austria 11/19

13 Example Case 9 th -10 th July 2007 Grosswetterlage Geopotential height and surface pressure: 8 th July :00 UTC WegenerNet, Session GI2, 21 Apr 2009, EGU Vienna, Austria 12/19
14 Example Case 9 th -10 th July 2007 Grosswetterlage Geopotential height and surface pressure: 9 th July :00 UTC WegenerNet, Session GI2, 21 Apr 2009, EGU Vienna, Austria 13/19

15 Example Case 9 th -10 th July 2007 Grosswetterlage Geopotential height and surface pressure: 10 th July :00 UTC WegenerNet, Session GI2, 21 Apr 2009, EGU Vienna, Austria 14/19
![Example case, 9 th July 2007 ~18:50 UTC a new look Temperature [ C] Precipitation [mm/5min] Temp.](/docs-images/75/72077309/images/16-3.jpg "lapse rate 18:50 UTC (±25min) 550 LiNet lightning acitivity map 18:00 18:59 UTC 500 450 400 350 Sealevel [m] 300 250 20 21 22 23 24 25 26 Temperature [ C] 18:50-18:59h 18:40-18:49h 18:30-18:39h")
16 Example case, 9 th July 2007 ~18:50 UTC a new look Temperature [ C] Precipitation [mm/5min] Temp. lapse rate 18:50 UTC (±25min) 550 LiNet lightning acitivity map 18:00 18:59 UTC Sealevel [m] Temperature [ C] 18:50-18:59h 18:40-18:49h 18:30-18:39h 18:20-18:29h (Source: nowcast GmbH) 18:10-18:19h 18:00-18:09h WegenerNet, Session GI2, 21 Apr 2009, EGU Vienna, Austria 15/19
![Example case, 9 th July 2007 ~20:50 UTC a new look Temperature [ C] Precipitation [mm/5min] Temp.](/docs-images/75/72077309/images/17-2.jpg "lapse rate 20:50 UTC (±25min) 550 LiNet lightning acitivity map 20:00 20:59 UTC 500 450 400 350")
![Sealevel [m] 300 250 12 14 16 18 20 22 Temperature [ C] 20:50-20:59h 20:40-20:49h 20:30-20:39h](/docs-images/75/72077309/images/17-3.jpg "20:20-20:29h (Source: nowcast GmbH) 20:10-20:19h 20:00-20:09h WegenerNet, Session GI2, 21 Apr 2009, EGU")
17 Example case, 9 th July 2007 ~20:50 UTC a new look Temperature [ C] Precipitation [mm/5min] Temp. lapse rate 20:50 UTC (±25min) 550 LiNet lightning acitivity map 20:00 20:59 UTC Sealevel [m] Temperature [ C] 20:50-20:59h 20:40-20:49h 20:30-20:39h 20:20-20:29h (Source: nowcast GmbH) 20:10-20:19h 20:00-20:09h WegenerNet, Session GI2, 21 Apr 2009, EGU Vienna, Austria 16/19
![Example case, 9 th July 2007 ~23:50 UTC a new look Temperature [ C]](/docs-images/75/72077309/images/18-0.jpg "Precipitation [mm/5min] Temp.")

![Temperature [ C] 23:50-23:59h 23:40-23:49h 23:30-23:39h 23:20-23:29h](/docs-images/75/72077309/images/18-3.jpg "(Source: nowcast GmbH) 23:10-23:19h 23:00-23:09h WegenerNet, Session")
18 Example case, 9 th July 2007 ~23:50 UTC a new look Temperature [ C] Precipitation [mm/5min] Temp. lapse rate 23:50 UTC (±25min) 550 LiNet lightning acitivity map 23:00 23:59 UTC Sealevel [m] Temperature [ C] 23:50-23:59h 23:40-23:49h 23:30-23:39h 23:20-23:29h (Source: nowcast GmbH) 23:10-23:19h 23:00-23:09h WegenerNet, Session GI2, 21 Apr 2009, EGU Vienna, Austria 17/19
19 Example Cases, 9-10Jul 07 & 24Jun 08 a new look Temperature [ C] and Precipitation [mm/5min] Movie Sequences 1 km x 1 km UTM Grid, 22 km x 15 km WegenerNet Area, 5-min Basic Data Time Steps 9-10Jul 07 9 th -10 th July 2007 (focus: evening of 9 th July) 24 th June 2008 (focus: late afternoon/early evening) UTC CET WegenerNet, Session GI2, 21 Apr 2009, EGU Vienna, Austria 18/19


20 WegenerNet Web and Data Portal Welcome! WegenerNet Homepage WegenerNet Data Portal WegenerNet, Session GI2, 21 Apr 2009, EGU Vienna, Austria 19/19
WegenerNet: A new climate station network in Eastern Styria/Austria for monitoring weather and climate at 1 km-scale resolution
 Session GI 2 Atmosphere, Ocean, Meteorological Instruments and Ocean Observatory Instrumentation ; EGU General Assembly 2008; 13-18 Apr 2008, Vienna, Austria. WegenerNet: A new climate station network
Release Notes for Version 7 of the WegenerNet Processing System (WPS Level-2 data v7)
") Release Notes for Version 7 of the WegenerNet Processing System (WPS Level-2 data v7) WegenerNet Tech. Report No. 1/2018 J. Fuchsberger, G. Kirchengast, and T. Kabas March 2018 Wegener Center for Climate
Release Notes for Version 7 of the WegenerNet Processing System (WPS Level-2 data v7) WegenerNet Tech. Report No. 1/2018 J. Fuchsberger, G. Kirchengast, and T. Kabas March 2018 Wegener Center for Climate
WegenerNet climate station network region Feldbach, Engineering Austria: network structure, processing system, example results
 Open Sciences doi:10.5194/asr-6-49-2011 Author(s) 2011. CC Attribution 3.0 License. Advances in Science & Research Open Access Proceedings Drinking Water WegenerNet climate station network region Feldbach,
Verification of Operational Analyses Using an Extremely High-Density Surface Station Network
 572 W E A T H E R A N D F O R E C A S T I N G VOLUME 26 Verification of Operational Analyses Using an Extremely High-Density Surface Station Network ALEXANDER KANN, THOMAS HAIDEN, KLAUS VON DER EMDE, AND
QualiMET 2.0. The new Quality Control System of Deutscher Wetterdienst
 QualiMET 2.0 The new Quality Control System of Deutscher Wetterdienst Reinhard Spengler Deutscher Wetterdienst Department Observing Networks and Data Quality Assurance of Meteorological Data Michendorfer
Added Value of Convection Resolving Climate Simulations (CRCS)
") Added Value of Convection Resolving Climate Simulations (CRCS) Prein Andreas, Gobiet Andreas, Katrin Lisa Kapper, Martin Suklitsch, Nauman Khurshid Awan, Heimo Truhetz Wegener Center for Climate and Global
Added Value of Convection Resolving Climate Simulations (CRCS) Prein Andreas, Gobiet Andreas, Katrin Lisa Kapper, Martin Suklitsch, Nauman Khurshid Awan, Heimo Truhetz Wegener Center for Climate and Global
Gridding of precipitation and air temperature observations in Belgium. Michel Journée Royal Meteorological Institute of Belgium (RMI)
") Gridding of precipitation and air temperature observations in Belgium Michel Journée Royal Meteorological Institute of Belgium (RMI) Gridding of meteorological data A variety of hydrologic, ecological,
Gridding of precipitation and air temperature observations in Belgium Michel Journée Royal Meteorological Institute of Belgium (RMI) Gridding of meteorological data A variety of hydrologic, ecological,
Austrian Wind Atlas and Wind Potential Analysis
 Austrian Wind Atlas and Wind Potential Analysis A. Krenn 1, H. Winkelmeier 1, R. Cattin 2, S. Müller 2, Truhetz 3, M. Biberacher 4, T. Eder 4 1. Energiewerkstatt, Friedburg, Austria 2. Meteotest, Bern,
Convection Permitting Simulation of Extreme Precipitation Events Lessons Learned
 Convection Permitting Simulation of Extreme Precipitation Events Lessons Learned A. F. Prein, M. Suklitsch, H. Truhetz, and A. Gobiet Wegener Center for Climate and Global Change (WEGC) and Institute for
Temperature and Lapse Rate Changes Over the IPCC Regions and Over Large-Scale Zonal Bands
 Atmospheric Remote Sensing and Climate System Research Group A R S C l i S y s Temperature and Lapse Rate Changes Over the IPCC Regions and Over Large-Scale Zonal Bands I. Thaler, U. Foelsche, G. Kirchengast,
Chiang Rai Province CC Threat overview AAS1109 Mekong ARCC
 Chiang Rai Province CC Threat overview AAS1109 Mekong ARCC This threat overview relies on projections of future climate change in the Mekong Basin for the period 2045-2069 compared to a baseline of 1980-2005.
Austrian Wind Potential Analysis - AuWiPot
 Austrian Wind Potential Analysis - AuWiPot H. Truhetz 1, A. Krenn 2, H. Winkelmeier 2, S. Müller 3, R. Cattin 3, T. Eder 4, M. Biberacher 4 1 Wegener Center for Climate and Global Change (WEGC) and Inst.
Empirical-statistical downscaling and error correction of temperature, precipitation, and derived extremes in Europe Matthias Themeßl
 Empirical-statistical downscaling and error correction of temperature, precipitation, and derived extremes in Europe Matthias Themeßl Wegener Center for Climate and Global Change and Inst. for Geophysics,
2/27/2015. Big questions. What can we say about causes? Bottom line. Severe Thunderstorms, Tornadoes, and Climate Change: What We Do and Don t Know
 Severe Thunderstorms, Tornadoes, and Climate Change: What We Do and Don t Know Big questions How and why are weather hazards distributed? Are things changing in time and will they? HAROLD BROOKS NOAA/NSSL
Three main areas of work:
 Task 2: Climate Information 1 Task 2: Climate Information Three main areas of work: Collect historical and projected weather and climate data Conduct storm surge and wave modeling, sea-level rise (SLR)
Local Precipitation Variability
 Local Precipitation Variability Precipitation from one storm can vary from neighborhood to neighborhood. What falls in your yard may not fall in the next. The next time it rains see how the precipitation
The analysis and nowcasting system INCA. T. Haiden, A. Kann, K. Stadlbacher, G. Pistotnik, M. Steinheimer, F. Wimmer, C. Wittmann
 The analysis and nowcasting system INCA T. Haiden, A. Kann, K. Stadlbacher, G. Pistotnik, M. Steinheimer, F. Wimmer, C. Wittmann Contents INCA system overview INCA performance Applications & cooperations
Why modelling? Glacier mass balance modelling
 Why modelling? Glacier mass balance modelling GEO 4420 Glaciology 12.10.2006 Thomas V. Schuler t.v.schuler@geo.uio.no global mean temperature Background Glaciers have retreated world-wide during the last
The WMO Integrated Global Observing System (WIGOS), current status and planned regional activities
, current status and planned regional activities") The WMO Integrated Global Observing System (WIGOS), current status and planned regional activities Dr. Lars Peter Riishojgaard WMO Secretariat, Geneva Outline Introduction to WIGOS WMO The Rolling Review
The WMO Integrated Global Observing System (WIGOS), current status and planned regional activities Dr. Lars Peter Riishojgaard WMO Secretariat, Geneva Outline Introduction to WIGOS WMO The Rolling Review
GEOGRAPHY EYA NOTES. Weather. atmosphere. Weather and climate
 GEOGRAPHY EYA NOTES Weather and climate Weather The condition of the atmosphere at a specific place over a relatively short period of time Climate The atmospheric conditions of a specific place over a
ECRA General Assembly 2019
 ECRA General Assembly 2019 Collaborative Programme on High Impact Events and Climate Change (CP-HIE) Martin Drews and Hilppa Gregow Technical University of Denmark & Finnish Meteorological Institute Understanding
Japanese Programs on Space and Water Applications
 Japanese Programs on Space and Water Applications Tamotsu IGARASHI Remote Sensing Technology Center of Japan June 2006 COPUOS 2006 Vienna International Centre Water-related hazards/disasters may occur
The PRECIS Regional Climate Model
 The PRECIS Regional Climate Model General overview (1) The regional climate model (RCM) within PRECIS is a model of the atmosphere and land surface, of limited area and high resolution and locatable over
The Delaware Environmental Monitoring & Analysis Center
 The Delaware Environmental Monitoring & Analysis Center Tina Callahan Delaware Estuary Science & Environmental Summit 2013 January 27-30, 2013 What is DEMAC? Delaware Environmental Monitoring & Analysis
Investigate the influence of the Amazon rainfall on westerly wind anomalies and the 2002 Atlantic Nino using QuikScat, Altimeter and TRMM data
 Investigate the influence of the Amazon rainfall on westerly wind anomalies and the 2002 Atlantic Nino using QuikScat, Altimeter and TRMM data Rong Fu 1, Mike Young 1, Hui Wang 2, Weiqing Han 3 1 School
Ultra-High Resolution Time Traveling AgMet Information from Seeding to Harvesting
 Ultra-High Resolution Time Traveling AgMet Information from Seeding to Harvesting - seamless data for prospect estimation of crop yields - Dec. 5, 2016 Jai-ho Oh & Kyung-Min Choi Dept. Env. & Atmos. Sci.,
5. General Circulation Models
 5. General Circulation Models I. 3-D Climate Models (General Circulation Models) To include the full three-dimensional aspect of climate, including the calculation of the dynamical transports, requires
Application and verification of the ECMWF products Report 2007
 Application and verification of the ECMWF products Report 2007 National Meteorological Administration Romania 1. Summary of major highlights The medium range forecast activity within the National Meteorological
The Norwegian Centre for Climate Services - NCCS
 The Norwegian Centre for Climate Services - NCCS Extremes Products - Dissemination Eirik J. Førland, Norwegian Meteorological Institute, Oslo, Norway Impact assessment consultation workshop, Budapest,
Climates of NYS. Definitions. Climate Regions of NYS. Storm Tracks. Climate Controls 10/13/2011. Characteristics of NYS s Climates
 Definitions Climates of NYS Prof. Anthony Grande 2011 Weather and Climate Weather the state of the atmosphere at one point in time. The elements of weather are temperature, air pressure, wind and moisture.
Drought and Climate Extremes Indices for the North American Drought Monitor and North America Climate Extremes Monitoring System. Richard R. Heim Jr.
 Drought and Climate Extremes Indices for the North American Drought Monitor and North America Climate Extremes Monitoring System Richard R. Heim Jr. NOAA/NESDIS/National Climatic Data Center Asheville,
Presentation of met.no s experience and expertise related to high resolution reanalysis
 Presentation of met.no s experience and expertise related to high resolution reanalysis Oyvind Saetra, Ole Einar Tveito, Harald Schyberg and Lars Anders Breivik Norwegian Meteorological Institute Daily
SOUTH MOUNTAIN WEATHER STATION: REPORT FOR QUARTER 2 (APRIL JUNE) 2011
 2011") SOUTH MOUNTAIN WEATHER STATION: REPORT FOR QUARTER 2 (APRIL JUNE) 2011 Prepared for ESTANCIA BASIN WATERSHED HEALTH, RESTORATION AND MONITORING STEERING COMMITTEE c/o CLAUNCH-PINTO SOIL AND WATER CONSERVATION
SOUTH MOUNTAIN WEATHER STATION: REPORT FOR QUARTER 2 (APRIL JUNE) 2011 Prepared for ESTANCIA BASIN WATERSHED HEALTH, RESTORATION AND MONITORING STEERING COMMITTEE c/o CLAUNCH-PINTO SOIL AND WATER CONSERVATION
New applications using real-time observations and ECMWF model data
 New applications using real-time observations and ECMWF model data 12 th Workshop on Meteorological Operational Systems Wim van den Berg [senior meteorological researcher, project coordinator] Overview
Lecture 5: Precipitation
 Lecture 5: Precipitation Key Questions 1. What physical concepts control the formation of precipitation (air pressure, expanding gases and cooling, and vapor pressure)? 2. What are some air mass lifting
Ingo Meirold-Mautner Yong Wang Alexander Kann Benedikt Bica Georg Pistotnik
 INCA-CE: The challenge of severe weather warnings Ingo Meirold-Mautner Yong Wang Alexander Kann Benedikt Bica Georg Pistotnik INCA Central Europe Integrated nowcasting for the Central European area BALTRAD
New Concept of Regional Cooperation in Asia for Water Disaster Management Applying Satellite Precipitation Measurement
 New Concept of Regional Cooperation in Asia for Water Disaster Management Applying Satellite Precipitation Measurement Yusuke Muraki Japan Aerospace Exploration Agency (JAXA) Mission Planning Department
CoCoRaHS Monitoring Colorado s s Water Resources through Community Collaborations
 CoCoRaHS Monitoring Colorado s s Water Resources through Community Collaborations Nolan Doesken Colorado Climate Center Atmospheric Science Department Colorado State University Presented at Sustaining
Model Output Statistics (MOS)
") Model Output Statistics (MOS) Numerical Weather Prediction (NWP) models calculate the future state of the atmosphere at certain points of time (forecasts). The calculation of these forecasts is based on
Model Output Statistics (MOS) Numerical Weather Prediction (NWP) models calculate the future state of the atmosphere at certain points of time (forecasts). The calculation of these forecasts is based on
Downscaling rainfall in the upper Blue Nile basin for use in
 Downscaling rainfall in the upper Blue Nile basin for use in hydrological modelling Michael Menker Girma 1, Brigita Schuett 1, Seleshi B. Awulachew 2, Matthew Mccartney 2, & Solomon S. Demissie 2 1 Department
Data Short description Parameters to be used for analysis SYNOP. Surface observations by ships, oil rigs and moored buoys
 3.2 Observational Data 3.2.1 Data used in the analysis Data Short description Parameters to be used for analysis SYNOP Surface observations at fixed stations over land P,, T, Rh SHIP BUOY TEMP PILOT Aircraft
APPENDIX 2 OVERVIEW OF THE GLOBAL PRECIPITATION MEASUREMENT (GPM) AND THE TROPICAL RAINFALL MEASURING MISSION (TRMM) 2-1
 AND THE TROPICAL RAINFALL MEASURING MISSION (TRMM) 2-1") APPENDIX 2 OVERVIEW OF THE GLOBAL PRECIPITATION MEASUREMENT (GPM) AND THE TROPICAL RAINFALL MEASURING MISSION (TRMM) 2-1 1. Introduction Precipitation is one of most important environmental parameters.
APPENDIX 2 OVERVIEW OF THE GLOBAL PRECIPITATION MEASUREMENT (GPM) AND THE TROPICAL RAINFALL MEASURING MISSION (TRMM) 2-1 1. Introduction Precipitation is one of most important environmental parameters.
Creating a WeatherSMART nation: SAWS drought related research, services and products
 Creating a WeatherSMART nation: SAWS drought related research, services and products Drought Dialogue 23-24 June 2016 Western Cape Government Hannes Rautenbach South African Weather Service SAWS mandate
2 nd Cryonet-Asia Worskshop Salekhard, Russian Federation (2-5 February 2016)
") WMO 2 nd Cryonet-Asia Worskshop Salekhard, Russian Federation (2-5 February 2016) WMO Rolling Review of Requirements (RRR) Etienne Charpentier Chief, WMO Observing Systems Division WMO; Name of Department
WMO 2 nd Cryonet-Asia Worskshop Salekhard, Russian Federation (2-5 February 2016) WMO Rolling Review of Requirements (RRR) Etienne Charpentier Chief, WMO Observing Systems Division WMO; Name of Department
INCA CE: Integrating Nowcasting with crisis management and risk prevention in a transnational framework
 INCA CE: Integrating Nowcasting with crisis management and risk prevention in a transnational framework Yong Wang ZAMG, Austria This project is implemented through the CENTRAL EUROPE Programme co-financed
APPLICATIONS OF DOWNSCALING: HYDROLOGY AND WATER RESOURCES EXAMPLES
 APPLICATIONS OF DOWNSCALING: HYDROLOGY AND WATER RESOURCES EXAMPLES Dennis P. Lettenmaier Department of Civil and Environmental Engineering For presentation at Workshop on Regional Climate Research NCAR
Weather generators for studying climate change
 Weather generators for studying climate change Assessing climate impacts Generating Weather (WGEN) Conditional models for precip Douglas Nychka, Sarah Streett Geophysical Statistics Project, National Center
VIC Hydrology Model Training Workshop Part II: Building a model
 VIC Hydrology Model Training Workshop Part II: Building a model 11-12 Oct 2011 Centro de Cambio Global Pontificia Universidad Católica de Chile Ed Maurer Civil Engineering Department Santa Clara University
(Severe) Thunderstorms and Climate HAROLD BROOKS NOAA/NSSL
 Thunderstorms and Climate HAROLD BROOKS NOAA/NSSL") (Severe) Thunderstorms and Climate HAROLD BROOKS NOAA/NSSL HAROLD.BROOKS@NOAA.GOV Big questions How and why are weather hazards distributed? Are things changing in time and will they? Begin with thunderstorm
(Severe) Thunderstorms and Climate HAROLD BROOKS NOAA/NSSL HAROLD.BROOKS@NOAA.GOV Big questions How and why are weather hazards distributed? Are things changing in time and will they? Begin with thunderstorm
Definitions Weather and Climate Climates of NYS Weather Climate 2012 Characteristics of Climate Regions of NYS NYS s Climates 1.
 Definitions Climates of NYS Prof. Anthony Grande 2012 Weather and Climate Weather the state of the atmosphere at one point in time. The elements of weather are temperature, t air pressure, wind and moisture.
The Climate of Grady County
 The Climate of Grady County Grady County is part of the Central Great Plains, encompassing some of the best agricultural land in Oklahoma. Average annual precipitation ranges from about 33 inches in northern
GIS in Weather and Society
 GIS in Weather and Society Olga Wilhelmi Institute for the Study of Society and Environment National Center for Atmospheric Research WAS*IS November 8, 2005 Boulder, Colorado Presentation Outline GIS basic
onboard of Metop-A COSMIC Workshop 2009 Boulder, USA
 GRAS Radio Occultation Measurements onboard of Metop-A A. von Engeln 1, Y. Andres 1, C. Cardinali 2, S. Healy 2,3, K. Lauritsen 3, C. Marquardt 1, F. Sancho 1, S. Syndergaard 3 1 2 3 EUMETSAT, ECMWF, GRAS
Development of High Resolution Gridded Dew Point Data from Regional Networks
 Development of High Resolution Gridded Dew Point Data from Regional Networks North Central Climate Science Center Open Science Conference May 20, 2015 Ruben Behnke Numerical Terradynamic Simulation Group
CLIMATE CHANGE ADAPTATION BY MEANS OF PUBLIC PRIVATE PARTNERSHIP TO ESTABLISH EARLY WARNING SYSTEM
 CLIMATE CHANGE ADAPTATION BY MEANS OF PUBLIC PRIVATE PARTNERSHIP TO ESTABLISH EARLY WARNING SYSTEM By: Dr Mamadou Lamine BAH, National Director Direction Nationale de la Meteorologie (DNM), Guinea President,
The Impact of Horizontal Resolution and Ensemble Size on Probabilistic Forecasts of Precipitation by the ECMWF EPS
 The Impact of Horizontal Resolution and Ensemble Size on Probabilistic Forecasts of Precipitation by the ECMWF EPS S. L. Mullen Univ. of Arizona R. Buizza ECMWF University of Wisconsin Predictability Workshop,
Met Éireann Climatological Note No. 15 Long-term rainfall averages for Ireland,
 Met Éireann Climatological Note No. 15 Long-term rainfall averages for Ireland, 1981-2010 Séamus Walsh Glasnevin Hill, Dublin 9 2016 Disclaimer Although every effort has been made to ensure the accuracy
Modelling snow accumulation and snow melt in a continuous hydrological model for real-time flood forecasting
 IOP Conference Series: Earth and Environmental Science Modelling snow accumulation and snow melt in a continuous hydrological model for real-time flood forecasting To cite this article: Ph Stanzel et al
Introduction to TIGGE and GIFS. Richard Swinbank, with thanks to members of GIFS-TIGGE WG & THORPEX IPO
 Introduction to TIGGE and GIFS Richard Swinbank, with thanks to members of GIFS-TIGGE WG & THORPEX IPO GIFS-TIGGE/NCAR/NOAA Workshop on EPS developments, June 2012 TIGGE THORPEX Interactive Grand Global
he ESSL Testbed s role in forecaster training
 he ESSL Testbed s role in forecaster training Pieter Groenemeijer Alois M. Holzer Georg Pistotnik organized in cooperation with: Photos courtesy of Magdalena Pichler, Lucia Sokolová, Alois M. Holzer The
The CAWa Project. CA High Elevation Research
 The CAWa Project A New Potential for Cooperation in CA High Elevation Research Katy Unger-Shayesteh & Gerd Rücker CAWa Project Coordination Outline CAWa Project Overview Selected Activities Hydrometeorological
European Drought Observatory Progress on Drought Monitoring
 European Drought Observatory Progress on Drought Monitoring Alfred de Jager Diego Magni European Commission Joint Research Centre (JRC) Disaster Risk Management Unit Outline 1. Introduction Philosophy
The Kentucky Mesonet: Entering a New Phase
 The Kentucky Mesonet: Entering a New Phase Stuart A. Foster State Climatologist Kentucky Climate Center Western Kentucky University KCJEA Winter Conference Lexington, Kentucky February 9, 2017 Kentucky
Weather and climate outlooks for crop estimates
 Weather and climate outlooks for crop estimates CELC meeting 2016-04-21 ARC ISCW Observed weather data Modeled weather data Short-range forecasts Seasonal forecasts Climate change scenario data Introduction
Early detection of thunderstorms using satellite, radar and
 Federal Department of Home of Home Affairs Affairs FDHA FDHA Federal Office of of Meteorology and and Climatology MeteoSwiss Early detection of thunderstorms using satellite, radar and Observing convection
Speedwell High Resolution WRF Forecasts. Application
 Speedwell High Resolution WRF Forecasts Speedwell weather are providers of high quality weather data and forecasts for many markets. Historically we have provided forecasts which use a statistical bias
The Canadian ADAGIO Project for Mapping Total Atmospheric Deposition
 The Canadian ADAGIO Project for Mapping Total Atmospheric Deposition Amanda S. Cole Environment & Climate Change Canada (ECCC) MMF-GTAD Workshop Geneva, Switzerland February 28, 2017 ADAGIO team Amanda
2003 Water Year Wrap-Up and Look Ahead
 2003 Water Year Wrap-Up and Look Ahead Nolan Doesken Colorado Climate Center Prepared by Odie Bliss http://ccc.atmos.colostate.edu Colorado Average Annual Precipitation Map South Platte Average Precipitation
WEATHER AND CLIMATE EXTREMES MONITORING BASED ON SATELLITE OBSERVATION : INDONESIA PERSPECTIVE RIRIS ADRIYANTO
 WEATHER AND CLIMATE EXTREMES MONITORING BASED ON SATELLITE OBSERVATION : INDONESIA PERSPECTIVE RIRIS ADRIYANTO INDONESIA AGENCY FOR METEOROLOGY, CLIMATOLOGY AND GEOPHYSICS (BM KG) 1. INTRODUCTION - BMKG
NHCM-1: Non-hydrostatic climate modelling Part III Evaluation of the Local Climate Model Intercomparison Project (LocMIP) simulations
 simulations") Wegener Center for Climate and Global Change University of Graz Scientifc Report No. 41-2011 NHCM-1: Non-hydrostatic climate modelling Part III Evaluation of the Local Climate Model Intercomparison Project
Wegener Center for Climate and Global Change University of Graz Scientifc Report No. 41-2011 NHCM-1: Non-hydrostatic climate modelling Part III Evaluation of the Local Climate Model Intercomparison Project
WIGOS, the RRR, and the Vision for WIGOS in 2040
 WIGOS, the RRR, and the Vision for WIGOS in 2040 Lars Peter Riishojgaard WIGOS Project Office, WMO Secretariat WMO; Observing and Information Systems Department) Overview 1. Brief introduction to WIGOS
Austria s Information Portal Climate Change Getting climate science across
 Zentralanstalt für Meteorologie und Geodynamik Johann Hiebl, Barbara Chimani, Klaus Haslinger, Daniel Binder, Harald Bamberger, Ingeborg Auer Getting climate science across Overview 1. Climate service
Gridded observation data for Climate Services
 Gridded observation data for Climate Services Ole Einar Tveito, Inger Hanssen Bauer, Eirik J. Førland and Cristian Lussana Norwegian Meteorological Institute Norwegian annual temperatures Norwegian annual
CIMIS. California Irrigation Management Information System
 CIMIS California Irrigation Management Information System What is CIMIS? A network of over 130 fully automated weather stations that collect weather data throughout California and provide estimates of
Judit Kerényi. OMSZ - Hungarian Meteorological Service, Budapest, Hungary. H-1525 Budapest, P.O.Box 38, Hungary.
 SATELLITE-DERIVED PRECIPITATION ESTIMATIONS DEVELOPED BY THE HYDROLOGY SAF PROJECT CASE STUDIES FOR THE INVESTIGATION OF THEIR ACCURACY AND FEATURES IN HUNGARY Judit Kerényi OMSZ - Hungarian Meteorological
A sensitivity and uncertainty analysis. Ministry of the Walloon Region Agricultural Research Centre
 Development of an agrometeorological model integrating leaf wetness duration estimation and weather radar data to assess the risk of head blight infection in wheat A sensitivity and uncertainty analysis
Funding provided by NOAA Sectoral Applications Research Project CLIMATE. Basic Climatology Colorado Climate Center
 Funding provided by NOAA Sectoral Applications Research Project CLIMATE Basic Climatology Colorado Climate Center Remember These? Factor 1: Our Energy Source Factor 2: Revolution & Tilt Factor 3: Rotation!
baltrad Mass media Overview
 48 Mass media Overview Weather information disseminated through mass media, like press, TV, and Internet is intended for its recipients, not for the media themselves. Therefore the addressees of the media
Evapotranspiration monitoring with Meteosat Second Generation satellites: method, products and utility in drought detection.
 Evapotranspiration monitoring with Meteosat Second Generation satellites: method, products and utility in drought detection. Nicolas Ghilain Royal Meteorological Institute Belgium EUMeTrain Event week
ACRP. ACRP Final report. Final Report Appendix containing all figures and maps. 1 Project Data. Program control: Climate and Energy Fund
 ACRP Final Report Appendix containing all figures and maps Program control: Climate and Energy Fund Program management: Kommunalkredit Public Consulting GmbH (KPC) 1 Project Data Short title reclip:century
Seasonal Climate Watch June to October 2018
 Seasonal Climate Watch June to October 2018 Date issued: May 28, 2018 1. Overview The El Niño-Southern Oscillation (ENSO) has now moved into the neutral phase and is expected to rise towards an El Niño
Assessment of Ensemble Forecasts
 Assessment of Ensemble Forecasts S. L. Mullen Univ. of Arizona HEPEX Workshop, 7 March 2004 Talk Overview Ensemble Performance for Precipitation Global EPS and Mesoscale 12 km RSM Biases, Event Discrimination
The Climate of Payne County
 The Climate of Payne County Payne County is part of the Central Great Plains in the west, encompassing some of the best agricultural land in Oklahoma. Payne County is also part of the Crosstimbers in the
What is one-month forecast guidance?
 What is one-month forecast guidance? Kohshiro DEHARA (dehara@met.kishou.go.jp) Forecast Unit Climate Prediction Division Japan Meteorological Agency Outline 1. Introduction 2. Purposes of using guidance
Operational Monsoon Monitoring at NCEP
 Operational Monsoon Monitoring at NCEP Wassila M. Thiaw Climate Prediction Center National Centers for Environmental Predictions Operational Monsoon Monitoring at NCEP Wassila M. Thiaw Climate Prediction
The Climate of Kiowa County
 The Climate of Kiowa County Kiowa County is part of the Central Great Plains, encompassing some of the best agricultural land in Oklahoma. Average annual precipitation ranges from about 24 inches in northwestern
EUMETSAT SAF NETWORK. Lothar Schüller, EUMETSAT SAF Network Manager
 1 EUMETSAT SAF NETWORK Lothar Schüller, EUMETSAT SAF Network Manager EUMETSAT ground segment overview METEOSAT JASON-2 INITIAL JOINT POLAR SYSTEM METOP NOAA SATELLITES CONTROL AND DATA ACQUISITION FLIGHT
Climate change and changing monsoon patterns
 Climate change and changing monsoon patterns Pankaj Kumar 1, Andy Wiltshire 2, Bodo Ahrens 3, Andreas Gobiet 4, Daniela Jacob 1 1. Max-Planck-Institut für Meteorologie & Climate Service Center, Hamburg,
Analyzing spatial and temporal variation of water balance components in La Vi catchment, Binh Dinh province, Vietnam
 Analyzing spatial and temporal variation of water balance components in La Vi catchment, Binh Dinh province, Vietnam Nguyen Duy Liem, Vo Ngoc Quynh Tram, Nguyen Le Tan Dat, Nguyen Kim Loi Nong Lam University-
Error correction of precipitation extremes: performance and implications for scenarios
 Error correction of precipitation extremes: performance and implications for scenarios Matthias Themeßl, Thomas Mendlik, Andreas Gobiet Wegener Center for Climate and Global Change and Inst. for Geophysics,
MxVision WeatherSentry Web Services Content Guide
 MxVision WeatherSentry Web Services Content Guide July 2014 DTN 11400 Rupp Drive Minneapolis, MN 55337 00.1.952.890.0609 This document and the software it describes are copyrighted with all rights reserved.
12/07/2017. Flash Flood Warning Service, an advanced approach towards flood resilient cities Floodplain Management Association Conference, Newcastle
 12/07/2017 Worldwide problem: Flash Floods Flash Floods are a Global Problem Flash Flood Warning Service, an advanced approach towards flood resilient cities Floodplain Management Association Conference,
National Weather Service Flood Forecast Needs: Improved Rainfall Estimates
 National Weather Service Flood Forecast Needs: Improved Rainfall Estimates Weather Forecast Offices Cleveland and Northern Indiana Ohio River Forecast Center Presenter: Sarah Jamison, Service Hydrologist
Lake Tahoe Watershed Model. Lessons Learned through the Model Development Process
 Lake Tahoe Watershed Model Lessons Learned through the Model Development Process Presentation Outline Discussion of Project Objectives Model Configuration/Special Considerations Data and Research Integration
Plan for operational nowcasting system implementation in Pulkovo airport (St. Petersburg, Russia)
") Plan for operational nowcasting system implementation in Pulkovo airport (St. Petersburg, Russia) Pulkovo airport (St. Petersburg, Russia) is one of the biggest airports in the Russian Federation (150
Plan for operational nowcasting system implementation in Pulkovo airport (St. Petersburg, Russia) Pulkovo airport (St. Petersburg, Russia) is one of the biggest airports in the Russian Federation (150
Regional Flash Flood Guidance and Early Warning System
 WMO Training for Trainers Workshop on Integrated approach to flash flood and flood risk management 24-28 October 2010 Kathmandu, Nepal Regional Flash Flood Guidance and Early Warning System Dr. W. E. Grabs
Global Flood Alert System based on satellite derived rainfall data -Targeting the era of Global Precipitation Measurement (GPM)-
-") Global Flood Alert System based on satellite derived rainfall data -Targeting the era of Global Precipitation Measurement (GPM)- Riko Oki, Misako Kachi (JAXA/EORC) Kazuhiko Fukami (PWRI) and Kazuo Umeda
Global Flood Alert System based on satellite derived rainfall data -Targeting the era of Global Precipitation Measurement (GPM)- Riko Oki, Misako Kachi (JAXA/EORC) Kazuhiko Fukami (PWRI) and Kazuo Umeda
Emerging Needs, Challenges and Response Strategy
 Emerging Needs, Challenges and Response Strategy Development of Integrated Observing Systems in China JIAO Meiyan Deputy Administrator China Meteorological Administration September 2011 Geneva Outline
Water vapour above Switzerland over the last 12 years
 Water vapour above Switzerland over the last 12 years June Morland*, Martine Collaud**, Klemens Hocke*, Pierre Jeannet**, Christian Mätzler* *Institute of Applied Physics, University of Bern **MeteoSwiss
Meteorological Data recorded at Armagh Observatory from 1795 to 2001: Volume I - Daily, Monthly and Annual Rainfall
 Meteorological Data recorded at Armagh Observatory from 1795 to 2001: Volume I - Daily, Monthly and Annual Rainfall 1838-2001 A. M. García-Suárez, C.J. Butler, D. Cardwell, A.D.S. Coughlin, A. Donnelly,