Ultra-High Resolution Time Traveling AgMet Information from Seeding to Harvesting
|
|
|
- Junior Gilmore
- 6 years ago
- Views:
Transcription

1 Ultra-High Resolution Time Traveling AgMet Information from Seeding to Harvesting - seamless data for prospect estimation of crop yields - Dec. 5, 2016 Jai-ho Oh & Kyung-Min Choi Dept. Env. & Atmos. Sci., Pukyong National University, Busan, Korea jhoh@pknu.ac.kr
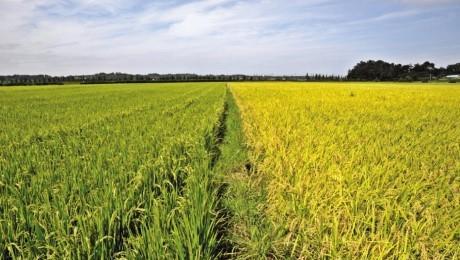
2 Introduction Seamless AgMet data from past to future Nano-scale AgMet data from past to future


 2014 2015 2016")


3 Structure diagram Mar. Apr. May. Jun. Jul. Aug. Sep. Oct. Observation-based Synthetic data (1km 1km) Jan. Feb. Mar. Apr. May. Jun. Jul. Aug. Prediction data New Prediction 2017 Prediction data
 Prediction")
 Downscaling")
 1 km high-resolution topography")
 Synthetic high resolution")

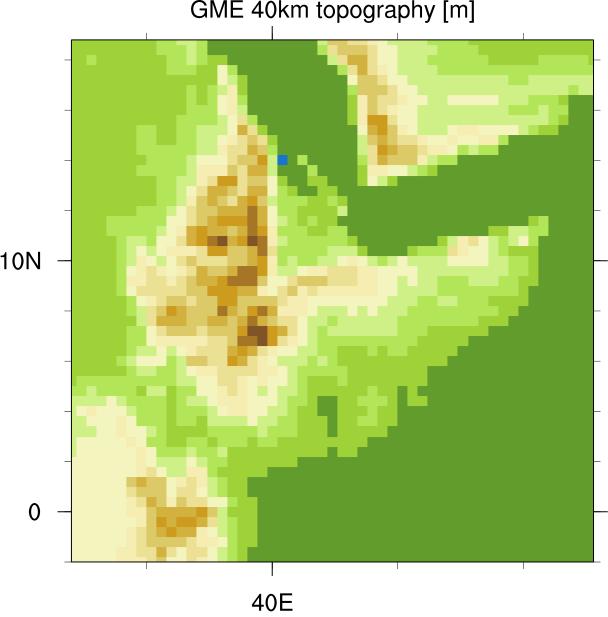
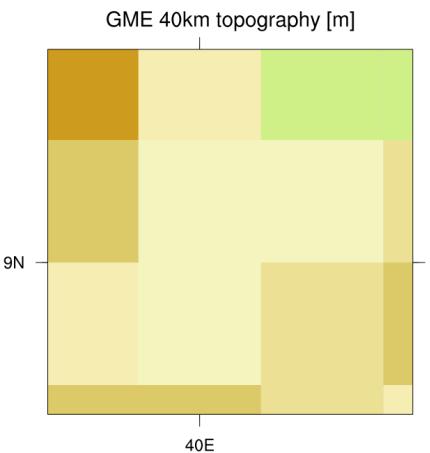
4 Method Prediction Global or Mesoscale Model (GME-40 km Grid) Prediction data 3hr interval u, v, P, w T, I, r h Topography (1km) Downscaling Quantitative Temperature Model (1 km Grid) 1 km high-resolution topography data Quantitative Precipitation Model (1 km Grid) Synthetic high resolution (1 km ) data based on observation data High Resolution Temperature & Rainfall Data
5 Method Prediction Global Prediction data Model : Global Model GME V2.30 Horizontal & Vertical Resolution : 40 km/40 layers Method for Seasonal Prediction Time-lag Method - Prediction run with daily SST & sea ice forcing (10 Ensemble) I. C. : ECMWF Operational Analysis data B. C. : NOAA OI Monthly Global SST data ECMWF Operational Analysis sea ice data Synthesis of Observation Synthetic high resolution (1x1 km ) data based on observation QPM(Quantitative Precipitation Model) QTM(Quantitative Temperature Model) Observation Data South Korea : AWS/ASOS & MERRA North Korea : MERRA
 QTM, QPM consider the effect of small-scale topography DEM (Digital Elevation Model) data Grid size : 1km 1km")
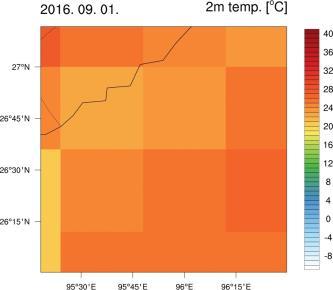
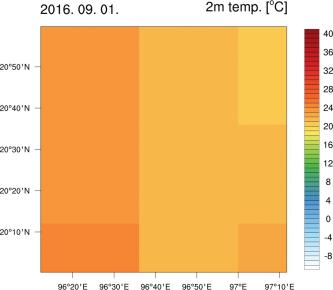
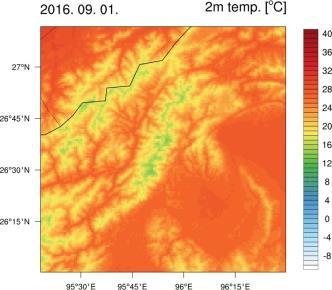
6 International Workshop AgMet and GIS Applications, 5 th -9 th Dec., 2016, Jeju, Korea Synthesis of Observation QTM (Quantitative Temperature Model) QTM, QPM consider the effect of small-scale topography DEM (Digital Elevation Model) data Grid size : 1km 1km Topography (1km) recalculating observed 2m temp. above sea-level pressure T slp j = T obs j + Γ H dem (j) interpolating to 1km T slp j T intp j recalculating temperature on altitude of DEM T qtm j = T intp j Γ H dem (j)
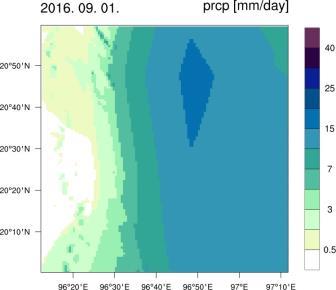
7 Synthesis of Observation QPM (Quantitative Precipitation Model) Govern Eq. Q r t = u Q r x v Q r y w Q r z + 1 ρ z ρv rq r + P 1 E 1 Q r : raindrop mixing ratio P 1 : condensation E 1 : evaporation V r : fall speed of raindrop u, v, w : wind components ρ : density of air Separating Eq. to Mesoscale field and small-scale perturbation field Rainfall intensity (Q r + Q r ) = u (Q r + Q r ) (Q r + Q r v ) w (Q r + Q r ) t x y z + 1 ρ z ρv r(q r + Q r ) + (P 1 + P 1 ) (E 1 + E 1 ) I = V r (Q r + Q r )
8 Synthesis of Observation Data North Korea Data Time Interval Horizontal Resolution Vertical Resolution MERRA (NASA) vertical : 3hrs horizontal : 1hr Levels South Korea Data Time Interval Station AWS & ASOS (KMA) 1hr, daily 494 / 93 Data Time Interval Horizontal Resolution Vertical Resolution MERRA (NASA) vertical : 3hrs horizontal : 1hr Levels


 Synthetic data (1km 1km) Aug.")
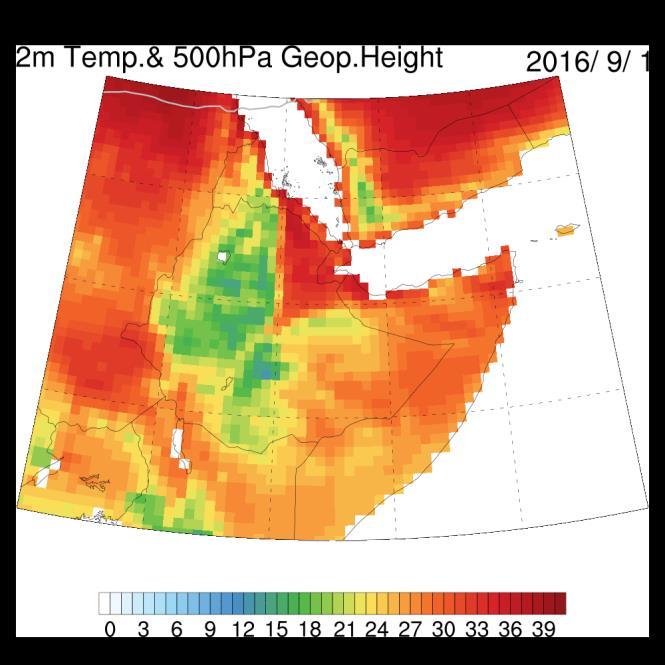
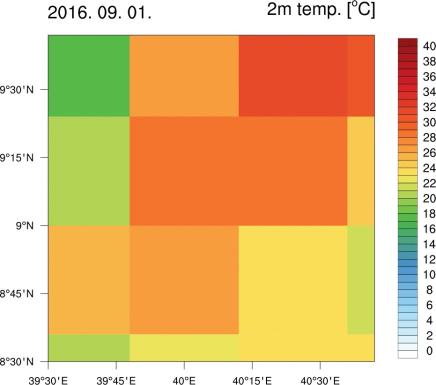
9 Time traveling climate information Ex) 2m Temperature 2016 Jan. Feb. Mar. Apr. May. Jun. Jul. Mar. Apr. May. Jun. Jul. Aug. Sep. Oct. Prediction data New Prediction New Prediction New Prediction New Prediction Observation-based Synthetic Observation-based data (1km 1km) Synthetic data (1km 1km) Aug. Observation-based Synthetic data (1km 1km) the same as above
10 Output variables Variables Data for Crop Model Variable name Level Long name (units) albdo surface (solar) shortwave albedo at the surface (%) ssr surface surface solar radiation balance (W/m**2) pres surface surface pressure on model orography (Pa) tmp 850hPa temperature at 850hPa (K) tmax 2m maximum temperature at (K) tmin 2m minimum temperature at (K) pr surface precipitation (kg/m**2) uwind 10m zonal wind at 10m above ground (m/s) vwind 10m meridional wind at 10m above ground (m/s) shum surface specific humidity (kg/kg) *Data set is depending on the user.

![Balance at the Surface [W/m**2] (Solar) Shortwave Albedo at the Surface [%] Specific Humidity](/docs-images/75/72482130/images/11-1.jpg "[kg/kg] Surface Pressure [Pa] 10m Wind Speed [m/s] 10m Meridional Wind [m/s] 10m Zonal Wind")
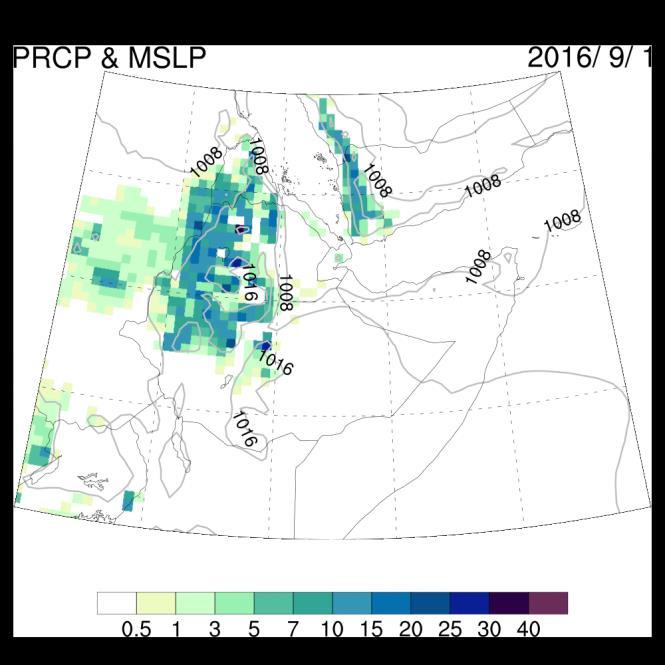
11 Application for Africa Daily Data in African 3 Regions for Crop Model 2m Maximum Temperature [K] 2m Minimum Temperature [K] Precipitation [kg/m**2] 850 hpa Temperature [K] Solar Radiation Balance at the Surface [W/m**2] (Solar) Shortwave Albedo at the Surface [%] Specific Humidity [kg/kg] Surface Pressure [Pa] 10m Wind Speed [m/s] 10m Meridional Wind [m/s] 10m Zonal Wind [m/s]
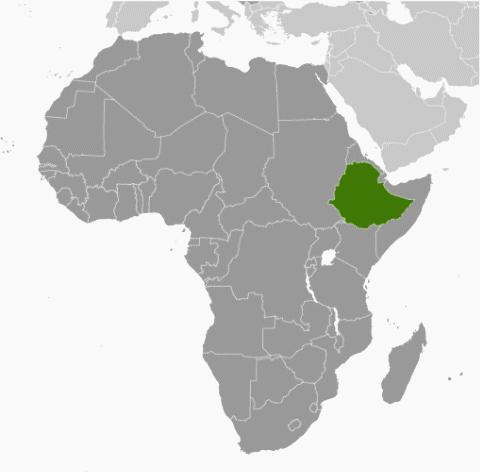
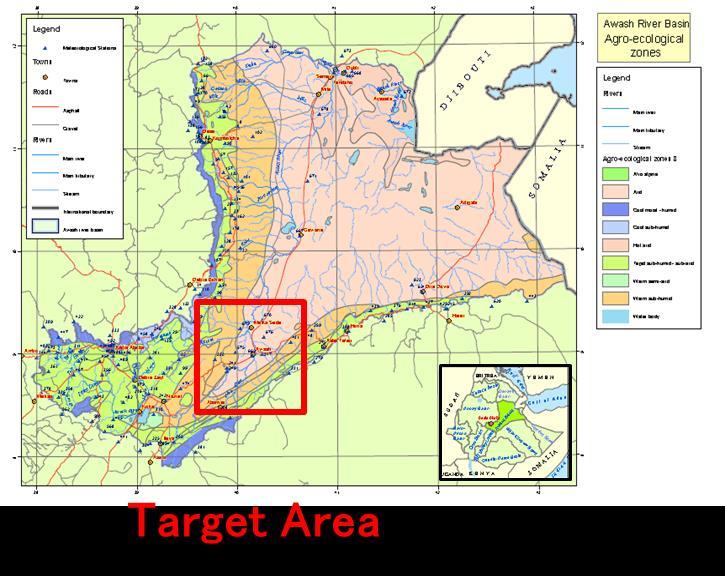


12 Nano-scale Agro-meteorological Information Ethiopia Awash River Basin Agro-ecological Zones 1 km x 1 km scale Nano-Climate Earth Surface = 2πR 2 = 2 x 3.14 x 6350 x 6350 = 2.53 x 10 8 km 2 1 km 2 4 x 10⁻⁹ Earth s Surface
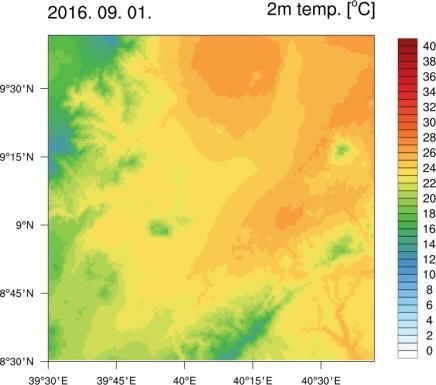
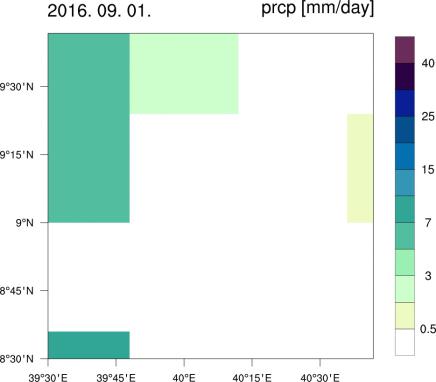
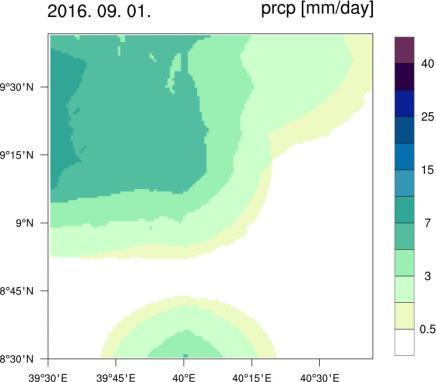
13 Nano-scale Agro-meteorological Information Ethiopia Awash River Basin Agro-ecological Zones
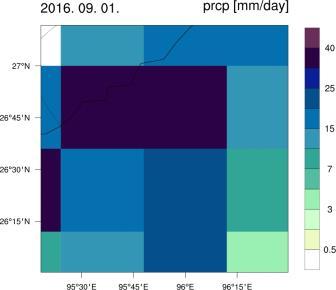
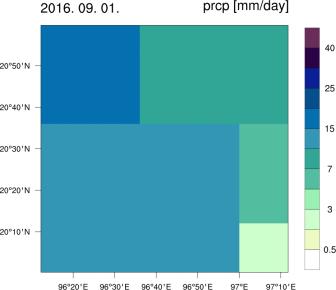
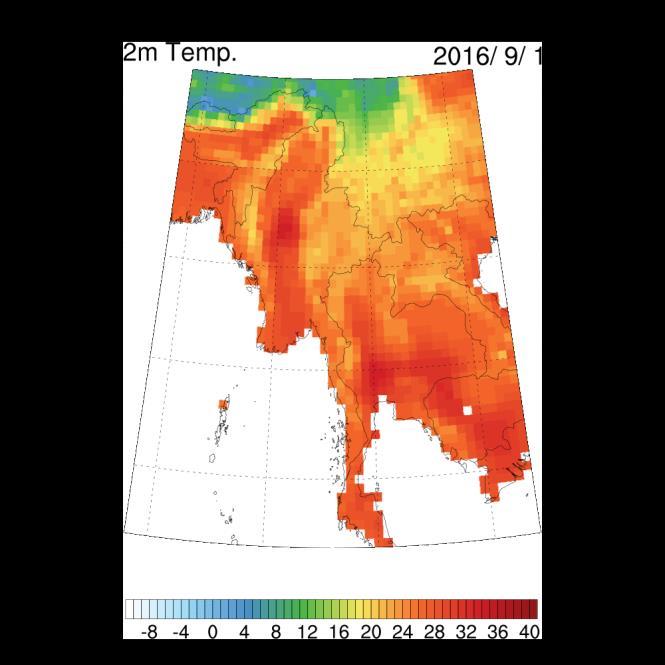
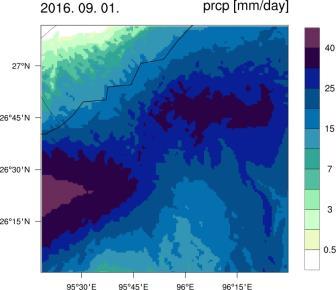
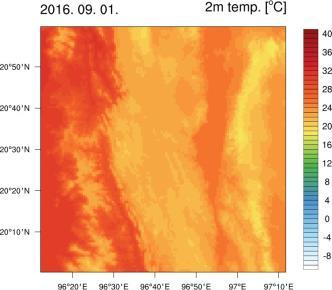
14 Nano-scale Agro-meteorological Information The High Reaches of Myanmar The Reaches of Myanmar ( Lahe & Nan Yun) One of Major City ( Kalaw & Inle lake)
15 Conclusions Ultra-high resolution prediction system provides useful data to agricultural community in detail. This system has the following advantage: 1 Providing daily essential variables for crop model. 2 Providing ultra-high resolution synthetic data for ungagged sites 3 Providing time traveling updated nano-scale agrometeorological data in combination of the past, present and future data
16 International Workshop on AgMet and GIS Applications, Data 5 th -9 th points Dec., 2016, = 672,661 Jeju, Korea 1km Resolution Future change of 2m temperature Suyoung-gu Data points = 19 Busan Data points = 2,

17 Thank you for your attention!
Utilization of seasonal climate predictions for application fields Yonghee Shin/APEC Climate Center Busan, South Korea
 The 20 th AIM International Workshop January 23-24, 2015 NIES, Japan Utilization of seasonal climate predictions for application fields Yonghee Shin/APEC Climate Center Busan, South Korea Background Natural
Introduction to Climate ~ Part I ~
 2015/11/16 TCC Seminar JMA Introduction to Climate ~ Part I ~ Shuhei MAEDA (MRI/JMA) Climate Research Department Meteorological Research Institute (MRI/JMA) 1 Outline of the lecture 1. Climate System (
GAMINGRE 8/1/ of 7
 FYE 09/30/92 JULY 92 0.00 254,550.00 0.00 0 0 0 0 0 0 0 0 0 254,550.00 0.00 0.00 0.00 0.00 254,550.00 AUG 10,616,710.31 5,299.95 845,656.83 84,565.68 61,084.86 23,480.82 339,734.73 135,893.89 67,946.95
APPLICATIONS OF DOWNSCALING: HYDROLOGY AND WATER RESOURCES EXAMPLES
 APPLICATIONS OF DOWNSCALING: HYDROLOGY AND WATER RESOURCES EXAMPLES Dennis P. Lettenmaier Department of Civil and Environmental Engineering For presentation at Workshop on Regional Climate Research NCAR
Agricultural Science Climatology Semester 2, Anne Green / Richard Thompson
 Agricultural Science Climatology Semester 2, 2006 Anne Green / Richard Thompson http://www.physics.usyd.edu.au/ag/agschome.htm Course Coordinator: Mike Wheatland Course Goals Evaluate & interpret information,
Sierra Weather and Climate Update
 Sierra Weather and Climate Update 2014-15 Kelly Redmond Western Regional Climate Center Desert Research Institute Reno Nevada Yosemite Hydroclimate Workshop Yosemite Valley, 2015 October 8-9 Percent of
Seasonal Climate Watch June to October 2018
 Seasonal Climate Watch June to October 2018 Date issued: May 28, 2018 1. Overview The El Niño-Southern Oscillation (ENSO) has now moved into the neutral phase and is expected to rise towards an El Niño
Chiang Rai Province CC Threat overview AAS1109 Mekong ARCC
 Chiang Rai Province CC Threat overview AAS1109 Mekong ARCC This threat overview relies on projections of future climate change in the Mekong Basin for the period 2045-2069 compared to a baseline of 1980-2005.
Impacts of climate change on flooding in the river Meuse
 Impacts of climate change on flooding in the river Meuse Martijn Booij University of Twente,, The Netherlands m.j.booij booij@utwente.nlnl 2003 in the Meuse basin Model appropriateness Appropriate model
Appendix C. AMEC Evaluation of Zuni PPIW. Appendix C. Page C-1 of 34
 AMEC s Independent Estimate of PPIW Crop Water Use Using the ASCE Standardized Reference Evapotranspiration via Gridded Meteorological Data, and Estimation of Crop Coefficients, and Net Annual Diversions
CliGen (Climate Generator) Addressing the Deficiencies in the Generator and its Databases William J Rust, Fred Fox & Larry Wagner
 Addressing the Deficiencies in the Generator and its Databases William J Rust, Fred Fox & Larry Wagner") CliGen (Climate Generator) Addressing the Deficiencies in the Generator and its Databases William J Rust, Fred Fox & Larry Wagner United States Department of Agriculture, Agricultural Research Service
CliGen (Climate Generator) Addressing the Deficiencies in the Generator and its Databases William J Rust, Fred Fox & Larry Wagner United States Department of Agriculture, Agricultural Research Service
Analyzing spatial and temporal variation of water balance components in La Vi catchment, Binh Dinh province, Vietnam
 Analyzing spatial and temporal variation of water balance components in La Vi catchment, Binh Dinh province, Vietnam Nguyen Duy Liem, Vo Ngoc Quynh Tram, Nguyen Le Tan Dat, Nguyen Kim Loi Nong Lam University-
Assessing bias in satellite rainfall products and their impact in water balance closure at the Zambezi headwaters
 Assessing bias in satellite rainfall products and their impact in water balance closure at the Zambezi headwaters Omondi C.K. 1 Rientjes T.H.M. 1, Haile T.A. 2, Gumindoga W. 1,3 (1) Faculty ITC, University
HYDROLOGICAL MODELING OF HIGHLY GLACIERIZED RIVER BASINS. Nina Omani, Raghavan Srinivasan, Patricia Smith, Raghupathy Karthikeyan, Gerald North
 HYDROLOGICAL MODELING OF HIGHLY GLACIERIZED RIVER BASINS Nina Omani, Raghavan Srinivasan, Patricia Smith, Raghupathy Karthikeyan, Gerald North Problem statement Glaciers help to keep the earth cool High
UWM Field Station meteorological data
 University of Wisconsin Milwaukee UWM Digital Commons Field Station Bulletins UWM Field Station Spring 992 UWM Field Station meteorological data James W. Popp University of Wisconsin - Milwaukee Follow
Global Climates. Name Date
 Global Climates Name Date No investigation of the atmosphere is complete without examining the global distribution of the major atmospheric elements and the impact that humans have on weather and climate.
Seasonal Climate Watch April to August 2018
 Seasonal Climate Watch April to August 2018 Date issued: Mar 23, 2018 1. Overview The El Niño-Southern Oscillation (ENSO) is expected to weaken from a moderate La Niña phase to a neutral phase through
Inter-linkage case study in Pakistan
 7 th GEOSS Asia Pacific Symposium GEOSS AWCI Parallel Session: 26-28 May, 2014, Tokyo, Japan Inter-linkage case study in Pakistan Snow and glaciermelt runoff modeling in Upper Indus Basin of Pakistan Maheswor
2003 Water Year Wrap-Up and Look Ahead
 2003 Water Year Wrap-Up and Look Ahead Nolan Doesken Colorado Climate Center Prepared by Odie Bliss http://ccc.atmos.colostate.edu Colorado Average Annual Precipitation Map South Platte Average Precipitation
COUPLING A DISTRIBUTED HYDROLOGICAL MODEL TO REGIONAL CLIMATE MODEL OUTPUT: AN EVALUATION OF EXPERIMENTS FOR THE RHINE BASIN IN EUROPE
 P.1 COUPLING A DISTRIBUTED HYDROLOGICAL MODEL TO REGIONAL CLIMATE MODEL OUTPUT: AN EVALUATION OF EXPERIMENTS FOR THE RHINE BASIN IN EUROPE Jan Kleinn*, Christoph Frei, Joachim Gurtz, Pier Luigi Vidale,
Predictability of Sudden Stratospheric Warmings in sub-seasonal forecast models
 Predictability of Sudden Stratospheric Warmings in sub-seasonal forecast models Alexey Karpechko Finnish Meteorological Institute with contributions from A. Charlton-Perez, N. Tyrrell, M. Balmaseda, F.
ENSO Outlook by JMA. Hiroyuki Sugimoto. El Niño Monitoring and Prediction Group Climate Prediction Division Japan Meteorological Agency
 ENSO Outlook by JMA Hiroyuki Sugimoto El Niño Monitoring and Prediction Group Climate Prediction Division Outline 1. ENSO impacts on the climate 2. Current Conditions 3. Prediction by JMA/MRI-CGCM 4. Summary
BMKG Research on Air sea interaction modeling for YMC
 BMKG Research on Air sea interaction modeling for YMC Prof. Edvin Aldrian Director for Research and Development - BMKG First Scientific and Planning Workshop on Year of Maritime Continent, Singapore 27-3
Tracking the Climate Of Northern Colorado Nolan Doesken State Climatologist Colorado Climate Center Colorado State University
 Tracking the Climate Of Northern Colorado Nolan Doesken State Climatologist Colorado Climate Center Colorado State University Northern Colorado Business Innovations November 20, 2013 Loveland, Colorado
Downscaling rainfall in the upper Blue Nile basin for use in
 Downscaling rainfall in the upper Blue Nile basin for use in hydrological modelling Michael Menker Girma 1, Brigita Schuett 1, Seleshi B. Awulachew 2, Matthew Mccartney 2, & Solomon S. Demissie 2 1 Department
Seasonal Climate Watch July to November 2018
 Seasonal Climate Watch July to November 2018 Date issued: Jun 25, 2018 1. Overview The El Niño-Southern Oscillation (ENSO) is now in a neutral phase and is expected to rise towards an El Niño phase through
The PRECIS Regional Climate Model
 The PRECIS Regional Climate Model General overview (1) The regional climate model (RCM) within PRECIS is a model of the atmosphere and land surface, of limited area and high resolution and locatable over
Climate Change and Arizona s Rangelands: Management Challenges and Opportunities
 Climate Change and Arizona s Rangelands: Management Challenges and Opportunities Mike Crimmins Climate Science Extension Specialist Dept. of Soil, Water, & Env. Science & Arizona Cooperative Extension
Changing Hydrology under a Changing Climate for a Coastal Plain Watershed
 Changing Hydrology under a Changing Climate for a Coastal Plain Watershed David Bosch USDA-ARS, Tifton, GA Jeff Arnold ARS Temple, TX and Peter Allen Baylor University, TX SEWRU Objectives 1. Project changes
July, International SWAT Conference & Workshops
 July, 212 212 International SWAT Conference & Workshops Hydrological Modelling of Kosi and Gandak Basins using SWAT Model S. Dutta, Pritam Biswas, Sangita Devi, Suresh A Karth and Bimlesh kumar, Ganga
AN ASSESSMENT OF THE RELATIONSHIP BETWEEN RAINFALL AND LAKE VICTORIA LEVELS IN UGANDA
 AN ASSESSMENT OF THE RELATIONSHIP BETWEEN RAINFALL AND LAKE VICTORIA LEVELS IN UGANDA BY CATHERINE MULINDE BA (Environmental Management), PGD (Meteorology) Teaching Assistant Department of Geography, Meteorology
Supplementary appendix
 Supplementary appendix This appendix formed part of the original submission and has been peer reviewed. We post it as supplied by the authors. Supplement to: Lowe R, Stewart-Ibarra AM, Petrova D, et al.
Estimating the Spatial Variability of Weather in Mountain Environments
 Estimating the Spatial Variability of Weather in Mountain Environments C. Baigorria 1, W. Bowen 2, and j. Stoorvogel Models of crop and soil systems are useful tools for understanding the complexity of
AMMA-ALMIP-MEM project soil moisture & μwaves Tb
 AMMA-ALMIP-MEM project soil moisture & μwaves Tb P. de Rosnay, A. Boone, M. Drusch, T. Holmes, G. Balsamo, many others ALMIPers (paper submitted to IGARSS) AMMA-ALMIP-MEM first spatial verification of
Journal of Asian Scientific Research
 Journal of Asian Scientific Research journal homepage: http://aessweb.com/journal-detail.php?id=5003 ESTIMATION OF GLOBAL SOLAR RADIATION ON HORIZONTAL SURFACE FROM SUNSHINE HOURS AND OTHER METEOROLOGICAL
Dust storm variability over EGYPT By Fathy M ELashmawy Egyptian Meteorological Authority
 WMO WORKSHOP ON CLIMATE MONITORING INCLUDING THE IMPLEMENTATION OF CLIMATE WATCH SYSTEMS FOR ARAB COUNTRIES IN WEST ASIA, AMMAN, JORDAN, 27-29 MAY 2013 Dust storm variability over EGYPT By Fathy M ELashmawy
Climate Variability in South Asia
 Climate Variability in South Asia V. Niranjan, M. Dinesh Kumar, and Nitin Bassi Institute for Resource Analysis and Policy Contents Introduction Rainfall variability in South Asia Temporal variability
What Does It Take to Get Out of Drought?
 What Does It Take to Get Out of Drought? Nolan J. Doesken Colorado Climate Center Colorado State University http://ccc.atmos.colostate.edu Presented at the Insects, Diseases and Drought Workshop, May 19,
Dynamical Statistical Seasonal Prediction of Atlantic Hurricane Activity at NCEP
 Dynamical Statistical Seasonal Prediction of Atlantic Hurricane Activity at NCEP Hui Wang, Arun Kumar, Jae Kyung E. Schemm, and Lindsey Long NOAA/NWS/NCEP/Climate Prediction Center Fifth Session of North
TRENDS AND CHANGE IN CLIMATE OVER THE VOLTA RIVER BASIN
 TRENDS AND CHANGE IN CLIMATE OVER THE VOLTA RIVER BASIN VOLTRES PROJECT WORK PACKAGE 1a: CLIMATE KEY RESULTS E. Obuobie, H.E. Andersen, C. Asante-Sasu, M. Osei-owusu 11/9/217 OBJECTIVES Analyse long term
Speedwell High Resolution WRF Forecasts. Application
 Speedwell High Resolution WRF Forecasts Speedwell weather are providers of high quality weather data and forecasts for many markets. Historically we have provided forecasts which use a statistical bias
Climatography of the United States No
 Climate Division: AK 5 NWS Call Sign: ANC Month (1) Min (2) Month(1) Extremes Lowest (2) Temperature ( F) Lowest Month(1) Degree s (1) Base Temp 65 Heating Cooling 90 Number of s (3) Jan 22.2 9.3 15.8
GPC Exeter forecast for winter Crown copyright Met Office
 GPC Exeter forecast for winter 2015-2016 Global Seasonal Forecast System version 5 (GloSea5) ensemble prediction system the source for Met Office monthly and seasonal forecasts uses a coupled model (atmosphere
Appendix B. A proposition for updating the environmental standards using real Earth Albedo and Earth IR Flux for Spacecraft Thermal Analysis
 19 Appendix B A proposition for updating the environmental standards using real Earth Albedo and Earth IR Romain Peyrou-Lauga (ESA/ESTEC, The Netherlands) 31 st European Space Thermal Analysis Workshop
Presentation Overview. Southwestern Climate: Past, present and future. Global Energy Balance. What is climate?
 Southwestern Climate: Past, present and future Mike Crimmins Climate Science Extension Specialist Dept. of Soil, Water, & Env. Science & Arizona Cooperative Extension The University of Arizona Presentation
Promoting Rainwater Harvesting in Caribbean Small Island Developing States Water Availability Mapping for Grenada Preliminary findings
 Promoting Rainwater Harvesting in Caribbean Small Island Developing States Water Availability Mapping for Grenada Preliminary findings National Workshop Pilot Project funded by The United Nations Environment
Variability of Reference Evapotranspiration Across Nebraska
 Know how. Know now. EC733 Variability of Reference Evapotranspiration Across Nebraska Suat Irmak, Extension Soil and Water Resources and Irrigation Specialist Kari E. Skaggs, Research Associate, Biological
Seasonal Hydrometeorological Ensemble Prediction System: Forecast of Irrigation Potentials in Denmark
 Seasonal Hydrometeorological Ensemble Prediction System: Forecast of Irrigation Potentials in Denmark Diana Lucatero 1*, Henrik Madsen 2, Karsten H. Jensen 1, Jens C. Refsgaard 3, Jacob Kidmose 3 1 University
Soil Moisture Prediction and Assimilation
 Soil Moisture Prediction and Assimilation Analysis and Prediction in Agricultural Landscapes Saskatoon, June 19-20, 2007 STEPHANE BELAIR Meteorological Research Division Prediction and Assimilation Atmospheric
2003 Moisture Outlook
 2003 Moisture Outlook Nolan Doesken and Roger Pielke, Sr. Colorado Climate Center Prepared by Tara Green and Odie Bliss http://climate.atmos.colostate.edu Through 1999 Through 1999 Fort Collins Total Water
From El Nino to Atlantic Nino: pathways as seen in the QuikScat winds
 From El Nino to Atlantic Nino: pathways as seen in the QuikScat winds Rong Fu 1, Lei Huang 1, Hui Wang 2 Presented by Nicole Smith-Downey 1 1 Jackson School of Geosciences, The University of Texas at Austin
2016 Meteorology Summary
 2016 Meteorology Summary New Jersey Department of Environmental Protection AIR POLLUTION AND METEOROLOGY Meteorology plays an important role in the distribution of pollution throughout the troposphere,
CATCHMENT DESCRIPTION. Little River Catchment Management Plan Stage I Report Climate 4.0
 CATCHMENT DESCRIPTION Little River Catchment Management Plan Stage I Report Climate 4. Little River Catchment Management Plan Stage I Report Climate 4.1 4. CLIMATE 4.1 INTRODUCTION Climate is one of the
Climatography of the United States No
 Climate Division: CA 5 NWS Call Sign: Elevation: 6 Feet Lat: 37 Month (1) Min (2) Month(1) Extremes Lowest (2) Temperature ( F) Lowest Month(1) Degree s (1) Base Temp 65 Heating Cooling 1 Number of s (3)
Climatography of the United States No
 Climate Division: CA 4 NWS Call Sign: Elevation: 2 Feet Lat: 37 Month (1) Min (2) Month(1) Extremes Lowest (2) Temperature ( F) Lowest Month(1) Degree s (1) Base Temp 65 Heating Cooling 1 Number of s (3)
Climatography of the United States No
 Climate Division: CA 4 NWS Call Sign: Elevation: 13 Feet Lat: 36 Month (1) Min (2) Month(1) Extremes Lowest (2) Temperature ( F) Lowest Month(1) Degree s (1) Base Temp 65 Heating Cooling 1 Number of s
Climatography of the United States No
 Climate Division: CA 5 NWS Call Sign: Elevation: 1,14 Feet Lat: 36 Month (1) Min (2) Month(1) Extremes Lowest (2) Temperature ( F) Lowest Month(1) Degree s (1) Base Temp 65 Heating Cooling 1 Number of
I C P A C. IGAD Climate Prediction and Applications Centre Monthly Climate Bulletin, Climate Review for September 2017
 Bulletin Issue October 2017 I C P A C IGAD Climate Prediction and Applications Centre Monthly Climate Bulletin, Climate Review for September 2017 1. INTRODUCTION This bulletin reviews the September 2017
El Niño, South American Monsoon, and Atlantic Niño links as detected by a. TOPEX/Jason Observations
 El Niño, South American Monsoon, and Atlantic Niño links as detected by a decade of QuikSCAT, TRMM and TOPEX/Jason Observations Rong Fu 1, Lei Huang 1, Hui Wang 2, Paola Arias 1 1 Jackson School of Geosciences,
Seasonal Climate Watch September 2018 to January 2019
 Seasonal Climate Watch September 2018 to January 2019 Date issued: Aug 31, 2018 1. Overview The El Niño-Southern Oscillation (ENSO) is still in a neutral phase and is still expected to rise towards an
Modeling of a River Basin Using SWAT Model and SUFI-2
 Modeling of a River Basin Using SWAT Model and SUFI-2 NINA OMANI MASOUD TAJRISHY AHMAD ABRISHAMCHI Sharif University of Technology, Tehran, Iran Karkheh Dam, Iran 1 Area of Gharasu Sub-basin : 5793 km2
What is happening to the Jamaican climate?
 What is happening to the Jamaican climate? Climate Change and Jamaica: Why worry? Climate Studies Group, Mona (CSGM) Department of Physics University of the West Indies, Mona Part 1 RAIN A FALL, BUT DUTTY
Climatography of the United States No
 Climate Division: CA 6 NWS Call Sign: LAX Elevation: 1 Feet Lat: 33 Month (1) Min (2) Month(1) Extremes Lowest (2) Temperature ( F) Lowest Month(1) Degree s (1) Base Temp 65 Heating Cooling 1 Number of
OVERVIEW OF IMPROVED USE OF RS INDICATORS AT INAM. Domingos Mosquito Patricio
 OVERVIEW OF IMPROVED USE OF RS INDICATORS AT INAM Domingos Mosquito Patricio domingos.mosquito@gmail.com Introduction to Mozambique /INAM Introduction to AGRICAB/SPIRITS Objectives Material & Methods Results
Climatography of the United States No
 Climate Division: CA 6 NWS Call Sign: TOA Elevation: 11 Feet Lat: 33 2W Temperature ( F) Month (1) Min (2) Month(1) Extremes Lowest (2) Lowest Month(1) Degree s (1) Base Temp 65 Heating Cooling 1 Number
A meta-analysis of water vapor deuterium-excess in the mid-latitude atmospheric surface layer
 Auxiliary Material for Paper 211GB4246 A meta-analysis of water vapor deuterium-excess in the mid-latitude atmospheric surface layer Lisa Welp Scripps Institution of Oceanography, UCSD, 95 Gilman Dr.,
Jackson County 2018 Weather Data 67 Years of Weather Data Recorded at the UF/IFAS Marianna North Florida Research and Education Center
 Jackson County 2018 Weather Data 67 Years of Weather Data Recorded at the UF/IFAS Marianna North Florida Research and Education Center Doug Mayo Jackson County Extension Director 1952-2008 Rainfall Data
Funding provided by NOAA Sectoral Applications Research Project CLIMATE. Basic Climatology Colorado Climate Center
 Funding provided by NOAA Sectoral Applications Research Project CLIMATE Basic Climatology Colorado Climate Center Remember These? Factor 1: Our Energy Source Factor 2: Revolution & Tilt Factor 3: Rotation!
AN OVERVIEW OF ENSEMBLE STREAMFLOW PREDICTION STUDIES IN KOREA
 AN OVERVIEW OF ENSEMBLE STREAMFLOW PREDICTION STUDIES IN KOREA DAE-IL JEONG, YOUNG-OH KIM School of Civil, Urban & Geosystems Engineering, Seoul National University, San 56-1, Sillim-dong, Gwanak-gu, Seoul,
Colorado s 2003 Moisture Outlook
 Colorado s 2003 Moisture Outlook Nolan Doesken and Roger Pielke, Sr. Colorado Climate Center Prepared by Tara Green and Odie Bliss http://climate.atmos.colostate.edu How we got into this drought! Fort
I C P A C IGAD Climate Prediction & Applications centre
 s` I C P A C IGAD Climate Prediction & Applications centre Bulletin Issue July 2017 Issue Number: ICPAC/02/303 IGAD Climate Prediction and Applications Centre Monthly Climate Bulletin, June 2017 1. INTRODUCTION
Global climate predictions: forecast drift and bias adjustment issues
 www.bsc.es Ispra, 23 May 2017 Global climate predictions: forecast drift and bias adjustment issues Francisco J. Doblas-Reyes BSC Earth Sciences Department and ICREA Many of the ideas in this presentation
Stratospheric sulfate geoengineering has limited efficacy and increases tropospheric burdens
 Stratospheric sulfate geoengineering has limited efficacy and increases tropospheric burdens Jason English PhD Candidate Laboratory for Atmospheric and Space Physics, and Department of Atmospheric and
CLIMATE OVERVIEW. Thunder Bay Climate Overview Page 1 of 5
 CLIMATE OVERVIEW The climate in the Thunder Bay area is typical of a mid-latitude inland location with a Great Lake Moderating influence. The moderating effect of Lake Superior results in cooler summer
Hydro-meteorological Analysis of Langtang Khola Catchment, Nepal
 Hydro-meteorological Analysis of Langtang Khola Catchment, Nepal Tirtha R. Adhikari 1, Lochan P. Devkota 1, Suresh.C Pradhan 2, Pradeep K. Mool 3 1 Central Department of Hydrology and Meteorology Tribhuvan
Climatography of the United States No
 Month (1) Min (2) Month(1) Extremes Lowest (2) Temperature ( F) Lowest Month(1) Degree s (1) Base Temp 65 Heating Cooling 100 Number of s (3) Jan 63.9 39.3 51.6 86 1976 16 56.6 1986 20 1976 2 47.5 1973
Climatography of the United States No
 Temperature ( F) Month (1) Min (2) Month(1) Extremes Lowest (2) Lowest Month(1) Degree s (1) Base Temp 65 Heating Cooling 100 Number of s (3) Jan 32.8 21.7 27.3 62 1918 1 35.8 1983-24 1950 29 10.5 1979
Let s Talk Climate! Nolan Doesken Colorado Climate Center Colorado State University. Yampatika Seminar February 16, 2011 Steamboat Springs, Colorado
 Let s Talk Climate! Nolan Doesken Colorado Climate Center Colorado State University Yampatika Seminar February 16, 2011 Steamboat Springs, Colorado First -- A short background In 1973 the federal government
ICPAC. IGAD Climate Prediction and Applications Centre Monthly Bulletin, May 2017
 s` ICPAC Bulletin Issue June 2017 Issue Number: ICPAC/02/302 IGAD Climate Prediction and Applications Centre Monthly Bulletin, May 2017 For referencing within this bulletin, the Greater Horn of Africa
Jackson County 2013 Weather Data
 Jackson County 2013 Weather Data 61 Years of Weather Data Recorded at the UF/IFAS Marianna North Florida Research and Education Center Doug Mayo Jackson County Extension Director 1952-2008 Rainfall Data
The Arctic Energy Budget
 The Arctic Energy Budget The global heat engine [courtesy Kevin Trenberth, NCAR]. Differential solar heating between low and high latitudes gives rise to a circulation of the atmosphere and ocean that
Jackson County 2014 Weather Data
 Jackson County 2014 Weather Data 62 Years of Weather Data Recorded at the UF/IFAS Marianna North Florida Research and Education Center Doug Mayo Jackson County Extension Director 1952-2008 Rainfall Data
Interannual variation of MODIS NDVI in Lake Taihu and its relation to climate in submerged macrophyte region
 Yale-NUIST Center on Atmospheric Environment Interannual variation of MODIS NDVI in Lake Taihu and its relation to climate in submerged macrophyte region ZhangZhen 2015.07.10 1 Outline Introduction Data
Environment and Climate Change Canada / GPC Montreal
 Environment and Climate Change Canada / GPC Montreal Assessment, research and development Bill Merryfield Canadian Centre for Climate Modelling and Analysis (CCCma) with contributions from colleagues at
Examples of using gridded observed climate datasets at the Finnish Environment Institute
 Examples of using gridded observed climate datasets at the Finnish Environment Institute Stefan Fronzek, Timothy Carter, Nina Pirttioja Finnish Environment Institute (SYKE) Workshop New gridded climate
CoCoRaHS Monitoring Colorado s s Water Resources through Community Collaborations
 CoCoRaHS Monitoring Colorado s s Water Resources through Community Collaborations Nolan Doesken Colorado Climate Center Atmospheric Science Department Colorado State University Presented at Sustaining
Temporal and spatial variations in radiation and energy fluxes across Lake Taihu
 Temporal and spatial variations in radiation and energy fluxes across Lake Taihu Wang Wei YNCenter Video Conference May 10, 2012 Outline 1. Motivation 2. Hypothesis 3. Methodology 4. Preliminary results
Seasonal forecasting of climate anomalies for agriculture in Italy: the TEMPIO Project
 Seasonal forecasting of climate anomalies for agriculture in Italy: the TEMPIO Project M. Baldi(*), S. Esposito(**), E. Di Giuseppe (**), M. Pasqui(*), G. Maracchi(*) and D. Vento (**) * CNR IBIMET **
Climatography of the United States No
 No. 2 1971-2 Asheville, North Carolina 2881 COOP ID: 46175 Climate Division: CA 6 NWS Call Sign: 3L3 Elevation: 1 Feet Lat: 33 Month (1) Min (2) Month(1) Extremes Lowest (2) Temperature ( F) Lowest Month(1)
Climatography of the United States No
 No. 2 1971-2 Asheville, North Carolina 2881 COOP ID: 42713 Climate Division: CA 7 NWS Call Sign: Elevation: -3 Feet Lat: 32 Month (1) Min (2) Month(1) Extremes Lowest (2) Temperature ( F) Lowest Month(1)
Climatography of the United States No
 Climate Division: CA 4 NWS Call Sign: Month (1) Min (2) Month(1) Extremes Lowest (2) Temperature ( F) Lowest Month(1) Degree s (1) Base Temp 65 Heating Cooling 100 Number of s (3) Jan 55.6 39.3 47.5 77
Climatography of the United States No
 Climate Division: CA 5 NWS Call Sign: Month (1) Min (2) Month(1) Extremes Lowest (2) Temperature ( F) Lowest Month(1) Degree s (1) Base Temp 65 Heating Cooling 100 Number of s (3) Jan 56.6 36.5 46.6 81
Climatography of the United States No
 Climate Division: CA 1 NWS Call Sign: Month (1) Min (2) Month(1) Extremes Lowest (2) Temperature ( F) Lowest Month(1) Degree s (1) Base Temp 65 Heating Cooling 100 Number of s (3) Jan 57.9 38.9 48.4 85
Climatography of the United States No
 Climate Division: CA 5 NWS Call Sign: Month (1) Min (2) Month(1) Extremes Lowest (2) Temperature ( F) Lowest Month(1) Degree s (1) Base Temp 65 Heating Cooling 100 Number of s (3) Jan 44.8 25.4 35.1 72
Climatography of the United States No
 Climate Division: CA 4 NWS Call Sign: Month (1) Min (2) Month(1) Extremes Lowest (2) Temperature ( F) Lowest Month(1) Degree s (1) Base Temp 65 Heating Cooling 100 Number of s (3) Jan 49.4 37.5 43.5 73
Climatography of the United States No
 Climate Division: CA 6 NWS Call Sign: Month (1) Min (2) Month(1) Extremes Lowest (2) Temperature ( F) Lowest Month(1) Degree s (1) Base Temp 65 Heating Cooling 100 Number of s (3) Jan 69.4 46.6 58.0 92
Climatography of the United States No
 Climate Division: CA 4 NWS Call Sign: Month (1) Min (2) Month(1) Extremes Lowest (2) Temperature ( F) Lowest Month(1) Degree s (1) Base Temp 65 Heating Cooling 1 Number of s (3) Jan 58.5 38.8 48.7 79 1962
Climatography of the United States No
 Climate Division: CA 1 NWS Call Sign: Month (1) Min (2) Month(1) Extremes Lowest (2) Temperature ( F) Lowest Month(1) Degree s (1) Base Temp 65 Heating Cooling 1 Number of s (3) Jan 57.8 39.5 48.7 85 1962
Climatography of the United States No
 Climate Division: CA 6 NWS Call Sign: Month (1) Min (2) Month(1) Extremes Lowest (2) Temperature ( F) Lowest Month(1) Degree s (1) Base Temp 65 Heating Cooling 1 Number of s (3) Jan 67.5 42. 54.8 92 1971
SOUTH AFRICAN TIDE TABLES
 SAN HO-2 2018 SOUTH AFRICAN TIDE TABLES PUBLISHED BY THE HYDROGRAPHER SOUTH AFRICAN NAVY PRIVATE BAG X1 TOKAI, 7966 COPYRIGHT RESERVED ISBN 978-0-9869717-9-2 CONTENTS Preface.... (iii) Tidal Levels......(iv)