November 2017 Climate Summary
|
|
|
- Jeffry Strickland
- 5 years ago
- Views:
Transcription

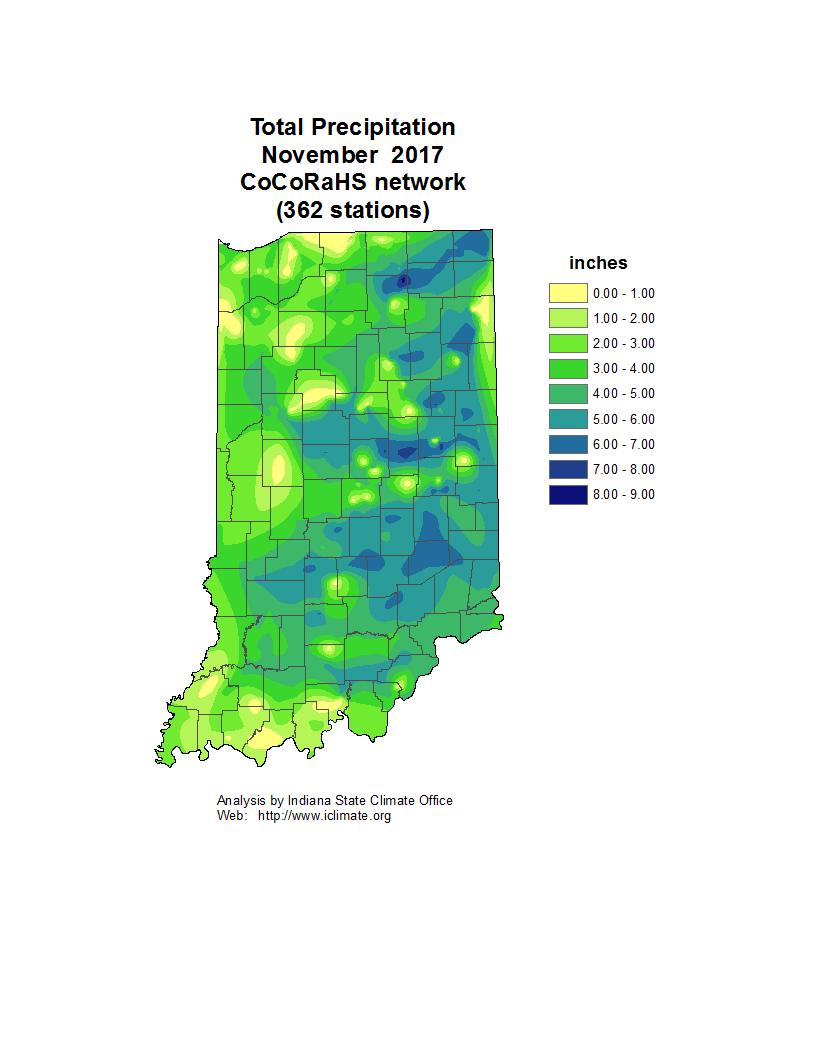
1 Ken Scheeringa and Andy Eggert Dec 8, 2017 (765) November 2017 Climate Summary Month Summary November temperatures alternated spells of warm and cool while precipitation flipped weekly between wet and dry intervals. Measurable snow fell on three November dates. The unsettled weather was marked by 8 tornadoes this month on two dates: November 5 th and 18 th. Wind, hail, flooding, and microburst damage were also documented. Moderate drought was finally eliminated according to the US Drought Monitor and crop harvesting had all but wrapped up for the year. The November state average temperature was 42.6 F, tied with 1896 and 1988 as the 41 st warmest November on record. Last year November was warmer at 47.0, the 6 th warmest on record. Since 2000 four other years had warmer Novembers: 2009 tied with 1975 at 11 th warmest, 2015 in a tie with 1990 in 9 th place, 2011 pegged in 7 th tied with 1994, and 2001 as the 3 rd warmest. The warmest November on record was in 1931 at 49.1 F in a tie with The day split was 15 days of below normal temperature, 14 days above normal, and 1 day at normal. There were 3 days when the daily state average temperature was 10 F or more above normal and 1 day 10 F or more below normal. The highest temperature of the month was 78 F at Shoals 8s on November 6 th. The coolest was 18 F on November 11 th at Angola. The November state precipitation averaged to This is 0.82 above normal and ranks the month as the 24 th wettest November on record. Three Novembers since 2000 had more precipitation on a statewide basis: 2004 with 4.74 as the 16 th wettest, 2010 at 5.01 in 14 th place, and 2011 with 6.21, good for 3 rd wettest. The wettest November on record occurred in 1985 with 8.20 as the state average. The heaviest single day precipitation among cooperative network stations in November 2017 was 3.17 on November 5 th at Richmond. The highest in the CoCoRaHS network was 4.29 on November 6 th at Lawrenceburg 3.1wnw. The largest month total in the cooperative network was 8.06 at North Webster. In the CoCoRaHS network the largest total was 8.11 also at North Webster. Widespread precipitation fell on about 13 days this month. Regionally November 2017 precipitation accumulated to about 145% of normal across northern Indiana, near 140% in central, and right about normal across the south. Normal November precipitation ranges from 3.0 in northeast Indiana to 4.3 in the southwest part of the state. Only 4% of Indiana soils were rated abnormally dry by the end of the month. Measurable snow was observed on November 1 st, 13 th, and 22 nd. The largest monthly amount in the cooperative station network was 0.2 at Lebanon 6w and Alpine 2ne. The most among CoCoRaHS stations for November was 1.0 at Elkhart 4.8sw.
2 November 1 st 7 th October came to an end and so did its late month cold spell. The Indiana average temperature ramped up 21 F within the first 5 days of November, then fell back to near normal to end the week. The first small but measurable snowfall of the season was recorded on November 1 st in central Indiana. Precipitation was measured every day this week somewhere in the state. Severe weather was widespread on November 5 th and produced 6 confirmed tornadoes in Indiana along with wind damage in 15 counties and isolated hail in 2 counties. Heavy precipitation brought relief to some of the dry soils of west central Indiana yet brought field harvest to a standstill late in the week. High pressure slid past Indiana and traveled to the Atlantic coast on November 1 st. Moisture overran a warm front in Alabama and spread rain and snow over southern Indiana. The state temperature opened the week and month at 8 F below normal. The next day the warm front surged north through Indiana then stalled over Lake Michigan. Indiana winds turned out of the south and tapped into warmer air, lifting the state temperature to 1 F above normal. Precipitation spread statewide. The warmup continued on November 3 rd. A weak cold front crossed Indiana but its cooler air was focused eastward through Canada rather than south into Indiana. The state temperature responded instead to the arrival of warm air ahead of the next Arkansas storm system, rising again to 6 F above normal. The Canada ridge drifted directly east, bypassing Indiana, and allowing fronts in Missouri and Arkansas to inject more warm air. The Indiana temperature rose another degree to 7 F above normal. Two warm fronts moved through Indiana on November 5 th. The first front sprinted to Lake Superior. The second warm front stalled in northern Indiana as a stationary front. Severe weather erupted over most of Indiana. The state temperature surged to 13 F above normal, the warmest day of the week. On November 6 th sharply colder air from Alberta plunged into the northern Plains and Indiana. The state temperature tumbled to 4 F above normal behind the leading cold front. The next day a ridge expanded eastward, stretching from British Columbia to South Dakota to Lake Ontario. The lack of continued southward movement allowed the old cold front to slow and become stationary over Tennessee. The state temperature settled to 1 F above normal as the week closed. Over the 7 days the state temperature averaged to 3 F above normal. Typically to start November the daily maximum temperature should range from 54 F in far northern Indiana to 62 F in the southwest corner of the state. Daily minimums normally vary between 37 F and 40 F north to south across the state. The warmest temperature of the week among cooperative network stations was 78 F at Shoals 8s on November 6 th. The coldest temperature among stations in this same network was 26 F at Spencer, Oolitic, and Paoli on November 1 st. The first snowfall of the season was measured on November 1 st. All amounts were 0.5 or less and were recorded in Monroe, Owen, Morgan, and Boone counties. A 0.5 reading was made by two Ellettsville CoCoRaHS observers and by another volunteer in Spencer. Snowfall of 0.2 was noted by two observes near Lebanon. Snow fell just this one day and also represents weekly totals.
3 On the weekly precipitation map 3 to 6 fell generally south of a Sullivan to Winchester line except less in the far western and southern tiers of counties within this region. Another area of 3 to 6 was seen in Madison, Delaware, Randolph, and Blackford counties in east central Indiana and in Kosciusko, Noble, and Steuben counties of northeast Indiana. Less than an inch was collected in the southern reaches of northwest Indiana. About 1 to 3 was common elsewhere. Regionally about 1.8 of precipitation was received in the northern third of Indiana, 2.7 on average across central, and 2.8 in the south. These amounts equate to about 230% of normal in northern Indiana, 360% in central counties, and 340% of normal across the south. Precipitation fell statewide on November 2 nd, 3 rd, 4 th, and 5 th, and across the southern half of the state on November 1 st and 7 th. Precipitation was scattered on November 4 th. The heaviest single day of precipitation was noted on November 6 th. Among the largest amounts was 4.29 measured by the Lawrenceburg observer while in Centerville 4.25 was collected. Outside Muncie 4.16 fell and two Batesville volunteers had 4.15 in their gages. For the entire 7 days 5.95 was tallied in North Webster, Syracuse had 5.87, Brooklyn 5.35, Muncie 5.31, and near Richmond the total was Six tornadoes were confirmed in Indiana during the severe weather event of November 5 th. An EF-2 tornado touched down in Delaware county, crossed the southeast tip of Blackford county, then entered Jay county before continuing into Ohio. This long lasting tornado had a total path length of 39 miles, with 31 miles inside Indiana. Peak wind speeds were estimated to 134 mph. At least one person was injured when hit by a dislodged door. Tree damage was documented in Delaware county while barns were destroyed in each of Blackford and Jay counties. Debris littered farm fields. Another tornado was identified in Delaware county. This was an EF-1 tornado with a path length of just 0.1 mile and peak wind speeds to 95 mph. There were no injuries. The roofs of several buildings were damaged and several trees were snapped or uprooted. The historic Muncie Fieldhouse was badly damaged during the severe weather. Part of a brick facade on top of the building was pushed through the roof. The falling debris ruptured the sprinkler system which dumped thousands of gallons of water a minute on to the gym floor. Three tornadoes were confirmed in Washington county. An EF-0 tornado with a 0.6 mile long path had peak winds estimated to 80 mph. There were no injuries. Along its path branches and maple trees were downed over a road and another tree was uprooted. There was damage to shingles, gutters, a roof, and a barn noted. Toys were tossed in a circular pattern and a trampoline was deposited a mile away from its yard. Playground equipment was thrown around and trees were downed in a farmer s field. A school was also damaged. An EF-1 tornado touched down in Salem and damaged a feed mill. Power poles were severely bent. A roof was blown off a business building and dropped on top of a restaurant. Falling brick also caused damage. The tornado hit a house, caused roof and siding damage, and snapped trees on the property. Winds in this tornado were estimated at 95 mph which had a path length of 0.25 mile. There were no injuries reported.
4 Another EF-1 tornado in Washington county traveled for 0.5 mile with winds estimated at 90 to 95 mph. There were no injuries. There was severe damage to barns, street signs, and bird houses. Some metal poles were bent or snapped. A heavy tank was picked up and moved next to a grain storage building. This tornado was very narrow and snapped power poles along its journey. In Lawrence county an EF-1 tornado was on the ground for 3.1 miles. Winds were estimated at 100 mph. There were no injuries. About a dozen structures had minor to moderate damage. A garage and two mobile homes were destroyed. Many trees were snapped or uprooted. In addition to the tornadoes wind damage was reported in 15 counties in northeast, central, and south central Indiana, and was scattered elsewhere across the south. Large hail was noted in 2 counties. Hail to 1.75 diameter was reported in Monroe county and to 1.25 diameter in Daviess county. The most damage resulted from straight line wind gusts. Utility poles were toppled onto state and local roads in Madison county while 3 poles came down in Tippecanoe county. In Randolph county a pole fell on to a vehicle and trapped the driver inside. Trees also fell on to utility lines in that area. Fallen utility poles were also a problem in Clinton county and in Delaware county where power was intermittent. Power outages were reported to more than 33,000 customers across the northern half of Indiana. Various buildings were crippled by high winds. A silo was damaged in Madison county and gas leaked from a pipeline substation in Jay county. A mobile home was damaged in Lawrence county, a shed destroyed in Tipton county, and an outbuilding in Madison county. In Jay county 11 homes were destroyed while 16 others had major damage. Roofs were blown apart in Clinton and Washington counties and a roof collapsed in Hamilton county. An elderly man was trapped inside his home before being rescued. A trailer was blown over in Lawrence county. Overall at least 26 other homes had some damage due to the storms. As expected falling trees always factor into severe weather damage. Trees fell on to power lines and roadways in Noble, Washington, and Jackson counties. Trees fell on to a house in Delaware county and on to a vehicle, injuring a family of 4 inside. All family members were taken to a hospital. Three remained hospitalized, one in critical condition. Other counties with tree losses included Madison, Delaware, Vigo, Putnam, Rush, Lawrence, Orange, Randolph, and Jay. The heavy rainfall in Indiana improved soil moisture status. While there was almost no change in the size of the moderate drought D1 region, there was an overall 11% decrease in area rated in the abnormally dry D0 category. Most of three counties continued in moderate drought status: Vermillion, Parke, and Putnam. The D0 rated region was broken into two parts, a southwest area mostly consisting of Knox and Daviess counties, and a second part in west central Indiana. Counties in a D0 designation included mostly Vermillion, Fountain, Montgomery, Hendricks, Putnam and Parke counties. The previously mentioned D1 region was embedded within this west central D0 area. Overall the net change was a transfer of 10% of D0 rated land into normal soil moisture status, revised to 93% of total Indiana land coverage according to the November 7 th edition of the US Drought Monitor.
5 The November 6 th edition of the USDA Indiana Crop Weather bulletin remarked that the heavy rainfall the last part of the week halted harvest progress. The torrential downpours would stall harvest for at least the next few days. Thunderstorms and tornadoes produced the bulk of the rain although light snow and frost were also seen in central Indiana. Corn stood at about 70% harvested and soybeans at near 85% harvested. Wet weather had forced farmers to switch from soybean to corn harvest late in the week. Despite the muddy conditions livestock were still reported to be doing well overall. November 8 th 14 th Cold and mostly dry conditions this week stood in contrast to a stormy beginning to November. Daily state temperatures averaged below normal on all 7 days. Weekly precipitation totaled less than a fifth of normal. Snow was measured on 3 days and precipitation on 5 days but amounts were light. There was little change in Indiana soil moisture status according to the US Drought Monitor. The Indiana Crop Weather report noted that added rain onto already wet soils stalled harvest progress at the start and end of the week. The state average temperature on November 8 th was 2 F below normal. High pressure over the Great Plains helped separate two cold fronts far to the north and south of Indiana. The northern front advanced to southern Wisconsin the next day behind strong high pressure in North Dakota. The Indiana state temperature dipped to 5 F below normal. This high center intensified on November 10 th and moved to Wisconsin, driving the cold front through Indiana and into the Gulf states. The Indiana temperature tumbled behind this front to 14 F below normal, marking the coldest day of the month so far. The ridge continued east the next day to New York, starting a warming backflow into Indiana. The state temperature rebounded to 8 F below normal. The ridge migrated east off the coast of Maine on November 12 th. This allowed a low center over the Oklahoma panhandle to travel into Missouri, setting up a stationary front along the Ohio River. The Indiana temperature continued to rise to 4 F below normal. Another high center drifted east from Nebraska to Illinois the next day, shoving the stationary front to the Atlantic coast states where it dissolved. Indiana was cloudy with the state temperature peaking at 1 F below normal, the warmest of the 7 days.
6 The Illinois high center moved on to Ohio on November 14 th while spreading northeast to eastern Canada. Indiana skies became partly sunny briefly and the state temperature dropped just a degree to 2 F below normal to end the 7 day interval. Over the 7 days the state temperature averaged to 5 F below normal. Typically by mid-november daily maximum temperatures should range between 51 F and 59 F north to south across Indiana. Daily minimums normally vary from 35 F in far northern counties to 38 F in the southwest corner of the state. The warmest temperature of the week among cooperative network stations was 77 F at Greenfield on November 8 th. The coolest temperature among stations in this same network was 18 F at Angola on November 11 th. A few spots in northeast Indiana had light snowfall this week. On the weekly snowfall map from 0.5 to 1.0 was measured by CoCoRaHS observers in Elkhart county. Just 0.2 was noted in Porter county and 0.1 in Allen county. No other reports were received. Snow was seen on 3 dates: November 10 th, 12 th, and 13 th. On the weekly precipitation map less than 0.5 totals fell statewide. Regionally precipitation averaged about 0.2 in northern and central Indiana and 0.1 across the south. These totals equate to about 10% of normal in southern Indiana and 20% in northern and central parts of the state. Precipitation fell statewide on November 13 th, in the northern tier of counties on November 12 th, and was scattered on November 8 th, 10 th, and 14 th. More than 0.25 was captured generally within an area running through the counties of Steuben to Randolph, then northeast to White county. Mostly trace amounts were observed in Gibson and Vanderburgh counties. No precipitation was noted in Posey county. Most of Indiana recorded between 0.01 and 0.25 for the week. The largest daily amounts were counted on November 13 th and included 0.41 and 0.36 at two locations in Portland, 0.35 in Muncie, 0.34 in Batesville, and 0.33 near Hudson. According to the November 14 th edition of the US Drought Monitor, there was no significant change in drought category coverage in Indiana since the previous week. About 2% of Indiana soils continued to be rated in moderate drought with 5% considered to be abnormally dry. The remaining 93% of Indiana land is rated in normal soil moisture status. The November 13 th edition of the USDA Indiana Crop Weather bulletin stated that additional rain on already existing wet soils had slowed harvest progress. There was some progress made in corn harvest during mid-week. The bulletin noted that storm damage to crops in central Indiana was becoming apparent. A statewide killing freeze had occurred statewide by the date of the report. Corn harvest stood at 80% complete while soybeans were near 90% harvested. Wet soils have especially slowed soybean harvest progress. Livestock were still in good condition despite the recent wet weather.
7 November 15 th 21 st Mostly cold and wet conditions returned to Indiana as did severe weather. The daily state average temperature popped above normal on just 2 of 7 days. Rainfall was recorded every day somewhere in the state except on November 15 th. There was no measureable snowfall but there were two tornadoes on a day when rain drenched much of the state. Flooding developed in central Indiana and wind damage was reported in 7 counties. The heavy precipitation eliminated drought statewide with abnormally dry soils remaining in just 9 counties. Wet soils caused the harvest season to drag on even longer. Some fields experienced damage due to wind gusts. The state temperature averaged 1 F below normal as a warm front entered southwest Indiana on November 15 th. This front was part of dual low pressure systems northwest of Indiana which also had two cold fronts, one in Iowa and another in Minnesota. By the next day the warm front and the two cold fronts had all passed through Indiana on their way to the Atlantic coast. High pressure behind the fronts settled over Iowa and extended north into Canada. The state temperature fell to 5 F below normal. On November 17 th the Iowa high center traveled to Ohio, turning Indiana winds out of the south and lifting the state temperature to 2 F above normal. Two new storm systems, one centered over South Dakota and a second to the north in Manitoba, separated two air masses approaching Indiana. The Ohio high center drifted to South Carolina, giving way to the two cold fronts on an apparent collision path over Indiana. The close proximity of the two cold fronts erupted into severe weather over central and southwest Indiana resulting in tornadoes in Tippecanoe and Spencer counties. Heavy wind damage was noted in nearby counties. Rainfall was heavy and the state temperature peaked at 4 F above normal. All fronts passed through Indiana late in the day and were replaced by much colder air which entered the state on November 19 th. The state temperature plunged to 9 F below normal, the coldest of the 7 days. The fronts rushed well east off the Atlantic coast the next day and a ridge positioned over Kentucky took control of Indiana weather, generating sunny skies and calmer weather. Southerly winds behind the ridge helped boost the Indiana temperature to 5 F below normal.
8 The Kentucky ridge moved quickly beyond the Virginia coast on November 21 st but did extend back into Mississippi. The flow of warmer air continued another day into Indiana as the state temperature returned to normal. Yet another cold front had entered Illinois and was poised to move through Indiana later in the day. Over the 7 days the Indiana state temperature averaged to 2 F below normal. Usually at this point in November the daily maximum temperature should vary between 47 F in far northern Indiana to 55 F in the far southwest. Daily minimums normally range between 32 F and 36 F north to south across the state. The warmest temperature of the 7 days among stations in the cooperative network was 68 F at many locations on November 19 th. The coolest temperature among stations in this same network was 21 F at Paoli on November 20 th. On the weekly precipitation map a heavy 3 to 4.5 band of rain fell generally along a line from Kentland to Lafayette to Decatur. Surrounding this region to the north and south were totals between 2 and 3. Amounts exceeded 4 mostly in Benton, Cass, Wabash, Huntington, and Wells counties. In contrast less than an inch was recorded in the Ohio River tier of counties and in Daviess, Ohio, and Dearborn counties. Elsewhere around Indiana 1 to 2 was common. Regionally northern Indiana precipitation averaged about 2.5 with 2.1 in central areas. Southern Indiana averaged much less with around 1.0. These amounts equate to about 420% of normal across the north, 310% in central, and 120% of normal in the southern part of the state. The heaviest single day of rain was found in northern Indiana among the CoCoRaHS morning reports of November 19 th. The Lagro observer noted 3.17 that morning while in Modoc 3.00 was captured in the gage. Nearly that much was collected outside Fort Wayne where the observer had The Huntington rain gage held 2.94 while a depth of 2.91 was noted by the volunteer in Wabash. Over the 7 days the Lagro sum was 4.32 and at Wabash At Otterbein 3.97 was tallied while Huntington had 3.91 and Ossian Rain fell statewide on November 16 th, 18 th, and 19 th but was focused near the Michigan border on November 17 th. Rainfall was very scattered on November 20 th and 21 st. Two cold fronts rumbled through Indiana on November 18 th resulting in severe weather reports from 7 counties. Wind gust damage, flooding from heavy rain, a microburst in Clinton county, and tornadoes in Tippecanoe and Spencer counties were part of the heavy weather action. An EF-0 tornado was confirmed in eastern Tippecanoe county. This tornado had winds estimated to 75 mph and was on the ground for 0.5 mile. The siding on a house was damaged along with several trees but there were no injuries. Debris from the high winds were blown on to roads and into farmer fields. Power lines were downed by fallen trees. Flooding closed roads in the cities and around the county, some due to ditches overflowing along highways. Just northeast in Carroll county, state highways and county roads were closed due to flooding caused by heavy rain. A damage survey in Clinton county determined straight line winds within a microburst caused damage seen there. Winds were estimated to 85 mph over a distance of about 1.5 mile. The local high school was damaged, a church lost its steeple, two semis were overturned, the roof of a retail building collapsed, and trees were ripped down. Badly damaged businesses were evacuated then
9 closed. There were no serious injuries but many residents lost power. Some roads were flooded and closed due to more than 2 of rain. In nearby Montgomery county trees fell on to roadways and two pole barns were damaged. Their debris was scattered by gusting winds. Across the state in Decatur county a tree fell on to power lines. A tree was snapped in Johnson county as well. Power was lost to nearly 1000 customers in Delaware county. Cars were submerged in high water due to flooded roads. Flooding also blocked streets and roads in Hamilton county. A football game in Allen county was suspended for 6 hours until lightning had left the area. In far southwest Indiana an EF-1 tornado touched down in Spencer county with winds estimated to 90 mph. The tornado was on the ground for 2.5 miles. A roof and shingles were torn off a building. A barn was blown down and 6 homes had minor damage while another 6 outbuildings were hit. Utility poles and trees were snapped and several more trees were uprooted. There were no injuries. In Vanderburgh county residents lost power due to high winds. Wind gusts beyond 50 mph were noted in Knox county. Much above normal precipitation helped improve Indiana soil moisture status according to the US Drought Monitor. In its November 21 st edition D1 moderate drought was completely eliminated from the state. The northern edges of the D0 abnormally dry region were trimmed in west central Indiana while the southwest D0 area remained intact. The abnormally dry rating was revised to include half of Vermillion county, most of Parke, half of Putnam, and small portions of Montgomery and Fountain counties. In southwest Indiana the D0 rated area included half of Knox, most of Daviess, and small portions of Pike and Gibson counties. The net changes resulted in 4% of total Indiana area classified as abnormally dry with the remainder in normal soil moisture status. The November 20 th edition of the USDA Indiana Crop Weather bulletin stated that the new precipitation continued to delay harvest progress. High winds on November 18 th caused some crop damage. Frost was observed statewide during the week. Corn harvest was pegged at near 87% completion with soybeans about 92% harvested. Soybean harvest was slowed due to wet field conditions. Despite muddy feedlots livestock were still rated in good condition.
10 November 22 nd 30 th After two weeks of cold November concluded with mostly warmer weather. Temperatures were below normal on just 2 of the last 9 days of the month. The recent wet pattern flipped to mostly dry conditions with less than 10% of the usual precipitation recorded. There was no measurable snowfall. The latest US Drought Monitor showed no change in Indiana soil moisture conditions. The drier weather allowed field harvest to approach completion according to the USDA Indiana Crop Weather bulletin. November 22 nd was cool with the state average temperature at 6 F below normal. High pressure in Kansas worked to clear Indiana skies following passage of a cold front the day before. The ridge core extended to West Virginia the next day, marking the start of a warmup in Indiana as winds turned out of the south. The state temperature rose to 3 F below normal. The ridge moved little on November 24 th allowing the transport of warmer air to continue into Indiana. The state temperature jumped to 5 F above normal. Fronts were beginning to form over Iowa as the high center slowly drifted eastward. A cold front did evolve the next day and moved through Indiana. The state temperature didn t change right away and persisted at 5 F above normal for a second day. Later in the day a second cold front pushed through Indiana and then caught up to the earlier front. The merged front sped up and had journeyed into the Atlantic Ocean by the next morning. The state temperature fell to 1 F below normal. On November 27 th another cold front ventured south from Canada into Michigan. This front lost momentum and stalled as a stationary front before reaching Indiana. Meanwhile high pressure in Tennessee fed warm air to Indiana. The state temperature rebounded to 5 F above normal. This influx of warm air along with the setup of a storm system north of the Great Lakes hallowed out a warm sector over Indiana and the Midwest. The system s warm front over the eastern Great Lakes and cold front over Iowa placed Indiana squarely inside the new warm sector. The state temperature surged to 12 F above normal. The cold front advanced through Indiana on November 29 th. A secondary cold front close behind fizzled without reaching Indiana. The state temperature dipped slightly to 10 F above normal. This system raced east well off the Atlantic coast by the next day. In its place yet another low pressure system moved into Michigan and featured a warm front which passed through Indiana. Less than 200 miles behind it was the system cold front, defining a very narrow warm sector over Indiana. Both fronts sprinted across Indiana the morning of November 30 th. The state temperature that day dipped to 7 F above normal to close out the month. Despite the passage of 4 cold fronts but just 1 warm front the Indiana state temperature averaged 7 F above normal over the 9 day interval. Typically in this time frame the daily maximum temperature should vary between 43 F and 51 F north to south across the state. Daily minimums normally range from 29 F in far northern Indiana to 33 F in the southwest corner of the state. The warmest daily temperature among stations in the cooperative station network was 70 F at Francesville on November 29 th. The coolest temperature among stations in this same network was 19 F at Lowell on November 22 nd and at Columbus on November 24 th. Rainfall was sparse between November 22 nd and 30 th. Rain fell only on the first and last days of the interval and even those amounts were light. Generally northern and central Indiana reported
11 precipitation on November 22 nd while rain fell nearly statewide on November 30 th with exception of far eastern counties. The total precipitation map revealed less than 0.5 statewide. Less than 0.05 was found generally south of a Sullivan to Bluffton line except for up to 0.4 locally in Daviess, Pike, and Dubois counties. Little to nothing was received along the Ohio River and in much of Randolph, Henry, and Hancock counties. Regionally the northern third of Indiana averaged near 0.05 while central and southern regions had about These totals equate to about 5% of normal in the north and 10% of normal elsewhere to the south. The heaviest single daily rainfall was observed on November 30 th and included Newburgh with 0.43, Covington at 0.20, and Macy with Over the 9 day interval no additional rain was measured at Newburgh while Montgomery s total was Near Goshen just 0.21 was tallied while two rain gages in Granger summed to 0.20 and According to the US Drought Monitor there was no change in Indiana soil moisture status between November 21 st and 28 th. About 4% of total Indiana area continued to be rated in the abnormally dry D0 category. The remainder of the state was classified in normal soil moisture status. The mostly dry week helped Indiana farmers finally close in on finishing harvest for the year. Corn harvest had reached 93% completion on average while soybeans were surveyed at 96%. Wheat planting had already finished and nearly all of the new crop had emerged. Livestock were reported to be in good condition. The USDA Indiana Crop Weather bulletin weekly reports have ended for 2017.
12 November 2017 Temperature Region Temperature Normal Deviation Northwest North Central Northeast West Central Central East Central Southwest South Central Southeast State Precipitation Region Precipitation Normal Deviation Percent of Normal Northwest North Central Northeast West Central Central East Central Southwest South Central Southeast State
13 Autumn (Sep - Nov) Temperature Region Temperature Normal Deviation Northwest North Central Northeast West Central Central East Central Southwest South Central Southeast State Precipitation Region Precipitation Normal Deviation Percent of Normal Northwest North Central Northeast West Central Central East Central Southwest South Central Southeast State
14 2017 Annual so far (Jan - Nov) Temperature Region Temperature Normal Deviation Northwest North Central Northeast West Central Central East Central Southwest South Central Southeast State Precipitation Region Precipitation Normal Deviation Percent of Normal Northwest North Central Northeast West Central Central East Central Southwest South Central Southeast State
15

16
17

18 Drought Summary from the U.S. Drought Monitor Below is a drought summary for the state of Indiana from the U.S. Drought Monitor. Areas in white are not experiencing any drought. Yellow areas are abnormally dry, but not considered a drought. Drought begins when the moisture levels become more severe, with beige, orange, red, and brown indicating increasing levels of drought (moderate, severe, extreme, and exceptional, respectively). The table below indicates what percentage of the state is drought free, and how much of the state is in drought by degree of severity (D1 - D4 category).
19 Nov 7 th Drought Summary
20 Nov 14 th Drought Summary
21 Nov 21 st Drought Summary
22 Nov 28 th Drought Summary
October 2011 Climate Summary
 Ken Scheeringa and Kayla Hudson Nov 4, 2011 http://www.iclimate.org October 2011 Climate Summary Month Summary October weather evolved as a two part story. Weather conditions the first half of the month
May 2018 Climate Summary
 Ken Scheeringa and Andy Eggert Jun 7, 2018 (765) 494-8105 http://www.iclimate.org May 2018 Climate Summary Month Summary As the calendar turned from April to May temperatures flipped dramatically away
September 2016 Climate Summary
 Ken Scheeringa And Andy Eggert Oct 6, 2016 (765) 494-8105 http://www.iclimate.org September 2016 Climate Summary Month Summary The warmest September in 77 years brought alternating weeks of dry and wet
August 2006 Summary. August 1-5
 Ashley Brooks (765) 494-6574 Sep 8, 2006 http://www.iclimate.org August 1-5 August 2006 Summary The heat wave that started during the end of July continued into the beginning parts of August with temperatures
August 2017 Climate Summary
 Ken Scheeringa And Andy Eggert Sep 7, 2017 (765) 494-8105 http://www.iclimate.org August 2017 Climate Summary Month Summary The coolest August in 13 years featured long cool and warm spells, below normal
February 2017 Climate Summary
 Ken Scheeringa And Andy Eggert Mar 9, 2017 (765) 494-8105 http://www.iclimate.org February 2017 Climate Summary Month Summary February 2017 was the warmest February in Indiana since state climate records
August 2015 Climate Summary
 Ken Scheeringa And Mary Rose Mangan Sep 4, 2015 (765) 494-8105 http://www.iclimate.org August 2015 Climate Summary Month Summary A very active wet summer weather pattern turned much calmer and drier in
October 2016 Climate Summary
 Ken Scheeringa And Andy Eggert Nov 9, 2016 (765) 494-8105 http://www.iclimate.org October 2016 Climate Summary Month Summary October was the 9 th month so far this year to average above normal in temperature.
September 2011 Climate Summary
 Ken Scheeringa and Kayla Hudson Oct 5, 2011 (765) 494-8105 http://www.iclimate.org September 2011 Climate Summary Month Summary The final blast of summer heat arrived at the start of September. It lasted
August 2013 Climate Summary
 Ken Scheeringa and Matt Price Sep 6, 2013 (765) 494-8105 http://www.iclimate.org August 2013 Climate Summary Month Summary August weather began cool and wet but became progressively warmer and drier through
April 2016 Climate Summary
 Ken Scheeringa And Andy Eggert May 9, 2016 (765) 494-8105 http://www.iclimate.org April 2016 Climate Summary Month Summary One month but two seasons. The first half of April was cold with snow. Wind damage
October 2017 Climate Summary
 Ken Scheeringa and Andy Eggert Nov 6, 2017 (765) 494-8105 http://www.iclimate.org October 2017 Climate Summary Month Summary After more than three weeks of warm temperatures October turned suddenly cold
March 2016 Climate Summary
 Ken Scheeringa And Andy Eggert Apr 8, 2016 (765) 494-8105 http://www.iclimate.org March 2016 Climate Summary Month Summary Count March as the 7 th month in a row that the state average temperature has
November 2012 Climate Summary
 Ken Scheeringa and Kayla Hudson Dec 6, 2012 (765) 494-8105 http://www.iclimate.org November 2012 Climate Summary Month Summary November was one of those rare weather months in Indiana when not much happened:
May 2016 Climate Summary
 Ken Scheeringa And Andy Eggert Jun 6, 2016 (765) 494-8105 http://www.iclimate.org May 2016 Climate Summary Month Summary Cold weather dominated in May until the last week of the month. May began wet but
January 2017 Climate Summary
 Ken Scheeringa And Andy Eggert Feb 8, 2017 (765) 494-8105 http://www.iclimate.org January 2017 Climate Summary Month Summary The warmest January in 11 years was nearly 4 F warmer than December 2016. An
September 2005 Climate Summary
 Ashley Brooks (765) 494-6574 Oct 5, 2005 http://iclimate.org September 2005 Climate Summary September 1-7 A cold front came through on the 1 st of the month, however little moisture was associated with
December 2011 Climate Summary
 Ken Scheeringa and Kayla Hudson Jan 17, 2012 (765) 494-8105 http://www.iclimate.org December 2011 Climate Summary Month Summary What a difference a year makes! A year ago the misery of a harsh, cold, and
July 2007 Climate Summary
 Dan Bowman (765) 494-6574 Sep 3, 2007 http://www.iclimate.org Summary July 2007 Climate Summary The month of July ended as a very unusual month. Many events occurred during the month of July that is not
June 2010 Climate Summary
 Ken Scheeringa (765) 494-8105 Jul 6, 2010 http://www.iclimate.org June 2010 Climate Summary Summary Summer like heat and humidity arrived in Indiana on May 22 nd and dominated our weather scene nearly
June 2016 Climate Summary
 Ken Scheeringa And Andy Eggert Jul 8, 2016 (765) 494-8105 http://www.iclimate.org June 2016 Climate Summary Month Summary June was a warm month with below normal temperature on just 6 days. Rainfall was
January 2008 Climate Summary
 Joseph Mays (765) 494-6574 Feb 5, 2008 http://www.iclimate.org Summary January 2008 Climate Summary January was a mix bag of conditions, with an oscillatory pattern developing. We experienced phases of
November 2016 Climate Summary
 Ken Scheeringa And Andy Eggert Dec 15, 2016 (765) 494-8105 http://www.iclimate.org November 2016 Climate Summary Month Summary Unseasonably warm, pleasant, and sunny weather the first half of the month
May 2015 Climate Summary
 Ken Scheeringa And Mary Rose Mangan Jun 8, 2015 (765) 494-8105 http://www.iclimate.org May 2015 Climate Summary Month Summary May was a very warm month. Rainfall averaged near normal but was distributed
October 2014 Climate Summary
 Ken Scheeringa And Matt Price Nov 10, 2014 (765) 494-8105 http://www.iclimate.org October 2014 Climate Summary Month Summary October featured a mix of weather. A very wet first half of the month evolved
April 2017 Climate Summary
 Ken Scheeringa And Andy Eggert May 8, 2017 (765) 494-8105 http://www.iclimate.org April 2017 Climate Summary Month Summary April was a very warm and wet month in Indiana, nearly setting a new monthly temperature
April 2015 Climate Summary
 Ken Scheeringa And Mary Rose Mangan May 8, 2015 http://www iclimate org April 2015 Climate Summary Month Summary April was a month of extremes. Severe weather erupted on 4 days of the first week with multiple
March 2009 Climate Summary
 Joseph Mays (765) 494-6574 Apr 1, 2009 http://www.iclimate.org Summary March 2009 Climate Summary March is in the books and it continued the trend of extreme weather we have experienced during the first
March 2014 Climate Summary
 Ken Scheeringa And Matt Price Apr 8, 2014 (765) 494-8105 http://www.iclimate.org March 2014 Climate Summary Month Summary Winter had officially ended by the calendar but snow and cold persisted in Indiana
November 2010 Climate Summary
 Ken Scheeringa (765) 494-8105 Dec 6, 2010 http://www.iclimate.org November 2010 Climate Summary Summary A four month drought in Indiana is collapsing as significant rain fell the final week of November.
January 2012 Climate Summary
 Ken Scheeringa and Kayla Hudson Feb 6, 2012 (765) 494-8105 http://www.iclimate.org January 2012 Climate Summary Month Summary Where is winter? This question found its way into many conversations throughout
April 2013 Climate Summary
 Ken Scheeringa and Kayla Hudson May 6, 2013 (765) 494-8105 http://www.iclimate.org April 2013 Climate Summary Month Summary Temperatures bounced high and low this month, keeping Hoosiers guessing which
June 2011 Climate Summary
 Ken Scheeringa (765) 494-8105 Jul 8, 2011 http://www.iclimate.org June 2011 Climate Summary Month Summary The abundance of extreme weather this year extended yet another month into June. This month has
November 2015 Climate Summary
 Ken Scheeringa And Mary Rose Mangan Dec 8, 2015 (765) 494-8105 http://www.iclimate.org November 2015 Climate Summary Month Summary November was much warmer than normal while precipitation was very near
September 2012 Climate Summary
 Ken Scheeringa and Kayla Hudson Oct 5, 2012 (765) 494-8105 http://www.iclimate.org September 2012 Climate Summary Month Summary Summer slipped away and it felt a lot more like autumn in Indiana this month
August 2016 Climate Summary
 Ken Scheeringa And Andy Eggert Sep 12, 2016 (765) 494-8105 http://www.iclimate.org August 2016 Climate Summary Month Summary Hot but tranquil weather the first half of August transitioned to a tormented
January 2018 Climate Summary
 Ken Scheeringa and Andy Eggert Feb 8, 2018 (765) 494-8105 http://www.iclimate.org January 2018 Climate Summary Month Summary January temperature swings were amazing. In the first few days arctic cold pushed
SIGNIFICANT EVENTS Severe Storms November 1994 January 1996 August 1998 and May 2000 March 2002 May 2002 Champaign County
 SIGNIFICANT EVENTS Severe Storms November 1994 On Nov. 1, 1994, high winds gusted over 60 mph at times across the northwest third of Ohio. The highest measured wind gust was 63 mph at Columbus Grove (Putnam).
March 2018 Climate Summary
 Ken Scheeringa and Andy Eggert Apr 5, 2018 (765) 494-8105 http://www.iclimate.org March 2018 Climate Summary Month Summary March turned cold with below normal temperatures on two-thirds of its days. Along
IC ARTICLE 19. DESCRIBING REAL PROPERTY; INDIANA COORDINATE SYSTEM. IC Chapter 1. Designation of Indiana Coordinate System; Zones
 IC 32-19 ARTICLE 19. DESCRIBING REAL PROPERTY; INDIANA COORDINATE SYSTEM IC 32-19-1 Chapter 1. Designation of Indiana Coordinate System; Zones IC 32-19-1-1 Designation of systems Sec. 1. The systems of
January 2006 Climate Summary
 Ashley Brooks (765) 494-6574 Feb 9, 2006 http://www.iclimate.org January 1-3 January 2006 Climate Summary Unseasonably warm conditions welcomed in the New Year with highs in the 40s across the northern
May 2005 Climate Summary
 Ashley Brooks (765) 494-6574 Jun 7, 2005 http://iclimate.org May 2005 Climate Summary May 1-5 Early May was characterized by an upper-level trough that was in place over Indiana that brought in very cool
November 2014 Climate Summary
 Ken Scheeringa And Matt Price Dec 10, 2014 (765) 494-8105 http://www.iclimate.org November 2014 Climate Summary Month Summary Unseasonable cold headlined the Indiana and national news in November. The
July 2010 Climate Summary
 Ken Scheeringa (765) 494-8105 Aug 4, 2010 http://www.iclimate.org July 2010 Climate Summary Summary The warm summer of 2010 continues. Daily state average temperatures were above normal on all but seven
2011 Year in Review TORNADOES
 2011 Year in Review The year 2011 had weather events that will be remembered for a long time. Two significant tornado outbreaks in April, widespread damage and power outages from Hurricane Irene in August
January 2013 Climate Summary
 Ken Scheeringa and Kayla Hudson Feb 7, 2013 (765) 494-8105 http://www.iclimate.org January 2013 Climate Summary Month Summary Winter or spring? January featured several dramatic swings in temperature and
July 2011 Climate Summary
 Ken Scheeringa (765) 494-8105 Aug 8, 2011 http://www.iclimate.org July 2011 Climate Summary Month Summary The upper atmospheric high pressure dome which baked the Texas area in heat and drought the past
July 2014 Climate Summary
 Ken Scheeringa And Matt Price Aug 8, 2014 (765) 494-8105 http://www.iclimate.org July 2014 Climate Summary Month Summary July was unseasonably cool and drier than normal. Rainfall was light in parts of
October 2012 Climate Summary
 Ken Scheeringa and Kayla Hudson Nov 8, 2012 (765) 494-8105 http://www.iclimate.org October 2012 Climate Summary Month Summary In a reversal from the hot and dry summer, cooler and wetter than normal conditions
Champaign-Urbana 1998 Annual Weather Summary
 Champaign-Urbana 1998 Annual Weather Summary ILLINOIS STATE WATER SURVEY Audrey Bryan, Weather Observer 2204 Griffith Dr. Champaign, IL 61820 wxobsrvr@sparc.sws.uiuc.edu The development of the El Nìno
Champaign-Urbana 2001 Annual Weather Summary
 Champaign-Urbana 2001 Annual Weather Summary ILLINOIS STATE WATER SURVEY 2204 Griffith Dr. Champaign, IL 61820 wxobsrvr@sws.uiuc.edu Maria Peters, Weather Observer January: After a cold and snowy December,
NWS FORM E-5 U.S. DEPARTMENT OF COMMERCE I HYDRO SERVICE AREA NOAA, NATIONAL WEATHER SERVICE I Indianapolis, IN MONTHLY REPORT
 NWS FORM E-5 U.S. DEPARTMENT OF COMMERCE I HYDRO SERVICE AREA NOAA, NATIONAL WEATHER SERVICE I Indianapolis, IN. 1-------------------- MONTHLY REPORT OF RIVER AND FLOOD CONDITIONSI REPORT FOR I November
June 2015 Climate Summary
 Ken Scheeringa And Mary Rose Mangan Jul 10, 2015 (765) 494-8105 http://www.iclimate.org June 2015 Climate Summary Month Summary Indiana set a new June rainfall record this month with a state average 8.99.
National Wildland Significant Fire Potential Outlook
 National Wildland Significant Fire Potential Outlook National Interagency Fire Center Predictive Services Issued: September, 2007 Wildland Fire Outlook September through December 2007 Significant fire
Champaign-Urbana 1999 Annual Weather Summary
 Champaign-Urbana 1999 Annual Weather Summary ILLINOIS STATE WATER SURVEY 2204 Griffith Dr. Champaign, IL 61820 wxobsrvr@sws.uiuc.edu Maria Peters, Weather Observer A major snowstorm kicked off the new
July 2015 Climate Summary
 Ken Scheeringa And Mary Rose Mangan Aug 6, 2015 (765) 494-8105 http://www.iclimate.org July 2015 Climate Summary Month Summary Record setting rainfall in June persisted into the first three weeks of July.
April 2011 Climate Summary
 Ken Scheeringa (765) 494-8105 May 9, 2011 http://www.iclimate.org April 2011 Climate Summary Summary After somewhat of a respite in March Indiana weather ramped up with a vengeance in April. Extreme weather
Crop / Weather Update
 Crop / Weather Update This is our last for the 2018 planting, growing and harvesting seasons. USDA will publish their Crop Progress Report again in April 2019, and we will continue our coverage sometime
The hydrologic service area (HSA) for this office covers Central Kentucky and South Central Indiana.
 for this office covers Central Kentucky and South Central Indiana.") January 2012 February 13, 2012 An X inside this box indicates that no flooding occurred within this hydrologic service area. January 2012 continued the string of wet months this winter. Rainfall was generally
January 2012 February 13, 2012 An X inside this box indicates that no flooding occurred within this hydrologic service area. January 2012 continued the string of wet months this winter. Rainfall was generally
Monthly Long Range Weather Commentary Issued: July 18, 2014 Steven A. Root, CCM, President/CEO
 Monthly Long Range Weather Commentary Issued: July 18, 2014 Steven A. Root, CCM, President/CEO sroot@weatherbank.com JUNE 2014 REVIEW Climate Highlights The Month in Review The average temperature for
Monthly Long Range Weather Commentary Issued: SEPTEMBER 19, 2016 Steven A. Root, CCM, Chief Analytics Officer, Sr. VP,
 Monthly Long Range Weather Commentary Issued: SEPTEMBER 19, 2016 Steven A. Root, CCM, Chief Analytics Officer, Sr. VP, sroot@weatherbank.com SEPTEMBER 2016 Climate Highlights The Month in Review The contiguous
Crop / Weather Update
 Crop / Weather Update The next will be published November 13, 2018, due to the Veteran s Day holiday on Monday. Corn Harvesting Progress 100% 90% 80% 70% 60% 50% 40% 30% 20% 10% 0% 9/9 9/16 9/23 9/30 10/7
Crop / Weather Update
 Crop / Weather Update Corn Crop Condition Percent of Acreage Rated Good or Excellent 85 80 75 70 65 60 55 50 45 The U.S. corn crop was rated 69% good-to-excellent on September 23, up 1% from week-ago,
The Pennsylvania Observer
 The Pennsylvania Observer October 1, 2015 September 2015 - Pennsylvania Weather Recap By: Quinn Lease The month of September will be remembered for its above normal temperatures and dry conditions that
Summary of November Central U.S. Winter Storm By Christopher Hedge
 Summary of November 12-13 2010 Central U.S. Winter Storm By Christopher Hedge Event Overview The first significant snowfall of the 2010-2011 season affected portions of the plains and upper Mississippi
Chapter 3: Weather Fronts & Storms
 Chapter 3: Weather Fronts & Storms An AIR MASS is a large body of air that has similar characteristics (temperature, humidity) throughout. Air masses can be massively large. Air masses are classified by
Monthly Long Range Weather Commentary Issued: APRIL 18, 2017 Steven A. Root, CCM, Chief Analytics Officer, Sr. VP,
 Monthly Long Range Weather Commentary Issued: APRIL 18, 2017 Steven A. Root, CCM, Chief Analytics Officer, Sr. VP, sroot@weatherbank.com MARCH 2017 Climate Highlights The Month in Review The average contiguous
October 2010 Climate Summary
 Ken Scheeringa (765) 494-8105 Nov 5, 2010 http://www.iclimate.org October 2010 Climate Summary Summary Rain fell on about 10 days in October but did little to slow the drought raging across Indiana. For
Monthly Long Range Weather Commentary Issued: May 15, 2014 Steven A. Root, CCM, President/CEO
 Monthly Long Range Weather Commentary Issued: May 15, 2014 Steven A. Root, CCM, President/CEO sroot@weatherbank.com APRIL 2014 REVIEW Climate Highlights The Month in Review The average temperature for
2012 Growing Season Weather Summary for North Dakota. Adnan Akyüz and Barbara A. Mullins Department of Soil Science October 30, 2012
 2012 Growing Season Weather Summary for North Dakota Adnan Akyüz and Barbara A. Mullins Department of Soil Science October 30, 2012 Introduction The 2012 growing season (the period from April through September)
2018 Year in Review for Central and Southeast Illinois By: Chris Geelhart, Meteorologist National Weather Service, Lincoln IL
 By: Chris Geelhart, Meteorologist National Weather Service, Lincoln IL While 2018 featured some significant out-of-season weather, including below zero temperatures in April and 90-degree highs in early
Crop / Weather Update
 Crop / Weather Update Corn Crop Condition Percent of Acreage Rated Good or Excellent 85 80 75 70 65 60 55 50 45 Corn condition this week is the same as the last two weeks in the good/excellent category,
Crop / Weather Update
 Crop / Weather Update Corn Crop Condition Percent of Acreage Rated Good or Excellent 85 80 75 70 65 60 55 50 45 As of September 9, USDA rates the crop at 68% good to excellent. The rating is up one point
The Weather Wire. Contents: Summer 2018 Outlook. Summer 2018 Outlook Drought Monitor May Summary/Statistics June Preview Rainfall Totals
 The Weather Wire June 2018 Volume 25 Number 6 Contents: Summer 2018 Outlook Drought Monitor May Summary/Statistics June Preview Rainfall Totals Summer 2018 Outlook June 1 st marked the first day of meteorological
Crop / Weather Update
 Crop / Weather Update Corn Crop Condition Percent of Acreage Rated Good or Excellent 85 80 75 70 65 60 55 50 45 In its weekly Crop Progress Report for September 16, the USDA stated the 18-state average
February 2016 Climate Summary
 Ken Scheeringa And Andy Eggert Mar 9, 2016 (765) 494-8105 http://www.iclimate.org February 2016 Climate Summary Month Summary February was the 6 th consecutive month with an above normal state average
Table 1. August average temperatures and departures from normal ( F) for selected cities.
 for selected cities.") Climate Summary for Florida August 2016 Prepared by Lydia Stefanova and David Zierden Florida Climate Center, The Florida State University, Tallahassee, Florida Online at: http://climatecenter.fsu.edu/products-services/summaries
Climate Summary for Florida August 2016 Prepared by Lydia Stefanova and David Zierden Florida Climate Center, The Florida State University, Tallahassee, Florida Online at: http://climatecenter.fsu.edu/products-services/summaries
W I N T E R STORM HAZARD DESCRIPTION
 W I N T E R STORM HAZARD DESCRIPTION... 1 LOCATION... 2 EXTENT... 2 HISTORICAL OCCURRENCES... 4 SIGNIFICANT PAST EVENTS... 4 PROBABILITY OF FUTURE EVENTS... 5 VULNERABILITY AND IMPACT... 5 HAZARD DESCRIPTION
Monthly Long Range Weather Commentary Issued: February 15, 2015 Steven A. Root, CCM, President/CEO
 Monthly Long Range Weather Commentary Issued: February 15, 2015 Steven A. Root, CCM, President/CEO sroot@weatherbank.com JANUARY 2015 Climate Highlights The Month in Review During January, the average
Weather and Climate Summary and Forecast October 2017 Report
 Weather and Climate Summary and Forecast October 2017 Report Gregory V. Jones Linfield College October 4, 2017 Summary: Typical variability in September temperatures with the onset of fall conditions evident
Crop / Weather Update
 Crop / Weather Update Corn Crop Condition Percent of Acreage Rated Good or Excellent 85 80 75 70 65 60 55 50 45 Corn condition this week is the same as last week in the good/excellent category, which is
New Hampshire State Climate Office Dr. Mary D. Stampone, State Climatologist
 New Hampshire State Climate Office Dr. Mary D. Stampone, State Climatologist University of New Hampshire c/o Department of Geography 73 Main Street Durham, NH 03824 Phone: 603-862-3136 Fax: 603-862-4362
The Pennsylvania Observer
 The Pennsylvania Observer August 3, 2015 July 2015 - Pennsylvania Weather Recap By: Arthur Person Although this seventh month of 2015 was fairly normal across Pennsylvania as a whole, the details reveal
March 2011 Climate Summary
 Ken Scheeringa (765) 494-8105 Apr 5, 2011 http://www.iclimate.org March 2011 Climate Summary Summary The fast paced weather action of February slowed some in March. The major March weather features were
WeatherManager Weekly
 Issue 288 July 14, 2016 WeatherManager Weekly Industries We Serve Agriculture Energy/Utilities Construction Transportation Retail Our Weather Protection Products Standard Temperature Products Lowest Daily
Weather and Climate Summary and Forecast August 2018 Report
 Weather and Climate Summary and Forecast August 2018 Report Gregory V. Jones Linfield College August 5, 2018 Summary: July 2018 will likely go down as one of the top five warmest July s on record for many
UNITED STATES AND SOUTH AMERICA OUTLOOK (FULL REPORT) Thursday, December 28, 2017
 Thursday, December 28, 2017") T-storm Weather Summary Despite scattered t-storms Sat.-Sun. in central and northern areas in Argentina, more will likely be needed especially in sunflower areas of the southwest. Some t-storms likely
T-storm Weather Summary Despite scattered t-storms Sat.-Sun. in central and northern areas in Argentina, more will likely be needed especially in sunflower areas of the southwest. Some t-storms likely
NWS FORM E-5 U.S. DEPARTMENT OF COMMERCE HSA OFFICE:
 NWS FORM E-5 U.S. DEPARTMENT OF COMMERCE HSA OFFICE: NOAA, NATIONAL WEATHER SERVICE MONTHLY REPORT OF RIVER AND FLOOD CONDITIONS DATE: TO: North Webster, IN REPORT FOR (MONTH &YEAR): July 1998 August 5,
January 25, Summary
 January 25, 2013 Summary Precipitation since the December 17, 2012, Drought Update has been slightly below average in parts of central and northern Illinois and above average in southern Illinois. Soil
NATIONAL WEATHER SERVICE
 January 2016 February 9, 2016 This was a dry month across the HSA despite one large and several smaller snowfalls. Most locations ended up 1-2 inches below normal for the month. The driest locations at
KANSAS CLIMATE SUMMARY August 2015
 KANSAS CLIMATE SUMMARY August 2015 Cool and Dry August was drier than normal in most of the state. State-wide average precipitation was 2.80 inches or 85 percent of normal. The Northeast division of the
Weather and Climate Risks and Effects on Agriculture
 Weather and Climate Risks and Effects on Agriculture Dr. Eric Snodgrass Official Journal of the Fluid Fertilizer Foundation Vol. 26, No. 2, Issue #100 DOWNLOAD Summary: So, what do we need to watch for?
March 2012 Climate Summary
 Ken Scheeringa and Kayla Hudson Apr 4, 2012 (765) 494-8105 http://www.iclimate.org March 2012 Climate Summary Month Summary March was a month of weather extremes with records shattered almost as a daily
Weather and Climate Summary and Forecast Summer 2017
 Weather and Climate Summary and Forecast Summer 2017 Gregory V. Jones Southern Oregon University August 4, 2017 July largely held true to forecast, although it ended with the start of one of the most extreme
Nebraska experienced a wide
 Issue 1 August 2016 CLIMATE UPDATE A MONTHLY SUMMARY FROM THE neclimate.unl.edu August saw reprieve from dryness, cooler temps Overview Nebraska experienced a wide range of conditions across the state
but 2012 was dry Most farmers pulled in a crop
 After a winter that wasn t, conditions late in the year pointed to a return to normal snow and cold conditions Most farmers pulled in a crop but 2012 was dry b y M i k e Wr o b l e w s k i, w e a t h e
SEPTEMBER 2013 REVIEW
 Monthly Long Range Weather Commentary Issued: October 21, 2013 Steven A. Root, CCM, President/CEO sroot@weatherbank.com SEPTEMBER 2013 REVIEW Climate Highlights The Month in Review The average temperature
Air Masses, Fronts, Storm Systems, and the Jet Stream
 Air Masses, Fronts, Storm Systems, and the Jet Stream Air Masses When a large bubble of air remains over a specific area of Earth long enough to take on the temperature and humidity characteristics of
Monthly Long Range Weather Commentary Issued: APRIL 1, 2015 Steven A. Root, CCM, President/CEO
 Monthly Long Range Weather Commentary Issued: APRIL 1, 2015 Steven A. Root, CCM, President/CEO sroot@weatherbank.com FEBRUARY 2015 Climate Highlights The Month in Review The February contiguous U.S. temperature
NATIONAL WEATHER SERVICE
 NWS Form E-5 (PRES. BY NWS Instruction 10-924) MONTHLY REPORT OF HYDROLOGIC CONDITIONS HYDROLOGIC SERVICE AREA (HSA) NORTHERN INDIANA (IWX) MONTH YEAR TO: Hydrologic Information Center, W/OS31 NOAA s National