March 2011 Climate Summary
|
|
|
- Ella Garrison
- 5 years ago
- Views:
Transcription

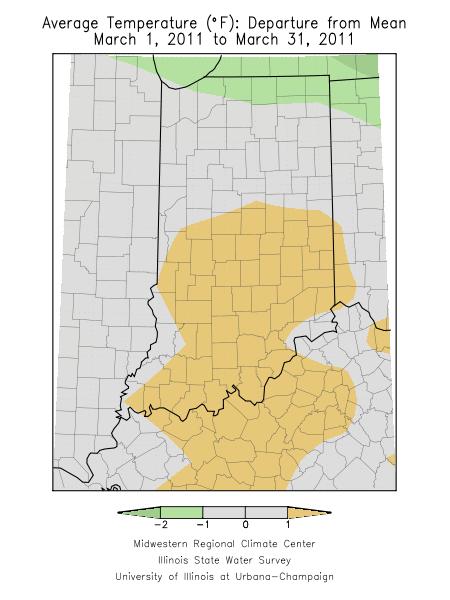
1 Ken Scheeringa (765) Apr 5, March 2011 Climate Summary Summary The fast paced weather action of February slowed some in March. The major March weather features were flooding and hail. The harsh winter is finally ending but left its pothole mark on Indiana roads. Six cars were quickly disabled by massive craters on an interstate highway. The temperature roller coaster continued throughout the month. Yet the large temperature variations between periods of warm and cold are masked in the March 2011 state average temperature of 41.4 which is just 0.7 above normal. This ranks the month near midrange as the 49 th warmest on record in Indiana since Last year March ranked 23 rd warmest at The even split this month in the day count on each side of normal is also bland: 15 days of below normal temperature, 15 days of above, and one day at normal. The daily state mean temperature was at least 10 below normal on the last 6 days of the month. On 5 days state mean temperatures were at least 10 above normal. The highest recorded temperature of the month was 80 on March 20 th at Boonville, and again two days later at Greensburg, Lexington, Terre Haute, and Vincennes. The coldest observed temperature was 14 at Angola on March 1 st. The state average precipitation total in March was 3.50 inches which is just 3% or 0.10 inch above normal. Again this places the month near the historical middle as the 52 nd wettest March on record. The most recent wetter March was three years ago when 6.88 inches of precipitation was reported, locking in 7 th place. In far southwestern Indiana the CoCoRaHS observer in Newburgh observed the highest single day precipitation for the month on March 15 th with 3.35 inches. Second highest honors go to the Gosport volunteer who measured 3.13 inches on March 5 th. Regionally March precipitation averaged about 2.5 inches in northern Indiana, 3.7 inches in central, and near 4.4 inches in the south. These totals are about 90% of normal in the north and 110% of normal in central and southern Indiana. The snow season usually concludes in Indiana by the end of March. Snow fell some place in the state on only about 6 days this month. Generally 3 to 5 inches of snow fell in the northwest lake effect region and 0.5 inch to 2.5 inches elsewhere across northern Indiana. Central Indiana averaged about 0.5 inch to 1.5 inch while a trace to 2.5 inches of the white stuff was seen across the southern counties. The highest monthly total of 5.0 inches was measured in Chesterton. The past winter has seen many disasters in Indiana and this trend continued in March. East central Indiana was devastated by two rounds of flooding which occurred over a week from February 28 th through March 6 th. The Portland downtown area was especially hard hit with some of its worst flooding in over 40 years. Flooding also afflicted the Indianapolis metro area where 7 people had to
2 be rescued in Zionsville. In southwest Indiana, a levee breach in Daviess county flooded 11,000 acres. The small town of Maysville had to be evacuated. Later in the month severe storms on March 23 rd caused wind and hail damage in 16 counties. Details on these specific weather incidents can be found in the weekly narratives which follow. There was continued improvement in the Indiana drought status during March. According to the National Drought Monitor there are no longer any areas of moderate drought (D1 class) or worse in the state. The acreage classified as abnormally dry (D0 class) has shrunk from 40% to 33% over the month while the drought free region has increased from 56% to 67%. Weekly Indiana drought maps are included at the end of this monthly report. March 1 st 7 th The transition to spring is noticeably underway. Daily temperatures this week skittered on both sides of normal while rain events are becoming as common as snow storms. The rain has come more often and heavily, setting the stage for an impact well known in Indiana: flooding. Yet birds are returning and the sun is rising earlier each morning, that is, until Daylight Savings Time begins next week. March began with daily average temperatures 2 below normal. Each day grew a bit warmer until March 4 th when state average temperatures peaked at 6 above normal. A strong cold front on March 6 th sunk temperatures about 12 to settle at 6 below normal. The first week of March finished with daily temperatures at 4 below normal. Overall for the week temperatures averaged about 1 above normal in Indiana. Typically at the start of March daily maximum temperatures range from 44 to 55 north to south across the state. Normal daily minimums vary between 27 in far northern Indiana to 34 in the extreme southwest. The upper atmospheric jet stream continued in a mostly west to east zonal pattern this week. Only two storm systems passed through Indiana, the first on March 2 nd and an intense triple-low system on March 5 th and 6 th. It was this second system that produced nearly all the precipitation, averaging about 1.1 inch in northern Indiana, 2.2 inches in central, and 1.8 inches across southern Indiana. These regional averages are about 180% of normal in the north, 310% of normal in central Indiana, and 200% of normal in the south. The heaviest single day precipitation reported was 3.13 inches by the CoCoRaHS reporter at Gosport on the morning of March 5 th. Other heavy totals that day were 2.96 and 2.84 inches at two locations in New Castle, and 2.95 inches at Greenfield. Among the heaviest precipitation totals for the week were 3.69 inches at Gosport, 3.39 inches in Spencer, and 3.33 inches in New Castle. As colder air moved in the rain changed to snow in northern Indiana. The heaviest one day snow amounts on March 6 th included 3.7 inches at Lakes of the Four Seasons and at Chesterton, with 3.5 inches in Portage, and 3.3 inches at Hudson. These amounts were also the highest weekly snowfall totals around the state. Regionally about 2 to 4 inches of snow was noted in the lake effect region and 2 inches or less elsewhere in northern Indiana. In central Indiana some locations reported just a trace of snow, but many areas received none. No snow was recorded across southern Indiana.
3 Heavy rain which fell at the end of February and in the second storm this week combined with melting of left over snow cover on saturated soils has pushed rivers over their banks. Flooding was particularly a problem in the eastern counties of Indiana and in the Indianapolis area. In Decatur and southern Allen counties, emergency officials are using three different methods to mitigate the rising rivers: stacking sandbags at strategic points, building clay dikes to create a barrier, and installing up to 16 water pumps in locations known for flooding. The situation in Jay county was more desperate. Water from strong storms surged quickly and swamped downtown Portland. A foot of water stood in Portland city hall which local residents say hasn t happened in at least 40 years. Police officers stood in the water answering city phones while trying to salvage computers and file cabinets but eventually phone lines went dead and computers stopped working. City hall and the courthouse closed and downtown businesses spent the next few days cleaning up. Highway US 27 was closed due to high water. Sand bags were not enough to stop the flood, leaving cars stranded in the streets and making travel impossible. The fire department was called out on several flood rescues. Fortunately there were no serious injuries. Many homes in Jay county were surrounded by flood water especially in the nearby town of New Corydon. Local officials contacted Indiana Homeland Security and state representatives. An assessment team was assigned to visit Portland and Jay county and determine if the area may qualify for state and federal disaster assistance. Meanwhile the Jay county emergency management director figured the damage will come to several million dollars. In Delaware county Muncie authorities issued a flood disaster declaration. The Red Cross arrived with disaster assistance teams and were conducting disaster assessments, distributing cleanup kits, and providing emergency assistance to residents of Jay and Delaware counties. To the south Henry and Randolph counties were also slammed by flooding and were placed under a flood warning. Several roads in these counties were closed due to heavy flooding along the Mississinewa River, including parts of state highways 109 and 103 in Henry county and state highway 1 in Randolph county. Central Indiana was another area of the state with flooding issues. On the northwest side of metropolitan Indianapolis, the Zionsville fire department rescued 7 people in 5 high water incidents. One woman was trapped in her submerged car for 20 minutes until rescuers arrived. The department also saved a woman and two dogs from a flooded home in that city. On the northeast side firefighters had to rescue people from flooded vehicles in Fishers and Noblesville. Several roads were closed for a few days in Indianapolis, Fishers and Noblesville. Along the White River in Indianapolis, many homes were surrounded by water. Some residents were using paddle boats to escape their neighborhoods to stay elsewhere for a few days. The White River, as well as many rivers in this area, will reach their highest level since March The heavy 4-inch rainfall upstream in Muncie is a cause of the flooding problems in the Indianapolis area. The city offered free sandbags to residents to use to protect their homes from rising water. On the southwest side of the city several cars stalled in high water at the Bloomington exit of I-465.
4 On the northeast side of the city a vehicle ended up in a canal in the Broad Ripple area. Neither incident resulted in injuries to the drivers. Elsewhere there were reminders that winter is not quite over yet. In Lake county high winds combined with icy road conditions late in the week added to the enormous winter count of slide offs and vehicle crashes in Indiana this season. No serious injuries were reported in these latest incidents but interstate traffic was slowed as drivers struggled against the high winds. The cumulative impacts of the rough winter shocked drivers in Putnam county. Potholes on I-70 west of Indianapolis became so massive they evolved into craters in the highway. Six cars had to be towed away after hitting the monster holes in the pavement. State highway workers were called to the scene to do emergency road repairs. Perhaps the only positive news this week was an improvement in the state drought status. According to the National Drought Monitor the last remnants of drought in the southern half of Indiana were washed away this week. The updated map shows abnormally dry conditions are now limited to the area generally north of a line from Terre Haute to Decatur. Exceptions in this region are parts of St Joseph, Laporte, Newton, and Benton counties which are rated drought free. Kosciusko county and parts of its surrounding counties is the only region of Indiana remaining in moderate drought (D1 class), about 4% of the total state area. About 41% of the state area is declared as abnormally dry (D0 class). March 8 th 14 th Daily temperature shifts above and below normal are happening quickly now that spring is approaching but without the extremes of winter. State average temperatures peaked at 7 above normal briefly on March 9 th but fell back to normal the next day. For the remainder of the week temperatures remained within 4 above and below normal. Overall for Indiana this week temperatures averaged just 1 above normal. Usually in this second week of March daily maximum temperatures should range between 46 to 56 north to south across the state. Normal daily minimums vary between 28 in far northern counties to 35 in the southwest.
5 A rainy warm front passed through Indiana on March 9 th. This was followed by 3 quick dry cold fronts that brought little rainfall and did not change temperatures very much across the state. Total precipitation this week averaged around a half inch in northern and central Indiana but much more in the south averaging about 1.60 inch. The warm front of March 9 th dumped 2.58 and 2.45 inches of rain in Jeffersonville according to two CoCoRaHS observers in Clark county. The volunteer in Elizabeth measured 2.41 inches that morning while Lanesville noted 2.35 inches. These were the heaviest single day rainfall totals in Indiana this week. Along with showers in southern Indiana on other days this week, these storms raised the weekly rainfall total to 3.42 inches in Elizabeth and to 3.31 and 3.26 inches in the Jeffersonville gauges. Regionally northern and central Indiana noted about 80% of the normal weekly precipitation total while southern Indiana received significantly more at 190% of normal. The wind flow pattern in the upper atmosphere favored storms and rainfall the first half of this week but then zonal flow returned later which tends to quiet storm activity. The snow season is coming to an end in Indiana but northwest counties did receive light amounts. On March 10 th CoCoRaHS observers in Chesterton and Valparaiso measured 1.1 inch of snow, the most recorded for the day and week in Indiana. Other volunteers in Valparaiso, Portage, and Laporte noted 1.0 inch. In summary the snowfall pattern this week is described as up to 1 inch in the lake effect region, and a trace in the rest of northern Indiana. There was no snow observed in central or southern sections of the state. The early week rain extended flood warnings through March 13 th along the Kankakee River in northwest Indiana. Meanwhile in southwest Indiana, water from the west fork of the White River covered 11,000 acres of farm ground in Daviess County due to a levee breach on March 6 th. An intentional break in another local levee was then created by county officials to siphon water back into the White River and save 49 homes west of the city of Washington from flooding. But this new breach threatened the tiny town of Maysville which faced evacuation. Indiana Governor Mitch Daniels asked President Obama this week for federal public assistance to 39 counties which suffered in the early February snow and ice storms. If approved, Indiana state and local governments could apply for federal funding to pay 75% of the approved cost of debris removal, emergency services and the repair or replacement of public roads and buildings. According to the US Drought Monitor there was no change in drought status throughout Indiana this week. Southern Indiana had already been removed as a drought area a week ago and the additional rainfall this week would not change that status. Rainfall was below normal this week in northern and central Indiana but was sufficient to keep the drought in those areas from worsening.
6 March 15 th 21 st After a cool day to start this week temperatures ramped up quickly and remained above normal to the end. A wet cool day on March 15 th held temperatures to 2 below normal but a sudden warm up thanks to a high pressure center in our southern states lifted temperatures to 15 above normal just two days later. A cold frontal passage on March 18 th dropped the thermometer 10 over the next two days, but left state average temperatures still 5 above normal. In advance of the next storm system Indiana temperatures rebounded to 15 above normal for the second time this week. Another cold front entered the state on March 21 st. Overall this week state temperatures averaged 9 above normal. Typically at this time of year daily maximum temperatures would range between 48 in far northern Indiana to 59 in the far southwest. Daily minimums should vary between 30 and 38 north to south across the state. Rain fell nearly every day this week but amounts were light. The upper atmosphere has settled into a mostly zonal wind field over Indiana in recent days and this pattern doesn t provide much support for widespread heavy showers. Yet each frontal passage with its surface temperature roller coaster did manage to squeeze out a little moisture most every day. For the week on average about 0.4 inch of rain fell across northern Indiana and 0.7 inch in central and southern Indiana. These totals are about 65% of normal in the north and south and around 90% of normal in central Indiana. The heaviest showers came at the start of the week in southern Indiana. The CoCoRaHS observer in Newburgh measured 3.35 inches in the rain gauge on March 15 th. That same day the Hazleton volunteer recorded 1.20 inch while 1.18 inch was noted in Holland, 1.15 inch at Patoka, and 1.12 inch in Charlestown. The calendar says spring began on March 20 th and nature cooperated. No snowfall was observed in Indiana this week. The Indiana drought left over from last autumn is gradually disappearing. In the latest edition of the National Drought Monitor, no areas of moderate drought (D1 category) or worse remain in Indiana. With the exception of portions of northwest border counties stretching from St Joseph to Benton county, most of Indiana north of a line from the communities of Clinton to Decatur is classified as abnormally dry (D0 category), or about 33% of total state area.

7 March 22 nd 31 st After a tease of spring last week winter returned abruptly these last days of March perhaps to say a long goodbye. A low pressure system with a slowing warm front in southern Indiana boosted temperatures to 15 above normal on March 22 nd. But then temperatures crashed to 7 below normal on March 24 th as cold Canadian air took hold for the remainder of the month. Daily state average temperatures slid a little colder each day bottoming out at 13 below normal on March 27 th. There wasn t much improvement the next few days as March closed out at 10 below normal. Overall for the 10 day interval state average temperatures came in at 5 below normal. Typically in this final third of the month daily maximum temperatures should range between 53 and 62 north to south across Indiana. Daily minimums normally vary from 34 in the far north to 40 in the extreme southwest. Most of the precipitation came at the start of the 10 days. After the storm of March 23 rd moved east of Indiana no surface fronts passed through our state to the end of the month, unusual for this time of year. A zonal wind flow in the upper atmosphere suppressed storm development while a high pressure system in the Hudson Bay area of Canada continuously poured a cold pool of air our way. The upper atmospheric zonal pattern is giving way to a new wind pattern as March ends. Light to moderate precipitation fell through March 24 th, averaging about a half inch in northern Indiana and a quarter inch in central and southern Indiana. The 10-day totals are only about 50% of normal in northern Indiana, 25% in central, and near 15% of normal across the south. The heaviest single day amounts came right at the start of the interval. The CoCoRaHS observer at Rochester measured 1.48 inches early on March 22 nd. Other reports that day included 1.15 inch in St John, 1.10 inch in Urbana, and 1.06 inch at Wanatah. Over all 10 days the Rochester volunteer totaled 1.78 inch in the rain gauge. The Urbana total was 1.30 inch while Wanatah recorded 1.20 inch. The St John observer sent word of 1.19 inch over the 10 days. The return to much colder weather allowed that other winter event, snowfall, to revisit as well. On March 27 th from 1 to 3 inches covered the ground in parts of southern Indiana. Salem measured 2.7 inches, while the Shoals observer recorded 2.5 inches. Washington noted 2.1 inches of snowfall, and the Charlestown and Bedford volunteers each reported 2.0 inches of new snow. These single day amounts also represent the highest 10 day totals in Indiana as no more snow fell at these

8 locations to the end of the month. The snow melted quickly under the now stronger March sun and was gone by that afternoon. A central Indiana snowfall on March 30 th was more of a surprise to residents. This event was caused by a storm based in the upper atmosphere, not at ground level, but did drop a quick inch in bands across central Indiana. In summary over the 10 days up to 0.3 inch fell across northern Indiana, 0.5 to 1.5 inch in central, and none to about 2.5 inches in southern Indiana. In the lake effect region up to 0.4 inch was measured. The spring warmth left over from the previous week did not go quietly. Golf ball sized hail fell during severe thunderstorms on the evening of March 23 rd in Fountain, Montgomery, and Marion counties. Other hail was seen in Hancock, Boone, Hamilton, Hendricks, Shelby, Tipton, Union, Fayette, Lawrence, and Grant counties. Wind damage and power outages occurred in Hamilton, Johnson, and Rush counties. Hail damaged the roofs, siding and windows of about 30 homes in the town of New Salem in Rush county. In Rushville a garage was blown down. Meanwhile in Noblesville, a downburst in which cold air aloft is suddenly shot downwards and spread out when it hits the ground, tore down fences and stripped shingles and siding from about a dozen homes. Trees were uprooted and fell in an outward fan pattern when the downburst with its high winds arrived at the leading edge of the storm. Some of the trees fell on homes elsewhere in Hamilton county and caused damage there. Power was lost to several hundred residents just north of Indianapolis as more trees came down in those neighborhoods. In Montgomery county some of the hail was estimated at 1.75 inches in diameter. Damage was not limited to central Indiana. Hail was also noted in the Columbia City area during severe storms. Thunderstorm and tornado warnings were issued as the hail and high winds ravaged this area. In far southwest Indiana, trees fell on power lines in Evansville causing 2,500 customers to loose power. Hail was reported in Orange county and high winds took down some trees there. Hail dented many vehicles and covered the ground in Jefferson county while hail was also noted in Ripley county. The overall light precipitation totals of these final 10 days of March did not improve the soil moisture status of northern Indiana according to the National Drought Monitor. As reported last week about 33% of the total land area in Indiana remains abnormally dry (D0 drought category).
9 March Temperature Region Temperature Normal Deviation Northwest North Central Northeast West Central Central East Central Southwest South Central Southeast State Precipitation Region Precipitation Normal Deviation Percent of Normal Northwest North Central Northeast West Central Central East Central Southwest South Central Southeast State Spring 2011 to date (same as March) Temperature Region Temperature Normal Deviation Northwest North Central Northeast West Central Central East Central Southwest South Central Southeast State
10 Precipitation Region Precipitation Normal Deviation Percent of Normal Northwest North Central Northeast West Central Central East Central Southwest South Central Southeast State Annual so far Temperature Region Temperature Normal Deviation Northwest North Central Northeast West Central Central East Central Southwest South Central Southeast State Precipitation Region Precipitation Normal Deviation Percent of Normal Northwest North Central Northeast West Central Central East Central Southwest South Central Southeast State
11

12
13
14 Drought Summary from the U.S. Drought Monitor Below is a drought summary for the state of Indiana from the U.S. drought monitor. Areas in white are not experiencing any drought. Yellow areas are abnormally dry, but not entirely considered a drought. Drought begins when the moisture levels become more severe, with beige, orange, red, and brown indicating increasing levels of drought (moderate, severe, extreme, and exceptional, respectively). The table below indicates how much of the state is not under drought conditions, and also how much of the state is under drought conditions from its respective column upwards. For example, March 29 th has 66.7% of Indiana under no drought, and 33.3% of Indiana under at least D0 through D4 drought status. Please note, however, that these areas are not exact, and much of this drought map has been created from reports throughout the state and estimation, so use this information as a general view rather than for specifics.

15 March 8 th Drought Summary

16 March 15 th Drought Summary
17 March 22 nd Drought Summary
18 March 29 th Drought Summary
October 2011 Climate Summary
 Ken Scheeringa and Kayla Hudson Nov 4, 2011 http://www.iclimate.org October 2011 Climate Summary Month Summary October weather evolved as a two part story. Weather conditions the first half of the month
July 2007 Climate Summary
 Dan Bowman (765) 494-6574 Sep 3, 2007 http://www.iclimate.org Summary July 2007 Climate Summary The month of July ended as a very unusual month. Many events occurred during the month of July that is not
September 2005 Climate Summary
 Ashley Brooks (765) 494-6574 Oct 5, 2005 http://iclimate.org September 2005 Climate Summary September 1-7 A cold front came through on the 1 st of the month, however little moisture was associated with
December 2011 Climate Summary
 Ken Scheeringa and Kayla Hudson Jan 17, 2012 (765) 494-8105 http://www.iclimate.org December 2011 Climate Summary Month Summary What a difference a year makes! A year ago the misery of a harsh, cold, and
August 2006 Summary. August 1-5
 Ashley Brooks (765) 494-6574 Sep 8, 2006 http://www.iclimate.org August 1-5 August 2006 Summary The heat wave that started during the end of July continued into the beginning parts of August with temperatures
September 2011 Climate Summary
 Ken Scheeringa and Kayla Hudson Oct 5, 2011 (765) 494-8105 http://www.iclimate.org September 2011 Climate Summary Month Summary The final blast of summer heat arrived at the start of September. It lasted
March 2014 Climate Summary
 Ken Scheeringa And Matt Price Apr 8, 2014 (765) 494-8105 http://www.iclimate.org March 2014 Climate Summary Month Summary Winter had officially ended by the calendar but snow and cold persisted in Indiana
November 2012 Climate Summary
 Ken Scheeringa and Kayla Hudson Dec 6, 2012 (765) 494-8105 http://www.iclimate.org November 2012 Climate Summary Month Summary November was one of those rare weather months in Indiana when not much happened:
January 2008 Climate Summary
 Joseph Mays (765) 494-6574 Feb 5, 2008 http://www.iclimate.org Summary January 2008 Climate Summary January was a mix bag of conditions, with an oscillatory pattern developing. We experienced phases of
November 2010 Climate Summary
 Ken Scheeringa (765) 494-8105 Dec 6, 2010 http://www.iclimate.org November 2010 Climate Summary Summary A four month drought in Indiana is collapsing as significant rain fell the final week of November.
2011 Year in Review TORNADOES
 2011 Year in Review The year 2011 had weather events that will be remembered for a long time. Two significant tornado outbreaks in April, widespread damage and power outages from Hurricane Irene in August
January 2012 Climate Summary
 Ken Scheeringa and Kayla Hudson Feb 6, 2012 (765) 494-8105 http://www.iclimate.org January 2012 Climate Summary Month Summary Where is winter? This question found its way into many conversations throughout
The hydrologic service area (HSA) for this office covers Central Kentucky and South Central Indiana.
 for this office covers Central Kentucky and South Central Indiana.") January 2012 February 13, 2012 An X inside this box indicates that no flooding occurred within this hydrologic service area. January 2012 continued the string of wet months this winter. Rainfall was generally
January 2012 February 13, 2012 An X inside this box indicates that no flooding occurred within this hydrologic service area. January 2012 continued the string of wet months this winter. Rainfall was generally
January 2006 Climate Summary
 Ashley Brooks (765) 494-6574 Feb 9, 2006 http://www.iclimate.org January 1-3 January 2006 Climate Summary Unseasonably warm conditions welcomed in the New Year with highs in the 40s across the northern
April 2013 Climate Summary
 Ken Scheeringa and Kayla Hudson May 6, 2013 (765) 494-8105 http://www.iclimate.org April 2013 Climate Summary Month Summary Temperatures bounced high and low this month, keeping Hoosiers guessing which
January 2013 Climate Summary
 Ken Scheeringa and Kayla Hudson Feb 7, 2013 (765) 494-8105 http://www.iclimate.org January 2013 Climate Summary Month Summary Winter or spring? January featured several dramatic swings in temperature and
May 2005 Climate Summary
 Ashley Brooks (765) 494-6574 Jun 7, 2005 http://iclimate.org May 2005 Climate Summary May 1-5 Early May was characterized by an upper-level trough that was in place over Indiana that brought in very cool
August 2013 Climate Summary
 Ken Scheeringa and Matt Price Sep 6, 2013 (765) 494-8105 http://www.iclimate.org August 2013 Climate Summary Month Summary August weather began cool and wet but became progressively warmer and drier through
The hydrologic service area (HSA) for this office covers Central Kentucky and South Central Indiana.
 for this office covers Central Kentucky and South Central Indiana.") MONTH YEAR January 2011 February 15, 2011 X An X inside this box indicates that no flooding occurred within this hydrologic service area. January 2011 was drier than normal in all locations in the area.
MONTH YEAR January 2011 February 15, 2011 X An X inside this box indicates that no flooding occurred within this hydrologic service area. January 2011 was drier than normal in all locations in the area.
NATIONAL WEATHER SERVICE
 January 2016 February 9, 2016 This was a dry month across the HSA despite one large and several smaller snowfalls. Most locations ended up 1-2 inches below normal for the month. The driest locations at
SIGNIFICANT EVENTS Severe Storms November 1994 January 1996 August 1998 and May 2000 March 2002 May 2002 Champaign County
 SIGNIFICANT EVENTS Severe Storms November 1994 On Nov. 1, 1994, high winds gusted over 60 mph at times across the northwest third of Ohio. The highest measured wind gust was 63 mph at Columbus Grove (Putnam).
NWS FORM E-5 U.S. DEPARTMENT OF COMMERCE I HYDRO SERVICE AREA NOAA, NATIONAL WEATHER SERVICE I Indianapolis, IN MONTHLY REPORT
 NWS FORM E-5 U.S. DEPARTMENT OF COMMERCE I HYDRO SERVICE AREA NOAA, NATIONAL WEATHER SERVICE I Indianapolis, IN. 1-------------------- MONTHLY REPORT OF RIVER AND FLOOD CONDITIONSI REPORT FOR I November
The Pennsylvania Observer
 The Pennsylvania Observer April 2, 2009 March 2009 Pennsylvania Weather Recap Prepared by Curt Harpster For the month of March the saying, In like a lion and out like a lamb really fit the pattern quite
September 2012 Climate Summary
 Ken Scheeringa and Kayla Hudson Oct 5, 2012 (765) 494-8105 http://www.iclimate.org September 2012 Climate Summary Month Summary Summer slipped away and it felt a lot more like autumn in Indiana this month
August 2015 Climate Summary
 Ken Scheeringa And Mary Rose Mangan Sep 4, 2015 (765) 494-8105 http://www.iclimate.org August 2015 Climate Summary Month Summary A very active wet summer weather pattern turned much calmer and drier in
2018 Year in Review for Central and Southeast Illinois By: Chris Geelhart, Meteorologist National Weather Service, Lincoln IL
 By: Chris Geelhart, Meteorologist National Weather Service, Lincoln IL While 2018 featured some significant out-of-season weather, including below zero temperatures in April and 90-degree highs in early
June 2010 Climate Summary
 Ken Scheeringa (765) 494-8105 Jul 6, 2010 http://www.iclimate.org June 2010 Climate Summary Summary Summer like heat and humidity arrived in Indiana on May 22 nd and dominated our weather scene nearly
June 2011 Climate Summary
 Ken Scheeringa (765) 494-8105 Jul 8, 2011 http://www.iclimate.org June 2011 Climate Summary Month Summary The abundance of extreme weather this year extended yet another month into June. This month has
October 2014 Climate Summary
 Ken Scheeringa And Matt Price Nov 10, 2014 (765) 494-8105 http://www.iclimate.org October 2014 Climate Summary Month Summary October featured a mix of weather. A very wet first half of the month evolved
April 2011 Climate Summary
 Ken Scheeringa (765) 494-8105 May 9, 2011 http://www.iclimate.org April 2011 Climate Summary Summary After somewhat of a respite in March Indiana weather ramped up with a vengeance in April. Extreme weather
March 2016 Climate Summary
 Ken Scheeringa And Andy Eggert Apr 8, 2016 (765) 494-8105 http://www.iclimate.org March 2016 Climate Summary Month Summary Count March as the 7 th month in a row that the state average temperature has
August 2017 Climate Summary
 Ken Scheeringa And Andy Eggert Sep 7, 2017 (765) 494-8105 http://www.iclimate.org August 2017 Climate Summary Month Summary The coolest August in 13 years featured long cool and warm spells, below normal
October 2012 Climate Summary
 Ken Scheeringa and Kayla Hudson Nov 8, 2012 (765) 494-8105 http://www.iclimate.org October 2012 Climate Summary Month Summary In a reversal from the hot and dry summer, cooler and wetter than normal conditions
January 2017 Climate Summary
 Ken Scheeringa And Andy Eggert Feb 8, 2017 (765) 494-8105 http://www.iclimate.org January 2017 Climate Summary Month Summary The warmest January in 11 years was nearly 4 F warmer than December 2016. An
November 2014 Climate Summary
 Ken Scheeringa And Matt Price Dec 10, 2014 (765) 494-8105 http://www.iclimate.org November 2014 Climate Summary Month Summary Unseasonable cold headlined the Indiana and national news in November. The
March 2009 Climate Summary
 Joseph Mays (765) 494-6574 Apr 1, 2009 http://www.iclimate.org Summary March 2009 Climate Summary March is in the books and it continued the trend of extreme weather we have experienced during the first
May 2015 Climate Summary
 Ken Scheeringa And Mary Rose Mangan Jun 8, 2015 (765) 494-8105 http://www.iclimate.org May 2015 Climate Summary Month Summary May was a very warm month. Rainfall averaged near normal but was distributed
The hydrologic service area (HSA) for this office covers Central Kentucky and South Central Indiana.
 for this office covers Central Kentucky and South Central Indiana.") NWS Form E-5 (04-2006) NATIONAL OCEANIC AND ATMOSPHERIC ADMINISTRATION (PRES. BY NWS Instruction 10-924) NATIONAL WEATHER SERVICE MONTHLY REPORT OF HYDROLOGIC CONDITIONS HYDROLOGIC SERVICE AREA (HSA) Louisville
NWS Form E-5 (04-2006) NATIONAL OCEANIC AND ATMOSPHERIC ADMINISTRATION (PRES. BY NWS Instruction 10-924) NATIONAL WEATHER SERVICE MONTHLY REPORT OF HYDROLOGIC CONDITIONS HYDROLOGIC SERVICE AREA (HSA) Louisville
Champaign-Urbana 1998 Annual Weather Summary
 Champaign-Urbana 1998 Annual Weather Summary ILLINOIS STATE WATER SURVEY Audrey Bryan, Weather Observer 2204 Griffith Dr. Champaign, IL 61820 wxobsrvr@sparc.sws.uiuc.edu The development of the El Nìno
Champaign-Urbana 2001 Annual Weather Summary
 Champaign-Urbana 2001 Annual Weather Summary ILLINOIS STATE WATER SURVEY 2204 Griffith Dr. Champaign, IL 61820 wxobsrvr@sws.uiuc.edu Maria Peters, Weather Observer January: After a cold and snowy December,
Hurricanes form over warm ocean water.
 KEY CONCEPT Low-pressure systems can become storms. BEFORE, you learned Moving air masses cause changes in weather A low-pressure system brings stormy weather NOW, you will learn How hurricanes develop
November 2015 Climate Summary
 Ken Scheeringa And Mary Rose Mangan Dec 8, 2015 (765) 494-8105 http://www.iclimate.org November 2015 Climate Summary Month Summary November was much warmer than normal while precipitation was very near
July 2010 Climate Summary
 Ken Scheeringa (765) 494-8105 Aug 4, 2010 http://www.iclimate.org July 2010 Climate Summary Summary The warm summer of 2010 continues. Daily state average temperatures were above normal on all but seven
New Hampshire State Climate Office Dr. Mary D. Stampone, State Climatologist
 New Hampshire State Climate Office Dr. Mary D. Stampone, State Climatologist University of New Hampshire c/o Department of Geography 73 Main Street Durham, NH 03824 Phone: 603-862-3136 Fax: 603-862-4362
The Pennsylvania Observer
 The Pennsylvania Observer January 5, 2009 December 2008 Pennsylvania Weather Recap The final month of 2008 was much wetter than average and a bit colder than normal. In spite of this combination, most
Flood warnings were issued for the Maumee, St. Marys, Blanchard, St. Joseph (Ohio), Tippecanoe, Tiffin, Eel and Wabash Rivers on the 30 th and 31 st.
, Tippecanoe, Tiffin, Eel and Wabash Rivers on the 30 th and 31 st.") NWS FORM E-5 U.S. DEPARTMENT OF COMMERCE HSA OFFICE: NOAA, NATIONAL WEATHER SERVICE MONTHLY REPORT OF RIVER AND FLOOD CONDITIONS DATE: TO: North Webster, IN REPORT FOR (MONTH &YEAR): January 2002 February
NWS FORM E-5 U.S. DEPARTMENT OF COMMERCE HSA OFFICE: NOAA, NATIONAL WEATHER SERVICE MONTHLY REPORT OF RIVER AND FLOOD CONDITIONS DATE: TO: North Webster, IN REPORT FOR (MONTH &YEAR): January 2002 February
May 2018 Climate Summary
 Ken Scheeringa and Andy Eggert Jun 7, 2018 (765) 494-8105 http://www.iclimate.org May 2018 Climate Summary Month Summary As the calendar turned from April to May temperatures flipped dramatically away
2012 Growing Season Weather Summary for North Dakota. Adnan Akyüz and Barbara A. Mullins Department of Soil Science October 30, 2012
 2012 Growing Season Weather Summary for North Dakota Adnan Akyüz and Barbara A. Mullins Department of Soil Science October 30, 2012 Introduction The 2012 growing season (the period from April through September)
Illinois Drought Update, December 1, 2005 DROUGHT RESPONSE TASK FORCE Illinois State Water Survey, Department of Natural Resources
 Illinois Drought Update, December 1, 2005 DROUGHT RESPONSE TASK FORCE Illinois State Water Survey, Department of Natural Resources For more drought information please go to http://www.sws.uiuc.edu/. SUMMARY.
W I N T E R STORM HAZARD DESCRIPTION
 W I N T E R STORM HAZARD DESCRIPTION... 1 LOCATION... 2 EXTENT... 2 HISTORICAL OCCURRENCES... 4 SIGNIFICANT PAST EVENTS... 4 PROBABILITY OF FUTURE EVENTS... 5 VULNERABILITY AND IMPACT... 5 HAZARD DESCRIPTION
May 2016 Volume 23 Number 5
 The Weather Wire May 2016 Volume 23 Number 5 Contents: Winter Summary Current Colorado and West-wide Snow Pack Drought Monitor April Summary/Statistics May Preview Snowfall Totals Winter Summary The Front
April 2016 Climate Summary
 Ken Scheeringa And Andy Eggert May 9, 2016 (765) 494-8105 http://www.iclimate.org April 2016 Climate Summary Month Summary One month but two seasons. The first half of April was cold with snow. Wind damage
May 2016 Climate Summary
 Ken Scheeringa And Andy Eggert Jun 6, 2016 (765) 494-8105 http://www.iclimate.org May 2016 Climate Summary Month Summary Cold weather dominated in May until the last week of the month. May began wet but
April 2015 Climate Summary
 Ken Scheeringa And Mary Rose Mangan May 8, 2015 http://www iclimate org April 2015 Climate Summary Month Summary April was a month of extremes. Severe weather erupted on 4 days of the first week with multiple
January 2018 Climate Summary
 Ken Scheeringa and Andy Eggert Feb 8, 2018 (765) 494-8105 http://www.iclimate.org January 2018 Climate Summary Month Summary January temperature swings were amazing. In the first few days arctic cold pushed
MONTHLY REPORT OF RIVER AND FLOOD CONDITIONS
 NWS FORM E-5 U.S. DEPARTMENT OF COMMERCE HSA OFFICE: NOAA, NATIONAL WEATHER SERVICE NWS Northern Indiana (IWX) REPORT FOR (MONTH&YEAR): January 2005 MONTHLY REPORT OF RIVER AND FLOOD CONDITIONS DATE: February
FLOOD/SCS EVENT, APRIL 28 MAY 4
 REPORT DATE: May 4, 2017 EVENT DATE: April 28-May 4, 2017 FLOOD/SCS EVENT, APRIL 28 MAY 4 Event Summary General Significant Flood Outlook. SOURCE: National Weather Service. A significant severe thunderstorm
Monthly Long Range Weather Commentary Issued: July 18, 2014 Steven A. Root, CCM, President/CEO
 Monthly Long Range Weather Commentary Issued: July 18, 2014 Steven A. Root, CCM, President/CEO sroot@weatherbank.com JUNE 2014 REVIEW Climate Highlights The Month in Review The average temperature for
Monthly Long Range Weather Commentary Issued: APRIL 18, 2017 Steven A. Root, CCM, Chief Analytics Officer, Sr. VP,
 Monthly Long Range Weather Commentary Issued: APRIL 18, 2017 Steven A. Root, CCM, Chief Analytics Officer, Sr. VP, sroot@weatherbank.com MARCH 2017 Climate Highlights The Month in Review The average contiguous
Hurricanes 1. Thunderclouds. cool, dry air falls. warm, moist air rises
 Hurricanes 1 Hurricanes are gigantic tropical storms that can be hundreds of kilometres wide. They bring along very strong winds and a lot of rainfall. They often cause flooding near the coasts and sea
July 2011 Climate Summary
 Ken Scheeringa (765) 494-8105 Aug 8, 2011 http://www.iclimate.org July 2011 Climate Summary Month Summary The upper atmospheric high pressure dome which baked the Texas area in heat and drought the past
Monthly Long Range Weather Commentary Issued: NOVEMBER 16, 2015 Steven A. Root, CCM, Chief Analytics Officer, Sr. VP, sales
 Monthly Long Range Weather Commentary Issued: NOVEMBER 16, 2015 Steven A. Root, CCM, Chief Analytics Officer, Sr. VP, sales sroot@weatherbank.com OCTOBER 2015 Climate Highlights The Month in Review The
The Pennsylvania Observer
 The Pennsylvania Observer October 1, 2015 September 2015 - Pennsylvania Weather Recap By: Quinn Lease The month of September will be remembered for its above normal temperatures and dry conditions that
The Pennsylvania Observer
 The Pennsylvania Observer December 2, 2015 November 2015 - Pennsylvania Weather Recap By: Anthny Chiavaroli This November was dry with above average temperatures across the state. Western PA saw some very
X An X inside this box indicates that no flooding occurred within this Hydrologic Service Area.
 NWS FORM E-5 U.S. DEPARTMENT OF COMMERCE HSA OFFICE: NOAA, NATIONAL WEATHER SERVICE MONTHLY REPORT OF RIVER AND FLOOD CONDITIONS DATE: TO: North Webster, IN REPORT FOR (MONTH &YEAR): January, 2003 February
Above normal temperatures and precipitation continue across the HSA
 NWS Form E-5 (PRES. BY NWS Instruction 10-924) MONTHLY REPORT OF HYDROLOGIC CONDITIONS HYDROLOGIC SERVICE AREA (HSA) MONTH YEAR TO: Hydrologic Information Center, W/OS31 NOAA s National Weather Service
January 25, Summary
 January 25, 2013 Summary Precipitation since the December 17, 2012, Drought Update has been slightly below average in parts of central and northern Illinois and above average in southern Illinois. Soil
The Weather Wire. Contents: Summer 2018 Outlook. Summer 2018 Outlook Drought Monitor May Summary/Statistics June Preview Rainfall Totals
 The Weather Wire June 2018 Volume 25 Number 6 Contents: Summer 2018 Outlook Drought Monitor May Summary/Statistics June Preview Rainfall Totals Summer 2018 Outlook June 1 st marked the first day of meteorological
July 2015 Climate Summary
 Ken Scheeringa And Mary Rose Mangan Aug 6, 2015 (765) 494-8105 http://www.iclimate.org July 2015 Climate Summary Month Summary Record setting rainfall in June persisted into the first three weeks of July.
NWS FORM E-5 U.S. DEPARTMENT OF COMMERCE HSA OFFICE:
 NWS FORM E-5 U.S. DEPARTMENT OF COMMERCE HSA OFFICE: NOAA, NATIONAL WEATHER SERVICE MONTHLY REPORT OF RIVER AND FLOOD CONDITIONS DATE: TO: North Webster, IN REPORT FOR (MONTH &YEAR): July 1998 August 5,
2015: A YEAR IN REVIEW F.S. ANSLOW
 2015: A YEAR IN REVIEW F.S. ANSLOW 1 INTRODUCTION Recently, three of the major centres for global climate monitoring determined with high confidence that 2015 was the warmest year on record, globally.
HAZARD DESCRIPTION... 1 LOCATION... 1 EXTENT... 1 HISTORICAL OCCURRENCES...
 WINTER STORM HAZARD DESCRIPTION... 1 LOCATION... 1 EXTENT... 1 HISTORICAL OCCURRENCES... 3 SIGNIFICANT PAST EVENTS... 4 PROBABILITY OF FUTURE EVENTS... 5 VULNERABILITY AND IMPACT... 5 Hazard Description
MARYLAND/DC COCORAHS Volume 1, Issue 3 June 2009
 MARYLAND/DC COCORAHS Volume 1, Issue 3 June 2009 More on Cleaning Your Rain Gauge One of our observers, Stan (MD-MG-52) has had success in cleaning with a 10 pct solution of bleach with water and that
National Situation Report As of 5:00 a.m. EDT Tuesday, April 4, 2017
 Overview National Situation Report As of 5:00 a.m. EDT Tuesday, April 4, 2017 Table Of Contents Current Operations Monitoring Recovery National Response Coordination Center: Not Activated National Watch
October 2017 Climate Summary
 Ken Scheeringa and Andy Eggert Nov 6, 2017 (765) 494-8105 http://www.iclimate.org October 2017 Climate Summary Month Summary After more than three weeks of warm temperatures October turned suddenly cold
The weather in Iceland 2012
 The Icelandic Meteorological Office Climate summary 2012 published 9.1.2013 The weather in Iceland 2012 Climate summary Sunset in Reykjavík 24th April 2012 at 21:42. View towards west from the balcony
Arizona Climate Summary September 2014 Summary of conditions for August 2014
 Arizona Climate Summary September 2014 Summary of conditions for August 2014 August 2014 Temperature and Precipitation Summary August 1 st 16 th : The first 5 days of August were quite wet with high pressure
February 2017 Climate Summary
 Ken Scheeringa And Andy Eggert Mar 9, 2017 (765) 494-8105 http://www.iclimate.org February 2017 Climate Summary Month Summary February 2017 was the warmest February in Indiana since state climate records
Hurricane Matthew Threats and Impacts Briefing for Eastern NC
 Hurricane Matthew Threats and Impacts Briefing for Eastern NC October 6 th, 2016 Date/Time Created: 10/6/2016, Noon EDT National Weather Service Newport/Morehead City, NC Hurricane Matthew Key Points Changes
Weather and Climate Summary and Forecast November 2017 Report
 Weather and Climate Summary and Forecast November 2017 Report Gregory V. Jones Linfield College November 7, 2017 Summary: October was relatively cool and wet north, while warm and very dry south. Dry conditions
How strong does wind have to be to topple a garbage can?
 How strong does wind have to be to topple a garbage can? Imagine winds powerful enough to pick up a truck and toss it the length of a football field. Winds of this extreme sometimes happen in a tornado.
KANSAS CLIMATE SUMMARY February 2015
 KANSAS CLIMATE SUMMARY February 2015 Extended Cold Despite some record warm readings at a few locations, February was characterized by colder than normal conditions. This was particularly true during the
Ch. 3: Weather Patterns
 Ch. 3: Weather Patterns Sect. 1: Air Mass & Fronts Sect. 2: Storms Sect. 3: Predicting the Weather Sect. 4: Weather forecasters use advanced technologies Ch. 3 Weather Fronts and Storms Objective(s) 7.E.1.3
INDIANAPOLIS, INDIANA
 The NWS FORM E-5 U.S. DEPARTMENT OF COMMERCE HYDROLOGIC SERVICE AREA: NATIONAL OCEANIC AND ATMOSPHERIC ADMINISTRATION NATIONAL WEATHER SERVICE INDIANAPOLIS, INDIANA REPORT FOR: MONTHLY REPORT OF RIVER
The Pennsylvania Observer
 The Pennsylvania Observer August 3, 2015 July 2015 - Pennsylvania Weather Recap By: Arthur Person Although this seventh month of 2015 was fairly normal across Pennsylvania as a whole, the details reveal
Weekly Weather Flash. January 22 February 4. US This Week: Cold Weather Continues in the West; Storm Brings Rain to the East Coast
 January 22 February 4 Weekly Weather Flash US This Week: Cold Weather Continues in the West; Storm Brings Rain to the East Coast A Look Ahead: The East Chills; Western Storms Return Europe This Week: Cold
A summary of the weather year based on data from the Zumwalt weather station
 ZUMWALT PRAIRIE WEATHER 2016 A summary of the weather year based on data from the Zumwalt weather station Figure 1. An unusual summer storm on July 10, 2016 brought the second-largest precipitation day
April 2017 Climate Summary
 Ken Scheeringa And Andy Eggert May 8, 2017 (765) 494-8105 http://www.iclimate.org April 2017 Climate Summary Month Summary April was a very warm and wet month in Indiana, nearly setting a new monthly temperature
NATIONAL WEATHER SERVICE
 NWS Form E-5 (PRES. BY NWS Instruction 10-924) MONTHLY REPORT OF HYDROLOGIC CONDITIONS HYDROLOGIC SERVICE AREA (HSA) MONTH YEAR TO: Hydrologic Information Center, W/OS31 NOAA s National Weather Service
KANSAS CLIMATE SUMMARY May 2018
 KANSAS CLIMATE SUMMARY May 2018 From Cold to Hot May came close to setting the record as the hottest since 1895. The state-wide average temperature for the month was 70.6 o F. This was 7.2 degrees warmer
The Pennsylvania Observer
 The Pennsylvania Observer May 31, 2012 May 2012 - Pennsylvania Weather Recap By: Paul Knight The majority of the fifth month had temperatures averaging well above seasonal levels with two distinct hot
Jim Witt Long Range Calendar
 Jim Witt Long Range Calendar 2012-2013 November 2012 Toll Free 1-0-287-03 Studio Line (207) 9- Generally 20 40 50 60 70 0 Generally Cloudy, Cool Change Of Rain Or Wet Snow (Heavy) Changing To Rain 1 120
September 2016 Climate Summary
 Ken Scheeringa And Andy Eggert Oct 6, 2016 (765) 494-8105 http://www.iclimate.org September 2016 Climate Summary Month Summary The warmest September in 77 years brought alternating weeks of dry and wet
Climate versus Weather
 Climate versus Weather What is climate? Climate is the average weather usually taken over a 30-year time period for a particular region and time period. Climate is not the same as weather, but rather,
KANSAS CLIMATE SUMMARY October 2016
 KANSAS CLIMATE SUMMARY October 2016 Record warmth Temperatures continued the warmer than normal pattern through much of October. The state-wide average temperature was 60.9 of, or 5.6 degrees warmer than
March 2012 Climate Summary
 Ken Scheeringa and Kayla Hudson Apr 4, 2012 (765) 494-8105 http://www.iclimate.org March 2012 Climate Summary Month Summary March was a month of weather extremes with records shattered almost as a daily
Monthly Long Range Weather Commentary Issued: SEPTEMBER 19, 2016 Steven A. Root, CCM, Chief Analytics Officer, Sr. VP,
 Monthly Long Range Weather Commentary Issued: SEPTEMBER 19, 2016 Steven A. Root, CCM, Chief Analytics Officer, Sr. VP, sroot@weatherbank.com SEPTEMBER 2016 Climate Highlights The Month in Review The contiguous
CoCoRaHS. Community Collaborative Rain, Hail, & Snow Network. Ashley Wolf Meteorologist NWS Green Bay Northeast Wisconsin CoCoRaHS Coordinator
 CoCoRaHS Community Collaborative Rain, Hail, & Snow Network Ashley Wolf Meteorologist NWS Green Bay Northeast Wisconsin CoCoRaHS Coordinator What is CoCoRaHS Who, What, Where and Whys of CoCoRaHS What?
U.S. DEPARTMENT OF COMMERCE NOAA, NATIONAL WEATHER SERVICE
 NWS FORM E-5 U.S. DEPARTMENT OF COMMERCE NOAA, NATIONAL WEATHER SERVICE MONTHLY REPORT OF RIVER AND FLOOD CONDITIONS TO: NATIONAL WEATHER SERVICE HYDROMETEOROLOGICAL INFO CENTER, W/OS31 SSMC 2 Room 13468
Monthly Long Range Weather Commentary Issued: APRIL 1, 2015 Steven A. Root, CCM, President/CEO
 Monthly Long Range Weather Commentary Issued: APRIL 1, 2015 Steven A. Root, CCM, President/CEO sroot@weatherbank.com FEBRUARY 2015 Climate Highlights The Month in Review The February contiguous U.S. temperature