March 2016 Climate Summary
|
|
|
- Bartholomew Smith
- 5 years ago
- Views:
Transcription

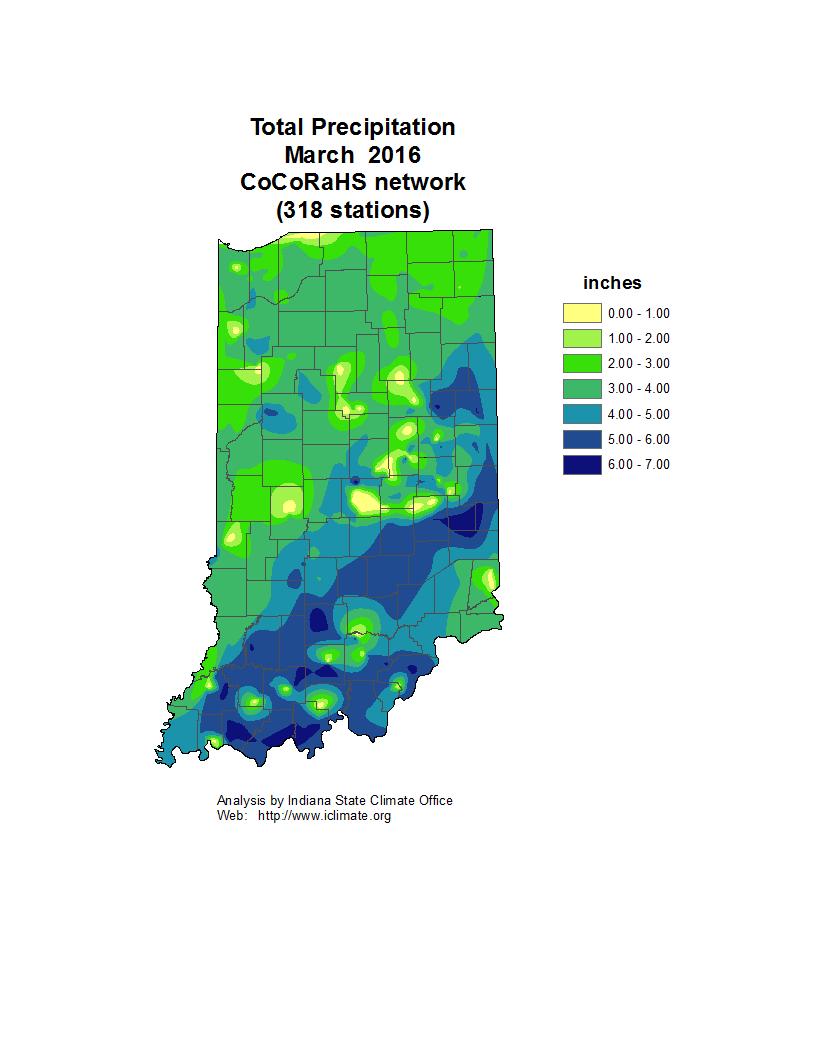
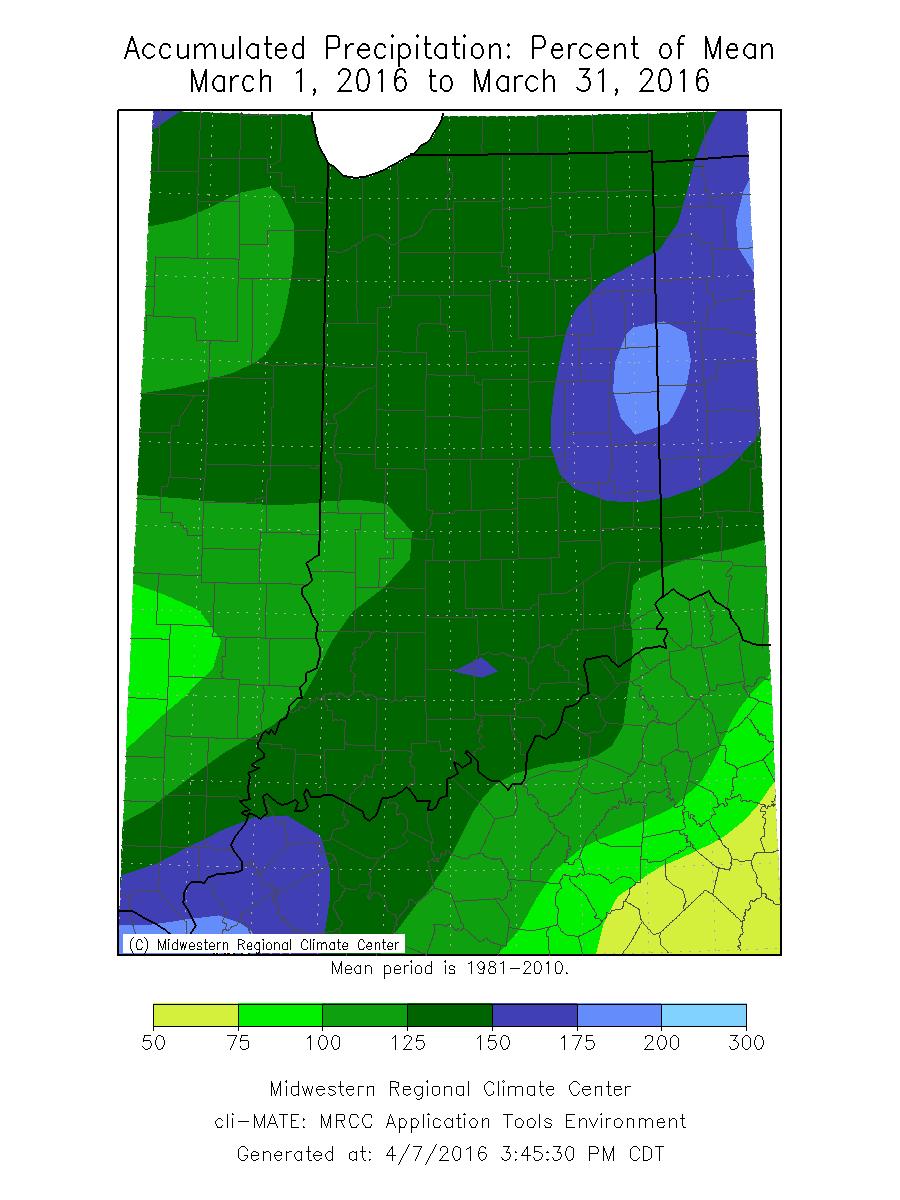
1 Ken Scheeringa And Andy Eggert Apr 8, 2016 (765) March 2016 Climate Summary Month Summary Count March as the 7 th month in a row that the state average temperature has exceeded normal, assisted by El Nino and this month the Maya Express. March was wetter than normal with 4 severe weather days. Four confirmed tornadoes, two EF-0 storms on March 24 th and two EF-1 a week later, caused damage but no injury or death. Wind and hail damage was noted on 2 additional days. The March 2016 state average temperature of 47.1 F was much above normal. Its 6.4 F deviation was the largest this year so far and marks the 6 th warmest March since 1895 in Indiana. Only one other March since 2000 has been warmer which was also the warmest March on record. This occurred 4 years ago when March 2012 posted an average 55.0 F Indiana state temperature. The day split in March 2016 was 9 days of below normal temperature, 21 days above normal, and 1 day at normal. There were 13 days when the state temperature was at least 10 F above normal and 2 days at least 20 F or more above normal. The highest temperature of the month was 82 F recorded on March 15 th and 16 th in several cities. The lowest temperature was 4 F at Wanatah 2wnw on March 4 th. The state precipitation average was 4.54 in March. This is 1.14 above normal and ties 1927 as the 26 th wettest March on record. Recent wetter Marches include a 5.14 state average in 2006, the 15 th wettest March, and 6.48 in 2008, good for the 8 th spot. The wettest March since 1895 was recorded during the Great 1913 Flood with an 8.74 state average precipitation. The highest single day precipitation among cooperative stations in March 2016 was 3.80 observed the last day of the month in Marengo. The most among CoCoRaHS stations was 2.00 on March 25 th at station Indianapolis 9.5 ne. The highest monthly precipitation in the cooperative network was 8.75 tallied at Marengo. In the CoCoRaHS network the highest monthly total was 7.52 noted at Paoli 1.6 sse. Widespread precipitation fell on about 14 days this month. Regionally March 2016 precipitation was near 130% of normal in northern and southern Indiana and about 140% of normal in central areas. Normal March precipitation ranges from 2.7 in the northeast to 4.2 in southwest Indiana. The highest monthly snow total in the cooperative network was 8.3 at Plymouth. In the CoCoRaHS network the largest was 7.9 at Walkerton 5.7 ene. The highest daily snowfall in the cooperative network was 4.2 recorded on March 3 rd at North Webster. A 4.8 daily amount was noted a day earlier at Granger 2.9 w in the CoCoRaHS network. There were about 4 days when snow generally fell statewide.
2 March 1 st 10 th Following a cold start to the month the state temperature soared well above normal after March 5 th. The state average temperature jumped 31 F in just 7 days from the coldest to the warmest day! A low pressure system in the upper atmosphere near Alaska exploded in intensity as it dove south into central Mexico. With help from the Bermuda ridge the two systems joined forces to transport tropical heat and moisture northward from the Gulf of Mexico toward Michigan, jump starting spring in Indiana. March began with a stationary front located over central Indiana. The state average temperature was 2 F above normal. The next day an Illinois storm raced to New York, dragging a cold front through Indiana to the Atlantic coast. Skies cleared as high pressure and colder air moved in, dropping the state temperature to 8 F below normal. The ridge drifted east to the Appalachians on March 3 rd. Two stationary fronts set up south of Indiana, their moisture overrunning the fronts as a mix of rain and snow. The state temperature rose slightly to 6 F below normal. A weak cold front behind this storm passed through Indiana the next day with no temperature change. Indiana was now encircled by weak fronts on all sides. On March 5 th the weak fronts were collected by a North Dakota storm into a single stronger occluded low pressure system over Illinois. High pressure over North Carolina started a backflow of warmer air to Indiana ahead of this storm, allowing the state temperature to rise slightly to 3 F below normal. On March 6 th high pressure moved out of the Great Plains to Indiana, chasing fronts out of the state. The state temperature began its remarkable ascent, starting at 3 F above normal. The next day the Indiana ridge traveled east to the Carolinas. Storm centers over the Dakotas slowed down, and in tandem with the Carolina ridge, set up a dominant warm air sector over the east part of the country. Temperatures over Indiana now warmed rapidly to 12 F above normal. By March 8 th the Carolina ridge had merged into the Bermuda ridge in the Atlantic, rotating the Dakota stationary front far northward into Michigan. The Dakota system s cold front settled into Kansas, reinforcing the very strong sector of warm air over Indiana and the east half of the country. Indiana temperatures that day surged to 22 F above normal. The Indiana warmth peaked on March 9 th with a state temperature at 23 F above normal. The warm sector now reached into Quebec although its western edge had eroded eastward to the Mississippi River. The warm air sector continued to erode on March 10 th. A cold front had reached Indiana that morning and temperatures began to fall. The state temperature ended the 10 day interval at 17 F above normal with moderate rainfall. The warm second half of the 10 day interval outdid the cold first half. Over the 10 days the state temperature averaged to 6 F above normal. Typically at the start of March daily maximum temperatures should range from about 42 F in far northern Indiana to 52 F in extreme southwest counties. Daily minimums normally vary between 25 F and 32 F north to south across the state. The warmest temperature of the 10 days in the cooperative station network was 75 at multiple locations on March 8 th and 9 th. The coolest temperature among stations in that same network was 4 F at Wanatah 2wnw on March 4 th.
3 Precipitation opened the month as rain, changed over to snow by March 3 rd, then back to all rain on March 6 th. It was a wet interval as precipitation was observed on 9 of 10 days with the heaviest amounts near the beginning and end. Snow was recorded in parts of Indiana between March 2 nd and 5 th. The heaviest snow was measured on March 2 nd when 4.8 was noted just west of Granger. Two days later 4.4 was collected outside Columbia City while 4.0 was captured in gages at Warsaw, Syracuse, and Tipton. Among the most snow tallied over the 10 day interval was 7.9 near Walkerton, 7.5 at Syracuse, and 7.1 near Plymouth. In the state snow map generally the north half of Indiana received snow this week trending heaviest into north central and northeast counties. The heaviest precipitation day was March 10 th. In CoCoRaHS reports that morning Tell City had 1.50 while three Newburgh volunteers had 1.47, 1.40, and Chandler nearby had Overall for the 10 days Francisco had the most precipitation with Leopold recorded 1.96, Straughn 1.95, while 1.90 fell in the vicinity of Columbus. The Rushville observer had On the state total precipitation map more than an inch fell generally south of a Vincennes to Portland line with less than a half inch along the Illinois border. Regionally about 0.8 was tallied across northern Indiana, 1.3 in central sections, and 1.6 in southern Indiana. These amounts equate to about 80% of normal in the north, and 130% of normal across central and southern Indiana. March 11 th 17 th An intense low pressure system in the upper atmosphere had plunged unusually far south into Mexico by the start of this week. The east side of this storm pumped tropical warmth and moisture north to Indiana, dubbed the Maya Express atmospheric river. The storm resulted in a wet and unusually warm first half of the week across the state. No snow fell in Indiana this week but isolated hail storms were reported in two counties on March 15 th. On March 11 th high pressure over Michigan helped clear Indiana skies. A stationary front over Tennessee extended from a south Texas storm related to the deep Mexico low pressure system. The Indiana state temperature stood at 10 F above normal, the coolest day of the week. The Michigan
4 high scampered east moving off the Atlantic coast the next day. An intensifying Canadian storm reached Hudson Bay and dragged a cold front into Wisconsin. The Indiana state temperature nudged to 11 F above normal. Two fronts crowded the state on March 13 th. The stationary front drifted to southern Indiana while the Canadian front edged just north of the state. Warmer air entered from the south and lifted the state temperature to 14 F above normal. The cold front washed out the next day allowing the stationary front to continue wafting into northern Indiana. The state temperature lifted to 16 F above normal. The stationary front disappeared from the map on March 15 th as warm air dominated the region. The state temperature peaked at 18 F above normal. A cold front in the Great Plains outlined a large warm sir sector over the east half of the country, including Indiana. The core of this system moved to Wisconsin the next day while its Great Plains cold front swept south and around past the core into Ohio. The Indiana state temperature began to fall to 15 F above normal as colder air began to enter the state. The week came to a close as the storm core left the region traveling northeast on March 17 th. A ridge in the Plains stretched eastward into Indiana, clearing skies once again as cooler air was transported into the state. The week concluded with the state temperature at 11 F above normal. Overall for the week the state temperature averaged to 14 F above normal. Typically at this point in March the daily maximum temperature should range between 46 F and 56 F north to south across the state. The daily minimum normally will vary from 28 F in far northern Indiana to 35 F in the extreme southwest corner of the state. The warmest temperature of the week among cooperative network stations was 82 F at several locations on March 15 th and 16 th. The coolest temperature in this same network was 28 F at South Bend Michiana Airport on March 11 th and at Angola on March 12 th. Rain fell every day this week somewhere in Indiana. The heaviest and most widespread amounts were reported on March 13 th and 14 th. On March 13 th two CoCoRaHS volunteers in Jeffersonville measured 1.81 and In Cannelton 1.38 was noted. The next day at the opposite end of the state an observer near San Pierre collected 1.40 there. Over the 7 days total rainfall at Jeffersonville came to 3.02 while Seymour had In the vicinity of New Pekin 2.56 fell. The gages near Celestine and Richmond each summed to On the state map totals exceeding 3 were isolated to the vicinities of Jeffersonville, Seymour, and Tell City. Generally more than 2 fell across south central Indiana. Less than an inch was noted in parts of west central and northeast Indiana. Regionally about 1.1 was received across northern Indiana, 1.3 in central areas, and 1.7 in southern Indiana. These totals equate to about 200% of normal in the north and 190% of normal in central and southern Indiana. Isolated severe weather was reported in Indiana on March 15 th. One inch diameter hail was reported in Newton county and radar indicated 1 hail in Clark county.
5 March 18 th 24 th The temperature roller coaster March is famous for continued as the second half of the month got underway. The first half of this week cooled from above to slightly below normal temperatures then rebounded to end the week much warmer. Unlike the month so far rainfall was light and a few days were even dry. Two EF-0 tornadoes were confirmed in Laporte county on March 24 th while widespread straight line wind damage was reported in St. Joseph county. The state average temperature stood at 5 F above normal on March 18 th. A cold front swept through Indiana from the northwest. A second cold front was right behind the first but rapidly weakened the next day into a trough which slowly made its way south across the state. Cooler air did enter Indiana to drop the state temperature to normal. The trough crossed the Ohio River early on March 20 th. The state temperature fell to 3 F below normal, marking the coldest day of the week. A ridge left the Great Plains the next day and moved into Louisiana. A return flow of warm air from behind the ridge into Indiana began a warmup that would continue the rest of the week. The state temperature nudged up a degree for the day. On March 22 nd the ridge drifted east to Georgia. The Indiana warmup accelerated as the state temperature rose to 7 F above normal. Two stationary fronts approached Indiana from the northwest. The next day these two fronts merged over northern Indiana and stalled there. The state temperature continued rising to 10 F above normal. The merged front marked the boundary between two strong high pressure centers: the Bermuda ridge off the Florida coast which had absorbed the Georgia ridge, and the other in Manitoba. On March 24 th the Manitoba high center traveled due east across Canada. The Bermuda ridge moved little, prompting a sector of very warm air to set up across the southeast quarter of the country. Indiana lie within this warm sector, bounded by the stationary front just to its north and a cold front advancing through Missouri and Arkansas. It was a windy day across Indiana as the state temperature peaked at 13 F above normal, the warmest day of the week. Overall for the week the Indiana state temperature averaged to 4 F above normal. Usually at this point in March the daily maximum temperature should range between 49 F in far northern counties to 59 F in far southwest Indiana. Daily minimums normally vary from 30 F to 37 F north to south
6 across the state. The warmest temperature of the week among cooperative network stations was 72 F at Myers Lock and Dam on March 18 th. The coolest temperature among stations in this same network was 20 F at Kokomo 3 wsw on March 20 th. Rainfall was far below normal this week. CoCoRaHS observers reported precipitation in their morning reports of March 19 th, 20 th, 21 st, and 24 th with amounts generally between a quarter and half inch each day. The weekly state rain map showed more than an inch in Vigo and Sullivan counties along the Illinois border but generally less than 0.25 in most of northern and central Indiana. Regionally about 0.2 was noted across northern Indiana, 0.1 in central, and 0.4 in the south. These amounts equate to about 30% of normal in the north, 20% in central counties, and about 40% of normal in southern Indiana. The largest single day amounts were measured the morning of March 24 th. Within the CoCoRaHS network this included 1.12 at Hobart, 1.10 in Castleton, 0.98 in the vicinity of West Terre Haute, and 0.84 near Goshen. For the week the heaviest totals were 1.10 in Castleton, 0.66 at Hebron, 0.61 in Paoli, and 0.60 near Hazleton. Two confirmed EF-0 tornadoes touched down within minutes of each other in the early afternoon of March 24 th in Laporte county. The first tornado touched down for 0.1 mile just southeast of Wanatah. The tornado tore 80% of the roof off a large pole barn with winds estimated up to 85 mph. There were no injuries or deaths and no other significant damage. A second tornado was on the ground for 0.9 mile about 3 miles northeast of Hanna. This tornado caused extensive damage to a grove of trees and tore down power lines. There was also straight line wind damage to a farm just southeast of the tornado path. No injuries or deaths were reported. Between North Liberty and South Bend straight line winds estimated to 70 mph uprooted numerous trees and damaged power lines and the roof of a building. There were several reports of wind damage in South Bend. Many power poles were leaning and at risk of falling on roadways. Windows were blown out of store fronts. There was damage to a garage and its siding and a roof was blown off another building. Large trees and limbs had blown over and yanked down power lines, knocking out power to some neighborhoods. Bleachers were also blown over. In North Liberty there was damage to a roof and other small structures. A tree blocked a trail in Crumstown.
7 March 25 th 31 st Temperatures fluctuated above and below normal this last week of March. Moderate precipitation fell about every third day making for a much wetter than normal week. Light snow accumulations were reported in northwest Indiana on March 25 th while rain fell statewide on March 28 th and 31 st. Wind and hail damage struck the southeast half of the state on Easter evening, March 27 th. Two EF-1 tornadoes touched down in Tippecanoe and Wabash counties on the last day of the month. Wind and hail damage was scattered north to south across the state that day. High pressure over Missouri was tracking east to Indiana as March 25 th began. The state temperature was slightly cool at 2 F below normal. The high center had moved into Pennsylvania the next day, setting up a warm air return flow behind it. The Indiana state temperature responded by rising to 3 F above normal. A long stationary front was located in the Great Plains from Minnesota and Texas. On March 27 th the southern part of this front transitioned into a cold front which pivoted southeast around the Minnesota low center into Illinois. Severe weather broke out in Indiana ahead of the cold front. The state temperature reached 8 F above normal. The Minnesota low center moved into Michigan on March 28 th. Its cold front raced through and beyond Indiana. The state temperature dropped to 1 F below normal as cooler air took over. The old cold front continued far off into the Atlantic Ocean the next day. A ridge in Ontario dove south into Indiana, transporting in the coldest air of the week at 4 F below normal. The core of the ridge drifted east to Delaware on March 30 th, positioning Indiana inside a new warm sector that dominated the east half of the country. The state temperature rose to 3 F above normal. The western edge of the warm sir sector eroded away on March 31 st. A new cold front plunged south from Canada, slamming against another front which marked the edge of the warm air sector. Severe weather erupted again in Indiana as 2 tornadoes, wind gusts, and hail damaged property into the evening of March 31 st. The state temperature that day closed March at 8 F above normal. Overall for the week the state temperature averaged to 2 F above normal. Usually by the end of March the daily maximum temperature should range between 52 F and 61 F north to south across Indiana. Daily minimums normally vary from 32 F in the far northern areas of the state to 39 F in the southwest corner. The warmest temperature of the week among cooperative network stations
8 was 78 F at Boonville 1s on March 27 th and at French Lick 3n on March 29 th. The coolest temperature within this same network was 23 F at Brookville on March 26 th and at South Bend Airport on March 29 th. The last measureable snow of the month was recorded the morning of March 25 th. Up to a half inch was observed in Porter and Laporte counties for the day and week, including 0.5 in the vicinity of Chesterton and in Hanna. In the cities of Laporte and Porter 0.4 was tallied. Rain fell often this final week on 5 days: March 25 th, 26 th, 28 th, 29 th, and 31 st. Of these dates rain amounts were significant on March 25 th, 28 th, and 31 st and were observed statewide on the latter two dates. The heaviest single day amounts in the CoCoRaHS network occurred on March 25 th with 2.39 and 2.00 in two gages just to the north of Indianapolis with 1.53 in Hartford City. In the March 28 th morning reports 1.73 was seen in Anderson and 1.70 near Portland. For the week 4.29 was summed just to the north of Indianapolis while 3.39 was collected at Hartford City. Anderson had 3.10 and Spencer totaled On the weekly precipitation map generally more than 2 fell along a southwest to northeast line from Boonville to Fort Wayne, correlating with the area of severe weather damage. More than 3 was locally embedded within this 2 band. Much of the state had more than 1.5 for the week except in the southeast corner and in the northern tier of counties which recorded less. Regionally about 1.7 was measured across the northern third of Indiana, 1.9 in central counties, and 1.8 across the south. These sums equate to about 230% of normal across the north, 220% of normal in the central area, and 170% of normal in southern Indiana. Large hail developed in thunderstorms that were widespread across the southeast half of Indiana on Easter Sunday. Hail stones between 1.0 and 1.5 hit many counties late in the day, including Allen, Huntington, Adams, Randolph, Madison, Hamilton, Marion, Hancock, Johnson, Morgan, Monroe, Clay, Daviess, and Dubois counties. Hail diameter sizes to 1.75 were reported in Wells and Orange counties. About 1700 people lost electrical power due to storm damage in Hamilton county. Wind gusts tore off a gas station roof in Orange county while power lines fell in Clark county. Only tree and branch damage was reported in Wayne, Fayette, and Greene counties. Wind speeds peaked to 60 mph. Another round of severe weather developed 4 days later on March 31 st. Tornado touchdowns were confirmed in Tippecanoe and Wabash counties. In Tippecanoe county an EF-1 tornado with 100 mph winds damaged a construction trailer manufacturer storage lot in Lafayette late in the afternoon. The tornado path length was about 50 yards. A guard shack was damaged, two trailers were tossed on their sides, and a car flipped upside down in the large storage lot. Some building roofs were damaged and trees downed in nearby areas. No injuries were reported. The tornado was confirmed through on site video surveillance. In Wabash county a confirmed EF-1 tornado with 105 mph winds touched down at about 6 pm a few miles northwest of the city of Wabash and remained on the ground for about 0.75 mile. This tornado completely destroyed an old small farm outbuilding, then tore some of the roofing off a nearby pole barn. A mobile home was moved 4 off its cinder block foundation. Several trees were snapped about 4 above ground. The pole barn debris was thrown about 0.25 mile away. Later the tornado ripped off a home porch roof and tossed around a sturdy wooden playground set. Several
9 more trees were snapped and small limbs were driven into the ground. Finally the tornado snapped 3 utility poles. Earlier on the afternoon of March 31 st wind gusts to 61 mph partly collapsed the roof of a county government building in St Joseph county. This allowed water to badly damage a judge chamber reception area. There were no injuries due to the roof collapse. In Noble county a microburst with winds to 75 mph damaged several mobile homes and barns. Seven trees were blown down in Miami county. In Shelby county 2 trees were downed across a highway. A tree fell and blocked a roadway in Clark county as well. Only 2 reports of one inch diameter hail were received for the day, one from Porter county and the second in Monroe county.
10 March 2016 Temperature Region Temperature Normal Deviation Northwest North Central Northeast West Central Central East Central Southwest South Central Southeast State Precipitation Region Precipitation Normal Deviation Percent of Normal Northwest North Central Northeast West Central Central East Central Southwest South Central Southeast State
11 Spring so far (same as March) Temperature Region Temperature Normal Deviation Northwest North Central Northeast West Central Central East Central Southwest South Central Southeast State Precipitation Region Precipitation Normal Deviation Percent of Normal Northwest North Central Northeast West Central Central East Central Southwest South Central Southeast State
12 2016 Annual so far (Jan - Mar) Temperature Region Temperature Normal Deviation Northwest North Central Northeast West Central Central East Central Southwest South Central Southeast State Precipitation Region Precipitation Normal Deviation Percent of Normal Northwest North Central Northeast West Central Central East Central Southwest South Central Southeast State
13
14
15
16

17 Drought Summary from the U.S. Drought Monitor Below is a drought summary for the state of Indiana from the U.S. Drought Monitor. Areas in white are not experiencing any drought. Yellow areas are abnormally dry, but not considered a drought. Drought begins when the moisture levels become more severe, with beige, orange, red, and brown indicating increasing levels of drought (moderate, severe, extreme, and exceptional, respectively). The table below indicates what percentage of the state is drought free, and how much of the state is in drought by degree of severity (D1 - D4 category).
18 March 1 st Drought Summary
19 March 8 th Drought Summary
20 March 15 th Drought Summary
21 March 22 nd Drought Summary
22 March 29 th Drought Summary
October 2011 Climate Summary
 Ken Scheeringa and Kayla Hudson Nov 4, 2011 http://www.iclimate.org October 2011 Climate Summary Month Summary October weather evolved as a two part story. Weather conditions the first half of the month
May 2016 Climate Summary
 Ken Scheeringa And Andy Eggert Jun 6, 2016 (765) 494-8105 http://www.iclimate.org May 2016 Climate Summary Month Summary Cold weather dominated in May until the last week of the month. May began wet but
April 2016 Climate Summary
 Ken Scheeringa And Andy Eggert May 9, 2016 (765) 494-8105 http://www.iclimate.org April 2016 Climate Summary Month Summary One month but two seasons. The first half of April was cold with snow. Wind damage
August 2017 Climate Summary
 Ken Scheeringa And Andy Eggert Sep 7, 2017 (765) 494-8105 http://www.iclimate.org August 2017 Climate Summary Month Summary The coolest August in 13 years featured long cool and warm spells, below normal
January 2017 Climate Summary
 Ken Scheeringa And Andy Eggert Feb 8, 2017 (765) 494-8105 http://www.iclimate.org January 2017 Climate Summary Month Summary The warmest January in 11 years was nearly 4 F warmer than December 2016. An
December 2011 Climate Summary
 Ken Scheeringa and Kayla Hudson Jan 17, 2012 (765) 494-8105 http://www.iclimate.org December 2011 Climate Summary Month Summary What a difference a year makes! A year ago the misery of a harsh, cold, and
July 2007 Climate Summary
 Dan Bowman (765) 494-6574 Sep 3, 2007 http://www.iclimate.org Summary July 2007 Climate Summary The month of July ended as a very unusual month. Many events occurred during the month of July that is not
September 2011 Climate Summary
 Ken Scheeringa and Kayla Hudson Oct 5, 2011 (765) 494-8105 http://www.iclimate.org September 2011 Climate Summary Month Summary The final blast of summer heat arrived at the start of September. It lasted
August 2006 Summary. August 1-5
 Ashley Brooks (765) 494-6574 Sep 8, 2006 http://www.iclimate.org August 1-5 August 2006 Summary The heat wave that started during the end of July continued into the beginning parts of August with temperatures
October 2014 Climate Summary
 Ken Scheeringa And Matt Price Nov 10, 2014 (765) 494-8105 http://www.iclimate.org October 2014 Climate Summary Month Summary October featured a mix of weather. A very wet first half of the month evolved
March 2014 Climate Summary
 Ken Scheeringa And Matt Price Apr 8, 2014 (765) 494-8105 http://www.iclimate.org March 2014 Climate Summary Month Summary Winter had officially ended by the calendar but snow and cold persisted in Indiana
May 2018 Climate Summary
 Ken Scheeringa and Andy Eggert Jun 7, 2018 (765) 494-8105 http://www.iclimate.org May 2018 Climate Summary Month Summary As the calendar turned from April to May temperatures flipped dramatically away
February 2017 Climate Summary
 Ken Scheeringa And Andy Eggert Mar 9, 2017 (765) 494-8105 http://www.iclimate.org February 2017 Climate Summary Month Summary February 2017 was the warmest February in Indiana since state climate records
January 2012 Climate Summary
 Ken Scheeringa and Kayla Hudson Feb 6, 2012 (765) 494-8105 http://www.iclimate.org January 2012 Climate Summary Month Summary Where is winter? This question found its way into many conversations throughout
August 2015 Climate Summary
 Ken Scheeringa And Mary Rose Mangan Sep 4, 2015 (765) 494-8105 http://www.iclimate.org August 2015 Climate Summary Month Summary A very active wet summer weather pattern turned much calmer and drier in
April 2017 Climate Summary
 Ken Scheeringa And Andy Eggert May 8, 2017 (765) 494-8105 http://www.iclimate.org April 2017 Climate Summary Month Summary April was a very warm and wet month in Indiana, nearly setting a new monthly temperature
March 2018 Climate Summary
 Ken Scheeringa and Andy Eggert Apr 5, 2018 (765) 494-8105 http://www.iclimate.org March 2018 Climate Summary Month Summary March turned cold with below normal temperatures on two-thirds of its days. Along
June 2016 Climate Summary
 Ken Scheeringa And Andy Eggert Jul 8, 2016 (765) 494-8105 http://www.iclimate.org June 2016 Climate Summary Month Summary June was a warm month with below normal temperature on just 6 days. Rainfall was
August 2013 Climate Summary
 Ken Scheeringa and Matt Price Sep 6, 2013 (765) 494-8105 http://www.iclimate.org August 2013 Climate Summary Month Summary August weather began cool and wet but became progressively warmer and drier through
October 2017 Climate Summary
 Ken Scheeringa and Andy Eggert Nov 6, 2017 (765) 494-8105 http://www.iclimate.org October 2017 Climate Summary Month Summary After more than three weeks of warm temperatures October turned suddenly cold
September 2016 Climate Summary
 Ken Scheeringa And Andy Eggert Oct 6, 2016 (765) 494-8105 http://www.iclimate.org September 2016 Climate Summary Month Summary The warmest September in 77 years brought alternating weeks of dry and wet
November 2012 Climate Summary
 Ken Scheeringa and Kayla Hudson Dec 6, 2012 (765) 494-8105 http://www.iclimate.org November 2012 Climate Summary Month Summary November was one of those rare weather months in Indiana when not much happened:
May 2015 Climate Summary
 Ken Scheeringa And Mary Rose Mangan Jun 8, 2015 (765) 494-8105 http://www.iclimate.org May 2015 Climate Summary Month Summary May was a very warm month. Rainfall averaged near normal but was distributed
January 2018 Climate Summary
 Ken Scheeringa and Andy Eggert Feb 8, 2018 (765) 494-8105 http://www.iclimate.org January 2018 Climate Summary Month Summary January temperature swings were amazing. In the first few days arctic cold pushed
April 2015 Climate Summary
 Ken Scheeringa And Mary Rose Mangan May 8, 2015 http://www iclimate org April 2015 Climate Summary Month Summary April was a month of extremes. Severe weather erupted on 4 days of the first week with multiple
September 2005 Climate Summary
 Ashley Brooks (765) 494-6574 Oct 5, 2005 http://iclimate.org September 2005 Climate Summary September 1-7 A cold front came through on the 1 st of the month, however little moisture was associated with
January 2008 Climate Summary
 Joseph Mays (765) 494-6574 Feb 5, 2008 http://www.iclimate.org Summary January 2008 Climate Summary January was a mix bag of conditions, with an oscillatory pattern developing. We experienced phases of
July 2010 Climate Summary
 Ken Scheeringa (765) 494-8105 Aug 4, 2010 http://www.iclimate.org July 2010 Climate Summary Summary The warm summer of 2010 continues. Daily state average temperatures were above normal on all but seven
October 2016 Climate Summary
 Ken Scheeringa And Andy Eggert Nov 9, 2016 (765) 494-8105 http://www.iclimate.org October 2016 Climate Summary Month Summary October was the 9 th month so far this year to average above normal in temperature.
November 2017 Climate Summary
 Ken Scheeringa and Andy Eggert Dec 8, 2017 (765) 494-8105 http://www.iclimate.org November 2017 Climate Summary Month Summary November temperatures alternated spells of warm and cool while precipitation
November 2010 Climate Summary
 Ken Scheeringa (765) 494-8105 Dec 6, 2010 http://www.iclimate.org November 2010 Climate Summary Summary A four month drought in Indiana is collapsing as significant rain fell the final week of November.
June 2011 Climate Summary
 Ken Scheeringa (765) 494-8105 Jul 8, 2011 http://www.iclimate.org June 2011 Climate Summary Month Summary The abundance of extreme weather this year extended yet another month into June. This month has
Monthly Long Range Weather Commentary Issued: APRIL 18, 2017 Steven A. Root, CCM, Chief Analytics Officer, Sr. VP,
 Monthly Long Range Weather Commentary Issued: APRIL 18, 2017 Steven A. Root, CCM, Chief Analytics Officer, Sr. VP, sroot@weatherbank.com MARCH 2017 Climate Highlights The Month in Review The average contiguous
April 2013 Climate Summary
 Ken Scheeringa and Kayla Hudson May 6, 2013 (765) 494-8105 http://www.iclimate.org April 2013 Climate Summary Month Summary Temperatures bounced high and low this month, keeping Hoosiers guessing which
January 2006 Climate Summary
 Ashley Brooks (765) 494-6574 Feb 9, 2006 http://www.iclimate.org January 1-3 January 2006 Climate Summary Unseasonably warm conditions welcomed in the New Year with highs in the 40s across the northern
November 2015 Climate Summary
 Ken Scheeringa And Mary Rose Mangan Dec 8, 2015 (765) 494-8105 http://www.iclimate.org November 2015 Climate Summary Month Summary November was much warmer than normal while precipitation was very near
August 2016 Climate Summary
 Ken Scheeringa And Andy Eggert Sep 12, 2016 (765) 494-8105 http://www.iclimate.org August 2016 Climate Summary Month Summary Hot but tranquil weather the first half of August transitioned to a tormented
November 2014 Climate Summary
 Ken Scheeringa And Matt Price Dec 10, 2014 (765) 494-8105 http://www.iclimate.org November 2014 Climate Summary Month Summary Unseasonable cold headlined the Indiana and national news in November. The
May 2005 Climate Summary
 Ashley Brooks (765) 494-6574 Jun 7, 2005 http://iclimate.org May 2005 Climate Summary May 1-5 Early May was characterized by an upper-level trough that was in place over Indiana that brought in very cool
June 2010 Climate Summary
 Ken Scheeringa (765) 494-8105 Jul 6, 2010 http://www.iclimate.org June 2010 Climate Summary Summary Summer like heat and humidity arrived in Indiana on May 22 nd and dominated our weather scene nearly
February 2016 Climate Summary
 Ken Scheeringa And Andy Eggert Mar 9, 2016 (765) 494-8105 http://www.iclimate.org February 2016 Climate Summary Month Summary February was the 6 th consecutive month with an above normal state average
March 2009 Climate Summary
 Joseph Mays (765) 494-6574 Apr 1, 2009 http://www.iclimate.org Summary March 2009 Climate Summary March is in the books and it continued the trend of extreme weather we have experienced during the first
2011 Year in Review TORNADOES
 2011 Year in Review The year 2011 had weather events that will be remembered for a long time. Two significant tornado outbreaks in April, widespread damage and power outages from Hurricane Irene in August
Champaign-Urbana 2001 Annual Weather Summary
 Champaign-Urbana 2001 Annual Weather Summary ILLINOIS STATE WATER SURVEY 2204 Griffith Dr. Champaign, IL 61820 wxobsrvr@sws.uiuc.edu Maria Peters, Weather Observer January: After a cold and snowy December,
Monthly Long Range Weather Commentary Issued: SEPTEMBER 19, 2016 Steven A. Root, CCM, Chief Analytics Officer, Sr. VP,
 Monthly Long Range Weather Commentary Issued: SEPTEMBER 19, 2016 Steven A. Root, CCM, Chief Analytics Officer, Sr. VP, sroot@weatherbank.com SEPTEMBER 2016 Climate Highlights The Month in Review The contiguous
January 2013 Climate Summary
 Ken Scheeringa and Kayla Hudson Feb 7, 2013 (765) 494-8105 http://www.iclimate.org January 2013 Climate Summary Month Summary Winter or spring? January featured several dramatic swings in temperature and
Champaign-Urbana 1998 Annual Weather Summary
 Champaign-Urbana 1998 Annual Weather Summary ILLINOIS STATE WATER SURVEY Audrey Bryan, Weather Observer 2204 Griffith Dr. Champaign, IL 61820 wxobsrvr@sparc.sws.uiuc.edu The development of the El Nìno
April 2011 Climate Summary
 Ken Scheeringa (765) 494-8105 May 9, 2011 http://www.iclimate.org April 2011 Climate Summary Summary After somewhat of a respite in March Indiana weather ramped up with a vengeance in April. Extreme weather
November 2016 Climate Summary
 Ken Scheeringa And Andy Eggert Dec 15, 2016 (765) 494-8105 http://www.iclimate.org November 2016 Climate Summary Month Summary Unseasonably warm, pleasant, and sunny weather the first half of the month
July 2014 Climate Summary
 Ken Scheeringa And Matt Price Aug 8, 2014 (765) 494-8105 http://www.iclimate.org July 2014 Climate Summary Month Summary July was unseasonably cool and drier than normal. Rainfall was light in parts of
October 2012 Climate Summary
 Ken Scheeringa and Kayla Hudson Nov 8, 2012 (765) 494-8105 http://www.iclimate.org October 2012 Climate Summary Month Summary In a reversal from the hot and dry summer, cooler and wetter than normal conditions
Monthly Long Range Weather Commentary Issued: July 18, 2014 Steven A. Root, CCM, President/CEO
 Monthly Long Range Weather Commentary Issued: July 18, 2014 Steven A. Root, CCM, President/CEO sroot@weatherbank.com JUNE 2014 REVIEW Climate Highlights The Month in Review The average temperature for
SIGNIFICANT EVENTS Severe Storms November 1994 January 1996 August 1998 and May 2000 March 2002 May 2002 Champaign County
 SIGNIFICANT EVENTS Severe Storms November 1994 On Nov. 1, 1994, high winds gusted over 60 mph at times across the northwest third of Ohio. The highest measured wind gust was 63 mph at Columbus Grove (Putnam).
NWS FORM E-5 U.S. DEPARTMENT OF COMMERCE HSA OFFICE:
 NWS FORM E-5 U.S. DEPARTMENT OF COMMERCE HSA OFFICE: NOAA, NATIONAL WEATHER SERVICE MONTHLY REPORT OF RIVER AND FLOOD CONDITIONS DATE: TO: North Webster, IN REPORT FOR (MONTH &YEAR): July 1998 August 5,
September 2012 Climate Summary
 Ken Scheeringa and Kayla Hudson Oct 5, 2012 (765) 494-8105 http://www.iclimate.org September 2012 Climate Summary Month Summary Summer slipped away and it felt a lot more like autumn in Indiana this month
July 2011 Climate Summary
 Ken Scheeringa (765) 494-8105 Aug 8, 2011 http://www.iclimate.org July 2011 Climate Summary Month Summary The upper atmospheric high pressure dome which baked the Texas area in heat and drought the past
Champaign-Urbana 1999 Annual Weather Summary
 Champaign-Urbana 1999 Annual Weather Summary ILLINOIS STATE WATER SURVEY 2204 Griffith Dr. Champaign, IL 61820 wxobsrvr@sws.uiuc.edu Maria Peters, Weather Observer A major snowstorm kicked off the new
2018 Year in Review for Central and Southeast Illinois By: Chris Geelhart, Meteorologist National Weather Service, Lincoln IL
 By: Chris Geelhart, Meteorologist National Weather Service, Lincoln IL While 2018 featured some significant out-of-season weather, including below zero temperatures in April and 90-degree highs in early
March 2011 Climate Summary
 Ken Scheeringa (765) 494-8105 Apr 5, 2011 http://www.iclimate.org March 2011 Climate Summary Summary The fast paced weather action of February slowed some in March. The major March weather features were
NWS FORM E-5 U.S. DEPARTMENT OF COMMERCE I HYDRO SERVICE AREA NOAA, NATIONAL WEATHER SERVICE I Indianapolis, IN MONTHLY REPORT
 NWS FORM E-5 U.S. DEPARTMENT OF COMMERCE I HYDRO SERVICE AREA NOAA, NATIONAL WEATHER SERVICE I Indianapolis, IN. 1-------------------- MONTHLY REPORT OF RIVER AND FLOOD CONDITIONSI REPORT FOR I November
The Pennsylvania Observer
 The Pennsylvania Observer April 2, 2009 March 2009 Pennsylvania Weather Recap Prepared by Curt Harpster For the month of March the saying, In like a lion and out like a lamb really fit the pattern quite
March 2012 Climate Summary
 Ken Scheeringa and Kayla Hudson Apr 4, 2012 (765) 494-8105 http://www.iclimate.org March 2012 Climate Summary Month Summary March was a month of weather extremes with records shattered almost as a daily
SEPTEMBER 2013 REVIEW
 Monthly Long Range Weather Commentary Issued: October 21, 2013 Steven A. Root, CCM, President/CEO sroot@weatherbank.com SEPTEMBER 2013 REVIEW Climate Highlights The Month in Review The average temperature
Monthly Long Range Weather Commentary Issued: APRIL 25, 2016 Steven A. Root, CCM, Chief Analytics Officer, Sr. VP, sales
 Monthly Long Range Weather Commentary Issued: APRIL 25, 2016 Steven A. Root, CCM, Chief Analytics Officer, Sr. VP, sales sroot@weatherbank.com MARCH 2016 Climate Highlights The Month in Review The March
KANSAS CLIMATE SUMMARY May 2018
 KANSAS CLIMATE SUMMARY May 2018 From Cold to Hot May came close to setting the record as the hottest since 1895. The state-wide average temperature for the month was 70.6 o F. This was 7.2 degrees warmer
Monthly Long Range Weather Commentary Issued: May 15, 2014 Steven A. Root, CCM, President/CEO
 Monthly Long Range Weather Commentary Issued: May 15, 2014 Steven A. Root, CCM, President/CEO sroot@weatherbank.com APRIL 2014 REVIEW Climate Highlights The Month in Review The average temperature for
Weather and Climate Summary and Forecast Summer 2017
 Weather and Climate Summary and Forecast Summer 2017 Gregory V. Jones Southern Oregon University August 4, 2017 July largely held true to forecast, although it ended with the start of one of the most extreme
June 2015 Climate Summary
 Ken Scheeringa And Mary Rose Mangan Jul 10, 2015 (765) 494-8105 http://www.iclimate.org June 2015 Climate Summary Month Summary Indiana set a new June rainfall record this month with a state average 8.99.
Monthly Long Range Weather Commentary Issued: NOVEMBER 16, 2015 Steven A. Root, CCM, Chief Analytics Officer, Sr. VP, sales
 Monthly Long Range Weather Commentary Issued: NOVEMBER 16, 2015 Steven A. Root, CCM, Chief Analytics Officer, Sr. VP, sales sroot@weatherbank.com OCTOBER 2015 Climate Highlights The Month in Review The
3 Severe Weather. Critical Thinking
 CHAPTER 2 3 Severe Weather SECTION Understanding Weather BEFORE YOU READ After you read this section, you should be able to answer these questions: What are some types of severe weather? How can you stay
The hydrologic service area (HSA) for this office covers Central Kentucky and South Central Indiana.
 for this office covers Central Kentucky and South Central Indiana.") January 2012 February 13, 2012 An X inside this box indicates that no flooding occurred within this hydrologic service area. January 2012 continued the string of wet months this winter. Rainfall was generally
January 2012 February 13, 2012 An X inside this box indicates that no flooding occurred within this hydrologic service area. January 2012 continued the string of wet months this winter. Rainfall was generally
Weather and Climate Summary and Forecast March 2018 Report
 Weather and Climate Summary and Forecast March 2018 Report Gregory V. Jones Linfield College March 7, 2018 Summary: The ridge pattern that brought drier and warmer conditions from December through most
X An X inside this box indicates that no flooding occurred within this Hydrologic Service Area.
 NWS FORM E-5 U.S. DEPARTMENT OF COMMERCE HSA OFFICE: NOAA, NATIONAL WEATHER SERVICE MONTHLY REPORT OF RIVER AND FLOOD CONDITIONS DATE: TO: North Webster, IN REPORT FOR (MONTH &YEAR): January, 2003 February
KANSAS CLIMATE SUMMARY October 2016
 KANSAS CLIMATE SUMMARY October 2016 Record warmth Temperatures continued the warmer than normal pattern through much of October. The state-wide average temperature was 60.9 of, or 5.6 degrees warmer than
Impacts of the April 2013 Mean trough over central North America
 Impacts of the April 2013 Mean trough over central North America By Richard H. Grumm National Weather Service State College, PA Abstract: The mean 500 hpa flow over North America featured a trough over
The Pennsylvania Observer
 The Pennsylvania Observer May 31, 2012 May 2012 - Pennsylvania Weather Recap By: Paul Knight The majority of the fifth month had temperatures averaging well above seasonal levels with two distinct hot
Weather and Climate Summary and Forecast Winter
 Weather and Climate Summary and Forecast Winter 2016-17 Gregory V. Jones Southern Oregon University February 7, 2017 What a difference from last year at this time. Temperatures in January and February
July 2015 Climate Summary
 Ken Scheeringa And Mary Rose Mangan Aug 6, 2015 (765) 494-8105 http://www.iclimate.org July 2015 Climate Summary Month Summary Record setting rainfall in June persisted into the first three weeks of July.
Severe Weather: Tornadoes and Hurricanes
 Severe Weather: Tornadoes and Hurricanes Tornadoes Grab Toto!! TORNADOES Are a low pressure storm that usually forms over land in an average year, 800 tornadoes are reported in the U.S. a tornado is defined
Weather and Climate Summary and Forecast December 2017 Report
 Weather and Climate Summary and Forecast December 2017 Report Gregory V. Jones Linfield College December 5, 2017 Summary: November was relatively cool and wet from central California throughout most of
Air Masses, Fronts, Storm Systems, and the Jet Stream
 Air Masses, Fronts, Storm Systems, and the Jet Stream Air Masses When a large bubble of air remains over a specific area of Earth long enough to take on the temperature and humidity characteristics of
KANSAS CLIMATE SUMMARY June 2017
 KANSAS CLIMATE SUMMARY June 2017 Uneven rainfall The wet May gave way to uneven rainfall in June. The statewide average precipitation was 3.23 inches or 74 percent of normal. The East Central and West
Monthly Long Range Weather Commentary Issued: February 15, 2015 Steven A. Root, CCM, President/CEO
 Monthly Long Range Weather Commentary Issued: February 15, 2015 Steven A. Root, CCM, President/CEO sroot@weatherbank.com JANUARY 2015 Climate Highlights The Month in Review During January, the average
KANSAS CLIMATE SUMMARY February 2015
 KANSAS CLIMATE SUMMARY February 2015 Extended Cold Despite some record warm readings at a few locations, February was characterized by colder than normal conditions. This was particularly true during the
The Weather Wire. Contents: Summer 2018 Outlook. Summer 2018 Outlook Drought Monitor May Summary/Statistics June Preview Rainfall Totals
 The Weather Wire June 2018 Volume 25 Number 6 Contents: Summer 2018 Outlook Drought Monitor May Summary/Statistics June Preview Rainfall Totals Summer 2018 Outlook June 1 st marked the first day of meteorological
Colorado CoCoRaHS. Colorado CoCoRaHS. Because Every Drop Counts! November 2014 Volume 2, Issue 11
 U.S. PRECIPITATION (% OF AVERAGE) LOOKING BACK AT OCTOBER 2014 October was a fairly dry month for much of the nation with the exception of the Pacific Northwest, portions of New England and the Tennessee
The Pennsylvania Observer
 The Pennsylvania Observer August 3, 2015 July 2015 - Pennsylvania Weather Recap By: Arthur Person Although this seventh month of 2015 was fairly normal across Pennsylvania as a whole, the details reveal
Monthly Long Range Weather Commentary Issued: APRIL 1, 2015 Steven A. Root, CCM, President/CEO
 Monthly Long Range Weather Commentary Issued: APRIL 1, 2015 Steven A. Root, CCM, President/CEO sroot@weatherbank.com FEBRUARY 2015 Climate Highlights The Month in Review The February contiguous U.S. temperature
KANSAS CLIMATE SUMMARY January 2018
 KANSAS CLIMATE SUMMARY January 2018 Some welcome moisture After an extended period with little to no moisture, parts of Kansas recorded some significant precipitation. At Tribune, a small snow event on
KANSAS CLIMATE SUMMARY April 2017
 KANSAS CLIMATE SUMMARY April 2017 Epic Blizzard While much of the month was warmer than normal, the last week brought a return to cold, wintery weather in the western third of the state, and cold rainy
October 2010 Climate Summary
 Ken Scheeringa (765) 494-8105 Nov 5, 2010 http://www.iclimate.org October 2010 Climate Summary Summary Rain fell on about 10 days in October but did little to slow the drought raging across Indiana. For
2012 Growing Season Weather Summary for North Dakota. Adnan Akyüz and Barbara A. Mullins Department of Soil Science October 30, 2012
 2012 Growing Season Weather Summary for North Dakota Adnan Akyüz and Barbara A. Mullins Department of Soil Science October 30, 2012 Introduction The 2012 growing season (the period from April through September)
Guided Notes Weather. Part 2: Meteorology Air Masses Fronts Weather Maps Storms Storm Preparation
 Guided Notes Weather Part 2: Meteorology Air Masses Fronts Weather Maps Storms Storm Preparation The map below shows North America and its surrounding bodies of water. Country borders are shown. On the
Weather and Climate Summary and Forecast August 2018 Report
 Weather and Climate Summary and Forecast August 2018 Report Gregory V. Jones Linfield College August 5, 2018 Summary: July 2018 will likely go down as one of the top five warmest July s on record for many
The Pennsylvania Observer
 The Pennsylvania Observer September 3, 2008 Summer 2008 Weather Summary Written by: Brian Thompson The opening days of June started dry, but a warm front brought a widespread rain a couple of days into
National Wildland Significant Fire Potential Outlook
 National Wildland Significant Fire Potential Outlook National Interagency Fire Center Predictive Services Issued: April 1, 2008 Next Issue: May 1, 2008 Wildland Fire Outlook April 2008 through July 2008
KANSAS CLIMATE SUMMARY June 2018
 KANSAS CLIMATE SUMMARY June 2018 Continued Heat While the heat wasn t as dramatic as in May, June still came in as the 7 th warmest since 1895. The statewide average for the month was 77.9 o F. This was
KANSAS CLIMATE SUMMARY March 2018
 KANSAS CLIMATE SUMMARY March 2018 Another Dry Month The Southwest Division again missed out on most of the precipitation during March. State-wide the average precipitation was 0.97 inches or 41 percent
MIAMI-SOUTH FLORIDA National Weather Service Forecast Office
 MIAMI-SOUTH FLORIDA National Weather Service Forecast Office http://www.weather.gov/miami June 2015 South Florida Weather Summary Dry East, Wet West...Drought Remains SE Florida July 3, 2015: Depending
Arizona Climate Summary February 2012
 Arizona Climate Summary February 2012 Summary of conditions for January 2012 January 2012 Temperature and Precipitation Summary January 1 st 20 th : The New Year has started on a very dry note. The La