February 2017 Climate Summary
|
|
|
- Heather Peters
- 6 years ago
- Views:
Transcription

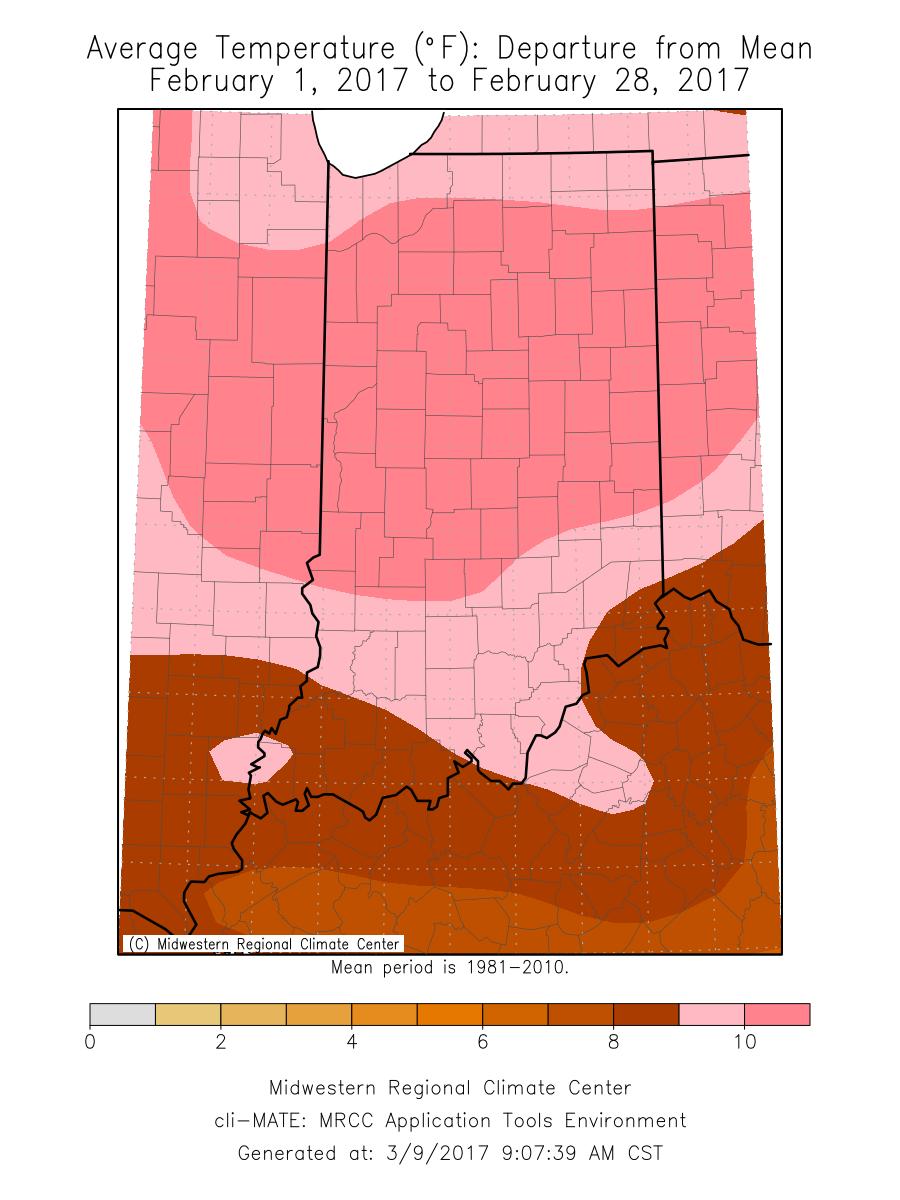
1 Ken Scheeringa And Andy Eggert Mar 9, 2017 (765) February 2017 Climate Summary Month Summary February 2017 was the warmest February in Indiana since state climate records began in Like January the month had long spells of warm weather and low snowfall totals. But unlike the prior month February was quite dry, allowing the return of abnormally dry soils to southern Indiana according to the US Drought Monitor. Local damage due to lightning occurred on February 7 th and widespread severe weather took place on February 24 th and 28 th. An EF-3 tornado in Posey and Gibson county at the end of the month destroyed several buildings and debris forced the closure of 8 miles of I-64. The severe weather event was ongoing as March arrived. Details of March 1 st damage will appear in the next edition of this climate summary. The February state average temperature of 41.0 F was extraordinary, 10.6 F above normal and easily surpassing 1998 as the warmest February on record. Some recent warm Februaries could include last year at 33.9 F, tied with 1961 as 26 th warmest. February 2012 had a 35.4 F average, tied with 1915 for 16 th place. A 36.7 F state average in 2000 was the 10 th warmest February on record. The day split in February 2017 was 6 days of below normal temperature, 22 days above normal, and no days at normal. There were 15 days when the state mean temperature was at least 10 F above normal and 4 days at least 20 F above normal. The highest temperature of the month was 79 F on February 24 th at the Evansville Airport and the coolest was 1 F on February 10 th at Chalmers 5w. February state precipitation averaged 1.32 which is 0.96 below normal. This ranks the month in a tie with 1972 as the 23 rd driest February on record. The most recent drier February recorded a 0.83 state average precipitation in 2004, tying 1934 as the 9 th driest February. There have been no Februaries since 2000 which have been drier than this. The driest February on record had a meager 0.31 state average precipitation in The heaviest single day precipitation among cooperative network stations in February 2017 was 1.78 recorded on February 28 th at the South Bend Michiana Airport. The highest in the CoCoRaHS network was 1.98 on February 8 th at Angola 4.1n. The largest month total precipitation in the cooperative network was 3.65, again at the South Bend airport. In the CoCoRaHS network the heaviest was 2.79 also at Angola 4.1n. Widespread precipitation fell on about 8 days this month. The greatest daily snowfall reported in the cooperative network was 4.5 on February 9 th at Chalmers 5w and at Marion 2n. In the CoCoRaHS network 5.0 was measured the same day at LaFountaine 1.1nw. Over the full month 4.8 was the highest total measured at Marion 2n in the cooperative station network while 6.3 was summed by the CoCoRaHS volunteer at Hartford City 0.2nnw. Overall it snowed on about 1 day statewide in February. Regionally February 2017
2 precipitation totaled to near normal across northern Indiana and 45% of normal in central and southern counties. Normal February precipitation ranges from 1.7 in northwest Indiana to 2.9 in the south central part of the state. February 1 st 7 th This winter is becoming known for its frequently wild and wide-ranging temperatures. February so far has followed this trend. After a few days of subnormal temperatures unseasonable warmth came roaring back to end the week more than 20 F above normal! Light snow and rain were recorded in far northern Indiana on February 1 st. Rain alone was noted the next day and in thunderstorms on February 7 th. Lightning with these storms struck a high school in White county and caused extensive electrical system damage. On February 1 st Indiana was positioned between two fronts: a stationary front over Tennessee and a cold front sweeping south into Michigan. The Indiana state temperature began the month at 9 F above normal. Light snow fell locally in far northeastern counties with rain in the lake effect region to the west. The cold front passed through Indiana the next morning. A cold Alberta ridge spread southeast to Indiana, driving the state temperature downward to 1 F below normal. This subnormal average ended the warm spell that began last month at 23 days. The Alberta ridge spread to Virginia by February 3 rd, its return flow winds slowing and reversing the recent cold front. The retreating front stalled over Lake Superior. Indiana temperatures dipped another degree under clearing skies to 2 F below normal, the coldest day of the week. By the next day the ridge had claimed the eastern half of the country, centered over Kentucky. Indiana remained cold, sunny, and dry with a steady average temperature at 2 F below normal. On February 5 th the Kentucky high weakened and slipped to Georgia. Indiana winds turned southwest behind the high center and helped begin a strong warmup that would continue to the end of the week. The state temperature rose to 7 F above normal. A weak cold front headed into northern Illinois. The next day the new cold front lost its momentum and halted over central Indiana. The state temperature soared to 18 F above normal as the stalled cold front evolved into a warm front. On February 7 th a storm system zipped east from Colorado to Illinois, steering the halted warm front from central to northern Indiana. With the storm s cold front stretched between Missouri and Oklahoma, a warm sector wedge formed over Indiana. Inside this warm sector the state temperature continued to climb to 22 F above normal, the warmest day of the week. With the cold start followed by an intense warmup the Indiana state temperature averaged to 7 F above normal for the week. Usually in the first week of February the daily maximum temperature should range between 32 F and 43 F north to south across the state. Daily minimums typically vary from 18 F in far northern Indiana to 25 F in the southwest corner of the state. The warmest temperature among cooperative network stations this week was 67 F at Franklin wwtp on February 7 th. The coolest temperature among stations in this same network was 2 F at Shakamak State Park on February 4 th. On the weekly precipitation map more than 0.75 fell generally along the Michigan and Ohio borders, from Porter to Wells to Franklin counties. Less than about 0.1 was measured from Boone

3 county to Hendricks and Putnam counties. Precipitation was also light in Daviess and parts of Gibson counties. Elsewhere around Indiana about a 0.5 total was common. Amounts generally trended lighter progressing southward. Regionally about 0.6 of precipitation fell across northern Indiana, 0.4 in central, and 0.3 in the south. These amounts equate to about 150% of normal in northern counties, about 70% in central Indiana, and 40% of normal in southern Indiana. The highest single day precipitation was noted on February 7 th when the CoCoRaHS observer in Russiaville caught Near Columbia City 1.23 was measured. The Craigville volunteer had 1.19 while 1.11 fell near Warsaw. At Bremen 1.05 was collected. It only rained one day in several places this week. Ossian had 1.01, Porter noted 0.91, and outside South Bend 0.85 was tallied. Snowfall amounts were minor this week. Near Hudson 0.4 was seen on February 1 st and outside Middlebury a 0.01 dusting was recorded. A few of the February 7 th thunderstorms became severe. Lightning struck North White High School and damaged parts of the electrical system, especially the air conditioning and fire alarm systems. With no power the school was closed until repairs could be made and the safety systems retested. February 8 th 14 th Winter weather returned briefly to start this week but then it was quickly back to spring. The daily state temperature was below normal on just one day. It was a very wet week in northern Indiana but precipitation was below normal in central and southern Indiana. Snowfall was recorded on February 8 th and 9 th while rain was noted on February 8 th, 12 th, and 14 th. A cold front had passed through Indiana early on the morning of February 8 th before slowing in Tennessee. The Indiana average temperature began at 11 F above normal but much colder air arrived from western Canada later in the day. Rain fell statewide with some snow in spots near Lake Michigan. Cold air continued pouring into Indiana the next day, driving down the state temperature to 3 F below normal, the coldest day of the week. Snow fell throughout Indiana except in the southwest. A high pressure ridge settled over the Midwest and forced the cold front off the mainland and along the coastline from Delaware to Texas.
4 On February 10 th the ridge traveled east from Missouri to Tennessee, setting up a warm backflow behind the ridge into Indiana. The state temperature responded with a rebound to 6 F above normal as skies cleared. The ridge moved well east of Florida the next day. A stationary front formed over northern Indiana extending from a low center over Kansas. The Indiana state temperature warmed again to 13 F above normal. The Kansas storm center pushed toward Ohio on February 12 th. The Indiana state temperature peaked at 19 F above normal as rain spread through northern and central Indiana. The stationary front now morphed into a cold front and reached the Ohio River as the storm exited Indiana. On February 13 th a strong ridge over the northern Rockies bubbled up a new high center over Missouri which dominated Midwest weather with sunny skies. The Ohio storm raced east far into the Atlantic and greatly intensified near Maine. The Midwest high center pumped colder air into Indiana. The state temperature dipped to 9 F above normal. The next day the Midwest high tracked southward but the Indiana state temperature didn t respond much. The week closed with the state temperature at 10 F above normal. Rain fell in the southwest corner of the state. Overall for the week the Indiana state temperature averaged to 9 F above normal. Typically by mid-february the daily maximum temperature should range between 34 F in far northern counties to 45 F in the southwest corner of the state. Daily minimums normally vary between 20 F and 26 F north to south across the state. The warmest daily temperature this week among stations in the cooperative network was 71 F at Shoals 8s on February 12 th. The coolest temperature among stations in this same network was 1 F at Chalmers 5w on February 10 th. On the precipitation map the heaviest weekly total was 1.5 to 2.2 in the northeast corner of the state. Generally the northern third of the state had at least 0.7 while 0.5 to 0.7 was observed in west central areas and in south central counties along the Ohio River. The least precipitation fell in a southwest to northeast band from Posey to Wayne counties where about 0.2 fell. There was a strong trend this week from heavier precipitation in northeast Indiana to much less in central and southern regions. Regionally an average 0.6 of precipitation was measured in northern Indiana, and 0.3 in central and southern sections. These amounts equate to about 190% of normal in northern Indiana, 70% in central, and 50% of normal across the south. The heaviest single day precipitation amounts were all measured in northeast Indiana on February 8 th. On that day 1.98 and 1.49 were collected in the vicinity of Angola while two spots in Lagrange had 1.74 and Outside Orland 1.49 was recorded there. For the week the two Angola stations summed to 2.14 and Near Hudson 1.64 was tallied while North Webster had 1.40 and Granger A heavy band of 3 to 5 snow fell mostly south of a Kentland to Fort Wayne line and north of a Lafayette to Winchester line. No snow was seen mostly south of a Vincennes to Louisville line. Elsewhere 0.1 to 1 was common. The heaviest single day snowfall was reported on February 9 th with 5.0 at LaFontaine, 4.8 and 4.5 at two sites in Hartford City, and 4.5 in the vicinities of Marion and Portland. Maximum weekly totals were the same as the heaviest February 9 th amounts and in the same locations.
5 February 15 th 21 st Temperatures persisted above normal all 7 days. Unseasonably warm temperatures began February 17 th. Maximum daily temperatures approached new February records at several locations as the thermometer soared. Little to no rain fell during the week statewide, capping week totals at less than 0.5. The very warm and dry conditions allowed for quick evaporation from topsoils, making way for the return of a USDM D0 rating along the Illinois border between Vigo and Posey counties. The warmth all but ended the feasibility of producing artificial snow, forcing Indiana ski resorts to cancel operations until colder weather returns. A strong cold front dove south from Hudson Bay through Indiana to Tennessee on February 15 th. The Indiana state temperature dropped to 5 F above normal. The next day the cold front split. A western stationary portion over North Dakota evolved into a new warm front while the east cold front portion accelerated to well off the Atlantic coast. A cool Canadian wind flow kept the Indiana daily average temperature lower at 4 F above normal, the coldest day of the week. February 17 th arrived and so did a strong warm front, boosting the Indiana temperature suddenly to 17 F above normal. The burst of warm air was pumped north by high pressure in the Gulf and overran Indiana. For the next 4 days Indiana was positioned inside of a strong warm air mass sector. On February 18 th a Canadian cold front barreled south toward Indiana but stalled over Lake Michigan. The front remained there stationary the next day. High pressure over Alabama and Kentucky countered the Lake Michigan front, preventing it from advancing. The Indiana daily average temperature held steady on both days at 18 F above normal, the warmest days of the week. The stationary front converted into a cold front on February 20 th but showed little movement. Meanwhile another cold front stretched from North Dakota to Texas, marking the west edge of the warm sector which was bounded on its north edge by the Lake Michigan front. The Indiana state daily temperature fell so slightly to 17 F above normal.
6 On February 21 st the warm sector began to collapse. The western cold front rushed east into Wisconsin, Illinois, and Oklahoma, squeezing the warm sector into a much smaller area. Indiana remained inside the warm sector with its state temperature holding at 17 F above normal. On no day was the state temperature below normal. Overall for the week the state temperature averaged to 14 F above normal. Typically in the third week of February the daily maximum temperature should range between 36 F and 47 F north to south across the state. Daily minimums normally vary from 21 F in far northern Indiana to 28 F in the southwest corner of the state. The warmest temperature among stations in the cooperative network this week was 75 F at Myers Lock & Dam on February 20 th and at Vincennes 5ne on February 21 st. The coolest temperature among stations in this same network was 17 F at Angola on February 17 th. Precipitation was scarce this week as Indiana spent much of the time within the warm sector. On average only a few hundredths of an inch of precipitation was measured statewide. This equates to about 5% of normal precipitation having fallen in northern and central Indiana and just 10% of normal across southern Indiana this week. Rainfall was recorded in Ohio River counties on February 19 th, in the southwest corner of the state on February 20 th, and in the far northwest on February 21st. The heaviest single day precipitation was observed on February 19 th when Evansville had 0.43, two Newburgh volunteers collected 0.43 and 0.38, and Cannelton and Santa Claus tallied The largest weekly precipitation totals included 0.38 at Newburgh, 0.32 at Santa Claus, 0.24 at Leopold, 0.15 at New Salisbury, and 0.14 at Milltown. Well below normal snowfall this month finally led to the shutdown of Paoli Peaks, a southern Indiana ski resort on February 22 nd. Managers suspended operations as it was not feasible to make snow when air temperatures were so warm. The resort had only measured a half inch of snow since January, making further operation impractical unless weather conditions changed. The near absence of precipitation and increased evaporation due to warmer temperatures in the southwest part of the state led the US Drought Monitor to reinstate its abnormally dry D0 rating. Effective with the February 21 st edition of the USDM, Vigo, Sullivan, Knox, Gibson, Pike, Posey, Vanderburgh, Warrick, and portions of Daviess, Greene, Clay, Vermillion, and Parke counties have been rated in the D0 category.
7 February 22 nd 28 th Near record to record warmth kicked off the week followed by a single day 26 F temperature plunge back to normal. The cool down was brief. Temperatures soared again to finish the month. Rain and snow over the 7 days accumulated to less than normal. The drier than normal trend this month with higher evaporation rates has left some Indiana soils abnormally dry. Accordingly the USDM map reintroduced the D0 category to central and southern Indiana to close out the month. Damaging winds and hail occurred in north central and southeast Indiana on February 24 th. Days later on the evening of February 28 th an EF-3 tornado roared through Posey and Gibson counties. Reports of hail and wind damage also came in that evening. The storms rolled on through midnight when the calendar flipped to March. Severe weather intensified with extensive damage due to more tornadoes, hail, and wind evident when dawn appeared. An account of injuries and storm damage attributed to March will be continued in next month s narrative. Indiana temperatures were 20 F above normal on February 22 nd. The state was positioned inside a large warm air mass sector fed by a ridge off the Atlantic coast. A cold front which stretched from Wisconsin to Nebraska defined the west edge of the warm sector. The next day a low center moved to Lake Huron and dragged with it this cold front east to Michigan and Illinois, shrinking the warm sector to the west border of Indiana. Warm air flow from the Gulf intensified ahead of this front and nudged the Indiana state temperature up a tad to 21 F above normal. Low pressure rode up the cold front to Illinois on February 24 th, slowing it down. Indiana barely remained in the warm sector, hitting a peak state temperature of 25 F above normal, the warmest day of the week. When the low center moved north of Lake Huron the next day, its cold front raced east of Indiana, allowing much colder air to displace the warm sector. The state temperature dropped dramatically to 1 F below normal. The sudden change triggered severe weather in north central and southeast Indiana as cooler air poured into the state. On February 26 th the state temperature held at 1 F below normal. Meanwhile high pressure in Kansas traveled to Alabama. This enabled a backflow of warmer Gulf air toward Indiana to restart. The flow of warmer air intensified the next day when the Alabama high center drifted east off the Delaware coast. The Indiana state temperature responded by rising to 5 F above normal. On the last day of the month four low pressure systems approached Indiana from the north and west, drawing in a chaos of air masses with different temperatures, moisture content, and instability. The state temperature ramped up to 16 F above normal. Late in the day severe weather broke out in the Midwest which continued into the next morning. The week was dominated by record to near record heat with only a few days of near normal temperatures. Overall daily state temperatures averaged to 12 F above normal. Usually near the end of February daily maximum temperatures should vary from 38 F in far northern Indiana to 49 F in the southwest corner of the state. Daily minimums normally range between 23 F and 30 F
8 north to south across the state. The warmest temperature of the week in the cooperative station network was 79 F on February 24 th at Evansville Airport. The coolest of the week among stations in this same network was 16 F at Shoals 8s on February 26 th. Precipitation was a little below normal for the week. Regionally about 0.5 of precipitation was observed in northern Indiana, 0.4 in central, and 0.6 across the south. These amounts equate to about 90% of normal in the northern third of the state, 50% in central, and 80% of normal in southern Indiana. Snow was recorded on 2 days and rain on the other 5 days. Rain was observed statewide on February 25 th and 28 th. On the weekly snow map the heaviest total was near 1 in Blackford county. Up to 0.5 fell generally in Tippecanoe, Carroll, Clinton, Montgomery, Boone, Marion, Johnson, and Shelby counties in central Indiana. In northern Indiana less than a half inch was recorded in Steuben, Elkhart, Miami, St Joseph, Lagrange, and Porter counties. The heaviest single day local snowfall was at Hartford City where 1.5 was measured on February 26 th. About 0.5 and 0.6 was the heaviest single day amount at other locations. The weekly precipitation map showed 0.5 to 1.0 totals in north central and northeast counties and in the southeast corner of the state. In the southwest Owen, Lawrence, and Martin counties received up to an inch as did Franklin, Dearborn, Ripley, Switzerland, and Ohio counties in the southeast. Precipitation was quite light in far southwest counties and in Howard, Tipton, and Henry counties of central Indiana. The heaviest single day local precipitation was in the southeast where Osgood had 0.83, Hanover 0.81, and Batesville 0.66 as observed on February 25 th. The larger weekly totals included 1.26 near Osgood, 1.23 at Hanover, and 0.92 in Jeffersonville. Hail and wind damage was reported in north central and southeast Indiana on February 24 th. One inch diameter hail was observed in St Joseph and Elkhart county while just to the south high winds tore a shed down in Starke county. In neighboring Marshall county a swing set and trampoline were ripped apart at one home and trees damaged. In southeast Indiana power poles were toppled in Union county. A flag pole fell on to a vehicle in Decatur county while trees were downed in Dearborn county. One inch hail was reported in Franklin county. Severe weather late on February 28 th and early on March 1 st was widespread in northern and southern Indiana but not in central areas. Only storms which occurred on February 28 th are described below. An EF-3 tornado on the ground in Illinois crossed into Posey county late in the evening and traveled along I-64 for nearly 45 miles. Storm debris forced the interstate to close for 8 miles. The maximum wind speed was estimated at 152 mph. The tornado damaged or destroyed 36 homes in Posey county and 106 structures in Gibson county. Large hail tore through northeast Indiana. One inch hail was noted in Huntington, Allen, Noble, and Lagrange counties with 1.25 hail in DeKalb, Steuben, and St Joseph counties. Additional reports of 1.5 diameter hail were received from Lagrange county. High winds were the primary cause of storm damage in northwest, central, and east central Indiana that evening. Wind gusts to 95 mph were measured in Lake county and 64 mph in Laporte county. A carport collapsed in heavy rain in far northwest Lake county, totaling one of two cars parked under the structure. In central Indiana 58 mph winds were noted in Marion county with 64 mph in Boone county where a
9 transformer was blown. In east central Indiana several trees fell and blocked roadways in Jay county. Power was lost to thousands of customers statewide because high winds caused trees to fall on power lines. In central Indiana power lines fell on to I-70 westbound, forcing its closure for an hour until just before midnight. Near record temperatures kept evaporation rates high this week. With below normal precipitation totals Indiana soils continued to dry. Analyses of many water data sources led to a greatly expanded D0 abnormally dry region on the USDM map, covering the south half of the state and the northern portion of west central Indiana. A sliver of extreme southern Clark and Jefferson counties and all of Switzerland county were left untouched in normal soil moisture status. By the numbers as of February 28 th about 52% of the state was rated as abnormally dry (D0 category). The remaining 48%, primarily northern Indiana, was rated in normal soil moisture status for this time of year.
10 February 2017 Temperature Region Temperature Normal Deviation Northwest North Central Northeast West Central Central East Central Southwest South Central Southeast State Precipitation Region Precipitation Normal Deviation Percent of Normal Northwest North Central Northeast West Central Central East Central Southwest South Central Southeast State
11 Winter (Dec 2016 Feb 2017) Temperature Region Temperature Normal Deviation Northwest North Central Northeast West Central Central East Central Southwest South Central Southeast State Precipitation Region Precipitation Normal Deviation Percent of Normal Northwest North Central Northeast West Central Central East Central Southwest South Central Southeast State
12 2017 Annual so far (Jan - Feb) Temperature Region Temperature Normal Deviation Northwest North Central Northeast West Central Central East Central Southwest South Central Southeast State Precipitation Region Precipitation Normal Deviation Percent of Normal Northwest North Central Northeast West Central Central East Central Southwest South Central Southeast State
13
14
15
16

17 Drought Summary from the U.S. Drought Monitor Below is a drought summary for the state of Indiana from the U.S. Drought Monitor. Areas in white are not experiencing any drought. Yellow areas are abnormally dry, but not considered a drought. Drought begins when the moisture levels become more severe, with beige, orange, red, and brown indicating increasing levels of drought (moderate, severe, extreme, and exceptional, respectively). The table below indicates what percentage of the state is drought free, and how much of the state is in drought by degree of severity (D1 - D4 category).
18 Feb 7 th Drought Summary
19 Feb 14 th Drought Summary
20 Feb 21 st Drought Summary

21 Feb 28 th Drought Summary
October 2011 Climate Summary
 Ken Scheeringa and Kayla Hudson Nov 4, 2011 http://www.iclimate.org October 2011 Climate Summary Month Summary October weather evolved as a two part story. Weather conditions the first half of the month
January 2017 Climate Summary
 Ken Scheeringa And Andy Eggert Feb 8, 2017 (765) 494-8105 http://www.iclimate.org January 2017 Climate Summary Month Summary The warmest January in 11 years was nearly 4 F warmer than December 2016. An
May 2018 Climate Summary
 Ken Scheeringa and Andy Eggert Jun 7, 2018 (765) 494-8105 http://www.iclimate.org May 2018 Climate Summary Month Summary As the calendar turned from April to May temperatures flipped dramatically away
August 2006 Summary. August 1-5
 Ashley Brooks (765) 494-6574 Sep 8, 2006 http://www.iclimate.org August 1-5 August 2006 Summary The heat wave that started during the end of July continued into the beginning parts of August with temperatures
August 2017 Climate Summary
 Ken Scheeringa And Andy Eggert Sep 7, 2017 (765) 494-8105 http://www.iclimate.org August 2017 Climate Summary Month Summary The coolest August in 13 years featured long cool and warm spells, below normal
January 2008 Climate Summary
 Joseph Mays (765) 494-6574 Feb 5, 2008 http://www.iclimate.org Summary January 2008 Climate Summary January was a mix bag of conditions, with an oscillatory pattern developing. We experienced phases of
August 2013 Climate Summary
 Ken Scheeringa and Matt Price Sep 6, 2013 (765) 494-8105 http://www.iclimate.org August 2013 Climate Summary Month Summary August weather began cool and wet but became progressively warmer and drier through
December 2011 Climate Summary
 Ken Scheeringa and Kayla Hudson Jan 17, 2012 (765) 494-8105 http://www.iclimate.org December 2011 Climate Summary Month Summary What a difference a year makes! A year ago the misery of a harsh, cold, and
July 2007 Climate Summary
 Dan Bowman (765) 494-6574 Sep 3, 2007 http://www.iclimate.org Summary July 2007 Climate Summary The month of July ended as a very unusual month. Many events occurred during the month of July that is not
May 2016 Climate Summary
 Ken Scheeringa And Andy Eggert Jun 6, 2016 (765) 494-8105 http://www.iclimate.org May 2016 Climate Summary Month Summary Cold weather dominated in May until the last week of the month. May began wet but
September 2005 Climate Summary
 Ashley Brooks (765) 494-6574 Oct 5, 2005 http://iclimate.org September 2005 Climate Summary September 1-7 A cold front came through on the 1 st of the month, however little moisture was associated with
March 2014 Climate Summary
 Ken Scheeringa And Matt Price Apr 8, 2014 (765) 494-8105 http://www.iclimate.org March 2014 Climate Summary Month Summary Winter had officially ended by the calendar but snow and cold persisted in Indiana
October 2014 Climate Summary
 Ken Scheeringa And Matt Price Nov 10, 2014 (765) 494-8105 http://www.iclimate.org October 2014 Climate Summary Month Summary October featured a mix of weather. A very wet first half of the month evolved
September 2016 Climate Summary
 Ken Scheeringa And Andy Eggert Oct 6, 2016 (765) 494-8105 http://www.iclimate.org September 2016 Climate Summary Month Summary The warmest September in 77 years brought alternating weeks of dry and wet
April 2016 Climate Summary
 Ken Scheeringa And Andy Eggert May 9, 2016 (765) 494-8105 http://www.iclimate.org April 2016 Climate Summary Month Summary One month but two seasons. The first half of April was cold with snow. Wind damage
January 2006 Climate Summary
 Ashley Brooks (765) 494-6574 Feb 9, 2006 http://www.iclimate.org January 1-3 January 2006 Climate Summary Unseasonably warm conditions welcomed in the New Year with highs in the 40s across the northern
November 2012 Climate Summary
 Ken Scheeringa and Kayla Hudson Dec 6, 2012 (765) 494-8105 http://www.iclimate.org November 2012 Climate Summary Month Summary November was one of those rare weather months in Indiana when not much happened:
March 2016 Climate Summary
 Ken Scheeringa And Andy Eggert Apr 8, 2016 (765) 494-8105 http://www.iclimate.org March 2016 Climate Summary Month Summary Count March as the 7 th month in a row that the state average temperature has
October 2016 Climate Summary
 Ken Scheeringa And Andy Eggert Nov 9, 2016 (765) 494-8105 http://www.iclimate.org October 2016 Climate Summary Month Summary October was the 9 th month so far this year to average above normal in temperature.
November 2015 Climate Summary
 Ken Scheeringa And Mary Rose Mangan Dec 8, 2015 (765) 494-8105 http://www.iclimate.org November 2015 Climate Summary Month Summary November was much warmer than normal while precipitation was very near
November 2017 Climate Summary
 Ken Scheeringa and Andy Eggert Dec 8, 2017 (765) 494-8105 http://www.iclimate.org November 2017 Climate Summary Month Summary November temperatures alternated spells of warm and cool while precipitation
September 2011 Climate Summary
 Ken Scheeringa and Kayla Hudson Oct 5, 2011 (765) 494-8105 http://www.iclimate.org September 2011 Climate Summary Month Summary The final blast of summer heat arrived at the start of September. It lasted
November 2010 Climate Summary
 Ken Scheeringa (765) 494-8105 Dec 6, 2010 http://www.iclimate.org November 2010 Climate Summary Summary A four month drought in Indiana is collapsing as significant rain fell the final week of November.
January 2018 Climate Summary
 Ken Scheeringa and Andy Eggert Feb 8, 2018 (765) 494-8105 http://www.iclimate.org January 2018 Climate Summary Month Summary January temperature swings were amazing. In the first few days arctic cold pushed
January 2012 Climate Summary
 Ken Scheeringa and Kayla Hudson Feb 6, 2012 (765) 494-8105 http://www.iclimate.org January 2012 Climate Summary Month Summary Where is winter? This question found its way into many conversations throughout
October 2017 Climate Summary
 Ken Scheeringa and Andy Eggert Nov 6, 2017 (765) 494-8105 http://www.iclimate.org October 2017 Climate Summary Month Summary After more than three weeks of warm temperatures October turned suddenly cold
May 2015 Climate Summary
 Ken Scheeringa And Mary Rose Mangan Jun 8, 2015 (765) 494-8105 http://www.iclimate.org May 2015 Climate Summary Month Summary May was a very warm month. Rainfall averaged near normal but was distributed
November 2014 Climate Summary
 Ken Scheeringa And Matt Price Dec 10, 2014 (765) 494-8105 http://www.iclimate.org November 2014 Climate Summary Month Summary Unseasonable cold headlined the Indiana and national news in November. The
March 2018 Climate Summary
 Ken Scheeringa and Andy Eggert Apr 5, 2018 (765) 494-8105 http://www.iclimate.org March 2018 Climate Summary Month Summary March turned cold with below normal temperatures on two-thirds of its days. Along
April 2017 Climate Summary
 Ken Scheeringa And Andy Eggert May 8, 2017 (765) 494-8105 http://www.iclimate.org April 2017 Climate Summary Month Summary April was a very warm and wet month in Indiana, nearly setting a new monthly temperature
IC ARTICLE 19. DESCRIBING REAL PROPERTY; INDIANA COORDINATE SYSTEM. IC Chapter 1. Designation of Indiana Coordinate System; Zones
 IC 32-19 ARTICLE 19. DESCRIBING REAL PROPERTY; INDIANA COORDINATE SYSTEM IC 32-19-1 Chapter 1. Designation of Indiana Coordinate System; Zones IC 32-19-1-1 Designation of systems Sec. 1. The systems of
April 2015 Climate Summary
 Ken Scheeringa And Mary Rose Mangan May 8, 2015 http://www iclimate org April 2015 Climate Summary Month Summary April was a month of extremes. Severe weather erupted on 4 days of the first week with multiple
June 2016 Climate Summary
 Ken Scheeringa And Andy Eggert Jul 8, 2016 (765) 494-8105 http://www.iclimate.org June 2016 Climate Summary Month Summary June was a warm month with below normal temperature on just 6 days. Rainfall was
March 2009 Climate Summary
 Joseph Mays (765) 494-6574 Apr 1, 2009 http://www.iclimate.org Summary March 2009 Climate Summary March is in the books and it continued the trend of extreme weather we have experienced during the first
August 2015 Climate Summary
 Ken Scheeringa And Mary Rose Mangan Sep 4, 2015 (765) 494-8105 http://www.iclimate.org August 2015 Climate Summary Month Summary A very active wet summer weather pattern turned much calmer and drier in
2011 Year in Review TORNADOES
 2011 Year in Review The year 2011 had weather events that will be remembered for a long time. Two significant tornado outbreaks in April, widespread damage and power outages from Hurricane Irene in August
September 2012 Climate Summary
 Ken Scheeringa and Kayla Hudson Oct 5, 2012 (765) 494-8105 http://www.iclimate.org September 2012 Climate Summary Month Summary Summer slipped away and it felt a lot more like autumn in Indiana this month
April 2013 Climate Summary
 Ken Scheeringa and Kayla Hudson May 6, 2013 (765) 494-8105 http://www.iclimate.org April 2013 Climate Summary Month Summary Temperatures bounced high and low this month, keeping Hoosiers guessing which
Champaign-Urbana 1998 Annual Weather Summary
 Champaign-Urbana 1998 Annual Weather Summary ILLINOIS STATE WATER SURVEY Audrey Bryan, Weather Observer 2204 Griffith Dr. Champaign, IL 61820 wxobsrvr@sparc.sws.uiuc.edu The development of the El Nìno
June 2010 Climate Summary
 Ken Scheeringa (765) 494-8105 Jul 6, 2010 http://www.iclimate.org June 2010 Climate Summary Summary Summer like heat and humidity arrived in Indiana on May 22 nd and dominated our weather scene nearly
August 2016 Climate Summary
 Ken Scheeringa And Andy Eggert Sep 12, 2016 (765) 494-8105 http://www.iclimate.org August 2016 Climate Summary Month Summary Hot but tranquil weather the first half of August transitioned to a tormented
Champaign-Urbana 2001 Annual Weather Summary
 Champaign-Urbana 2001 Annual Weather Summary ILLINOIS STATE WATER SURVEY 2204 Griffith Dr. Champaign, IL 61820 wxobsrvr@sws.uiuc.edu Maria Peters, Weather Observer January: After a cold and snowy December,
Monthly Long Range Weather Commentary Issued: July 18, 2014 Steven A. Root, CCM, President/CEO
 Monthly Long Range Weather Commentary Issued: July 18, 2014 Steven A. Root, CCM, President/CEO sroot@weatherbank.com JUNE 2014 REVIEW Climate Highlights The Month in Review The average temperature for
June 2011 Climate Summary
 Ken Scheeringa (765) 494-8105 Jul 8, 2011 http://www.iclimate.org June 2011 Climate Summary Month Summary The abundance of extreme weather this year extended yet another month into June. This month has
November 2016 Climate Summary
 Ken Scheeringa And Andy Eggert Dec 15, 2016 (765) 494-8105 http://www.iclimate.org November 2016 Climate Summary Month Summary Unseasonably warm, pleasant, and sunny weather the first half of the month
January 2013 Climate Summary
 Ken Scheeringa and Kayla Hudson Feb 7, 2013 (765) 494-8105 http://www.iclimate.org January 2013 Climate Summary Month Summary Winter or spring? January featured several dramatic swings in temperature and
The Pennsylvania Observer
 The Pennsylvania Observer April 2, 2009 March 2009 Pennsylvania Weather Recap Prepared by Curt Harpster For the month of March the saying, In like a lion and out like a lamb really fit the pattern quite
February 2016 Climate Summary
 Ken Scheeringa And Andy Eggert Mar 9, 2016 (765) 494-8105 http://www.iclimate.org February 2016 Climate Summary Month Summary February was the 6 th consecutive month with an above normal state average
May 2005 Climate Summary
 Ashley Brooks (765) 494-6574 Jun 7, 2005 http://iclimate.org May 2005 Climate Summary May 1-5 Early May was characterized by an upper-level trough that was in place over Indiana that brought in very cool
Monthly Long Range Weather Commentary Issued: SEPTEMBER 19, 2016 Steven A. Root, CCM, Chief Analytics Officer, Sr. VP,
 Monthly Long Range Weather Commentary Issued: SEPTEMBER 19, 2016 Steven A. Root, CCM, Chief Analytics Officer, Sr. VP, sroot@weatherbank.com SEPTEMBER 2016 Climate Highlights The Month in Review The contiguous
July 2011 Climate Summary
 Ken Scheeringa (765) 494-8105 Aug 8, 2011 http://www.iclimate.org July 2011 Climate Summary Month Summary The upper atmospheric high pressure dome which baked the Texas area in heat and drought the past
April 2011 Climate Summary
 Ken Scheeringa (765) 494-8105 May 9, 2011 http://www.iclimate.org April 2011 Climate Summary Summary After somewhat of a respite in March Indiana weather ramped up with a vengeance in April. Extreme weather
Monthly Long Range Weather Commentary Issued: APRIL 18, 2017 Steven A. Root, CCM, Chief Analytics Officer, Sr. VP,
 Monthly Long Range Weather Commentary Issued: APRIL 18, 2017 Steven A. Root, CCM, Chief Analytics Officer, Sr. VP, sroot@weatherbank.com MARCH 2017 Climate Highlights The Month in Review The average contiguous
Champaign-Urbana 1999 Annual Weather Summary
 Champaign-Urbana 1999 Annual Weather Summary ILLINOIS STATE WATER SURVEY 2204 Griffith Dr. Champaign, IL 61820 wxobsrvr@sws.uiuc.edu Maria Peters, Weather Observer A major snowstorm kicked off the new
NWS FORM E-5 U.S. DEPARTMENT OF COMMERCE I HYDRO SERVICE AREA NOAA, NATIONAL WEATHER SERVICE I Indianapolis, IN MONTHLY REPORT
 NWS FORM E-5 U.S. DEPARTMENT OF COMMERCE I HYDRO SERVICE AREA NOAA, NATIONAL WEATHER SERVICE I Indianapolis, IN. 1-------------------- MONTHLY REPORT OF RIVER AND FLOOD CONDITIONSI REPORT FOR I November
The hydrologic service area (HSA) for this office covers Central Kentucky and South Central Indiana.
 for this office covers Central Kentucky and South Central Indiana.") January 2012 February 13, 2012 An X inside this box indicates that no flooding occurred within this hydrologic service area. January 2012 continued the string of wet months this winter. Rainfall was generally
January 2012 February 13, 2012 An X inside this box indicates that no flooding occurred within this hydrologic service area. January 2012 continued the string of wet months this winter. Rainfall was generally
October 2012 Climate Summary
 Ken Scheeringa and Kayla Hudson Nov 8, 2012 (765) 494-8105 http://www.iclimate.org October 2012 Climate Summary Month Summary In a reversal from the hot and dry summer, cooler and wetter than normal conditions
Arizona Climate Summary May 2012
 Arizona Climate Summary May 2012 Summary of conditions for April 2012 April 2012 Temperature and Precipitation Summary April 1 st 16 th : Although April began with another low pressure system sweeping
July 2014 Climate Summary
 Ken Scheeringa And Matt Price Aug 8, 2014 (765) 494-8105 http://www.iclimate.org July 2014 Climate Summary Month Summary July was unseasonably cool and drier than normal. Rainfall was light in parts of
Monthly Long Range Weather Commentary Issued: May 15, 2014 Steven A. Root, CCM, President/CEO
 Monthly Long Range Weather Commentary Issued: May 15, 2014 Steven A. Root, CCM, President/CEO sroot@weatherbank.com APRIL 2014 REVIEW Climate Highlights The Month in Review The average temperature for
The Pennsylvania Observer
 The Pennsylvania Observer August 3, 2015 July 2015 - Pennsylvania Weather Recap By: Arthur Person Although this seventh month of 2015 was fairly normal across Pennsylvania as a whole, the details reveal
INDIANAPOLIS, INDIANA
 The NWS FORM E-5 U.S. DEPARTMENT OF COMMERCE HYDROLOGIC SERVICE AREA: NATIONAL OCEANIC AND ATMOSPHERIC ADMINISTRATION NATIONAL WEATHER SERVICE INDIANAPOLIS, INDIANA REPORT FOR: MONTHLY REPORT OF RIVER
SEPTEMBER 2013 REVIEW
 Monthly Long Range Weather Commentary Issued: October 21, 2013 Steven A. Root, CCM, President/CEO sroot@weatherbank.com SEPTEMBER 2013 REVIEW Climate Highlights The Month in Review The average temperature
National Wildland Significant Fire Potential Outlook
 National Wildland Significant Fire Potential Outlook National Interagency Fire Center Predictive Services Issued: September, 2007 Wildland Fire Outlook September through December 2007 Significant fire
Weather and Climate Summary and Forecast Summer 2017
 Weather and Climate Summary and Forecast Summer 2017 Gregory V. Jones Southern Oregon University August 4, 2017 July largely held true to forecast, although it ended with the start of one of the most extreme
NATIONAL WEATHER SERVICE
 January 2016 February 9, 2016 This was a dry month across the HSA despite one large and several smaller snowfalls. Most locations ended up 1-2 inches below normal for the month. The driest locations at
KANSAS CLIMATE SUMMARY January 2018
 KANSAS CLIMATE SUMMARY January 2018 Some welcome moisture After an extended period with little to no moisture, parts of Kansas recorded some significant precipitation. At Tribune, a small snow event on
NWS FORM E-5 U.S. DEPARTMENT OF COMMERCE HSA OFFICE:
 NWS FORM E-5 U.S. DEPARTMENT OF COMMERCE HSA OFFICE: NOAA, NATIONAL WEATHER SERVICE MONTHLY REPORT OF RIVER AND FLOOD CONDITIONS DATE: TO: North Webster, IN REPORT FOR (MONTH &YEAR): July 1998 August 5,
The hydrologic service area (HSA) for this office covers Central Kentucky and South Central Indiana.
 for this office covers Central Kentucky and South Central Indiana.") MONTH YEAR January 2011 February 15, 2011 X An X inside this box indicates that no flooding occurred within this hydrologic service area. January 2011 was drier than normal in all locations in the area.
MONTH YEAR January 2011 February 15, 2011 X An X inside this box indicates that no flooding occurred within this hydrologic service area. January 2011 was drier than normal in all locations in the area.
July 2010 Climate Summary
 Ken Scheeringa (765) 494-8105 Aug 4, 2010 http://www.iclimate.org July 2010 Climate Summary Summary The warm summer of 2010 continues. Daily state average temperatures were above normal on all but seven
May 2016 Volume 23 Number 5
 The Weather Wire May 2016 Volume 23 Number 5 Contents: Winter Summary Current Colorado and West-wide Snow Pack Drought Monitor April Summary/Statistics May Preview Snowfall Totals Winter Summary The Front
March 2012 Climate Summary
 Ken Scheeringa and Kayla Hudson Apr 4, 2012 (765) 494-8105 http://www.iclimate.org March 2012 Climate Summary Month Summary March was a month of weather extremes with records shattered almost as a daily
Monthly Long Range Weather Commentary Issued: February 15, 2015 Steven A. Root, CCM, President/CEO
 Monthly Long Range Weather Commentary Issued: February 15, 2015 Steven A. Root, CCM, President/CEO sroot@weatherbank.com JANUARY 2015 Climate Highlights The Month in Review During January, the average
National Wildland Significant Fire Potential Outlook
 National Wildland Significant Fire Potential Outlook National Interagency Fire Center Predictive Services Issued: April 1, 2008 Next Issue: May 1, 2008 Wildland Fire Outlook April 2008 through July 2008
Monthly Long Range Weather Commentary Issued: APRIL 1, 2015 Steven A. Root, CCM, President/CEO
 Monthly Long Range Weather Commentary Issued: APRIL 1, 2015 Steven A. Root, CCM, President/CEO sroot@weatherbank.com FEBRUARY 2015 Climate Highlights The Month in Review The February contiguous U.S. temperature
Weather and Climate Summary and Forecast Winter
 Weather and Climate Summary and Forecast Winter 2016-17 Gregory V. Jones Southern Oregon University February 7, 2017 What a difference from last year at this time. Temperatures in January and February
KANSAS CLIMATE SUMMARY February 2015
 KANSAS CLIMATE SUMMARY February 2015 Extended Cold Despite some record warm readings at a few locations, February was characterized by colder than normal conditions. This was particularly true during the
2012 Growing Season Weather Summary for North Dakota. Adnan Akyüz and Barbara A. Mullins Department of Soil Science October 30, 2012
 2012 Growing Season Weather Summary for North Dakota Adnan Akyüz and Barbara A. Mullins Department of Soil Science October 30, 2012 Introduction The 2012 growing season (the period from April through September)
KANSAS CLIMATE SUMMARY March 2018
 KANSAS CLIMATE SUMMARY March 2018 Another Dry Month The Southwest Division again missed out on most of the precipitation during March. State-wide the average precipitation was 0.97 inches or 41 percent
NATIONAL WEATHER SERVICE
 NWS Form E-5 (PRES. BY NWS Instruction 10-924) MONTHLY REPORT OF HYDROLOGIC CONDITIONS HYDROLOGIC SERVICE AREA (HSA) NORTHERN INDIANA (IWX) MONTH YEAR TO: Hydrologic Information Center, W/OS31 NOAA s National
MIAMI-SOUTH FLORIDA National Weather Service Forecast Office
 MIAMI-SOUTH FLORIDA National Weather Service Forecast Office http://www.weather.gov/miami June 2015 South Florida Weather Summary Dry East, Wet West...Drought Remains SE Florida July 3, 2015: Depending
The Pennsylvania Observer
 The Pennsylvania Observer October 1, 2015 September 2015 - Pennsylvania Weather Recap By: Quinn Lease The month of September will be remembered for its above normal temperatures and dry conditions that
The Pennsylvania Observer
 The Pennsylvania Observer September 3, 2008 Summer 2008 Weather Summary Written by: Brian Thompson The opening days of June started dry, but a warm front brought a widespread rain a couple of days into
The Pennsylvania Observer
 The Pennsylvania Observer May 31, 2012 May 2012 - Pennsylvania Weather Recap By: Paul Knight The majority of the fifth month had temperatures averaging well above seasonal levels with two distinct hot
1. Which weather map symbol is associated with extremely low air pressure? A) B) C) D) 2. The diagram below represents a weather instrument.
 B) C) D) 2. The diagram below represents a weather instrument.") 1. Which weather map symbol is associated with extremely low air pressure? 2. The diagram below represents a weather instrument. Which weather variable was this instrument designed to measure? A) air pressure
1. Which weather map symbol is associated with extremely low air pressure? 2. The diagram below represents a weather instrument. Which weather variable was this instrument designed to measure? A) air pressure
The Weather Wire. Contents: Summer 2018 Outlook. Summer 2018 Outlook Drought Monitor May Summary/Statistics June Preview Rainfall Totals
 The Weather Wire June 2018 Volume 25 Number 6 Contents: Summer 2018 Outlook Drought Monitor May Summary/Statistics June Preview Rainfall Totals Summer 2018 Outlook June 1 st marked the first day of meteorological
June 2015 Climate Summary
 Ken Scheeringa And Mary Rose Mangan Jul 10, 2015 (765) 494-8105 http://www.iclimate.org June 2015 Climate Summary Month Summary Indiana set a new June rainfall record this month with a state average 8.99.
2018 Year in Review for Central and Southeast Illinois By: Chris Geelhart, Meteorologist National Weather Service, Lincoln IL
 By: Chris Geelhart, Meteorologist National Weather Service, Lincoln IL While 2018 featured some significant out-of-season weather, including below zero temperatures in April and 90-degree highs in early
March 2011 Climate Summary
 Ken Scheeringa (765) 494-8105 Apr 5, 2011 http://www.iclimate.org March 2011 Climate Summary Summary The fast paced weather action of February slowed some in March. The major March weather features were
Monthly Long Range Weather Commentary Issued: APRIL 25, 2016 Steven A. Root, CCM, Chief Analytics Officer, Sr. VP, sales
 Monthly Long Range Weather Commentary Issued: APRIL 25, 2016 Steven A. Root, CCM, Chief Analytics Officer, Sr. VP, sales sroot@weatherbank.com MARCH 2016 Climate Highlights The Month in Review The March
X An X inside this box indicates that no flooding occurred within this Hydrologic Service Area.
 NWS FORM E-5 U.S. DEPARTMENT OF COMMERCE HSA OFFICE: NOAA, NATIONAL WEATHER SERVICE MONTHLY REPORT OF RIVER AND FLOOD CONDITIONS DATE: TO: North Webster, IN REPORT FOR (MONTH &YEAR): January, 2003 February
The Pennsylvania Observer
 The Pennsylvania Observer January 5, 2009 December 2008 Pennsylvania Weather Recap The final month of 2008 was much wetter than average and a bit colder than normal. In spite of this combination, most
Weather and Climate Summary and Forecast January 2019 Report
 Weather and Climate Summary and Forecast January 2019 Report Gregory V. Jones Linfield College January 4, 2019 Summary: December was mild and dry over much of the west, while the east was much warmer than
KANSAS CLIMATE SUMMARY May 2018
 KANSAS CLIMATE SUMMARY May 2018 From Cold to Hot May came close to setting the record as the hottest since 1895. The state-wide average temperature for the month was 70.6 o F. This was 7.2 degrees warmer
Monthly Long Range Weather Commentary Issued: NOVEMBER 16, 2015 Steven A. Root, CCM, Chief Analytics Officer, Sr. VP, sales
 Monthly Long Range Weather Commentary Issued: NOVEMBER 16, 2015 Steven A. Root, CCM, Chief Analytics Officer, Sr. VP, sales sroot@weatherbank.com OCTOBER 2015 Climate Highlights The Month in Review The
SIGNIFICANT EVENTS Severe Storms November 1994 January 1996 August 1998 and May 2000 March 2002 May 2002 Champaign County
 SIGNIFICANT EVENTS Severe Storms November 1994 On Nov. 1, 1994, high winds gusted over 60 mph at times across the northwest third of Ohio. The highest measured wind gust was 63 mph at Columbus Grove (Putnam).
Weather and Climate Summary and Forecast October 2017 Report
 Weather and Climate Summary and Forecast October 2017 Report Gregory V. Jones Linfield College October 4, 2017 Summary: Typical variability in September temperatures with the onset of fall conditions evident
KANSAS CLIMATE SUMMARY August 2015
 KANSAS CLIMATE SUMMARY August 2015 Cool and Dry August was drier than normal in most of the state. State-wide average precipitation was 2.80 inches or 85 percent of normal. The Northeast division of the
NATIONAL WEATHER SERVICE
 NWS Form E-5 (PRES. BY NWS Instruction 10-924) MONTHLY REPORT OF HYDROLOGIC CONDITIONS HYDROLOGIC SERVICE AREA (HSA) MONTH YEAR TO: Hydrologic Information Center, W/OS31 NOAA s National Weather Service
Arizona Climate Summary April 2013
 Arizona Climate Summary April 2013 Summary of conditions for March 2013 March 2013 Temperature and Precipitation Summary March 1 st 16 th : March began as a ridge of high pressure progressed across the