May 2015 Climate Summary
|
|
|
- Evangeline Berry
- 5 years ago
- Views:
Transcription

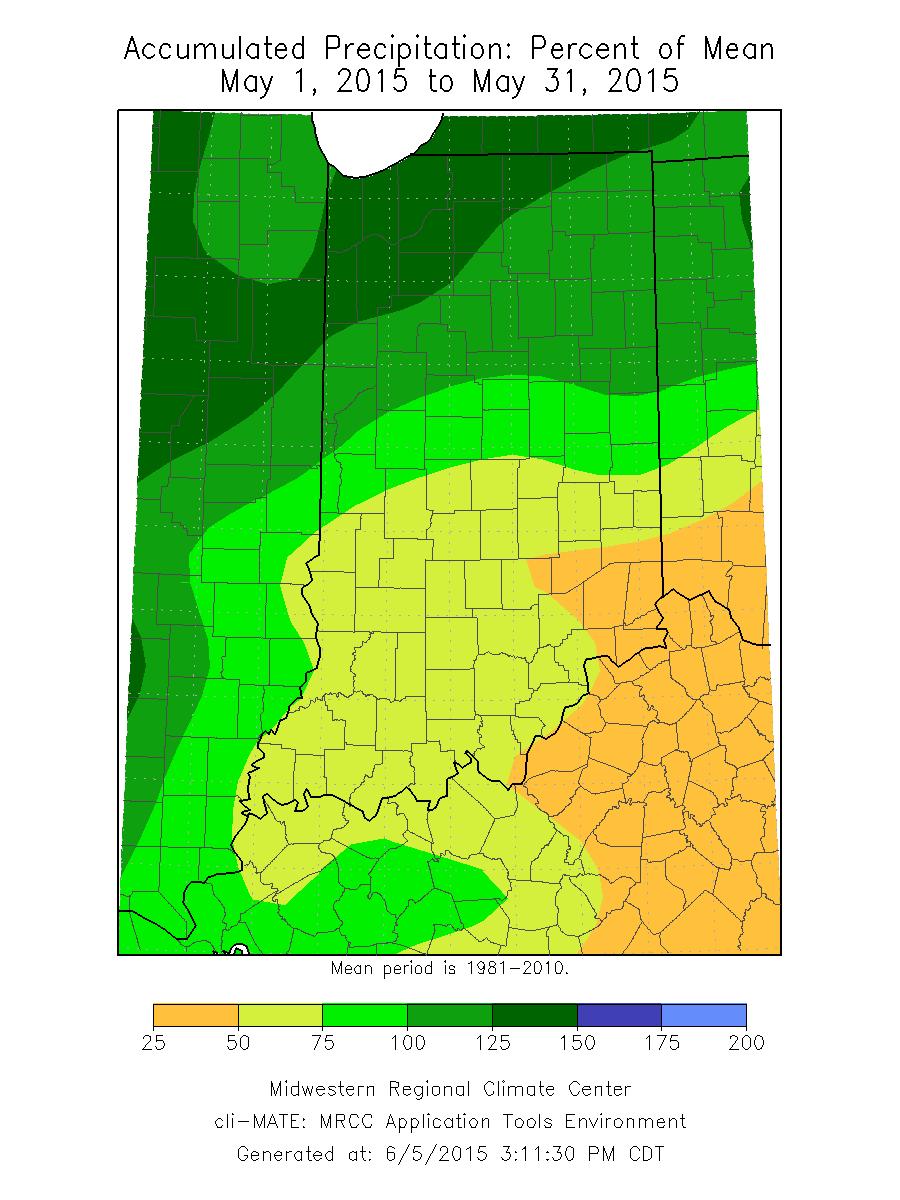
1 Ken Scheeringa And Mary Rose Mangan Jun 8, 2015 (765) May 2015 Climate Summary Month Summary May was a very warm month. Rainfall averaged near normal but was distributed unevenly over time with the heaviest amounts near the end of the month. Dry soils persisted in northern Indiana all month long and developed along the Ohio River late in May. There were 5 significant severe weather days in May with wind damage the most common: overturning trucks on interstates and ripping into trees, cars, power lines, homes, and barns. May 30 th was an eventful day when a sharp cold front sent temperatures tumbling in a few hours. An EF-1 tornado in Marion county that day destroyed garages and damaged homes, cars, and trees. There were no injuries. A thunderstorm set off a lightning strike that burned a garage to the ground in Newton county. Very heavy rainfall with localized flash flooding occurred in northwest and central Indiana. The state average temperature for May was 65.3 F. This is 3.3 F above normal and places this month as the 17 th warmest May on record. Some recent warmer Mays include 2004 with its 65.9 F coming in at 14 th place. Three years later a 66.3 F average pegged May 2007 at 13 th warmest. May 2012 was very warm with its 67.7 F good for 5 th place. The warmest May on record was in 1896 with a 68.5 F state average temperature. The day split in May 2015 was 10 days of below normal temperature, 21 days above normal, and no days at normal. There were 7 days with the daily state temperature 10 F or more above normal and 2 days at 10 F or more below normal. The highest temperature of the month in the cooperative observer network was 91 F on May 8 th in Brookville. The coldest minimum was 31 F on May 1 st at the Purdue University Airport in West Lafayette. The May state precipitation average of 4.08 was 0.33 below normal. This pins May 2015 in the middle of the historical pack of 120 years of record as the 61 st wettest May on record. The wettest May was in 1943 with a state average 8.62 of precipitation. The highest single day precipitation among cooperative stations in May 2015 was 5.24 recorded on May 31 st at Kokomo 3wsw. The highest daily total in the CoCoRaHS network was 5.01 measured nearby by the volunteer at Kokomo 4.3sw that same day. Regionally May 2015 precipitation was near 130% of normal in northern Indiana, 90% of normal in central, and 70% of normal in the south. Normal May precipitation ranges from 3.8 in northeast Indiana to 5.0 in south central and southwest Indiana. Widespread precipitation fell on about 19 days this month. Indiana farmers were able to catch up delayed spring planting to reach normal field progress.
2 May 1 st 9 th The recent cold temperature trend flipped right along with the calendar to start the new month. Eight of the first 9 days of May featured above normal temperatures. The long term trend of less rainfall north to many wet days in southern Indiana switched places in a flip of its own. Unsettled weather generated locally large hail in central Indiana on May 4 th and wind damage in northern counties on May 9 th. High pressure settled overhead Indiana on May 1 st. The initial state average temperature of 1 F below normal marked the coldest of the 9 days and the start of a significant warm up. The fair weather system sprawled nationwide the next day, lifting Indiana temperatures a few degrees to 3 F above normal. The core of the ridge wandered from Kentucky into Georgia on May 3 rd, setting up a return flow of warm southerly winds which nudged the Indiana temperature upward to 9 F above normal. The ridge moved off the Carolina shore the next day. The back flow continued and the daily Indiana temperature increased to 11 F above normal. A cold front closed in on the state from the northwest. Thunderstorms developed well ahead of the front, pelting local spots in central Indiana with large hail. The offshore ridge retreated inland to Georgia on May 5 th. This movement slowed the cold front sliding its way through northern Indiana that day and halted its progress over central Indiana. Weather systems held steady on May 6 th as did the daily state temperature at 11 F above normal. By the next day the air masses on each side of the stationary front had mixed completely. The stationary front washed away. Warm moist air from southeast states freely surged north across Indiana and into Canada, claiming the eastern half of the country. The daily Indiana state average temperature reached 12 F above normal. On May 8 th another slowing cold front approached Indiana from the west. The next day this front stalled in northwest Indiana. Canadian high pressure behind the front had pushed eastward across Canada rather than to the south. The stalled front triggered another round of severe weather, this time creating local wind gust damage in a few northern Indiana counties. At the end of the 9 day interval Indiana remained in the unstable warm air mass. The state temperature which had peaked at 13 F above normal on May 8 th closed out the interval at 11 F above normal. Two attempts to push a cold front through Indiana during the 9 days had failed. The resulting stationary fronts had generated thunderstorms with local severe weather. The lone benefit was the production of needed rainfall in an area which had been drier than normal since mid-february. The state temperature over the 9 days averaged near 9 F above normal. Typically at the start of May daily maximum temperatures should range between 67 F and 74 F north to south across the state. Daily minimums normally vary between 45 F in far northern Indiana to 51 F in far southwest counties. The warmest local temperature over the 9 days in the cooperative station network was 91 F at Brookville on May 8 th. The coolest temperature in the same network was 31 F at the Purdue University Airport on May 1 st. Very light rain fell generally south of a Terre Haute to Muncie line according to CoCoRaHS network reports of May 1 st. The next rain event was recorded on May 4 th mostly northwest of a Fowler to South Bend line. Rain spread south into central Indiana the next day but the heaviest
3 amounts exceeded an inch in the northwest corner of the state. Reports on May 6 th noted amounts up to an inch in northeast Indiana with lighter totals across other far northern counties. There were isolated spots of very light rainfall on the Michigan border observed on May 8 th. Rain coverage was heavier on May 9 th, mostly north of an Evansville to Fort Wayne line, although the heaviest amounts again fell in Lake county to the far northwest. Regionally over the 9 days about 1.3 of rain fell across northern Indiana, about 0.5 in central, and just 0.2 in the southern third of the state. These amounts equate to about 140% of normal in the north, 50% of normal in central areas, but just 10% of normal across southern Indiana. Some of the largest daily rainfall amounts in the CoCoRaHS network were measured on May 9 th and included 1.74 in Laporte, 1.49 at Portage, and 1.48 in Bourbon. Some of the heaviest 9-day totals were 2.68 in Hebron, 2.65 at Winfield, 2.58 for Laporte, 2.41 in Dyer, and 2.39 at Crown Point. Large hail was observed only in Boone county on May 4 th. Hail sizes ranged from 1.00 to No other severe weather reports were received that day. Wind gusts reached 65 mph in northern Indiana on May 9 th. High winds caused a barn to collapse in Kosciusko county. Trees fell on power lines and a house in Marshall county. A 60 mph wind gust was recorded in Steuben county. The May 5 th edition of the US Drought Monitor indicated no change in Indiana drought status from the previous week. Parts of 26 counties in northern Indiana continue in the D0 category, abnormally dry status, at 22% of total Indiana land area. The impacted area is generally north of a Covington to Auburn line except for Lake and Newton counties which are excluded. Some improvement is expected in the next edition of US Drought Monitor which will account for the May 9 th rainfall in northern Indiana. The warm temperatures have greatly benefited Indiana farmers attempting to plant their spring crops according to the Indiana Crop Weather report of May 11 th. Corn planting jumped to 56% complete in northern Indiana, 47% in central, and 58% in southern Indiana. The earliest planted corn has started to emerge. Both corn and soybean planting have greatly advanced to catch up to near normal progress. The weekly report estimates Indiana topsoil moisture now stands at 6% short, 67% adequate, and 27% surplus. The subsoil numbers are 5%, 75%, and 20% in these same categories. White county reported this week that 12 miles of county roads will need to be completely replaced. The roads were so badly damaged by last winter s freeze cycles that it was decided they were not worth saving. A special request will be made to county government for funds to cover this unplanned maintenance cost. In Tippecanoe county 88 miles of county roads are in need of serious repairs, about 10% of all roads maintained by the county, and twice the miles expected after a typical winter. Repairs to fix all 88 miles is estimated to cost $1 million but not enough money or manpower is available to handle everything in a single year. The county plans to prioritize which roads are fixed over multiple years of work.
4 May 10 th 16 th The warmth of early May continued into mid-month except for a brief 3-day cool down this week. Rain fell statewide on 4 days. Total precipitation for the week was heaviest in west central and southwestern Indiana but light in the far southeast. Two storm systems moved through the state with wind damage noted on 3 days. Despite the rain delays field planting has nearly caught up to normal seasonal progress. On May 10 th a stationary front lie across Indiana. The state average temperature opened the week at 11 F above normal. The stationary front morphed into a warm front the next day and lifted north of the state, placing Indiana fully within a warm air mass sector. The cold front of the storm complex followed through Indiana on May 12 th. High pressure traveled behind the front toward the state, tapping into much colder Canadian air. The state temperature dropped to 4 F below normal. On May 13 th the cold ridge settled overhead Indiana, lowering the state temperature to 6 F below normal, the coldest day of the week. The next day the ridge moved east to New York, starting a warm southerly return wind flow into Indiana. The state temperature began its rebound to 4 F below normal. A new storm system approached the state from the west, pushing its warm front through Indiana and boosting temperatures to 5 F above normal. Indiana was positioned inside its second warm sector of the week. The warm front stalled on the Michigan border as a stationary front on May 16 th. The warm air mass over Indiana could not counter the momentum of more cold air moving south from Canada. As the week ended neither the warm nor cold air could advance. The state temperature held at 6 F above normal to end the week. Overall for the week the state temperature averaged to 2 F above normal. Typically for mid-may the daily maximum temperature should vary between 69 F in far northern Indiana to 76 F in the far southwest corner of the state. Normal daily minimums range between 48 F and 54 F north to south across the state. The warmest local temperature among stations in the cooperative network this
5 week was 89 F at Boonville 1s on May 10 th and at Brookville on May 12 th. The coldest temperature in this same network was 36 F at Francesville and at West Lafayette 6nw on May 13 th. Rain fell statewide on 4 days as noted in reports on the mornings of May 10 th, 11 th, 12 th, and 16 th while statewide dry days were May 13 th and 14 th. The heaviest daily amounts according to the CoCoRaHS network were measured the morning of May10 th when two Muncie volunteers had 2.40 and A Kentland observer caught 2.01 in the gage that day while Albany had 1.75 and Fort Branch collected For the week the largest totals were Muncie with 2.86, Bedford at 2.84, while Shoals, Kentland, and Melody Hill all had Regionally on average about 1.2 was tallied in northern Indiana while central and southern Indiana had a bit more at 1.3. These totals equate to about 150% of normal in northern Indiana, 130% in central counties, and 110% of normal in the south. Severe weather struck areas of Indiana on days when warm unstable air occupied the state. On May 10 th wind gust damage was limited to the north half of Orange county in south central Indiana. Winds to 75 mph snapped or uprooted several trees, caused heavy damage to a few garages and a barn, and flipped a horse trailer. Areas of wind gust damage expanded to several counties and moved to east central Indiana on May 11 th. High winds overturned a semi on I-65 near Columbus in Bartholomew county while trees fell on 2 cars there. In Randolph county trees fell on power lines, a house, cars, and blocked roads. A state road was closed by debris. In Wayne county 2 semis on I-70 were blown into the median, trees were uprooted, and wind gusts heavily damaged the roof and walls of a porch. High winds severely damaged a storage building and barn in Union county. In Fayette county trees tore into power lines. More tree limbs fell in Franklin and Rush counties. An isolated 1.0 diameter large hail report was taken from Allen county this same day. Severe weather left the state for a few days of cooler weather. But when the warmth returned later in the week so did severe storms. On May 15 th wind gusts to 65 mph in Sullivan and Vigo counties ripped down more tree limbs. Power lines were reported down due to high winds in Hamilton county. According to the May 12 th edition of the US Drought Monitor, abnormally dry conditions abated in west central Indiana but spread in northeast Indiana. The D0 category was removed from Fountain, Warren, Tippecanoe, and the south half of White county. But northern Wabash, northern Allen, and all of Whitley county were newly designated as abnormally dry. The net effect was a 2% reduction in total Indiana land area assigned to the D0 category, recalculated to 20% of total area. Thus 80% of all Indiana land was rated to be in normal soil moisture status. According to the May 18 th edition of the Indiana Crop Report rainfall has slowed regional planting but warmer temperatures have improved overall Indiana crop status. Statewide planting progress has essentially caught up to normal status for the date. Nearly half of the planted corn crop has emerged.

6 May 17 th 23 rd The first half of May had been generally warmer than normal. The first significant cold spell of the month arrived on May 19 th and continued through the rest of this week. Rainfall returned to a familiar pattern, spilling heavier amounts along the Ohio River and trending drier northward across the state. Severe weather was at a minimum this week with reported wind damage limited to just one county on a single day. Corn planting is wrapping up but cool temperatures are slowing crop germination and farmer tillage. The week began mild with the state average temperature at 9 F above normal. A warm front pushed through Indiana on May 17 th as higher temperatures expanded to cover the east half of the country. Not much changed the next day in Indiana although a cold front drew much closer to the state. This cold front moved across Indiana on May 19 th. The state temperature plummeted to 9 F below normal that day. High pressure in the cold air mass settled overhead Indiana on May 20 th and the state average temperature bottomed to 15 F below normal, the coldest day this week. High pressure was still overhead Indiana on May 21 st but air temperatures began to moderate day by day. The state temperature had rebounded to 11 F below normal then to 6 F below normal by May 22 nd. The ridge was sinking southward and warming but a new cold front was located on the Michigan border. This was a weak front, however, and was washed off the weather map the last day of the week. The original high pressure ridge had still hung around and as the week ended slid east of Indiana. The return wind flow behind this system allowed the state temperature to creep upward a few more degrees, closing the week at 2 F below normal. Over the full week the state temperature had averaged near 4 F below normal. Usually at this point in May daily maximum temperatures should range between 71 F and 78 F north to south across the state. Daily minimums normally vary from 50 F in far northern Indiana to 56 F in its far southwest corner. The warmest local daily maximum temperature among cooperative network stations was 90 F at the Evansville Museum on May 23 rd. The coolest minimum in this same network this week was 35 F on May 20 th at the NWS Northern Indiana office and at Garrett.
7 Most rain came in the first half of the week and generally fell in the southeast half of the state. Regionally about a third of an inch fell in northern and central Indiana with 0.8 across the south. These amounts equate to about 30% of normal in the north, 40% of normal in central sections, and 90% of normal in southern Indiana. The first day of the week was the wettest and the heaviest amounts fell along the Ohio River. Some daily reports from CoCoRaHS observers on the morning of May 17 th included 2.36 at Floyds Knobs, 1.59 in Charlestown, and 1.45 at Leopold. Two observers in Galena measured 1.75 and A little more rain fell the next few days and added to the weekly sum. For the week the heaviest totals included 2.54 in Floyds Knobs, 1.79 at Galena and Milltown, 1.63 in New Salisbury, and 1.56 at Leopold. Only Tipton county reported any severe weather this week. On May 18 th wind gusts ripped down 3 trees and shut down power in parts of the county. According to the May 19 th edition of the US Drought Monitor there was no change in Indiana soil dryness status from one week earlier. All or parts of 20 northern Indiana counties continue to be rated as abnormally dry in the D0 category. Generally this includes the region north of a Fort Wayne to Lafayette line except for western counties adjacent to Illinois. The total Indiana area included in the D0 category rating is 20% while the remaining 80% continues in normal soil moisture status for this time of year. The weekly USDA Indiana Crop Report notes that soybean planting continued this week while corn planting is nearly finished across the state. Cold overnight temperatures produced frost in spots that nipped fruits, berries, and melons. What damage occurred to these plants is unknown at this time. The cold also slowed germination of crops already in the ground and hampered drying of fields farmers are anxious to get planted. The report mentions surveyed farmers this week rated 21% of top soils and 16% of sub soils still with surplus moisture and too wet to work. May 24 th 31 st After a cool spell last week above normal temperatures returned on 7 of these last 8 days of May. Temperatures crashed on the final day to close out the month. It rained often and the heaviest daily amounts this month were recorded in the May 31 st morning reports. Isolated severe weather was
8 noted on May 26 th and 27 th. Widespread severe weather broke out across Indiana on the evening of May 30 th. An EF-1 tornado was confirmed in Marion county and a lightning strike started a garage fire in Newton county. There was significant damage in these events but no injuries. High pressure that had transported cool air into Indiana last week departed to eastern states on May 24 th. Southerly winds on the back side of this system returned much warmer air to the state. The daily state average temperature opened at 3 F above normal. As the high center moved into the Atlantic the next storm system pushed its warm front through Indiana the next day, lifting the state temperature to 7 F above normal. On May 26 th the Atlantic high center reversed direction and moved back onshore. This stalled all Midwest fronts which formed into one long stationary front stretching from Ontario through the Great Plains into Texas. Indiana remained east of this front in the warm air sector with the daily temperature rising to 9 F above normal, the warmest of the 8 day interval. Temperatures changed little the next day. Part of the stationary front converted into a weak cold front and inched closer to Indiana. This cold front passed through the state on May 28th. The temperature dipped only slightly to 5 F above normal as the air mass behind the cold front originated in the Pacific. Meanwhile a slowing cold front in upper Michigan was headed to Indiana. The fronts merged and stalled into a single stationary front over Indiana on May 29th. The temperature held nearly steady at 6 F above normal. By early May 30th the air had mixed so well that the stationary front disappeared on the weather map with no change in state temperature. A polar cold front crossed Indiana late on May 30th and into May 31st. Much colder air streamed into Indiana from Canada. Temperatures dived sharply in just an hour or two to 9 F below normal. Chilly air dominated the state in the final hours of May. Yet overall it was a warm 8 days with the state temperature averaging to 5 F above normal. Typically near the end of May daily maximum temperatures are expected to range from 74 F in far northern Indiana to 80 F in the far southwest. Daily minimums normally vary between 52 F and 58 F north to south. The warmest daily maximum temperature in the cooperative station network was 91 F at Brookville on May 8 th. The coolest minimum in this network was 31 F at Purdue University Airport on May 1 st. With several fronts in the vicinity of Indiana rain fell nearly every day. The bulk of the precipitation was found in the morning reports of May 31 st with the passage of the strong cold front. Regional 8-day totals were about 2.3 in northern Indiana, 1.8 in central sections, and 0.9 across the south. These amounts equate to nearly twice normal in the north, 140% of normal in central, and 70% of normal in southern Indiana. The heaviest precipitation fell on May 31 st in northwest and central Indiana. Some of the heavier amounts measured by CoCoRaHS volunteers that morning included 5.01 just southwest of Kokomo, 4.75 at Indian Heights, 4.02 west of Kokomo, and 3.96 near Russiaville and Wheatfield. These downpours caused localized flash flooding. Over the 8 days CoCoRaHS totals include 5.41 southwest of Kokomo, 5.22 in Indian Heights, 4.68 at Wheatfield, 4.61 in Hanna, and 4.41 at Demotte. Severe weather occurred on 3 days. High wind damage was limited to 3 counties on May 26 th. Wind gusts damaged a barn roof in Jay county. In Henry county the side of a pole barn was pushed in and tree limbs in the area were ripped down. Tree limbs were also reported down in Ripley county.
9 Large hail and damage due to high winds occurred the next day. Hail an inch in diameter was reported in Fulton and Perry counties. Also in Perry county high winds damaged several vehicles, homes, and trees. In northeast Indiana wind gusts downed trees which then fell into power lines. Limbs came off trees in Allen county while in DeKalb county a sign was ripped down and more trees fell. The most significant severe weather took place on the evening of May 30 th. An EF-1 tornado in Marion county with winds to 90 mph destroyed 2 garages and damaged several other homes, tore off shingles, and stacked 2 cars on top of each other. Some trees were uprooted and blocked roads. There were no injuries. In Newton county lightning struck a garage and set it on fire. The garage was a total loss and was not insured. One inch hail was reported in Kosciusko, Grant, and Boone counties. Damage due to high winds was extensive. In Grant county 60 mph gusts blew a tree onto a road in heavy rain, while in neighboring Madison county winds caused roof damage to a barn and 2 houses. Trees were downed including one that fell on a car. Winds blew a gazebo over in Kosciusko county while large limbs fell in Wells county. A tree knocked a fence over in Marion county. A 58 mph gust in Johnson county snapped a tree there. In southern Indiana a tree knocked down a power line in Knox county. A tree was snapped in Martin county while a tree fell on to a road in Posey county. According to the May 26 th edition of the US Drought Monitor there was no change in coverage of abnormally dry areas in northern Indiana but all or parts of 16 counties in southern Indiana were added to the D0 category. Generally this area is south of a line from Dale to Napoleon to St Leon. Generally this includes the region stretching from Spencer county in the west to Dearborn county in the east. The May 26 th rating placed 33% of total Indiana land area in abnormally dry status with the remaining 67% in normal soil moisture status for this time of year. The June 2 nd edition of the US Drought Monitor reflects the impacts of the heavy storms on May 30 th. No changes were made in southern Indiana but about half of the abnormally dry region in northern Indiana was removed, especially in the northwest. Parts or all of Porter, Newton, Laporte, St Joseph, Elkhart, Jasper, Starke, Marshall, White, Cass, Pulaski, and Allen counties were returned to normal soil moisture status. The revised numbers put 22% of total Indiana area in the abnormally dry D0 category with the remaining 78% in normal status. The Indiana Crop Report issued June 1 st notes that planting progress continued for corn and soybeans despite the rainy week. Planting progress has caught up to the normal 5-year average. Warm temperatures and rainfall has helped crops to emerge more quickly with most of the corn and half the soybeans now emerged. Some replanting will be needed in ponded areas where fields flooded. Some crops in southern Indiana are a concern due to recent unfavorable weather.
10
11 May 2015 Temperature Region Temperature Normal Deviation Northwest North Central Northeast West Central Central East Central Southwest South Central Southeast State Precipitation Region Precipitation Normal Deviation Percent of Normal Northwest North Central Northeast West Central Central East Central Southwest South Central Southeast State
12 Spring (March - May) Temperature Region Temperature Normal Deviation Northwest North Central Northeast West Central Central East Central Southwest South Central Southeast State Precipitation Region Precipitation Normal Deviation Percent of Normal Northwest North Central Northeast West Central Central East Central Southwest South Central Southeast State
13 2015 Annual (through May) Temperature Region Temperature Normal Deviation Northwest North Central Northeast West Central Central East Central Southwest South Central Southeast State Precipitation Region Precipitation Normal Deviation Percent of Normal Northwest North Central Northeast West Central Central East Central Southwest South Central Southeast State
14
15
16

17 Drought Summary from the U.S. Drought Monitor Below is a drought summary for the state of Indiana from the U.S. Drought Monitor. Areas in white are not experiencing any drought. Yellow areas are abnormally dry, but not considered a drought. Drought begins when the moisture levels become more severe, with beige, orange, red, and brown indicating increasing levels of drought (moderate, severe, extreme, and exceptional, respectively). The table below indicates what percentage of the state is drought free, and how much of the state is in drought by degree of severity (D1 - D4 category).

18 May 5 th Drought Summary
19 May 12 th Drought Summary
20 May 19 th Drought Summary
21 May 26 th Drought Summary
October 2011 Climate Summary
 Ken Scheeringa and Kayla Hudson Nov 4, 2011 http://www.iclimate.org October 2011 Climate Summary Month Summary October weather evolved as a two part story. Weather conditions the first half of the month
August 2013 Climate Summary
 Ken Scheeringa and Matt Price Sep 6, 2013 (765) 494-8105 http://www.iclimate.org August 2013 Climate Summary Month Summary August weather began cool and wet but became progressively warmer and drier through
August 2006 Summary. August 1-5
 Ashley Brooks (765) 494-6574 Sep 8, 2006 http://www.iclimate.org August 1-5 August 2006 Summary The heat wave that started during the end of July continued into the beginning parts of August with temperatures
July 2007 Climate Summary
 Dan Bowman (765) 494-6574 Sep 3, 2007 http://www.iclimate.org Summary July 2007 Climate Summary The month of July ended as a very unusual month. Many events occurred during the month of July that is not
August 2017 Climate Summary
 Ken Scheeringa And Andy Eggert Sep 7, 2017 (765) 494-8105 http://www.iclimate.org August 2017 Climate Summary Month Summary The coolest August in 13 years featured long cool and warm spells, below normal
May 2018 Climate Summary
 Ken Scheeringa and Andy Eggert Jun 7, 2018 (765) 494-8105 http://www.iclimate.org May 2018 Climate Summary Month Summary As the calendar turned from April to May temperatures flipped dramatically away
September 2011 Climate Summary
 Ken Scheeringa and Kayla Hudson Oct 5, 2011 (765) 494-8105 http://www.iclimate.org September 2011 Climate Summary Month Summary The final blast of summer heat arrived at the start of September. It lasted
September 2005 Climate Summary
 Ashley Brooks (765) 494-6574 Oct 5, 2005 http://iclimate.org September 2005 Climate Summary September 1-7 A cold front came through on the 1 st of the month, however little moisture was associated with
August 2015 Climate Summary
 Ken Scheeringa And Mary Rose Mangan Sep 4, 2015 (765) 494-8105 http://www.iclimate.org August 2015 Climate Summary Month Summary A very active wet summer weather pattern turned much calmer and drier in
November 2012 Climate Summary
 Ken Scheeringa and Kayla Hudson Dec 6, 2012 (765) 494-8105 http://www.iclimate.org November 2012 Climate Summary Month Summary November was one of those rare weather months in Indiana when not much happened:
December 2011 Climate Summary
 Ken Scheeringa and Kayla Hudson Jan 17, 2012 (765) 494-8105 http://www.iclimate.org December 2011 Climate Summary Month Summary What a difference a year makes! A year ago the misery of a harsh, cold, and
January 2008 Climate Summary
 Joseph Mays (765) 494-6574 Feb 5, 2008 http://www.iclimate.org Summary January 2008 Climate Summary January was a mix bag of conditions, with an oscillatory pattern developing. We experienced phases of
April 2016 Climate Summary
 Ken Scheeringa And Andy Eggert May 9, 2016 (765) 494-8105 http://www.iclimate.org April 2016 Climate Summary Month Summary One month but two seasons. The first half of April was cold with snow. Wind damage
June 2016 Climate Summary
 Ken Scheeringa And Andy Eggert Jul 8, 2016 (765) 494-8105 http://www.iclimate.org June 2016 Climate Summary Month Summary June was a warm month with below normal temperature on just 6 days. Rainfall was
April 2015 Climate Summary
 Ken Scheeringa And Mary Rose Mangan May 8, 2015 http://www iclimate org April 2015 Climate Summary Month Summary April was a month of extremes. Severe weather erupted on 4 days of the first week with multiple
October 2014 Climate Summary
 Ken Scheeringa And Matt Price Nov 10, 2014 (765) 494-8105 http://www.iclimate.org October 2014 Climate Summary Month Summary October featured a mix of weather. A very wet first half of the month evolved
March 2014 Climate Summary
 Ken Scheeringa And Matt Price Apr 8, 2014 (765) 494-8105 http://www.iclimate.org March 2014 Climate Summary Month Summary Winter had officially ended by the calendar but snow and cold persisted in Indiana
May 2016 Climate Summary
 Ken Scheeringa And Andy Eggert Jun 6, 2016 (765) 494-8105 http://www.iclimate.org May 2016 Climate Summary Month Summary Cold weather dominated in May until the last week of the month. May began wet but
June 2011 Climate Summary
 Ken Scheeringa (765) 494-8105 Jul 8, 2011 http://www.iclimate.org June 2011 Climate Summary Month Summary The abundance of extreme weather this year extended yet another month into June. This month has
September 2016 Climate Summary
 Ken Scheeringa And Andy Eggert Oct 6, 2016 (765) 494-8105 http://www.iclimate.org September 2016 Climate Summary Month Summary The warmest September in 77 years brought alternating weeks of dry and wet
July 2011 Climate Summary
 Ken Scheeringa (765) 494-8105 Aug 8, 2011 http://www.iclimate.org July 2011 Climate Summary Month Summary The upper atmospheric high pressure dome which baked the Texas area in heat and drought the past
September 2012 Climate Summary
 Ken Scheeringa and Kayla Hudson Oct 5, 2012 (765) 494-8105 http://www.iclimate.org September 2012 Climate Summary Month Summary Summer slipped away and it felt a lot more like autumn in Indiana this month
March 2016 Climate Summary
 Ken Scheeringa And Andy Eggert Apr 8, 2016 (765) 494-8105 http://www.iclimate.org March 2016 Climate Summary Month Summary Count March as the 7 th month in a row that the state average temperature has
November 2010 Climate Summary
 Ken Scheeringa (765) 494-8105 Dec 6, 2010 http://www.iclimate.org November 2010 Climate Summary Summary A four month drought in Indiana is collapsing as significant rain fell the final week of November.
January 2012 Climate Summary
 Ken Scheeringa and Kayla Hudson Feb 6, 2012 (765) 494-8105 http://www.iclimate.org January 2012 Climate Summary Month Summary Where is winter? This question found its way into many conversations throughout
June 2010 Climate Summary
 Ken Scheeringa (765) 494-8105 Jul 6, 2010 http://www.iclimate.org June 2010 Climate Summary Summary Summer like heat and humidity arrived in Indiana on May 22 nd and dominated our weather scene nearly
February 2017 Climate Summary
 Ken Scheeringa And Andy Eggert Mar 9, 2017 (765) 494-8105 http://www.iclimate.org February 2017 Climate Summary Month Summary February 2017 was the warmest February in Indiana since state climate records
October 2017 Climate Summary
 Ken Scheeringa and Andy Eggert Nov 6, 2017 (765) 494-8105 http://www.iclimate.org October 2017 Climate Summary Month Summary After more than three weeks of warm temperatures October turned suddenly cold
November 2014 Climate Summary
 Ken Scheeringa And Matt Price Dec 10, 2014 (765) 494-8105 http://www.iclimate.org November 2014 Climate Summary Month Summary Unseasonable cold headlined the Indiana and national news in November. The
June 2015 Climate Summary
 Ken Scheeringa And Mary Rose Mangan Jul 10, 2015 (765) 494-8105 http://www.iclimate.org June 2015 Climate Summary Month Summary Indiana set a new June rainfall record this month with a state average 8.99.
October 2012 Climate Summary
 Ken Scheeringa and Kayla Hudson Nov 8, 2012 (765) 494-8105 http://www.iclimate.org October 2012 Climate Summary Month Summary In a reversal from the hot and dry summer, cooler and wetter than normal conditions
November 2015 Climate Summary
 Ken Scheeringa And Mary Rose Mangan Dec 8, 2015 (765) 494-8105 http://www.iclimate.org November 2015 Climate Summary Month Summary November was much warmer than normal while precipitation was very near
April 2017 Climate Summary
 Ken Scheeringa And Andy Eggert May 8, 2017 (765) 494-8105 http://www.iclimate.org April 2017 Climate Summary Month Summary April was a very warm and wet month in Indiana, nearly setting a new monthly temperature
January 2017 Climate Summary
 Ken Scheeringa And Andy Eggert Feb 8, 2017 (765) 494-8105 http://www.iclimate.org January 2017 Climate Summary Month Summary The warmest January in 11 years was nearly 4 F warmer than December 2016. An
January 2006 Climate Summary
 Ashley Brooks (765) 494-6574 Feb 9, 2006 http://www.iclimate.org January 1-3 January 2006 Climate Summary Unseasonably warm conditions welcomed in the New Year with highs in the 40s across the northern
July 2010 Climate Summary
 Ken Scheeringa (765) 494-8105 Aug 4, 2010 http://www.iclimate.org July 2010 Climate Summary Summary The warm summer of 2010 continues. Daily state average temperatures were above normal on all but seven
August 2016 Climate Summary
 Ken Scheeringa And Andy Eggert Sep 12, 2016 (765) 494-8105 http://www.iclimate.org August 2016 Climate Summary Month Summary Hot but tranquil weather the first half of August transitioned to a tormented
November 2017 Climate Summary
 Ken Scheeringa and Andy Eggert Dec 8, 2017 (765) 494-8105 http://www.iclimate.org November 2017 Climate Summary Month Summary November temperatures alternated spells of warm and cool while precipitation
October 2016 Climate Summary
 Ken Scheeringa And Andy Eggert Nov 9, 2016 (765) 494-8105 http://www.iclimate.org October 2016 Climate Summary Month Summary October was the 9 th month so far this year to average above normal in temperature.
April 2013 Climate Summary
 Ken Scheeringa and Kayla Hudson May 6, 2013 (765) 494-8105 http://www.iclimate.org April 2013 Climate Summary Month Summary Temperatures bounced high and low this month, keeping Hoosiers guessing which
2011 Year in Review TORNADOES
 2011 Year in Review The year 2011 had weather events that will be remembered for a long time. Two significant tornado outbreaks in April, widespread damage and power outages from Hurricane Irene in August
January 2013 Climate Summary
 Ken Scheeringa and Kayla Hudson Feb 7, 2013 (765) 494-8105 http://www.iclimate.org January 2013 Climate Summary Month Summary Winter or spring? January featured several dramatic swings in temperature and
Champaign-Urbana 2001 Annual Weather Summary
 Champaign-Urbana 2001 Annual Weather Summary ILLINOIS STATE WATER SURVEY 2204 Griffith Dr. Champaign, IL 61820 wxobsrvr@sws.uiuc.edu Maria Peters, Weather Observer January: After a cold and snowy December,
May 2005 Climate Summary
 Ashley Brooks (765) 494-6574 Jun 7, 2005 http://iclimate.org May 2005 Climate Summary May 1-5 Early May was characterized by an upper-level trough that was in place over Indiana that brought in very cool
March 2009 Climate Summary
 Joseph Mays (765) 494-6574 Apr 1, 2009 http://www.iclimate.org Summary March 2009 Climate Summary March is in the books and it continued the trend of extreme weather we have experienced during the first
Champaign-Urbana 1998 Annual Weather Summary
 Champaign-Urbana 1998 Annual Weather Summary ILLINOIS STATE WATER SURVEY Audrey Bryan, Weather Observer 2204 Griffith Dr. Champaign, IL 61820 wxobsrvr@sparc.sws.uiuc.edu The development of the El Nìno
July 2014 Climate Summary
 Ken Scheeringa And Matt Price Aug 8, 2014 (765) 494-8105 http://www.iclimate.org July 2014 Climate Summary Month Summary July was unseasonably cool and drier than normal. Rainfall was light in parts of
INDIANAPOLIS, INDIANA
 The NWS FORM E-5 U.S. DEPARTMENT OF COMMERCE HYDROLOGIC SERVICE AREA: NATIONAL OCEANIC AND ATMOSPHERIC ADMINISTRATION NATIONAL WEATHER SERVICE INDIANAPOLIS, INDIANA REPORT FOR: MONTHLY REPORT OF RIVER
NWS FORM E-5 U.S. DEPARTMENT OF COMMERCE I HYDRO SERVICE AREA NOAA, NATIONAL WEATHER SERVICE I Indianapolis, IN MONTHLY REPORT
 NWS FORM E-5 U.S. DEPARTMENT OF COMMERCE I HYDRO SERVICE AREA NOAA, NATIONAL WEATHER SERVICE I Indianapolis, IN. 1-------------------- MONTHLY REPORT OF RIVER AND FLOOD CONDITIONSI REPORT FOR I November
The hydrologic service area (HSA) for this office covers Central Kentucky and South Central Indiana.
 for this office covers Central Kentucky and South Central Indiana.") January 2012 February 13, 2012 An X inside this box indicates that no flooding occurred within this hydrologic service area. January 2012 continued the string of wet months this winter. Rainfall was generally
January 2012 February 13, 2012 An X inside this box indicates that no flooding occurred within this hydrologic service area. January 2012 continued the string of wet months this winter. Rainfall was generally
SIGNIFICANT EVENTS Severe Storms November 1994 January 1996 August 1998 and May 2000 March 2002 May 2002 Champaign County
 SIGNIFICANT EVENTS Severe Storms November 1994 On Nov. 1, 1994, high winds gusted over 60 mph at times across the northwest third of Ohio. The highest measured wind gust was 63 mph at Columbus Grove (Putnam).
February 2016 Climate Summary
 Ken Scheeringa And Andy Eggert Mar 9, 2016 (765) 494-8105 http://www.iclimate.org February 2016 Climate Summary Month Summary February was the 6 th consecutive month with an above normal state average
November 2016 Climate Summary
 Ken Scheeringa And Andy Eggert Dec 15, 2016 (765) 494-8105 http://www.iclimate.org November 2016 Climate Summary Month Summary Unseasonably warm, pleasant, and sunny weather the first half of the month
2012 Growing Season Weather Summary for North Dakota. Adnan Akyüz and Barbara A. Mullins Department of Soil Science October 30, 2012
 2012 Growing Season Weather Summary for North Dakota Adnan Akyüz and Barbara A. Mullins Department of Soil Science October 30, 2012 Introduction The 2012 growing season (the period from April through September)
October 2010 Climate Summary
 Ken Scheeringa (765) 494-8105 Nov 5, 2010 http://www.iclimate.org October 2010 Climate Summary Summary Rain fell on about 10 days in October but did little to slow the drought raging across Indiana. For
The Pennsylvania Observer
 The Pennsylvania Observer May 31, 2012 May 2012 - Pennsylvania Weather Recap By: Paul Knight The majority of the fifth month had temperatures averaging well above seasonal levels with two distinct hot
July 2015 Climate Summary
 Ken Scheeringa And Mary Rose Mangan Aug 6, 2015 (765) 494-8105 http://www.iclimate.org July 2015 Climate Summary Month Summary Record setting rainfall in June persisted into the first three weeks of July.
NWS FORM E-5 U.S. DEPARTMENT OF COMMERCE HSA OFFICE:
 NWS FORM E-5 U.S. DEPARTMENT OF COMMERCE HSA OFFICE: NOAA, NATIONAL WEATHER SERVICE MONTHLY REPORT OF RIVER AND FLOOD CONDITIONS DATE: TO: North Webster, IN REPORT FOR (MONTH &YEAR): July 1998 August 5,
March 2018 Climate Summary
 Ken Scheeringa and Andy Eggert Apr 5, 2018 (765) 494-8105 http://www.iclimate.org March 2018 Climate Summary Month Summary March turned cold with below normal temperatures on two-thirds of its days. Along
April 2011 Climate Summary
 Ken Scheeringa (765) 494-8105 May 9, 2011 http://www.iclimate.org April 2011 Climate Summary Summary After somewhat of a respite in March Indiana weather ramped up with a vengeance in April. Extreme weather
IC ARTICLE 19. DESCRIBING REAL PROPERTY; INDIANA COORDINATE SYSTEM. IC Chapter 1. Designation of Indiana Coordinate System; Zones
 IC 32-19 ARTICLE 19. DESCRIBING REAL PROPERTY; INDIANA COORDINATE SYSTEM IC 32-19-1 Chapter 1. Designation of Indiana Coordinate System; Zones IC 32-19-1-1 Designation of systems Sec. 1. The systems of
January 2018 Climate Summary
 Ken Scheeringa and Andy Eggert Feb 8, 2018 (765) 494-8105 http://www.iclimate.org January 2018 Climate Summary Month Summary January temperature swings were amazing. In the first few days arctic cold pushed
The hydrologic service area (HSA) for this office covers Central Kentucky and South Central Indiana.
 for this office covers Central Kentucky and South Central Indiana.") MONTH YEAR January 2011 February 15, 2011 X An X inside this box indicates that no flooding occurred within this hydrologic service area. January 2011 was drier than normal in all locations in the area.
MONTH YEAR January 2011 February 15, 2011 X An X inside this box indicates that no flooding occurred within this hydrologic service area. January 2011 was drier than normal in all locations in the area.
The Pennsylvania Observer
 The Pennsylvania Observer April 2, 2009 March 2009 Pennsylvania Weather Recap Prepared by Curt Harpster For the month of March the saying, In like a lion and out like a lamb really fit the pattern quite
The Pennsylvania Observer
 The Pennsylvania Observer October 1, 2015 September 2015 - Pennsylvania Weather Recap By: Quinn Lease The month of September will be remembered for its above normal temperatures and dry conditions that
March 2012 Climate Summary
 Ken Scheeringa and Kayla Hudson Apr 4, 2012 (765) 494-8105 http://www.iclimate.org March 2012 Climate Summary Month Summary March was a month of weather extremes with records shattered almost as a daily
Monthly Long Range Weather Commentary Issued: APRIL 18, 2017 Steven A. Root, CCM, Chief Analytics Officer, Sr. VP,
 Monthly Long Range Weather Commentary Issued: APRIL 18, 2017 Steven A. Root, CCM, Chief Analytics Officer, Sr. VP, sroot@weatherbank.com MARCH 2017 Climate Highlights The Month in Review The average contiguous
Ch. 3: Weather Patterns
 Ch. 3: Weather Patterns Sect. 1: Air Mass & Fronts Sect. 2: Storms Sect. 3: Predicting the Weather Sect. 4: Weather forecasters use advanced technologies Ch. 3 Weather Fronts and Storms Objective(s) 7.E.1.3
2018 Year in Review for Central and Southeast Illinois By: Chris Geelhart, Meteorologist National Weather Service, Lincoln IL
 By: Chris Geelhart, Meteorologist National Weather Service, Lincoln IL While 2018 featured some significant out-of-season weather, including below zero temperatures in April and 90-degree highs in early
Weather and Climate Summary and Forecast Summer 2017
 Weather and Climate Summary and Forecast Summer 2017 Gregory V. Jones Southern Oregon University August 4, 2017 July largely held true to forecast, although it ended with the start of one of the most extreme
National Wildland Significant Fire Potential Outlook
 National Wildland Significant Fire Potential Outlook National Interagency Fire Center Predictive Services Issued: September, 2007 Wildland Fire Outlook September through December 2007 Significant fire
Fronts. Direction of Front
 Fronts Direction of Front Direction of Front Warm Front A cold air mass meets and displaces a warm air mass. Because the moving cold air is more dense, it moves under the less-dense warm air, pushing it
X An X inside this box indicates that no flooding occurred within this Hydrologic Service Area.
 NWS FORM E-5 U.S. DEPARTMENT OF COMMERCE HSA OFFICE: NOAA, NATIONAL WEATHER SERVICE MONTHLY REPORT OF RIVER AND FLOOD CONDITIONS DATE: TO: North Webster, IN REPORT FOR (MONTH &YEAR): January, 2003 February
MONTHLY REPORT OF RIVER AND FLOOD CONDITIONS
 NWS FORM E-5 U.S. DEPARTMENT OF COMMERCE HSA OFFICE: NOAA, NATIONAL WEATHER SERVICE NWS Northern Indiana (IWX) REPORT FOR (MONTH&YEAR): January 2005 MONTHLY REPORT OF RIVER AND FLOOD CONDITIONS DATE: February
but 2012 was dry Most farmers pulled in a crop
 After a winter that wasn t, conditions late in the year pointed to a return to normal snow and cold conditions Most farmers pulled in a crop but 2012 was dry b y M i k e Wr o b l e w s k i, w e a t h e
March 2011 Climate Summary
 Ken Scheeringa (765) 494-8105 Apr 5, 2011 http://www.iclimate.org March 2011 Climate Summary Summary The fast paced weather action of February slowed some in March. The major March weather features were
KANSAS CLIMATE SUMMARY May 2018
 KANSAS CLIMATE SUMMARY May 2018 From Cold to Hot May came close to setting the record as the hottest since 1895. The state-wide average temperature for the month was 70.6 o F. This was 7.2 degrees warmer
NATIONAL WEATHER SERVICE
 NWS Form E-5 (PRES. BY NWS Instruction 10-924) MONTHLY REPORT OF HYDROLOGIC CONDITIONS HYDROLOGIC SERVICE AREA (HSA) NORTHERN INDIANA (IWX) MONTH YEAR TO: Hydrologic Information Center, W/OS31 NOAA s National
The Pennsylvania Observer
 The Pennsylvania Observer August 3, 2015 July 2015 - Pennsylvania Weather Recap By: Arthur Person Although this seventh month of 2015 was fairly normal across Pennsylvania as a whole, the details reveal
Champaign-Urbana 1999 Annual Weather Summary
 Champaign-Urbana 1999 Annual Weather Summary ILLINOIS STATE WATER SURVEY 2204 Griffith Dr. Champaign, IL 61820 wxobsrvr@sws.uiuc.edu Maria Peters, Weather Observer A major snowstorm kicked off the new
The Pennsylvania Observer
 The Pennsylvania Observer September 3, 2008 Summer 2008 Weather Summary Written by: Brian Thompson The opening days of June started dry, but a warm front brought a widespread rain a couple of days into
Table 1. August average temperatures and departures from normal ( F) for selected cities.
 for selected cities.") Climate Summary for Florida August 2016 Prepared by Lydia Stefanova and David Zierden Florida Climate Center, The Florida State University, Tallahassee, Florida Online at: http://climatecenter.fsu.edu/products-services/summaries
Climate Summary for Florida August 2016 Prepared by Lydia Stefanova and David Zierden Florida Climate Center, The Florida State University, Tallahassee, Florida Online at: http://climatecenter.fsu.edu/products-services/summaries
CropCast Corn and Soybean Report Kyle Tapley Monday, March 20, 2017
 Accumulated Rainfall (inches) Accumulated GDDs Temperature ( F)/Wind Speed (mph) Precipitation (inches) CropCast Corn and Soybean Report Kyle Tapley Monday, March 20, 2017 Peoria, IL Regional Forecast
TFS WEATHER BRIEF. Monday, March 25
 TFS WEATHER BRIEF Monday, March 25 Review: The leading edge of cooler and drier air was pushing through Central and East TX this morning. A few lingering thunderstorms were in progress south of I-20 in
Monthly Long Range Weather Commentary Issued: July 18, 2014 Steven A. Root, CCM, President/CEO
 Monthly Long Range Weather Commentary Issued: July 18, 2014 Steven A. Root, CCM, President/CEO sroot@weatherbank.com JUNE 2014 REVIEW Climate Highlights The Month in Review The average temperature for
The Weather Wire. Contents: Summer 2018 Outlook. Summer 2018 Outlook Drought Monitor May Summary/Statistics June Preview Rainfall Totals
 The Weather Wire June 2018 Volume 25 Number 6 Contents: Summer 2018 Outlook Drought Monitor May Summary/Statistics June Preview Rainfall Totals Summer 2018 Outlook June 1 st marked the first day of meteorological
MIAMI-SOUTH FLORIDA National Weather Service Forecast Office
 MIAMI-SOUTH FLORIDA National Weather Service Forecast Office http://www.weather.gov/miami June 2015 South Florida Weather Summary Dry East, Wet West...Drought Remains SE Florida July 3, 2015: Depending
Nebraska experienced a wide
 Issue 1 August 2016 CLIMATE UPDATE A MONTHLY SUMMARY FROM THE neclimate.unl.edu August saw reprieve from dryness, cooler temps Overview Nebraska experienced a wide range of conditions across the state
Foundations of Earth Science, 6e Lutgens, Tarbuck, & Tasa
 Foundations of Earth Science, 6e Lutgens, Tarbuck, & Tasa Weather Patterns and Severe Weather Foundations, 6e - Chapter 14 Stan Hatfield Southwestern Illinois College Air masses Characteristics Large body
KANSAS CLIMATE SUMMARY August 2015
 KANSAS CLIMATE SUMMARY August 2015 Cool and Dry August was drier than normal in most of the state. State-wide average precipitation was 2.80 inches or 85 percent of normal. The Northeast division of the
Climate versus Weather
 Climate versus Weather What is climate? Climate is the average weather usually taken over a 30-year time period for a particular region and time period. Climate is not the same as weather, but rather,
NWS FORM E-5 U.S. DEPARTMENT OF COMMERCE HSA OFFICE:
 NWS FORM E-5 U.S. DEPARTMENT OF COMMERCE HSA OFFICE: NOAA, NATIONAL WEATHER SERVICE MONTHLY REPORT OF RIVER AND FLOOD CONDITIONS DATE: TO: North Webster, IN REPORT FOR (MONTH &YEAR): January 2001 February
Weather and Climate Summary and Forecast August 2018 Report
 Weather and Climate Summary and Forecast August 2018 Report Gregory V. Jones Linfield College August 5, 2018 Summary: July 2018 will likely go down as one of the top five warmest July s on record for many
Monthly Long Range Weather Commentary Issued: May 15, 2014 Steven A. Root, CCM, President/CEO
 Monthly Long Range Weather Commentary Issued: May 15, 2014 Steven A. Root, CCM, President/CEO sroot@weatherbank.com APRIL 2014 REVIEW Climate Highlights The Month in Review The average temperature for
Monthly Long Range Weather Commentary Issued: NOVEMBER 16, 2015 Steven A. Root, CCM, Chief Analytics Officer, Sr. VP, sales
 Monthly Long Range Weather Commentary Issued: NOVEMBER 16, 2015 Steven A. Root, CCM, Chief Analytics Officer, Sr. VP, sales sroot@weatherbank.com OCTOBER 2015 Climate Highlights The Month in Review The
How strong does wind have to be to topple a garbage can?
 How strong does wind have to be to topple a garbage can? Imagine winds powerful enough to pick up a truck and toss it the length of a football field. Winds of this extreme sometimes happen in a tornado.
Monthly Long Range Weather Commentary Issued: SEPTEMBER 19, 2016 Steven A. Root, CCM, Chief Analytics Officer, Sr. VP,
 Monthly Long Range Weather Commentary Issued: SEPTEMBER 19, 2016 Steven A. Root, CCM, Chief Analytics Officer, Sr. VP, sroot@weatherbank.com SEPTEMBER 2016 Climate Highlights The Month in Review The contiguous
Weekly Weather. Europe. February Flash. This Week: Warm East and Cold West; Heavy Rain and Snow in Some Areas
 Weekly Weather February 12 25 Flash US This Week: Warm East and Cold West; Heavy Rain and Snow in Some Areas A Look Ahead: Temperatures Run ; Severe Rain in the West Europe This Week: Cold Air Retreats
KANSAS CLIMATE SUMMARY April 2017
 KANSAS CLIMATE SUMMARY April 2017 Epic Blizzard While much of the month was warmer than normal, the last week brought a return to cold, wintery weather in the western third of the state, and cold rainy
NATIONAL WEATHER SERVICE
 NWS Form E-5 (PRES. BY NWS Instruction 10-924) MONTHLY REPORT OF HYDROLOGIC CONDITIONS HYDROLOGIC SERVICE AREA (HSA) MONTH YEAR TO: Hydrologic Information Center, W/OS31 NOAA s National Weather Service