October 2011 Climate Summary
|
|
|
- Patience Horn
- 5 years ago
- Views:
Transcription

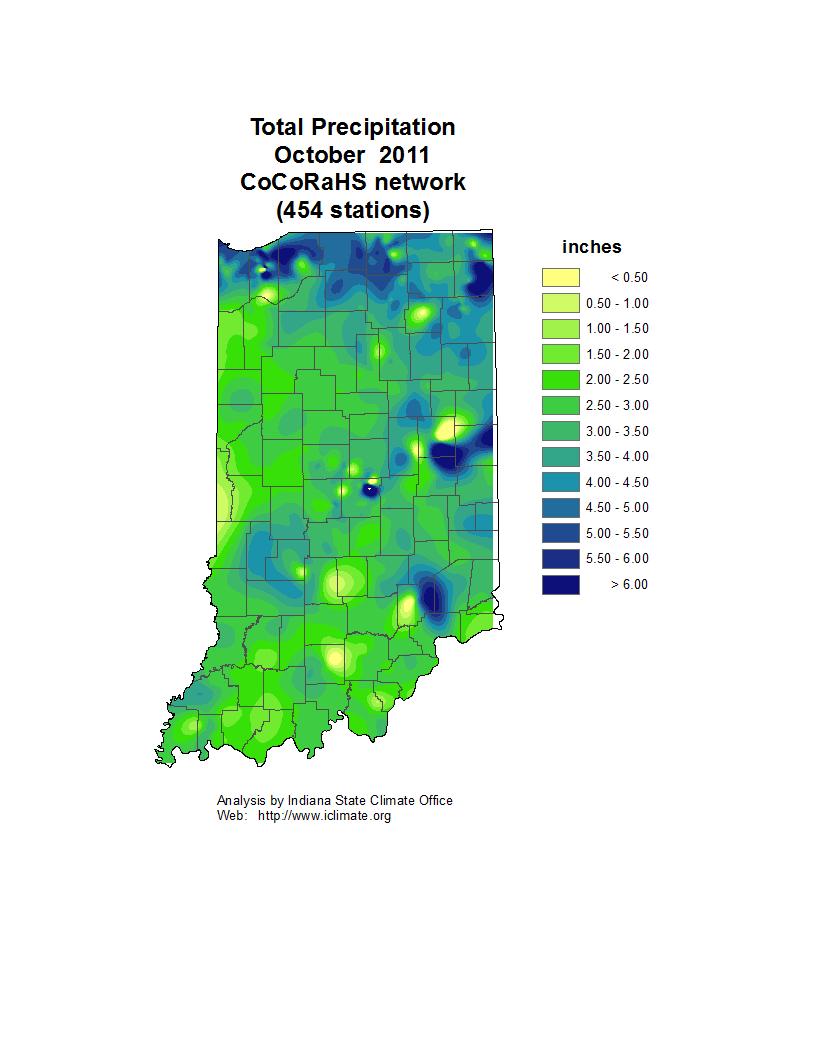
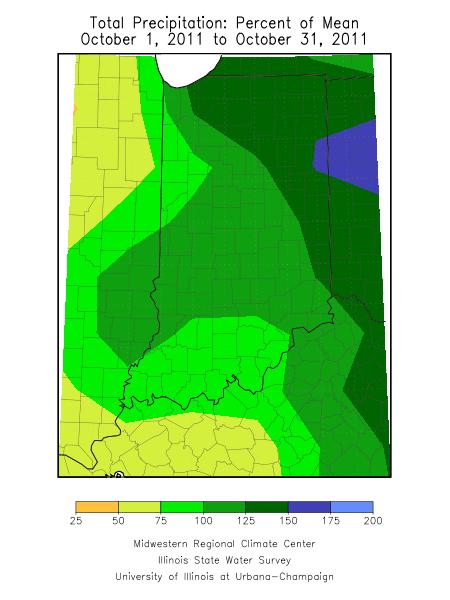
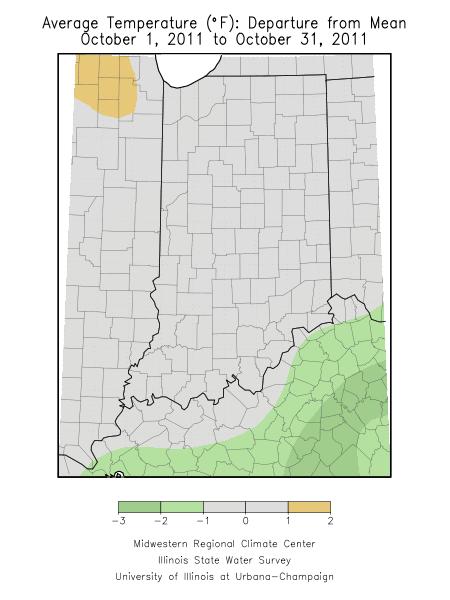
1 Ken Scheeringa and Kayla Hudson Nov 4, October 2011 Climate Summary Month Summary October weather evolved as a two part story. Weather conditions the first half of the month featured many sunny days, warm temperatures, and little rainfall. In contrast the second half was cloudy, cold, and stormy. Fit the halves together and October statistics reveal a month with temperatures very close to normal with precipitation totals slightly on the wet side. There was a significant storm on October 20 th but severe weather damage was absent this month in Indiana. Temperatures the first half of October averaged about 3.2 above normal, equally balanced by an average 3.3 below normal the second half. For the complete month state temperatures averaged to 54.0 which is 0.1 above or essentially right at normal. The day split was 16 days of below normal temperatures, 1 day at normal, and 14 days with above normal temperatures. There were 2 days this month when the daily state average temperature was at least 10 colder than normal and 3 days with the daily average at least 10 warmer than normal. The highest temperature of the month in Indiana was 88 on October 8 th at Terre Haute. The coldest temperature was 23 at Wanatah on October 30 th. State average rainfall in October was 3.32 inches, or 0.42 inch above normal. This amount ranks this month as the 42 nd wettest October since The most recent wetter October occurred in 2009 when its 6.79 inches was good for 4 th place in the record books. But the 7.72 inches recorded in 2001 ranked even higher in 2 nd place. On a regional basis October 2011 precipitation was 130% of normal in northern Indiana, about 120% of normal in central areas, and right at normal across the south. The heaviest single day rainfall was found in northern Indiana. Two CoCoRaHS observers in Mishawaka measured 2.92 and 2.79 inches at their rain gauges on the morning of October 20 th. Nearby the Winona Lake volunteer recorded 2.85 inches that day. The autumn drought hung on through the first half of October. When significant rains returned to the state in mid-month the final remnants of the Indiana 2011 drought which had begun in mid-july were eliminated. There was no severe weather damage this month but high wind and lakeshore flood warnings were issued for the Lake Michigan shore line of far northwest Indiana on October 19 th and 20 th. Wave heights of 10 to 15 feet were common across the lake with some reports of 20 to 25 foot waves in adjacent states. A storm system from Arkansas which eventually nearly circled Indiana, had merged twice with other low pressure centers before racing north to Michigan as a greatly intensified storm.
2 October 1 st 8 th October began with a shiver. The daily state average temperature on October 1 st was near 11 below normal with Indiana on the tail end of a departing storm system. A strong ridge of high pressure moved in the next day and would begin to ramp up Indiana temperatures each day for the rest of the week. By October 4 th temperatures had rebounded to normal as the high pressure center had moved east to Ohio from Wisconsin and replaced northerly winds over Indiana with warmer winds from the south. The warm up continued and by October 6 th state average temperatures had reached 7 above normal. A new cold front in Michigan was now poised to enter our state and end the warming spell but Indiana temperatures continued to rise, peaking at almost 12 above normal. The dry air on each side of the front had mixed such that the cold front dissolved. The high pressure centers on each side of the old front now merged into an even stronger ridge sprawling the eastern half of the country, extending the week of sunny skies and warm temperatures a bit longer. Daily state average temperatures on October 8 th held at near 11 above normal, or 22 warmer than when the week began. The steep transition from cold to warm conditions resulted in an average weekly temperature of just 1 above normal. Typical daily maximum temperatures the opening week of October range from 69 in far northern Indiana to 78 in the extreme southwest. Normal daily minimums would vary between 47 to 51 north to south across the state. Generally only a few hundreths inch of rain fell the first day of the month across Indiana. The rest of the week was pleasant and dry with a long string of warm sunny days. For the week rain amounts averaged near 0.05 inch in northern Indiana and only trace amounts in central and southern regions. These totals are less than 10% of normal in the north. Local moderate showers were all limited to about a half inch or less for the week. The highest rain totals reported by CoCoRaHS observers included 0.57 inch in Gas City, 0.41 inch at Kingsbury, and 0.36 inch in Anderson. These amounts all came on a single day. The October 4 th edition of the National Drought Monitor indicates the late September rains continued to help alleviate the late summer drought in Indiana. Another third of the state area was restored to drought free conditions since the previous week, as the 55% of Indiana in no drought status improved to 89% of the state area. The 39% area coverage of abnormally dry (D0 category) soils improved to just 9% of total area by October 4 th. Finally the 6% of total area classified in moderate drought (D1 status) improved to 2% of the area in that class. The only two remaining drought areas in Indiana are the west border counties of west central Indiana surrounding Terre Haute, and the extreme north central Indiana areas of Laporte, St Joseph, and Elkhart counties. The most intense drought area continues to be in Vermillion and Vigo counties.
3 October 9 th 15 th A strong ridge of high pressure sustained mostly sunny skies across Indiana for 10 days after it arrived on October 2 nd. After a very chilly start temperatures had rebounded sharply a week ago to 11 above normal. As this second week began daily average temperatures held steady at near 9 above normal. Indiana was set in a large sector of warm air bounded by two stationary fronts, one across northern Michigan, and the second stretching from North Dakota to Texas. Both fronts dissolved and did not impact Indiana. On October 12 th the ridge moved east of our state. A storm system followed, and by October 14 th a cold front had immediately followed a warm front, the only fronts to traverse Indiana this week. Cold and windy conditions behind the fronts allowed temperatures to slip a little more each day, ending the week at 1 below normal. For the week overall daily temperatures averaged 5 above normal. Typically this second week of the month daily maximum temperatures should vary between 66 and 74 north to south across Indiana. Normal daily minimums range from 46 in the far north to 49 in southwest counties. The first half of the week was dry under the influence of the strong ridge. Then rain arrived along with the pair of fronts. There was no severe weather associated with these fronts. On average for the week about 0.5 inch of rain fell in northern Indiana, 0.4 in central areas, and 0.7 inch across the south. These totals are about 80% of normal in central Indiana, 110% of normal in the north, and 130% of normal in the southern region. As expected there were spots with locally heavier rainfall. The CoCoRaHS reports of October 13 th mention 1.98 inch in Princeton, 1.80 inch at Patoka, and 1.56 inch in Evansville. Some of the weekly rainfall totals include 1.60 inch and 1.55 inch at two Porter locations while Francisco noted 1.54 inch. Melody Hill had 1.51 inch. The October 11 th edition of the National Drought Monitor indicates no change in drought status throughout Indiana this week as weekly rainfall did not deviate far from normal.
4 October 16 th 22 nd Last week s warm temperatures have vanished as every day but one this week was cooler than normal. A warm front moved through Indiana on October 16th, quickly followed by a cold front the next day. State average temperatures which began at 4 above normal dipped to nearly 7 below normal. A massive storm system over Hudson Bay had pushed these fronts through to start the week before falling apart. A second storm from Arkansas made the greater impact on Indiana this week as it circled our state, merging twice with other low pressure centers along the way. The first merger over Tennessee intensified the storm over the eastern mountains. A second merger on October 20th with a low center over New Jersey redirected the storm northward to Michigan. High winds over northern Indiana impacted the Lake Michigan shore line as the storm continued to intensify into an occluded low center. The next day the storm raced northeast into Canada, calming weather conditions over Indiana to close the week. Daily average temperatures changed little during this latest storm, holding at about 4 to 5 below normal. For the week daily state temperatures averaged near 4 below normal. Typically in mid-october daily maximum temperatures should range from 62 to 70 north to south across the state. Normal daily minimums would vary from 43 in far northern counties to 46 in far southwest Indiana. During the week a zonal wind flow pattern in the upper atmosphere had morphed into a split jet stream. The northern branch traveled west to east across far northern Canada while the second branch plunged southward, forming a deep cutoff low system in eastern states. This intense system promoted heavy rainfall over Indiana, especially in midweek. Regional rainfall totals were about 2.5 inches across northern and central Indiana, and 1.6 inches in the south. These totals are about 1.7 times normal in southern Indiana but near three and a half times normal elsewhere. CoCoRaHS daily rainfall reports on October 20th included 2.92 inches at Mishawaka, 2.85 inches in Winona Lake, with reports from Fort Wayne and Goshen near 2.75 inches. For the week two Mishawaka observers noted 3.84 and 3.62 inches while the Goshen rain gage collected 3.55 inches. The Warsaw volunteer had 3.49 inches while Chesterton noted 3.45 inches. High wind and lakeshore flood warnings were issued for the Lake Michigan shoreline of far northwest Indiana for October 19th and 20th. Wave heights of 10 to 15 feet were common across the lake with some wave reports of 20 to 25 feet in the Chicago region.
5 The heavier rainfall of late has virtually ended the autumn Indiana drought. The October 18th edition of the National Drought Monitor indicates that less than 1% of the total Indiana land area remains abnormally dry (D0 category). The start of abnormally dry conditions began on July 19 th this year. October 23 rd 31 st The cooler than normal trend since mid-october carried through to the end of the month expect for a brief warm up from about October 24 th through 26 th. Wind flow patterns in the upper atmosphere were generally zonal (directly west to east) across the country, with mostly weak storms riding short pressure waves quickly across Indiana. Daily state temperatures were about 2 to 5 above normal during the 3 warmer days. Two cold fronts passed through Indiana after October 23 rd but the first front was weak and had no impact on temperatures. The second front tapped into cold Canadian air and dragged temperatures more than 10 lower, settling at near 7 below normal during the final 4 days of the month. Two weak low pressure troughs passed through Indiana during these last few days to reinforce the cold air flow into the state. Overall for the 9 day interval daily state temperatures averaged 2 below normal. Usually daily maximum temperatures at the end of this month should vary from 60 in far northern Indiana to 67 in the extreme southwest. Normal daily minimums range from about 42 in our northern counties to 45 in the south. Light rain showers came every day in northern Indiana. In the rest of the state rain fell mostly the first half of the interval with the cold fronts. Regionally for the 9 days about 0.7 inch fell in northern and southern areas with about 0.4 inch across central Indiana. These totals are near normal in northern Indiana, slightly above normal in the south and about 60% of normal in central sections. The heaviest local daily rainfall was measured the morning of October 27 th by CoCoRaHS volunteers in southern Indiana. Some amounts included 1.18 inch in Mauckport and 1.17 inch in Evansville. Two Newburgh observers noted 1.16 and 1.12 inch that day. But the largest totals over the 9 days were found in northwest Indiana. CoCoRaHS numbers there included 1.50 inch in Gary, while two Valparaiso rain gauges recorded 1.49 and 1.44 inch. Two Portage volunteers noted 1.48 and 1.45 inches for the 9 day interval.
6 The October 25 th edition of the National Drought Monitor states the 2011 Indiana drought has now ended. The entire state is considered drought free as the last 1% of area listed in abnormally dry status (D0 class) a week ago has received adequate moisture. October 2011 Temperature Region Temperature Normal Deviation Northwest North Central Northeast West Central Central East Central Southwest South Central Southeast State Precipitation Region Precipitation Normal Deviation Percent of Normal Northwest North Central Northeast West Central Central East Central Southwest South Central Southeast State
7 Autumn 2011 (so far September - October) Temperature Region Temperature Normal Deviation Northwest North Central Northeast West Central Central East Central Southwest South Central Southeast State Precipitation Region Precipitation Normal Deviation Percent of Normal Northwest North Central Northeast West Central Central East Central Southwest South Central Southeast State
8 2011 Annual so far Temperature Region Temperature Normal Deviation Northwest North Central Northeast West Central Central East Central Southwest South Central Southeast State Precipitation Region Precipitation Normal Deviation Percent of Normal Northwest North Central Northeast West Central Central East Central Southwest South Central Southeast State
9
10
11
12 Drought Summary from the U.S. Drought Monitor Below is a drought summary for the state of Indiana from the U.S. drought monitor. Areas in white are not experiencing any drought. Yellow areas are abnormally dry, but not entirely considered a drought. Drought begins when the moisture levels become more severe, with beige, orange, red, and brown indicating increasing levels of drought (moderate, severe, extreme, and exceptional, respectively). The table below indicates how much of the state is not under drought conditions, and also how much of the state is under drought conditions from its respective column upwards. For example, October 4 th has 1.7% of Indiana under at least D1-D4 drought status, 11.3% under at least D0 through D4 drought status, and 88.7% drought free. Subtracting the D1-D4 category (1.7%) from the D0-D4 category (11.3%), tells us that 9.6% of Indiana is in D0 category alone (abnormally dry). Please note, however, that these areas are not exact, and much of this drought map has been created from reports throughout the state and in estimation, so use this information as a general view rather than for specifics.
13 October 4 th Drought Summary

14 October 11 th Drought Summary
15 October 18 th Drought Summary
16 October 25 th Drought Summary
17 November 1 st Drought Summary
July 2007 Climate Summary
 Dan Bowman (765) 494-6574 Sep 3, 2007 http://www.iclimate.org Summary July 2007 Climate Summary The month of July ended as a very unusual month. Many events occurred during the month of July that is not
December 2011 Climate Summary
 Ken Scheeringa and Kayla Hudson Jan 17, 2012 (765) 494-8105 http://www.iclimate.org December 2011 Climate Summary Month Summary What a difference a year makes! A year ago the misery of a harsh, cold, and
January 2008 Climate Summary
 Joseph Mays (765) 494-6574 Feb 5, 2008 http://www.iclimate.org Summary January 2008 Climate Summary January was a mix bag of conditions, with an oscillatory pattern developing. We experienced phases of
November 2012 Climate Summary
 Ken Scheeringa and Kayla Hudson Dec 6, 2012 (765) 494-8105 http://www.iclimate.org November 2012 Climate Summary Month Summary November was one of those rare weather months in Indiana when not much happened:
August 2013 Climate Summary
 Ken Scheeringa and Matt Price Sep 6, 2013 (765) 494-8105 http://www.iclimate.org August 2013 Climate Summary Month Summary August weather began cool and wet but became progressively warmer and drier through
September 2011 Climate Summary
 Ken Scheeringa and Kayla Hudson Oct 5, 2011 (765) 494-8105 http://www.iclimate.org September 2011 Climate Summary Month Summary The final blast of summer heat arrived at the start of September. It lasted
March 2014 Climate Summary
 Ken Scheeringa And Matt Price Apr 8, 2014 (765) 494-8105 http://www.iclimate.org March 2014 Climate Summary Month Summary Winter had officially ended by the calendar but snow and cold persisted in Indiana
October 2014 Climate Summary
 Ken Scheeringa And Matt Price Nov 10, 2014 (765) 494-8105 http://www.iclimate.org October 2014 Climate Summary Month Summary October featured a mix of weather. A very wet first half of the month evolved
November 2010 Climate Summary
 Ken Scheeringa (765) 494-8105 Dec 6, 2010 http://www.iclimate.org November 2010 Climate Summary Summary A four month drought in Indiana is collapsing as significant rain fell the final week of November.
October 2012 Climate Summary
 Ken Scheeringa and Kayla Hudson Nov 8, 2012 (765) 494-8105 http://www.iclimate.org October 2012 Climate Summary Month Summary In a reversal from the hot and dry summer, cooler and wetter than normal conditions
November 2014 Climate Summary
 Ken Scheeringa And Matt Price Dec 10, 2014 (765) 494-8105 http://www.iclimate.org November 2014 Climate Summary Month Summary Unseasonable cold headlined the Indiana and national news in November. The
August 2017 Climate Summary
 Ken Scheeringa And Andy Eggert Sep 7, 2017 (765) 494-8105 http://www.iclimate.org August 2017 Climate Summary Month Summary The coolest August in 13 years featured long cool and warm spells, below normal
May 2005 Climate Summary
 Ashley Brooks (765) 494-6574 Jun 7, 2005 http://iclimate.org May 2005 Climate Summary May 1-5 Early May was characterized by an upper-level trough that was in place over Indiana that brought in very cool
August 2006 Summary. August 1-5
 Ashley Brooks (765) 494-6574 Sep 8, 2006 http://www.iclimate.org August 1-5 August 2006 Summary The heat wave that started during the end of July continued into the beginning parts of August with temperatures
September 2016 Climate Summary
 Ken Scheeringa And Andy Eggert Oct 6, 2016 (765) 494-8105 http://www.iclimate.org September 2016 Climate Summary Month Summary The warmest September in 77 years brought alternating weeks of dry and wet
2011 Year in Review TORNADOES
 2011 Year in Review The year 2011 had weather events that will be remembered for a long time. Two significant tornado outbreaks in April, widespread damage and power outages from Hurricane Irene in August
October 2017 Climate Summary
 Ken Scheeringa and Andy Eggert Nov 6, 2017 (765) 494-8105 http://www.iclimate.org October 2017 Climate Summary Month Summary After more than three weeks of warm temperatures October turned suddenly cold
November 2015 Climate Summary
 Ken Scheeringa And Mary Rose Mangan Dec 8, 2015 (765) 494-8105 http://www.iclimate.org November 2015 Climate Summary Month Summary November was much warmer than normal while precipitation was very near
January 2013 Climate Summary
 Ken Scheeringa and Kayla Hudson Feb 7, 2013 (765) 494-8105 http://www.iclimate.org January 2013 Climate Summary Month Summary Winter or spring? January featured several dramatic swings in temperature and
NWS FORM E-5 U.S. DEPARTMENT OF COMMERCE I HYDRO SERVICE AREA NOAA, NATIONAL WEATHER SERVICE I Indianapolis, IN MONTHLY REPORT
 NWS FORM E-5 U.S. DEPARTMENT OF COMMERCE I HYDRO SERVICE AREA NOAA, NATIONAL WEATHER SERVICE I Indianapolis, IN. 1-------------------- MONTHLY REPORT OF RIVER AND FLOOD CONDITIONSI REPORT FOR I November
January 2006 Climate Summary
 Ashley Brooks (765) 494-6574 Feb 9, 2006 http://www.iclimate.org January 1-3 January 2006 Climate Summary Unseasonably warm conditions welcomed in the New Year with highs in the 40s across the northern
July 2010 Climate Summary
 Ken Scheeringa (765) 494-8105 Aug 4, 2010 http://www.iclimate.org July 2010 Climate Summary Summary The warm summer of 2010 continues. Daily state average temperatures were above normal on all but seven
The hydrologic service area (HSA) for this office covers Central Kentucky and South Central Indiana.
 for this office covers Central Kentucky and South Central Indiana.") January 2012 February 13, 2012 An X inside this box indicates that no flooding occurred within this hydrologic service area. January 2012 continued the string of wet months this winter. Rainfall was generally
January 2012 February 13, 2012 An X inside this box indicates that no flooding occurred within this hydrologic service area. January 2012 continued the string of wet months this winter. Rainfall was generally
September 2005 Climate Summary
 Ashley Brooks (765) 494-6574 Oct 5, 2005 http://iclimate.org September 2005 Climate Summary September 1-7 A cold front came through on the 1 st of the month, however little moisture was associated with
May 2018 Climate Summary
 Ken Scheeringa and Andy Eggert Jun 7, 2018 (765) 494-8105 http://www.iclimate.org May 2018 Climate Summary Month Summary As the calendar turned from April to May temperatures flipped dramatically away
August 2015 Climate Summary
 Ken Scheeringa And Mary Rose Mangan Sep 4, 2015 (765) 494-8105 http://www.iclimate.org August 2015 Climate Summary Month Summary A very active wet summer weather pattern turned much calmer and drier in
March 2016 Climate Summary
 Ken Scheeringa And Andy Eggert Apr 8, 2016 (765) 494-8105 http://www.iclimate.org March 2016 Climate Summary Month Summary Count March as the 7 th month in a row that the state average temperature has
September 2012 Climate Summary
 Ken Scheeringa and Kayla Hudson Oct 5, 2012 (765) 494-8105 http://www.iclimate.org September 2012 Climate Summary Month Summary Summer slipped away and it felt a lot more like autumn in Indiana this month
March 2018 Climate Summary
 Ken Scheeringa and Andy Eggert Apr 5, 2018 (765) 494-8105 http://www.iclimate.org March 2018 Climate Summary Month Summary March turned cold with below normal temperatures on two-thirds of its days. Along
January 2017 Climate Summary
 Ken Scheeringa And Andy Eggert Feb 8, 2017 (765) 494-8105 http://www.iclimate.org January 2017 Climate Summary Month Summary The warmest January in 11 years was nearly 4 F warmer than December 2016. An
NATIONAL WEATHER SERVICE
 January 2016 February 9, 2016 This was a dry month across the HSA despite one large and several smaller snowfalls. Most locations ended up 1-2 inches below normal for the month. The driest locations at
Monthly Long Range Weather Commentary Issued: SEPTEMBER 19, 2016 Steven A. Root, CCM, Chief Analytics Officer, Sr. VP,
 Monthly Long Range Weather Commentary Issued: SEPTEMBER 19, 2016 Steven A. Root, CCM, Chief Analytics Officer, Sr. VP, sroot@weatherbank.com SEPTEMBER 2016 Climate Highlights The Month in Review The contiguous
Weather and Climate Summary and Forecast Summer 2017
 Weather and Climate Summary and Forecast Summer 2017 Gregory V. Jones Southern Oregon University August 4, 2017 July largely held true to forecast, although it ended with the start of one of the most extreme
The Pennsylvania Observer
 The Pennsylvania Observer October 1, 2015 September 2015 - Pennsylvania Weather Recap By: Quinn Lease The month of September will be remembered for its above normal temperatures and dry conditions that
Air Masses, Fronts, Storm Systems, and the Jet Stream
 Air Masses, Fronts, Storm Systems, and the Jet Stream Air Masses When a large bubble of air remains over a specific area of Earth long enough to take on the temperature and humidity characteristics of
The Pennsylvania Observer
 The Pennsylvania Observer August 3, 2015 July 2015 - Pennsylvania Weather Recap By: Arthur Person Although this seventh month of 2015 was fairly normal across Pennsylvania as a whole, the details reveal
2012 Growing Season Weather Summary for North Dakota. Adnan Akyüz and Barbara A. Mullins Department of Soil Science October 30, 2012
 2012 Growing Season Weather Summary for North Dakota Adnan Akyüz and Barbara A. Mullins Department of Soil Science October 30, 2012 Introduction The 2012 growing season (the period from April through September)
2018 Year in Review for Central and Southeast Illinois By: Chris Geelhart, Meteorologist National Weather Service, Lincoln IL
 By: Chris Geelhart, Meteorologist National Weather Service, Lincoln IL While 2018 featured some significant out-of-season weather, including below zero temperatures in April and 90-degree highs in early
The Pennsylvania Observer
 The Pennsylvania Observer September 3, 2008 Summer 2008 Weather Summary Written by: Brian Thompson The opening days of June started dry, but a warm front brought a widespread rain a couple of days into
NIDIS Weekly Climate, Water and Drought Assessment Summary. Upper Colorado River Basin July 31, 2012
 NIDIS Weekly Climate, Water and Drought Assessment Summary Upper Colorado River Basin July 31, 2012 Fig. 1: July month-to-date precipitation in inches. Fig. 2: SNOTEL WYTD precipitation percentiles (50%
April 2013 Climate Summary
 Ken Scheeringa and Kayla Hudson May 6, 2013 (765) 494-8105 http://www.iclimate.org April 2013 Climate Summary Month Summary Temperatures bounced high and low this month, keeping Hoosiers guessing which
Monthly Long Range Weather Commentary Issued: July 18, 2014 Steven A. Root, CCM, President/CEO
 Monthly Long Range Weather Commentary Issued: July 18, 2014 Steven A. Root, CCM, President/CEO sroot@weatherbank.com JUNE 2014 REVIEW Climate Highlights The Month in Review The average temperature for
National Wildland Significant Fire Potential Outlook
 National Wildland Significant Fire Potential Outlook National Interagency Fire Center Predictive Services Issued: September, 2007 Wildland Fire Outlook September through December 2007 Significant fire
May 2015 Climate Summary
 Ken Scheeringa And Mary Rose Mangan Jun 8, 2015 (765) 494-8105 http://www.iclimate.org May 2015 Climate Summary Month Summary May was a very warm month. Rainfall averaged near normal but was distributed
April 2015 Climate Summary
 Ken Scheeringa And Mary Rose Mangan May 8, 2015 http://www iclimate org April 2015 Climate Summary Month Summary April was a month of extremes. Severe weather erupted on 4 days of the first week with multiple
January 2018 Climate Summary
 Ken Scheeringa and Andy Eggert Feb 8, 2018 (765) 494-8105 http://www.iclimate.org January 2018 Climate Summary Month Summary January temperature swings were amazing. In the first few days arctic cold pushed
NWS FORM E-5 U.S. DEPARTMENT OF COMMERCE HSA OFFICE:
 NWS FORM E-5 U.S. DEPARTMENT OF COMMERCE HSA OFFICE: NOAA, NATIONAL WEATHER SERVICE MONTHLY REPORT OF RIVER AND FLOOD CONDITIONS DATE: TO: North Webster, IN REPORT FOR (MONTH &YEAR): July 1998 August 5,
Weather and Climate Summary and Forecast August 2018 Report
 Weather and Climate Summary and Forecast August 2018 Report Gregory V. Jones Linfield College August 5, 2018 Summary: July 2018 will likely go down as one of the top five warmest July s on record for many
February 2017 Climate Summary
 Ken Scheeringa And Andy Eggert Mar 9, 2017 (765) 494-8105 http://www.iclimate.org February 2017 Climate Summary Month Summary February 2017 was the warmest February in Indiana since state climate records
October 2016 Climate Summary
 Ken Scheeringa And Andy Eggert Nov 9, 2016 (765) 494-8105 http://www.iclimate.org October 2016 Climate Summary Month Summary October was the 9 th month so far this year to average above normal in temperature.
March 2009 Climate Summary
 Joseph Mays (765) 494-6574 Apr 1, 2009 http://www.iclimate.org Summary March 2009 Climate Summary March is in the books and it continued the trend of extreme weather we have experienced during the first
July 2011 Climate Summary
 Ken Scheeringa (765) 494-8105 Aug 8, 2011 http://www.iclimate.org July 2011 Climate Summary Month Summary The upper atmospheric high pressure dome which baked the Texas area in heat and drought the past
The Pennsylvania Observer
 The Pennsylvania Observer January 5, 2009 December 2008 Pennsylvania Weather Recap The final month of 2008 was much wetter than average and a bit colder than normal. In spite of this combination, most
June 2010 Climate Summary
 Ken Scheeringa (765) 494-8105 Jul 6, 2010 http://www.iclimate.org June 2010 Climate Summary Summary Summer like heat and humidity arrived in Indiana on May 22 nd and dominated our weather scene nearly
DEPARTMENT OF EARTH & CLIMATE SCIENCES Name SAN FRANCISCO STATE UNIVERSITY Nov 29, ERTH 360 Test #2 200 pts
 DEPARTMENT OF EARTH & CLIMATE SCIENCES Name SAN FRANCISCO STATE UNIVERSITY Nov 29, 2018 ERTH 360 Test #2 200 pts Each question is worth 4 points. Indicate your BEST CHOICE for each question on the Scantron
January 2012 Climate Summary
 Ken Scheeringa and Kayla Hudson Feb 6, 2012 (765) 494-8105 http://www.iclimate.org January 2012 Climate Summary Month Summary Where is winter? This question found its way into many conversations throughout
NIDIS Drought and Water Assessment
 NIDIS Drought and Water Assessment PRECIPITATION The images above use daily precipitation statistics from NWS COOP, CoCoRaHS, and CoAgMet stations. From top to bottom, and left to right: most recent 7-days
The hydrologic service area (HSA) for this office covers Central Kentucky and South Central Indiana.
 for this office covers Central Kentucky and South Central Indiana.") MONTH YEAR January 2011 February 15, 2011 X An X inside this box indicates that no flooding occurred within this hydrologic service area. January 2011 was drier than normal in all locations in the area.
MONTH YEAR January 2011 February 15, 2011 X An X inside this box indicates that no flooding occurred within this hydrologic service area. January 2011 was drier than normal in all locations in the area.
NIDIS Intermountain West Drought Early Warning System February 12, 2019
 NIDIS Intermountain West Drought Early Warning System February 12, 2019 Precipitation The images above use daily precipitation statistics from NWS COOP, CoCoRaHS, and CoAgMet stations. From top to bottom,
Illinois Drought Update, December 1, 2005 DROUGHT RESPONSE TASK FORCE Illinois State Water Survey, Department of Natural Resources
 Illinois Drought Update, December 1, 2005 DROUGHT RESPONSE TASK FORCE Illinois State Water Survey, Department of Natural Resources For more drought information please go to http://www.sws.uiuc.edu/. SUMMARY.
KANSAS CLIMATE SUMMARY January 2018
 KANSAS CLIMATE SUMMARY January 2018 Some welcome moisture After an extended period with little to no moisture, parts of Kansas recorded some significant precipitation. At Tribune, a small snow event on
Monthly Long Range Weather Commentary Issued: APRIL 18, 2017 Steven A. Root, CCM, Chief Analytics Officer, Sr. VP,
 Monthly Long Range Weather Commentary Issued: APRIL 18, 2017 Steven A. Root, CCM, Chief Analytics Officer, Sr. VP, sroot@weatherbank.com MARCH 2017 Climate Highlights The Month in Review The average contiguous
New Hampshire State Climate Office Dr. Mary D. Stampone, State Climatologist
 New Hampshire State Climate Office Dr. Mary D. Stampone, State Climatologist University of New Hampshire c/o Department of Geography 73 Main Street Durham, NH 03824 Phone: 603-862-3136 Fax: 603-862-4362
What a Hurricane Needs to Develop
 Weather Weather is the current atmospheric conditions, such as air temperature, wind speed, wind direction, cloud cover, precipitation, relative humidity, air pressure, etc. 8.10B: global patterns of atmospheric
May 2016 Climate Summary
 Ken Scheeringa And Andy Eggert Jun 6, 2016 (765) 494-8105 http://www.iclimate.org May 2016 Climate Summary Month Summary Cold weather dominated in May until the last week of the month. May began wet but
A summary of the weather year based on data from the Zumwalt weather station
 ZUMWALT PRAIRIE WEATHER 2016 A summary of the weather year based on data from the Zumwalt weather station Figure 1. An unusual summer storm on July 10, 2016 brought the second-largest precipitation day
Weather and Climate Summary and Forecast April 2018 Report
 Weather and Climate Summary and Forecast April 2018 Report Gregory V. Jones Linfield College April 4, 2018 Summary: A near Miracle March played out bringing cooler and wetter conditions to the majority
NIDIS Intermountain West Drought Early Warning System October 17, 2017
 NIDIS Drought and Water Assessment NIDIS Intermountain West Drought Early Warning System October 17, 2017 Precipitation The images above use daily precipitation statistics from NWS COOP, CoCoRaHS, and
Foundations of Earth Science, 6e Lutgens, Tarbuck, & Tasa
 Foundations of Earth Science, 6e Lutgens, Tarbuck, & Tasa Weather Patterns and Severe Weather Foundations, 6e - Chapter 14 Stan Hatfield Southwestern Illinois College Air masses Characteristics Large body
UNITED STATES AND SOUTH AMERICA OUTLOOK (FULL REPORT) Thursday, December 28, 2017
 Thursday, December 28, 2017") T-storm Weather Summary Despite scattered t-storms Sat.-Sun. in central and northern areas in Argentina, more will likely be needed especially in sunflower areas of the southwest. Some t-storms likely
T-storm Weather Summary Despite scattered t-storms Sat.-Sun. in central and northern areas in Argentina, more will likely be needed especially in sunflower areas of the southwest. Some t-storms likely
SEPTEMBER 2013 REVIEW
 Monthly Long Range Weather Commentary Issued: October 21, 2013 Steven A. Root, CCM, President/CEO sroot@weatherbank.com SEPTEMBER 2013 REVIEW Climate Highlights The Month in Review The average temperature
Fronts. Direction of Front
 Fronts Direction of Front Direction of Front Warm Front A cold air mass meets and displaces a warm air mass. Because the moving cold air is more dense, it moves under the less-dense warm air, pushing it
Climate. Annual Temperature (Last 30 Years) January Temperature. July Temperature. Average Precipitation (Last 30 Years)
 January Temperature. July Temperature. Average Precipitation (Last 30 Years)") Climate Annual Temperature (Last 30 Years) Average Annual High Temp. (F)70, (C)21 Average Annual Low Temp. (F)43, (C)6 January Temperature Average January High Temp. (F)48, (C)9 Average January Low Temp.
Climate Annual Temperature (Last 30 Years) Average Annual High Temp. (F)70, (C)21 Average Annual Low Temp. (F)43, (C)6 January Temperature Average January High Temp. (F)48, (C)9 Average January Low Temp.
Weather and Climate Summary and Forecast October 2018 Report
 Weather and Climate Summary and Forecast October 2018 Report Gregory V. Jones Linfield College October 4, 2018 Summary: Much of Washington, Oregon, coastal California and the Bay Area and delta region
NIDIS Intermountain West Drought Early Warning System November 21, 2017
 NIDIS Drought and Water Assessment NIDIS Intermountain West Drought Early Warning System November 21, 2017 Precipitation The images above use daily precipitation statistics from NWS COOP, CoCoRaHS, and
1. Which weather map symbol is associated with extremely low air pressure? A) B) C) D) 2. The diagram below represents a weather instrument.
 B) C) D) 2. The diagram below represents a weather instrument.") 1. Which weather map symbol is associated with extremely low air pressure? 2. The diagram below represents a weather instrument. Which weather variable was this instrument designed to measure? A) air pressure
1. Which weather map symbol is associated with extremely low air pressure? 2. The diagram below represents a weather instrument. Which weather variable was this instrument designed to measure? A) air pressure
Precipitation. Standardized Precipitation Index. NIDIS Intermountain West Drought Early Warning System September 5, 2017
 9/6/2017 NIDIS Drought and Water Assessment NIDIS Intermountain West Drought Early Warning System September 5, 2017 Precipitation The images above use daily precipitation statistics from NWS COOP, CoCoRaHS,
November 28, 2017 Day 1
 November 28, 2017 Day 1 Air Masses & Fronts Teachers- please out the sheet (right) for the students to fill in as we go! Review: Clouds & Precipitation? What are the 4 different clouds? Status, Cumulus,
X An X inside this box indicates that no flooding occurred within this Hydrologic Service Area.
 NWS FORM E-5 U.S. DEPARTMENT OF COMMERCE HSA OFFICE: NOAA, NATIONAL WEATHER SERVICE MONTHLY REPORT OF RIVER AND FLOOD CONDITIONS DATE: TO: North Webster, IN REPORT FOR (MONTH &YEAR): January, 2003 February
Weather and Climate Summary and Forecast October 2017 Report
 Weather and Climate Summary and Forecast October 2017 Report Gregory V. Jones Linfield College October 4, 2017 Summary: Typical variability in September temperatures with the onset of fall conditions evident
The Pennsylvania Observer
 The Pennsylvania Observer April 2, 2009 March 2009 Pennsylvania Weather Recap Prepared by Curt Harpster For the month of March the saying, In like a lion and out like a lamb really fit the pattern quite
Champaign-Urbana 1998 Annual Weather Summary
 Champaign-Urbana 1998 Annual Weather Summary ILLINOIS STATE WATER SURVEY Audrey Bryan, Weather Observer 2204 Griffith Dr. Champaign, IL 61820 wxobsrvr@sparc.sws.uiuc.edu The development of the El Nìno
Champaign-Urbana 1999 Annual Weather Summary
 Champaign-Urbana 1999 Annual Weather Summary ILLINOIS STATE WATER SURVEY 2204 Griffith Dr. Champaign, IL 61820 wxobsrvr@sws.uiuc.edu Maria Peters, Weather Observer A major snowstorm kicked off the new
November 2016 Climate Summary
 Ken Scheeringa And Andy Eggert Dec 15, 2016 (765) 494-8105 http://www.iclimate.org November 2016 Climate Summary Month Summary Unseasonably warm, pleasant, and sunny weather the first half of the month
Monthly Long Range Weather Commentary Issued: APRIL 1, 2015 Steven A. Root, CCM, President/CEO
 Monthly Long Range Weather Commentary Issued: APRIL 1, 2015 Steven A. Root, CCM, President/CEO sroot@weatherbank.com FEBRUARY 2015 Climate Highlights The Month in Review The February contiguous U.S. temperature
Ch. 3: Weather Patterns
 Ch. 3: Weather Patterns Sect. 1: Air Mass & Fronts Sect. 2: Storms Sect. 3: Predicting the Weather Sect. 4: Weather forecasters use advanced technologies Ch. 3 Weather Fronts and Storms Objective(s) 7.E.1.3
Colorado CoCoRaHS. Colorado CoCoRaHS. Because Every Drop Counts! November 2014 Volume 2, Issue 11
 U.S. PRECIPITATION (% OF AVERAGE) LOOKING BACK AT OCTOBER 2014 October was a fairly dry month for much of the nation with the exception of the Pacific Northwest, portions of New England and the Tennessee
Custom Weather Forecast
 1 of 23 Custom Weather Forecast 2018 Chicago Yacht Club s Race To Mackinac- Cruising Division Disclaimer: The user assumes all risk related to the use of this Custom Weather Forecast. The crew of the participating
April 2017 Climate Summary
 Ken Scheeringa And Andy Eggert May 8, 2017 (765) 494-8105 http://www.iclimate.org April 2017 Climate Summary Month Summary April was a very warm and wet month in Indiana, nearly setting a new monthly temperature
Monthly Long Range Weather Commentary Issued: NOVEMBER 16, 2015 Steven A. Root, CCM, Chief Analytics Officer, Sr. VP, sales
 Monthly Long Range Weather Commentary Issued: NOVEMBER 16, 2015 Steven A. Root, CCM, Chief Analytics Officer, Sr. VP, sales sroot@weatherbank.com OCTOBER 2015 Climate Highlights The Month in Review The
NatGasWeather.com Daily Report
 NatGasWeather.com Daily Report Issue Time: 5:15 pm EST Sunday, February 28 th, 2016 for Monday, Feb 29 th 7-Day Weather Summary (February 28 th March 5 th ): High pressure will dominate much of the US
L.O Students will learn about factors that influences the environment
 Name L.O Students will learn about factors that influences the environment Date 1. At the present time, glaciers occur mostly in areas of A) high latitude or high altitude B) low latitude or low altitude
Mid-latitude Cyclones & Air Masses
 Lab 9 Mid-latitude Cyclones & Air Masses This lab will introduce students to the patterns of surface winds around the center of a midlatitude cyclone of low pressure. The types of weather associated with
WeatherManager Weekly
 Issue 288 July 14, 2016 WeatherManager Weekly Industries We Serve Agriculture Energy/Utilities Construction Transportation Retail Our Weather Protection Products Standard Temperature Products Lowest Daily
2011 National Seasonal Assessment Workshop for the Eastern, Southern, & Southwest Geographic Areas
 2011 National Seasonal Assessment Workshop for the Eastern, Southern, & Southwest Geographic Areas On January 11-13, 2011, wildland fire, weather, and climate met virtually for the ninth annual National
Monthly Long Range Weather Commentary Issued: February 15, 2015 Steven A. Root, CCM, President/CEO
 Monthly Long Range Weather Commentary Issued: February 15, 2015 Steven A. Root, CCM, President/CEO sroot@weatherbank.com JANUARY 2015 Climate Highlights The Month in Review During January, the average
Monthly Long Range Weather Commentary Issued: May 15, 2014 Steven A. Root, CCM, President/CEO
 Monthly Long Range Weather Commentary Issued: May 15, 2014 Steven A. Root, CCM, President/CEO sroot@weatherbank.com APRIL 2014 REVIEW Climate Highlights The Month in Review The average temperature for
RR#4 - Multiple Choice
 1. The map below shows the amount of snowfall, in inches, produced by a lake-effect snowstorm in central New York State. The wind that produced this snowfall pattern most likely came from the 1) northeast
Weather and Climate Summary and Forecast Fall/Winter 2016
 Weather and Climate Summary and Forecast Fall/Winter 2016 Gregory V. Jones Southern Oregon University November 5, 2016 After a year where we were seemingly off by a month in terms of temperatures (March
NATIONAL WEATHER SERVICE
 NWS Form E-5 (PRES. BY NWS Instruction 10-924) MONTHLY REPORT OF HYDROLOGIC CONDITIONS HYDROLOGIC SERVICE AREA (HSA) NORTHERN INDIANA (IWX) MONTH YEAR TO: Hydrologic Information Center, W/OS31 NOAA s National