June 2011 Climate Summary
|
|
|
- Shanon James
- 6 years ago
- Views:
Transcription

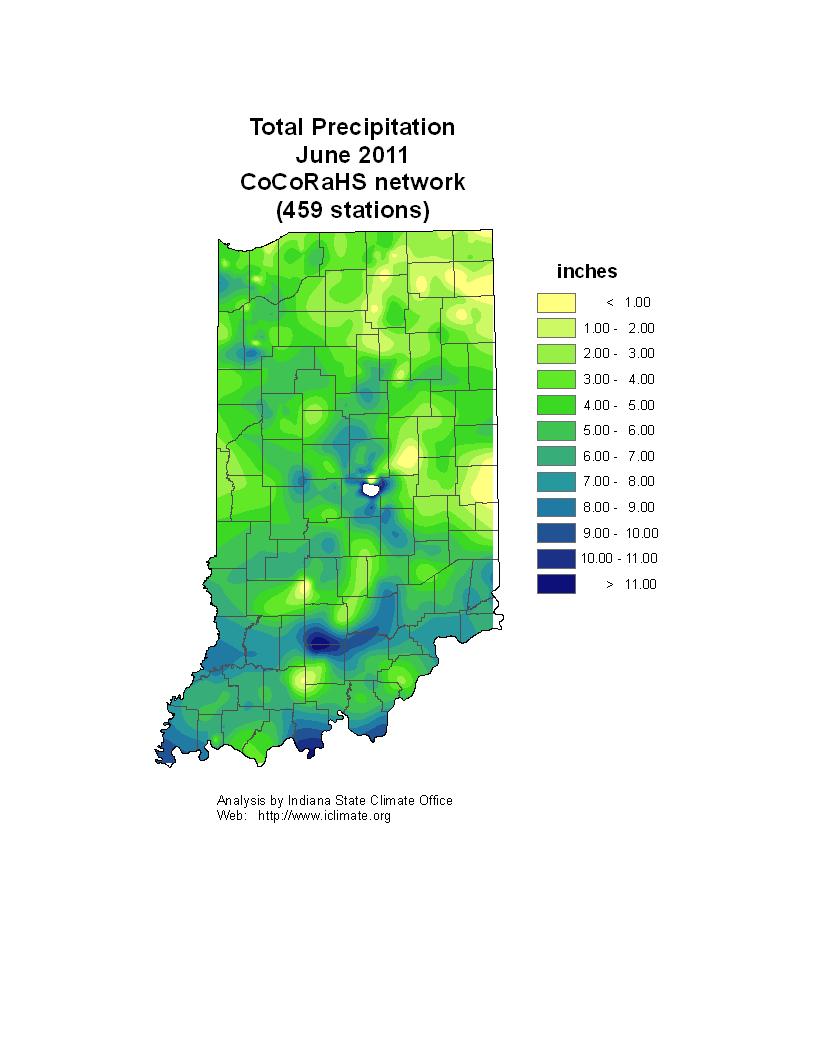
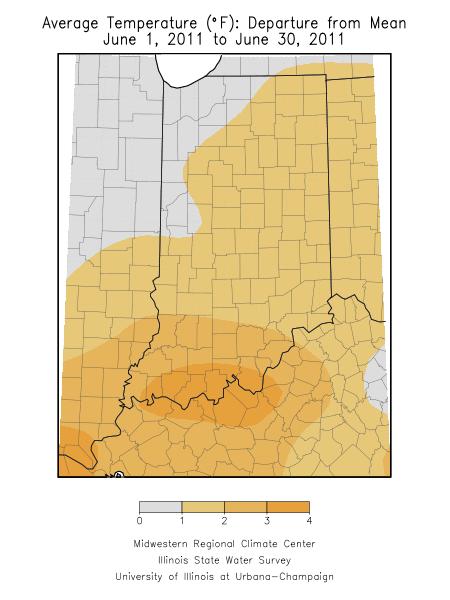
1 Ken Scheeringa (765) Jul 8, June 2011 Climate Summary Month Summary The abundance of extreme weather this year extended yet another month into June. This month has a reputation for its severe weather, however, so this may not surprise many Hoosiers. Weather related impacts around Indiana in June included 4 confirmed tornadoes, more than 50 water rescues during flash flooding, bridge washouts, river flooding, home fires caused by lightning, and 2 vehicle drivers killed by falling trees. Summer got off to a fast start with a hot first ten days of June. Then a week of cooler than normal weather set in. Temperatures the rest of the month were generally normal to slightly cooler than normal. Overall for the month the state average temperature calculated to 72.6, which is 1.6 above normal and places this month as the 26 th warmest June in Indiana since Last year s June temperature of 74.2 was warmer and ranked in 11 th place. The split in June 2011 was 15 days of above normal temperature, 13 days of below, and 2 days at normal temperature. The daily mean temperature was never more than 10 below normal, and was at least 10 above normal on 3 days. The highest recorded temperature of the month was 100 on June 5 th at Terre Haute. The coldest observed temperature was 36 at Chalmers on June 25 th. The state average precipitation total of 5.34 inches ranks June 2011 as the 22 nd wettest June on record in Indiana. The most recent wetter May was last year when the state precipitation was 7.69 inches and ranked in 3 rd place. The single wettest day in June 2011 among CoCoRaHS reporters was at Mitchell with 4.66 inches recorded on June 26 th. The West Baden volunteer measured 4.54 inches the next day, the second highest daily rainfall this month. On a regional basis June precipitation averaged about 4.0 inches in northern Indiana, 4.8 inches in central, and 6.9 inches in the south. These area totals are right about normal in northern and central Indiana and about 170% of normal in the southern region. Severe weather was noted on 10 days this June, including a string of 5 consecutive days between June 18 th and 22 nd. Four tornadoes were confirmed on June 19 th, 22 nd, and 26 th with two unconfirmed on June 4 th. At least 26 reports of hail were received by the National Weather Service this month. But it was high winds during storms that proved deadly. In two accidents on June 4 th and 21 st, large trees snapped and fell on top of two moving vehicles, killing each driver while injuring passengers. As expected in severe weather high winds slammed scores of trees into power lines, flipped vehicles, and destroyed many buildings. In a few cases trees penetrated all floors of homes into basements. Torrential rainfall in central Indiana washed out major highway bridges and triggered more than 50 water rescue calls to stranded motorists. One small Indiana town was completely isolated by flooded highways. Lightning strikes started several home attic fires. Heavy
2 rainfall in southwest Indiana started another round of river flooding in late June. Week by week descriptions and details of these many severe events and their impacts are found in the narratives which follow below. June 1 st 10 th Suddenly it was summer. The calendar says summer begins on June 21 st but the weather got a jump on the season with hot temperatures in Indiana this week. All of the first 10 days this month had state average temperatures above normal. A 100 temperature on June 5 th at Terre Haute was the warmest reported temperature across the state. At several locations this was the earliest heat wave in any year since The month opened at 9 above normal then fell to 2 above normal behind a dry cold front. As high pressure moved east of the state temperatures rose to 13 above normal by June 4 th in advance of the next storm system. Severe weather erupted throughout the northwest quarter of Indiana on June 4 th as a warm front stalled over our state. The warm front washed out the next day and temperatures dropped to 6 above normal for the next few days. A strong Bermuda ridge moved inland from the Atlantic and soon dominated the eastern half of the country. Unseasonably warm conditions followed, as Indiana temperatures rebounded to prior levels at 12 above normal by June 8 th. The next day a strong cool air mass was on the march southward from central Canada. On June 10 th this cold front reached Indiana triggering a second round of severe weather, dumping heavy rain, and causing temperatures to fall a few degrees to 7 above normal to close out the 10 day interval. Overall it was a warm 10 days with Indiana temperatures averaging about 8 above normal. Normally at this time of year daily maximum temperatures should range between 79 and 86 north to south across the state. Daily minimums typically vary from 57 in far northern counties to 64 in the far southwest. There were two severe weather episodes over the 10 days, on June 4 th and 10 th, and these events largely accounted for all the precipitation which fell. The first storm yielded about a third of an inch of rain in northern Indiana, a little more than a half inch in central, but only about 0.15 inch across the south. The second storm generated about an inch in northern Indiana and a few tenths inch elsewhere. For the 10 days regional rainfall totaled near 1.4 inch in northern Indiana, about 0.8 inch in central, and just a quarter inch in southern Indiana. These totals are near normal in the north, but just 60% of normal in central Indiana, and less than 20% of normal in southern Indiana. There were of course much heavier amounts in the thunderstorms of northwest and north central Indiana. On the morning of June 5 th three CoCoRaHS observers near Kokomo independently measured 3.55, 3.05, and 2.97 inches there On June 10 th the Merrillville volunteer received 4.33 inches and the Peru observer had 3.17 inches. For the full 10 day period the heaviest sums were noted in Lake county, including 5.05 inches in Dyer, reports of 5.02 and 4.59 inches at St John, and 4.90 inches in Crown Point. The severe weather on June 4 th was the more damaging event, resulting in 2 unconfirmed tornadoes, 9 reports of hail, and 67 high wind reports. The public reported a tornado touched down near a campground in Pulaski county and a second in White county, but these reports remain unconfirmed.
3 Hail fell in Miami, Howard, Tipton, Wells and Pulaski counties with diameters ranging between 1.0 and 1.75 inches. High winds caused 1 death in Madison county. A tree fell on a vehicle leaving Mounds State Park during the storm, killing 1 and injuring another 3 people inside. Wind speeds ranged from 58 mph to 82 mph across Indiana during this storm, damaging roofs and bringing down an enormous number of trees on power lines and vehicles, and blocking roads. Some power outages continued for 3 days in rural areas. The most intense damage occurred in southern Lake and northern Jasper counties. In Lake county a semi-truck was flipped over by the wind and the roof blown off a roadside weighing station. Garages, farm buildings, and grain bins were destroyed while trees fell on and through houses. In one St John home a tree fell through all levels of the house and into the basement. In Jasper county three grain bins and a barn were lifted up and carried high across a road without touching parked cars on the opposite side. Utility equipment suffered extensive damage in northern parts of the county. Up to 92,000 Indiana customers in northern Indiana lost electricity in the storm. In White county at least 30 utility poles were snapped and a barn roof was blown off. Flash flooding in Carroll county required the rescue of a man from his car swept off the road while a woman needed help to escape her flooded home. To the east in Blackford county windows were blown out of homes. In Madison county there were flash floods, while poles and trees came down, and commercial roofs were carried away. Fallen trees blocked major highways in Marion, Montgomery, and Porter counties. Grain bins and a barn roof were taken off in Miami county. More roofs came off in Warren and Pulaski counties. A smaller local storm occurred in White, Tippecanoe, and Fountain counties on June 9 th in advance of the cold front. Power was knocked out for hundreds of customers that morning but no other damage was reported. The real storm action would happen over a larger area the next day. The second major severe storm took place on June 10 th but was not as devastating as the June 4 th event. One-inch hail was noted in Delaware, Madison, Tipton, and Marshall counties. The hail in Delaware and Madison counties fell from the skies for 10 minutes, covering the ground. Power poles and trees came down in Delaware, Randolph, and Boone counties. Trees fell on cars in Putnam county and on a mobile home in Knox county. There were 17 reports of high wind damage, mostly along a line across central Indiana between Parke and Randolph counties. Winds ranged in speed from 60 mph to 74 mph. With all the rain these past months the mosquito population has exploded in Indiana. Northern counties particularly are battling this problem in June now that hot weather has arrived to accelerate the mosquito breeding cycle. On a positive note the drier weather at the start of June has allowed Indiana farmers to make headway towards finishing planting of field crops. At the close of this 10 day interval the Indiana Agricultural Statistics Office reports that 96% of corn has now been planted compared to the normal progress of 98% completed by this time. Soybean planting is 78% complete compared to the normal 86%. This places soybean planting about 6 days behind the normal schedule.
4 June 11 th 17 th After a torrid start to June last week, temperatures flipped into a mostly cooler than normal regime this second week. Between June 12th and 15th state temperatures averaged 5 to 6 below the normal for this time of year. A warm up was underway near the end of the week as temperatures recovered to 2 above normal. Overall this week temperatures averaged about 2 below normal around Indiana. Typically daily maximum temperatures would range between 83 and 89 north to south across the state. Daily minimums normally vary from 61 in far northern counties to 66 in southwest Indiana. There was more rainfall this week than last but without the drama of two major severe weather events. A cold front passed through Indiana on June 12th, generally producing less than an inch of rain. Three days of mostly dry weather followed as the cool air mass moved eastward with a high pressure system. An occluded front crossed the state on June 16th and squeezed out roughly another inch of moisture. Upper atmosphere winds were light this week allowing surface fronts to stall in lazy summer fashion. In fact the national surface weather map of June 17th featured a triplet of stationary fronts: one near the Canadian border; a second from Iowa across northern Indiana; and a third straddling southern states from Oklahoma to Georgia. The fronts moving through the state this week triggered storms which together generated about 1.2 inches of rain in northern Indiana, 1.4 inches in central sections, and 2.0 inches across southern Indiana. These amounts are right about normal in the north, 25% above normal in central, and double the normal amount in southern Indiana. Isolated heavier thunderstorms on June 11th in advance of the cold front dumped 3.32 inches in the CoCoRaHS gauge in Lawrenceburg, 3.26 inches at Aurora, 3.21 inches at Austin, and 3.10 inches in Moores Hill. The heavier weekly totals included 4.74 inches in Seymour, 4.01 inches in Lawrenceburg, 3.96 inches at Moores Hill, and 3.93 inches in Aurora. Storm weary Hoosiers caught a break this week with only two reports of wind storm damage. In southwest Indiana a home lost part of its roof in Stendal while a large tree fell and damaged a vehicle. Utility electrical equipment was also damaged there. Nearby in Dale a cable transmission tower was blown over, an electrical pole was snapped, and some road signs were carried away in the high winds.
5 June 18 th 24 th Severe weather made a return to our state this week with two confirmed tornadoes in far southern Indiana. Hail was reported in central Indiana on two days and wind damage was common statewide the first half of the week. One man was killed in Tippecanoe county when a tree fell on the vehicle he was driving during a strong thunderstorm. Temperatures did not stray too far from normal. A stationary front over Indiana on June 18 th morphed into a weak cold front the next day, then rebounded as a warm front on June 20 th. State average temperatures during this time held to within 1 of normal. A ridge in the upper atmosphere then coaxed warmer air northward into Indiana and surface temperatures rose to 4 above normal in midweek. A cold front on June 23 rd was reinforced by another cold push at the close of the week causing temperatures to slip to 6 below normal. Overall for the week temperatures balanced right at normal. Typically this third week of June daily maximum temperatures vary from 84 in northern Indiana to 90 in the far southwest. Daily minimums normally range between 63 and 68 north to south across the state. With frontal systems in our vicinity rain fell every day with the heavier amounts arriving with the warm air mass. Late in the week pesky showers circulated east to west across Indiana around a sluggish upper low pressure system as it exited to our east. For the week about 1.3 inches was noted across northern Indiana, 2.1 inches in central sections, and 2.8 inches in the south. These totals are near 160% of normal in northern areas, about 230% of normal in central Indiana, and three times normal in the southern part of the state. The greatest single day totals included 4.25 inches at Charlestown on June 24 th, 4.10 inches measured on June 20 th in Castleton, 4.08 inches reported by the CoCoRaHS observer in Birdseye on June 18 th, and 4.00 inches collected in the rain gage on June 20 th in Westfield. For the week the Elizabeth observer noted 6.84 inches while 6.43 inches fell at Indianapolis and 6.36 inches was recorded in Maukport. Severe weather was nearly a daily occurrence. On June 18 th 70 mph winds in southern Indiana took down trees, power lines, and a firehouse roof. There were 12 reports of wind damage from Posey, Vanderburgh, Spencer, Knox, Crawford, Orange, Washington, and Harrison counties.
6 The next day on June 19 th an EF0 tornado was confirmed in Perry county. Fortunately this tornado was so brief it did little damage. But wind damage to trees and power lines continued in Harrison, Scott, and Jefferson counties in southern Indiana and in Newton county in the northwest. There were also 11 reports of hail up to 1.75 inch in diameter in Martin, Lawrence, Morgan, Johnson, and Marion counties. Heavy storms targeted central Indiana on June 20 th. Torrential rainfall of up to 7 inches came in waves of thunderstorms, especially impacting Shelby, Johnson, and Marion counties. High water standing on roadways stalled vehicles in several cities and small towns. A bridge was washed out on a main Indianapolis highway and interstate ramps were closed on the east side of the city. The city fire department responded to 56 water rescue calls. The National Weather Service reported its Indianapolis flash flood gauge had reached its highest level since Some state highways were closed in Shelby county. During the storms all travel into and out of Sheridan was shut down due to high water on roadways. City streets in many central Indiana towns were closed. A home in Dayton was set on fire by a lightning strike as were several attics in at least 24 homes in Marion and Johnson counties. A roof at a construction site in Greenwood collapsed under the weight of rain water. Power outages were widespread and 1 inch diameter hail was noted in Marion, Johnson, and Ripley counties. High winds in Shelby, White, Cass, and Decatur counties downed trees and power lines on houses and roadways. Some power poles were snapped by the winds. Extensive wind damage continued on June 21 st, as reported in Jackson, Bartholomew, Elkhart, Tippecanoe, Whitley, Dekalb, Steuben, Kosciusko, Laporte, and Lake counties. A house trailer was damaged and trees fell on power lines which blocked state highways. Thousands were without power around central Indiana. Some power poles were snapped and signs blown down. In Tippecanoe county a doctor and his son were traveling Indiana 43 in West Lafayette when high winds snapped a tree along the highway. Despite evasive maneuvers the tree fell on top of the vehicle and killed the driver instantly but spared his son. On June 22 nd a weak EF0 tornado touched down in Harrison county. The tornado caused minor damage as some trees were uprooted and siding was removed from a home. The path length was about 600 yards and maximum wind speeds were estimated near 75 mph. Finally the 5 consecutive days of severe weather were over. No storm damage was reported on June 23 rd and 24 th as the week came to a close.
7 June 25 th 30 th After a wild weather weekend the final days of June passed peacefully by. Temperatures held a little on the cool side of normal every day this week. The state average temperature rose a few degrees from 4 below normal at the start before leveling off at 1 below normal on June 27 th. The average temperature remained here the rest of June except for one cooler day when the thermometer slipped a bit to 3 below normal. Normally daily maximum temperatures this last week of June vary between 85 and 91 north to south across the state. Daily minimums range from 64 in northern counties to 69 in far southwest Indiana. A warm front slowed and stalled along the Ohio River as it approached Indiana on June 26 th. Storms overran the stationary front and dropped about 2 inches of rain in southern Indiana in the next few days. Amounts decreased northward away from the front with about a 0.7 inch total in central Indiana and just 0.1 inch across the northern third of the state. These totals are about two and half times the normal in southern Indiana this week, about 80% of normal across central Indiana, and less than 20% of normal in northern Indiana. Of course there were significantly higher amounts at some CoCoRaHS locations. Large single day measurements included 4.66 inches at Mitchell on June 26 th, while Washington noted 4.33 inches, Loogootee 4.26 inches, and Austin 4.11 inches that same day. The West Baden observer reported 4.54 inches the next day. A weak cold front passed through Indiana on June 28 th but produced very little or no rainfall. For the week the highest CoCoRaHS totals were 6.45 inches in Mitchell, 4.97 inches at Washington, and 4.36 inches in Shoals, among others. Severe weather broke out over southern Indiana between June 25 th and 27 th. On the first day high winds caused trees to fall onto power lines, blocking roads and damaging roofs and doors in Dubois and Spencer counties. Two tornadoes were confirmed on June 26 th. In Dubois county an EF1 tornado with a path length of 2.2 miles was later confirmed by the National Weather Service. This tornado caused minor damage to homes and uprooted and snapped off trees in its path. Another EF1 tornado was confirmed the same day, this time touching down in Spencer and Perry counties. This tornado packed winds at 100 mph and traveled 2.3 miles. A cinder block building was destroyed, roofs
8 were torn off homes and many trees were snapped off or uprooted. The roof of one metal building was sheared off for 100 feet. Wind damage continued the next day to the west. In Vanderburgh county a microburst with 75 mph winds tore down a large building and several smaller buildings. There was minor damage to homes and tree limbs were pulled down over the half mile path length. On the last day of the month 1 inch diameter hail was noted in the northwest corner of the state in Lake and Power counties but no significant damage was reported. With the heavy rains in southern Indiana flooding was once again on the watch list. Flooding on the lower White River commenced on June 26 th and is expected to continue through Independence Day. June 2011 Temperature Region Temperature Normal Deviation Northwest North Central Northeast West Central Central East Central Southwest South Central Southeast State
9 Precipitation Region Precipitation Normal Deviation Percent of Normal Northwest North Central Northeast West Central Central East Central Southwest South Central Southeast State Summer 2011 (so far same as June) Temperature Region Temperature Normal Deviation Northwest North Central Northeast West Central Central East Central Southwest South Central Southeast State Precipitation Region Precipitation Normal Deviation Percent of Normal Northwest North Central Northeast West Central Central East Central Southwest South Central Southeast State
10 2011 Annual so far Temperature Region Temperature Normal Deviation Northwest North Central Northeast West Central Central East Central Southwest South Central Southeast State Precipitation Region Precipitation Normal Deviation Percent of Normal Northwest North Central Northeast West Central Central East Central Southwest South Central Southeast State
11
12
13
14 Drought Summary from the U.S. Drought Monitor Below is a drought summary for the state of Indiana from the U.S. drought monitor. Areas in white are not experiencing any drought. Yellow areas are abnormally dry, but not entirely considered a drought. Drought begins when the moisture levels become more severe, with beige, orange, red, and brown indicating increasing levels of drought (moderate, severe, extreme, and exceptional, respectively). The table below indicates how much of the state is not under drought conditions, and also how much of the state is under drought conditions from its respective column upwards. For example, June 28 th has 100.0% of Indiana under no drought, and 0.0% of Indiana under at least D0 through D4 drought status. Please note, however, that these areas are not exact, and much of this drought map has been created from reports throughout the state and estimation, so use this information as a general view rather than for specifics.
15 June 7 th Drought Summary
16 June 14 th Drought Summary
17 June 21 st Drought Summary
18 June 28 th Drought Summary
August 2006 Summary. August 1-5
 Ashley Brooks (765) 494-6574 Sep 8, 2006 http://www.iclimate.org August 1-5 August 2006 Summary The heat wave that started during the end of July continued into the beginning parts of August with temperatures
July 2007 Climate Summary
 Dan Bowman (765) 494-6574 Sep 3, 2007 http://www.iclimate.org Summary July 2007 Climate Summary The month of July ended as a very unusual month. Many events occurred during the month of July that is not
September 2005 Climate Summary
 Ashley Brooks (765) 494-6574 Oct 5, 2005 http://iclimate.org September 2005 Climate Summary September 1-7 A cold front came through on the 1 st of the month, however little moisture was associated with
October 2011 Climate Summary
 Ken Scheeringa and Kayla Hudson Nov 4, 2011 http://www.iclimate.org October 2011 Climate Summary Month Summary October weather evolved as a two part story. Weather conditions the first half of the month
July 2010 Climate Summary
 Ken Scheeringa (765) 494-8105 Aug 4, 2010 http://www.iclimate.org July 2010 Climate Summary Summary The warm summer of 2010 continues. Daily state average temperatures were above normal on all but seven
September 2011 Climate Summary
 Ken Scheeringa and Kayla Hudson Oct 5, 2011 (765) 494-8105 http://www.iclimate.org September 2011 Climate Summary Month Summary The final blast of summer heat arrived at the start of September. It lasted
May 2015 Climate Summary
 Ken Scheeringa And Mary Rose Mangan Jun 8, 2015 (765) 494-8105 http://www.iclimate.org May 2015 Climate Summary Month Summary May was a very warm month. Rainfall averaged near normal but was distributed
August 2013 Climate Summary
 Ken Scheeringa and Matt Price Sep 6, 2013 (765) 494-8105 http://www.iclimate.org August 2013 Climate Summary Month Summary August weather began cool and wet but became progressively warmer and drier through
January 2012 Climate Summary
 Ken Scheeringa and Kayla Hudson Feb 6, 2012 (765) 494-8105 http://www.iclimate.org January 2012 Climate Summary Month Summary Where is winter? This question found its way into many conversations throughout
November 2010 Climate Summary
 Ken Scheeringa (765) 494-8105 Dec 6, 2010 http://www.iclimate.org November 2010 Climate Summary Summary A four month drought in Indiana is collapsing as significant rain fell the final week of November.
April 2013 Climate Summary
 Ken Scheeringa and Kayla Hudson May 6, 2013 (765) 494-8105 http://www.iclimate.org April 2013 Climate Summary Month Summary Temperatures bounced high and low this month, keeping Hoosiers guessing which
June 2010 Climate Summary
 Ken Scheeringa (765) 494-8105 Jul 6, 2010 http://www.iclimate.org June 2010 Climate Summary Summary Summer like heat and humidity arrived in Indiana on May 22 nd and dominated our weather scene nearly
May 2005 Climate Summary
 Ashley Brooks (765) 494-6574 Jun 7, 2005 http://iclimate.org May 2005 Climate Summary May 1-5 Early May was characterized by an upper-level trough that was in place over Indiana that brought in very cool
May 2018 Climate Summary
 Ken Scheeringa and Andy Eggert Jun 7, 2018 (765) 494-8105 http://www.iclimate.org May 2018 Climate Summary Month Summary As the calendar turned from April to May temperatures flipped dramatically away
January 2013 Climate Summary
 Ken Scheeringa and Kayla Hudson Feb 7, 2013 (765) 494-8105 http://www.iclimate.org January 2013 Climate Summary Month Summary Winter or spring? January featured several dramatic swings in temperature and
November 2012 Climate Summary
 Ken Scheeringa and Kayla Hudson Dec 6, 2012 (765) 494-8105 http://www.iclimate.org November 2012 Climate Summary Month Summary November was one of those rare weather months in Indiana when not much happened:
January 2006 Climate Summary
 Ashley Brooks (765) 494-6574 Feb 9, 2006 http://www.iclimate.org January 1-3 January 2006 Climate Summary Unseasonably warm conditions welcomed in the New Year with highs in the 40s across the northern
IC ARTICLE 19. DESCRIBING REAL PROPERTY; INDIANA COORDINATE SYSTEM. IC Chapter 1. Designation of Indiana Coordinate System; Zones
 IC 32-19 ARTICLE 19. DESCRIBING REAL PROPERTY; INDIANA COORDINATE SYSTEM IC 32-19-1 Chapter 1. Designation of Indiana Coordinate System; Zones IC 32-19-1-1 Designation of systems Sec. 1. The systems of
SIGNIFICANT EVENTS Severe Storms November 1994 January 1996 August 1998 and May 2000 March 2002 May 2002 Champaign County
 SIGNIFICANT EVENTS Severe Storms November 1994 On Nov. 1, 1994, high winds gusted over 60 mph at times across the northwest third of Ohio. The highest measured wind gust was 63 mph at Columbus Grove (Putnam).
March 2014 Climate Summary
 Ken Scheeringa And Matt Price Apr 8, 2014 (765) 494-8105 http://www.iclimate.org March 2014 Climate Summary Month Summary Winter had officially ended by the calendar but snow and cold persisted in Indiana
March 2016 Climate Summary
 Ken Scheeringa And Andy Eggert Apr 8, 2016 (765) 494-8105 http://www.iclimate.org March 2016 Climate Summary Month Summary Count March as the 7 th month in a row that the state average temperature has
August 2015 Climate Summary
 Ken Scheeringa And Mary Rose Mangan Sep 4, 2015 (765) 494-8105 http://www.iclimate.org August 2015 Climate Summary Month Summary A very active wet summer weather pattern turned much calmer and drier in
March 2009 Climate Summary
 Joseph Mays (765) 494-6574 Apr 1, 2009 http://www.iclimate.org Summary March 2009 Climate Summary March is in the books and it continued the trend of extreme weather we have experienced during the first
July 2011 Climate Summary
 Ken Scheeringa (765) 494-8105 Aug 8, 2011 http://www.iclimate.org July 2011 Climate Summary Month Summary The upper atmospheric high pressure dome which baked the Texas area in heat and drought the past
September 2012 Climate Summary
 Ken Scheeringa and Kayla Hudson Oct 5, 2012 (765) 494-8105 http://www.iclimate.org September 2012 Climate Summary Month Summary Summer slipped away and it felt a lot more like autumn in Indiana this month
December 2011 Climate Summary
 Ken Scheeringa and Kayla Hudson Jan 17, 2012 (765) 494-8105 http://www.iclimate.org December 2011 Climate Summary Month Summary What a difference a year makes! A year ago the misery of a harsh, cold, and
August 2017 Climate Summary
 Ken Scheeringa And Andy Eggert Sep 7, 2017 (765) 494-8105 http://www.iclimate.org August 2017 Climate Summary Month Summary The coolest August in 13 years featured long cool and warm spells, below normal
April 2011 Climate Summary
 Ken Scheeringa (765) 494-8105 May 9, 2011 http://www.iclimate.org April 2011 Climate Summary Summary After somewhat of a respite in March Indiana weather ramped up with a vengeance in April. Extreme weather
January 2008 Climate Summary
 Joseph Mays (765) 494-6574 Feb 5, 2008 http://www.iclimate.org Summary January 2008 Climate Summary January was a mix bag of conditions, with an oscillatory pattern developing. We experienced phases of
2011 Year in Review TORNADOES
 2011 Year in Review The year 2011 had weather events that will be remembered for a long time. Two significant tornado outbreaks in April, widespread damage and power outages from Hurricane Irene in August
June 2015 Climate Summary
 Ken Scheeringa And Mary Rose Mangan Jul 10, 2015 (765) 494-8105 http://www.iclimate.org June 2015 Climate Summary Month Summary Indiana set a new June rainfall record this month with a state average 8.99.
April 2016 Climate Summary
 Ken Scheeringa And Andy Eggert May 9, 2016 (765) 494-8105 http://www.iclimate.org April 2016 Climate Summary Month Summary One month but two seasons. The first half of April was cold with snow. Wind damage
April 2015 Climate Summary
 Ken Scheeringa And Mary Rose Mangan May 8, 2015 http://www iclimate org April 2015 Climate Summary Month Summary April was a month of extremes. Severe weather erupted on 4 days of the first week with multiple
June 2016 Climate Summary
 Ken Scheeringa And Andy Eggert Jul 8, 2016 (765) 494-8105 http://www.iclimate.org June 2016 Climate Summary Month Summary June was a warm month with below normal temperature on just 6 days. Rainfall was
May 2016 Climate Summary
 Ken Scheeringa And Andy Eggert Jun 6, 2016 (765) 494-8105 http://www.iclimate.org May 2016 Climate Summary Month Summary Cold weather dominated in May until the last week of the month. May began wet but
October 2014 Climate Summary
 Ken Scheeringa And Matt Price Nov 10, 2014 (765) 494-8105 http://www.iclimate.org October 2014 Climate Summary Month Summary October featured a mix of weather. A very wet first half of the month evolved
April 2017 Climate Summary
 Ken Scheeringa And Andy Eggert May 8, 2017 (765) 494-8105 http://www.iclimate.org April 2017 Climate Summary Month Summary April was a very warm and wet month in Indiana, nearly setting a new monthly temperature
January 2017 Climate Summary
 Ken Scheeringa And Andy Eggert Feb 8, 2017 (765) 494-8105 http://www.iclimate.org January 2017 Climate Summary Month Summary The warmest January in 11 years was nearly 4 F warmer than December 2016. An
July 2014 Climate Summary
 Ken Scheeringa And Matt Price Aug 8, 2014 (765) 494-8105 http://www.iclimate.org July 2014 Climate Summary Month Summary July was unseasonably cool and drier than normal. Rainfall was light in parts of
November 2017 Climate Summary
 Ken Scheeringa and Andy Eggert Dec 8, 2017 (765) 494-8105 http://www.iclimate.org November 2017 Climate Summary Month Summary November temperatures alternated spells of warm and cool while precipitation
July 2015 Climate Summary
 Ken Scheeringa And Mary Rose Mangan Aug 6, 2015 (765) 494-8105 http://www.iclimate.org July 2015 Climate Summary Month Summary Record setting rainfall in June persisted into the first three weeks of July.
Champaign-Urbana 1998 Annual Weather Summary
 Champaign-Urbana 1998 Annual Weather Summary ILLINOIS STATE WATER SURVEY Audrey Bryan, Weather Observer 2204 Griffith Dr. Champaign, IL 61820 wxobsrvr@sparc.sws.uiuc.edu The development of the El Nìno
March 2012 Climate Summary
 Ken Scheeringa and Kayla Hudson Apr 4, 2012 (765) 494-8105 http://www.iclimate.org March 2012 Climate Summary Month Summary March was a month of weather extremes with records shattered almost as a daily
The hydrologic service area (HSA) for this office covers Central Kentucky and South Central Indiana.
 for this office covers Central Kentucky and South Central Indiana.") January 2012 February 13, 2012 An X inside this box indicates that no flooding occurred within this hydrologic service area. January 2012 continued the string of wet months this winter. Rainfall was generally
January 2012 February 13, 2012 An X inside this box indicates that no flooding occurred within this hydrologic service area. January 2012 continued the string of wet months this winter. Rainfall was generally
September 2016 Climate Summary
 Ken Scheeringa And Andy Eggert Oct 6, 2016 (765) 494-8105 http://www.iclimate.org September 2016 Climate Summary Month Summary The warmest September in 77 years brought alternating weeks of dry and wet
February 2017 Climate Summary
 Ken Scheeringa And Andy Eggert Mar 9, 2017 (765) 494-8105 http://www.iclimate.org February 2017 Climate Summary Month Summary February 2017 was the warmest February in Indiana since state climate records
October 2010 Climate Summary
 Ken Scheeringa (765) 494-8105 Nov 5, 2010 http://www.iclimate.org October 2010 Climate Summary Summary Rain fell on about 10 days in October but did little to slow the drought raging across Indiana. For
INDIANAPOLIS, INDIANA
 The NWS FORM E-5 U.S. DEPARTMENT OF COMMERCE HYDROLOGIC SERVICE AREA: NATIONAL OCEANIC AND ATMOSPHERIC ADMINISTRATION NATIONAL WEATHER SERVICE INDIANAPOLIS, INDIANA REPORT FOR: MONTHLY REPORT OF RIVER
2012 Growing Season Weather Summary for North Dakota. Adnan Akyüz and Barbara A. Mullins Department of Soil Science October 30, 2012
 2012 Growing Season Weather Summary for North Dakota Adnan Akyüz and Barbara A. Mullins Department of Soil Science October 30, 2012 Introduction The 2012 growing season (the period from April through September)
October 2017 Climate Summary
 Ken Scheeringa and Andy Eggert Nov 6, 2017 (765) 494-8105 http://www.iclimate.org October 2017 Climate Summary Month Summary After more than three weeks of warm temperatures October turned suddenly cold
One person killed when tornadoes hit Oklahoma, Arkansas (Update) 25 March 2015, byjustin Juozapavicius
 25 March 2015, byjustin Juozapavicius") One person killed when tornadoes hit Oklahoma, Arkansas (Update) 25 March 2015, byjustin Juozapavicius from those. A small tornado swept across parts of Moore, an Oklahoma City suburb where 24 people died
One person killed when tornadoes hit Oklahoma, Arkansas (Update) 25 March 2015, byjustin Juozapavicius from those. A small tornado swept across parts of Moore, an Oklahoma City suburb where 24 people died
March 2011 Climate Summary
 Ken Scheeringa (765) 494-8105 Apr 5, 2011 http://www.iclimate.org March 2011 Climate Summary Summary The fast paced weather action of February slowed some in March. The major March weather features were
October 2016 Climate Summary
 Ken Scheeringa And Andy Eggert Nov 9, 2016 (765) 494-8105 http://www.iclimate.org October 2016 Climate Summary Month Summary October was the 9 th month so far this year to average above normal in temperature.
The Pennsylvania Observer
 The Pennsylvania Observer August 3, 2015 July 2015 - Pennsylvania Weather Recap By: Arthur Person Although this seventh month of 2015 was fairly normal across Pennsylvania as a whole, the details reveal
August 2016 Climate Summary
 Ken Scheeringa And Andy Eggert Sep 12, 2016 (765) 494-8105 http://www.iclimate.org August 2016 Climate Summary Month Summary Hot but tranquil weather the first half of August transitioned to a tormented
CHAPTER 10. TORNADOES AND WINDSTORMS
 CHAPTER 10. TORNADOES AND WINDSTORMS Wyoming, lying just west of tornado alley, is fortunate to experience less frequent and intense tornadoes than its neighboring states to the east. However, tornadoes
Your Task: Read each slide then use the underlined red or underlined information to fill in your organizer.
 Severe Weather: Tornadoes and Hurricanes Thunderstorms and Lightning S6E4 d. Construct an explanation of the relationship between air pressure, weather fronts, and air masses and meteorological events
November 2014 Climate Summary
 Ken Scheeringa And Matt Price Dec 10, 2014 (765) 494-8105 http://www.iclimate.org November 2014 Climate Summary Month Summary Unseasonable cold headlined the Indiana and national news in November. The
The hydrologic service area (HSA) for this office covers Central Kentucky and South Central Indiana.
 for this office covers Central Kentucky and South Central Indiana.") MONTH YEAR January 2011 February 15, 2011 X An X inside this box indicates that no flooding occurred within this hydrologic service area. January 2011 was drier than normal in all locations in the area.
MONTH YEAR January 2011 February 15, 2011 X An X inside this box indicates that no flooding occurred within this hydrologic service area. January 2011 was drier than normal in all locations in the area.
October 2012 Climate Summary
 Ken Scheeringa and Kayla Hudson Nov 8, 2012 (765) 494-8105 http://www.iclimate.org October 2012 Climate Summary Month Summary In a reversal from the hot and dry summer, cooler and wetter than normal conditions
3 Severe Weather. Critical Thinking
 CHAPTER 2 3 Severe Weather SECTION Understanding Weather BEFORE YOU READ After you read this section, you should be able to answer these questions: What are some types of severe weather? How can you stay
NWS FORM E-5 U.S. DEPARTMENT OF COMMERCE I HYDRO SERVICE AREA NOAA, NATIONAL WEATHER SERVICE I Indianapolis, IN MONTHLY REPORT
 NWS FORM E-5 U.S. DEPARTMENT OF COMMERCE I HYDRO SERVICE AREA NOAA, NATIONAL WEATHER SERVICE I Indianapolis, IN. 1-------------------- MONTHLY REPORT OF RIVER AND FLOOD CONDITIONSI REPORT FOR I November
III. Section 3.3 Vertical air motion can cause severe storms
 III. Section 3.3 Vertical air motion can cause severe storms http://www.youtube.com/watch?v=nxwbr60tflg&feature=relmfu A. Thunderstorms form from rising moist air Electrical charges build up near the tops
February 2016 Climate Summary
 Ken Scheeringa And Andy Eggert Mar 9, 2016 (765) 494-8105 http://www.iclimate.org February 2016 Climate Summary Month Summary February was the 6 th consecutive month with an above normal state average
November 2015 Climate Summary
 Ken Scheeringa And Mary Rose Mangan Dec 8, 2015 (765) 494-8105 http://www.iclimate.org November 2015 Climate Summary Month Summary November was much warmer than normal while precipitation was very near
2018 Year in Review for Central and Southeast Illinois By: Chris Geelhart, Meteorologist National Weather Service, Lincoln IL
 By: Chris Geelhart, Meteorologist National Weather Service, Lincoln IL While 2018 featured some significant out-of-season weather, including below zero temperatures in April and 90-degree highs in early
KANSAS CLIMATE SUMMARY August 2015
 KANSAS CLIMATE SUMMARY August 2015 Cool and Dry August was drier than normal in most of the state. State-wide average precipitation was 2.80 inches or 85 percent of normal. The Northeast division of the
Table 1. August average temperatures and departures from normal ( F) for selected cities.
 for selected cities.") Climate Summary for Florida August 2016 Prepared by Lydia Stefanova and David Zierden Florida Climate Center, The Florida State University, Tallahassee, Florida Online at: http://climatecenter.fsu.edu/products-services/summaries
Climate Summary for Florida August 2016 Prepared by Lydia Stefanova and David Zierden Florida Climate Center, The Florida State University, Tallahassee, Florida Online at: http://climatecenter.fsu.edu/products-services/summaries
November 2016 Climate Summary
 Ken Scheeringa And Andy Eggert Dec 15, 2016 (765) 494-8105 http://www.iclimate.org November 2016 Climate Summary Month Summary Unseasonably warm, pleasant, and sunny weather the first half of the month
Arizona Climate Summary September 2014 Summary of conditions for August 2014
 Arizona Climate Summary September 2014 Summary of conditions for August 2014 August 2014 Temperature and Precipitation Summary August 1 st 16 th : The first 5 days of August were quite wet with high pressure
Champaign-Urbana 2001 Annual Weather Summary
 Champaign-Urbana 2001 Annual Weather Summary ILLINOIS STATE WATER SURVEY 2204 Griffith Dr. Champaign, IL 61820 wxobsrvr@sws.uiuc.edu Maria Peters, Weather Observer January: After a cold and snowy December,
Tornadoes. Be able to define what a tornado is. Be able to list several facts about tornadoes.
 Tornadoes Be able to define what a tornado is. Be able to list several facts about tornadoes. 1. Where do tornadoes most U.S. is # 1 occur in the world? Tornadoes are most common in Tornado Alley. Tornado
MIAMI-SOUTH FLORIDA National Weather Service Forecast Office
 MIAMI-SOUTH FLORIDA National Weather Service Forecast Office http://www.weather.gov/miami June 2015 South Florida Weather Summary Dry East, Wet West...Drought Remains SE Florida July 3, 2015: Depending
NATIONAL WEATHER SERVICE
 January 2016 February 9, 2016 This was a dry month across the HSA despite one large and several smaller snowfalls. Most locations ended up 1-2 inches below normal for the month. The driest locations at
The Pennsylvania Observer
 The Pennsylvania Observer May 31, 2012 May 2012 - Pennsylvania Weather Recap By: Paul Knight The majority of the fifth month had temperatures averaging well above seasonal levels with two distinct hot
Key Concept Weather results from the movement of air masses that differ in temperature and humidity.
 Section 2 Fronts and Weather Key Concept Weather results from the movement of air masses that differ in temperature and humidity. What You Will Learn Differences in pressure, temperature, air movement,
W I N T E R STORM HAZARD DESCRIPTION
 W I N T E R STORM HAZARD DESCRIPTION... 1 LOCATION... 2 EXTENT... 2 HISTORICAL OCCURRENCES... 4 SIGNIFICANT PAST EVENTS... 4 PROBABILITY OF FUTURE EVENTS... 5 VULNERABILITY AND IMPACT... 5 HAZARD DESCRIPTION
COMMUNITY EMERGENCY RESPONSE TEAM TORNADOES
 Tornadoes are powerful, circular windstorms that may be accompanied by winds in excess of 200 miles per hour. Tornadoes typically develop during severe thunderstorms and may range in width from several
NWS FORM E-5 U.S. DEPARTMENT OF COMMERCE HSA OFFICE:
 NWS FORM E-5 U.S. DEPARTMENT OF COMMERCE HSA OFFICE: NOAA, NATIONAL WEATHER SERVICE MONTHLY REPORT OF RIVER AND FLOOD CONDITIONS DATE: TO: North Webster, IN REPORT FOR (MONTH &YEAR): July 1998 August 5,
The Pennsylvania Observer
 The Pennsylvania Observer October 1, 2015 September 2015 - Pennsylvania Weather Recap By: Quinn Lease The month of September will be remembered for its above normal temperatures and dry conditions that
Weather and Climate Summary and Forecast Summer 2017
 Weather and Climate Summary and Forecast Summer 2017 Gregory V. Jones Southern Oregon University August 4, 2017 July largely held true to forecast, although it ended with the start of one of the most extreme
Tornadoes pose a high risk because the low atmospheric pressure, combined with high wind velocity, can:
 Tornadoes are powerful, circular windstorms that may be accompanied by winds in excess of 200 miles per hour. Tornadoes typically develop during severe thunderstorms and may range in width from several
The Pennsylvania Observer
 The Pennsylvania Observer April 2, 2009 March 2009 Pennsylvania Weather Recap Prepared by Curt Harpster For the month of March the saying, In like a lion and out like a lamb really fit the pattern quite
How strong does wind have to be to topple a garbage can?
 How strong does wind have to be to topple a garbage can? Imagine winds powerful enough to pick up a truck and toss it the length of a football field. Winds of this extreme sometimes happen in a tornado.
January 2018 Climate Summary
 Ken Scheeringa and Andy Eggert Feb 8, 2018 (765) 494-8105 http://www.iclimate.org January 2018 Climate Summary Month Summary January temperature swings were amazing. In the first few days arctic cold pushed
TORNADOES. DISPLAY VISUAL A Tornado Is... Tornadoes can: Rip trees apart. Destroy buildings. Uproot structures and objects.
 TORNADOES Introduce tornadoes by explaining what a tornado is. DISPLAY VISUAL A Tornado Is... A powerful, circular windstorm that may be accompanied by winds in excess of 250 miles per hour. Tell the participants
FLOOD/SCS EVENT, APRIL 28 MAY 4
 REPORT DATE: May 4, 2017 EVENT DATE: April 28-May 4, 2017 FLOOD/SCS EVENT, APRIL 28 MAY 4 Event Summary General Significant Flood Outlook. SOURCE: National Weather Service. A significant severe thunderstorm
X An X inside this box indicates that no flooding occurred within this Hydrologic Service Area.
 NWS FORM E-5 U.S. DEPARTMENT OF COMMERCE HSA OFFICE: NOAA, NATIONAL WEATHER SERVICE MONTHLY REPORT OF RIVER AND FLOOD CONDITIONS DATE: TO: North Webster, IN REPORT FOR (MONTH &YEAR): January, 2003 February
Announcements. No office hours tomorrow (Wed. March 30) Homework 5 extra credit:
 Homework 5 extra credit:") Announcements No office hours tomorrow (Wed. March 30) Homework 5 extra credit: Find and plot additional tracks of Hurricane Ivan (after reaching its northeastmost point in U.S) North Dakota Lightning
Announcements No office hours tomorrow (Wed. March 30) Homework 5 extra credit: Find and plot additional tracks of Hurricane Ivan (after reaching its northeastmost point in U.S) North Dakota Lightning
March 2018 Climate Summary
 Ken Scheeringa and Andy Eggert Apr 5, 2018 (765) 494-8105 http://www.iclimate.org March 2018 Climate Summary Month Summary March turned cold with below normal temperatures on two-thirds of its days. Along
New Hampshire State Climate Office Dr. Mary D. Stampone, State Climatologist
 New Hampshire State Climate Office Dr. Mary D. Stampone, State Climatologist University of New Hampshire c/o Department of Geography 73 Main Street Durham, NH 03824 Phone: 603-862-3136 Fax: 603-862-4362
The Pennsylvania Observer
 The Pennsylvania Observer September 3, 2008 Summer 2008 Weather Summary Written by: Brian Thompson The opening days of June started dry, but a warm front brought a widespread rain a couple of days into
Kentucky Weather Hazards: What is Your Risk?
 Kentucky Weather Hazards: What is Your Risk? Stuart A. Foster State Climatologist for Kentucky 2010 Kentucky Weather Conference Bowling Green, Kentucky January 16, 2010 Perspectives on Kentucky s Climate
KANSAS CLIMATE SUMMARY May 2018
 KANSAS CLIMATE SUMMARY May 2018 From Cold to Hot May came close to setting the record as the hottest since 1895. The state-wide average temperature for the month was 70.6 o F. This was 7.2 degrees warmer
Champaign-Urbana 1999 Annual Weather Summary
 Champaign-Urbana 1999 Annual Weather Summary ILLINOIS STATE WATER SURVEY 2204 Griffith Dr. Champaign, IL 61820 wxobsrvr@sws.uiuc.edu Maria Peters, Weather Observer A major snowstorm kicked off the new
Weather and Climate Summary and Forecast August 2018 Report
 Weather and Climate Summary and Forecast August 2018 Report Gregory V. Jones Linfield College August 5, 2018 Summary: July 2018 will likely go down as one of the top five warmest July s on record for many
Chapter 3: Weather Fronts & Storms
 Chapter 3: Weather Fronts & Storms An AIR MASS is a large body of air that has similar characteristics (temperature, humidity) throughout. Air masses can be massively large. Air masses are classified by
NIDIS Weekly Climate, Water and Drought Assessment Summary. Upper Colorado River Basin July 31, 2012
 NIDIS Weekly Climate, Water and Drought Assessment Summary Upper Colorado River Basin July 31, 2012 Fig. 1: July month-to-date precipitation in inches. Fig. 2: SNOTEL WYTD precipitation percentiles (50%
While all thunderstorms are dangerous, the National Weather Service (NWS) defines a severe thunderstorm as one that:
 defines a severe thunderstorm as one that:") While all thunderstorms are dangerous, the National Weather Service (NWS) defines a severe thunderstorm as one that: Produces hail at least three-quarters of an inch in diameter. Has winds of 58 miles
While all thunderstorms are dangerous, the National Weather Service (NWS) defines a severe thunderstorm as one that: Produces hail at least three-quarters of an inch in diameter. Has winds of 58 miles
MARKET ANALYSIS FOR DRIED. DISTILLERS GRAINS IN INDIANA a. Dept. of Agricultural Economics. Purdue University
 MARKET ANALYSIS FOR DRIED DISTILLERS GRAINS IN INDIANA a by Dr. Frank J. Dooley Working Paper # 08-11 December 2008 Dept. of Agricultural Economics Purdue University a Findings are those only of the author.