March 2014 Climate Summary
|
|
|
- Emery Arnold
- 5 years ago
- Views:
Transcription

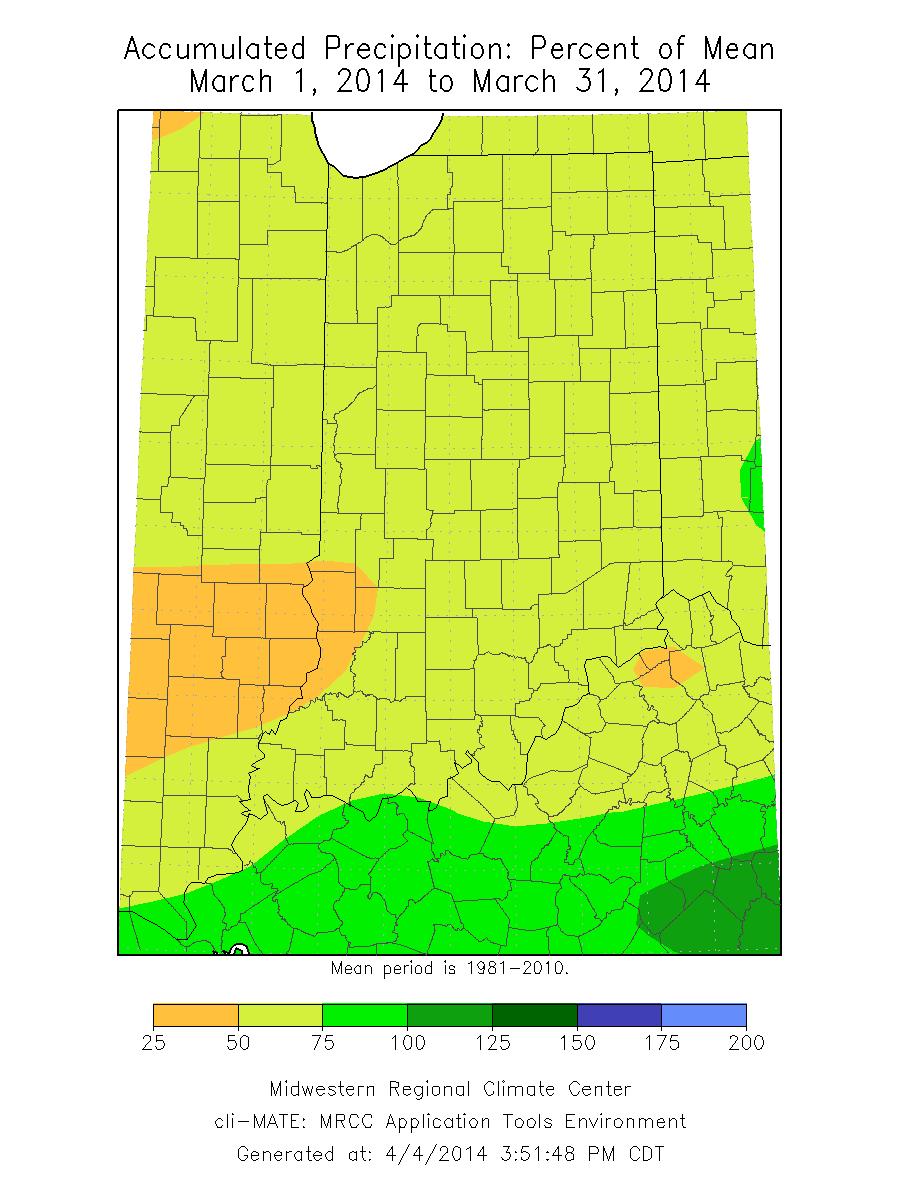
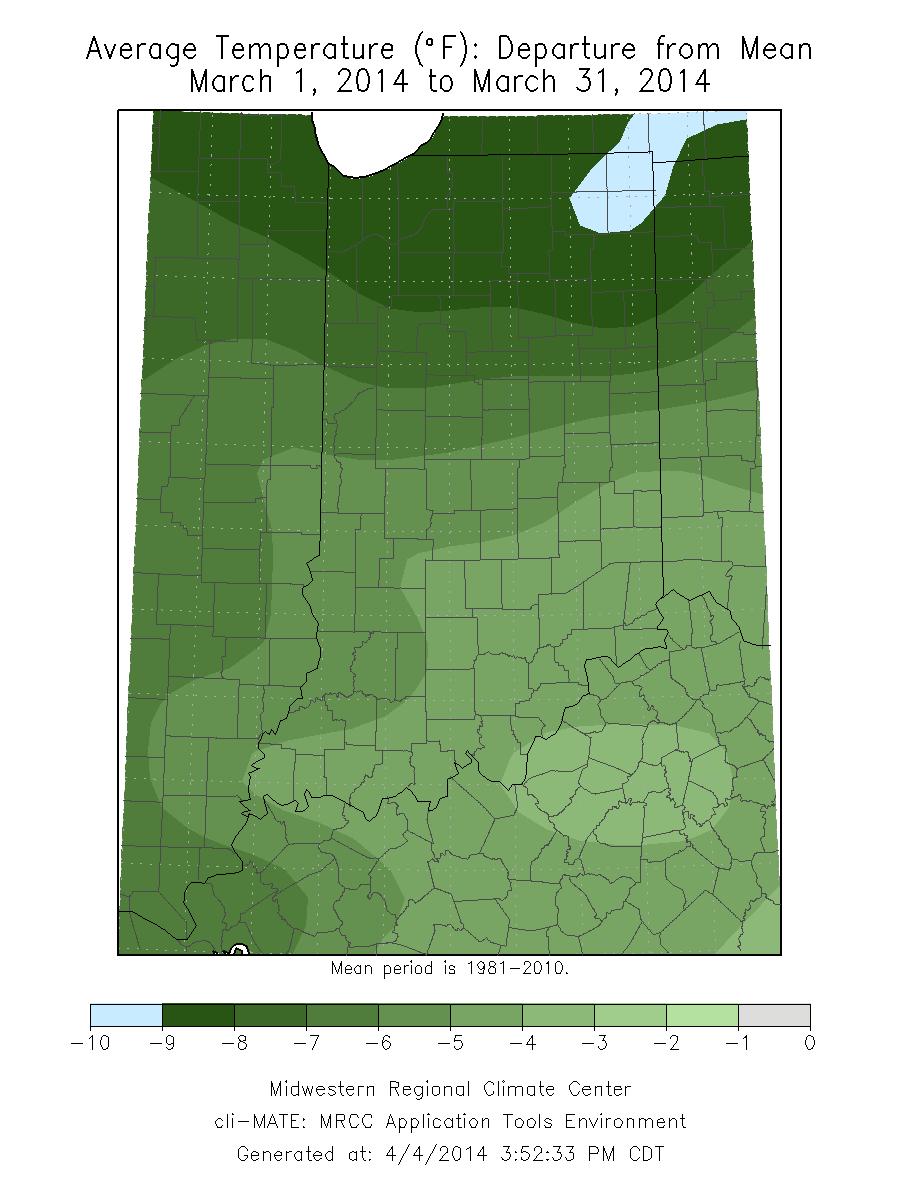
1 Ken Scheeringa And Matt Price Apr 8, 2014 (765) March 2014 Climate Summary Month Summary Winter had officially ended by the calendar but snow and cold persisted in Indiana to the end of the month. March became the fifth consecutive month with below normal temperature, a testimony to how intense and extended the recent winter season has been. The month was drier than normal with just 5 statewide snow days. The bit of good news from this is the number of traffic accidents due to slippery highways fell this month. The March state average temperature was 34.1 F, or 6.6 F below normal. This ranks the month as the 10 th coldest March on record. It had been a long time, 30 years ago, since March has been this cold in Indiana. This occurred in 1984 when the March state average temperature was 32.4 F, pegged at 4 th place. Before then March 1978 with its 33.6 F average temperature wasn t quite as cold, placing 8 th in the record book. The coldest March on record since 1895 was in 1960 with its state temperature of 26.3 F. The day split in March 2014 was heavily one sided. There were 24 days of below normal temperature, 5 days above normal, and 2 days at normal. The state average temperature was 10 F or more below normal on 11 days and 20 F or more below normal on 2 days. There was just 1 day when the daily temperature was 10 F or more above normal. The highest cooperative network temperature of the month was 77 F recorded on March 12 th at French Lick. The coldest temperature was -7 F observed on two dates: on March 1 st at Angola, and again on March 3 rd at Wanatah and Lagrange. March state precipitation averaged 2.01 inches which is 1.39 inch below normal. This ties March 1900 as the 19 th driest March on record since Some recent drier Marches include a 0.98 inch amount in 2001 in 3 rd place, and a 1.35 inch value in 1994, coming in at 6 th place. The driest March on record goes way back to 1910, with 0.23 inch posted. Regionally March 2014 precipitation was about 55% of normal in the northern and southern thirds of Indiana, and 65% of normal in the central third of the state. Normal March precipitation ranges between 2.7 inches in northeast Indiana to 4.2 inches in the southwest. The highest single day precipitation in the cooperative network this month was 1.80 inches on March 3 rd at the Evansville Museum and on March 12 th at a location near Kokomo. In the CoCoRaHS network the highest daily value was 1.59 inches on March 12 th in New Ross. Widespread precipitation fell on about 13 days this month. Snowfall in March totaled between 14 and 22 inches in the Lake Michigan effect region. Elsewhere in northern Indiana snow totals ranged from about 8 to 14 inches. Central areas received 2 to 8 inches with 2 to 3 inches common in southern Indiana. The highest March snowfall in the cooperative network was 22.5 inches measured at Indiana Dunes. Among CoCoRaHS volunteers the greatest total was 20.8 inches in Porter. The largest single day snowfall in that network was
2 11.0 inches recorded on March 13 th just outside Valparaiso. Widespread snow fell on about 5 days this month. Precipitation and snowfall maps are found in the weekly narratives which follow. Drivers were perhaps too eager to put away their winter driving skills. After a few days of pleasant weather, motorists seemed surprised by snow events on March 12 th and 25 th. There were dozens of vehicle slide offs and accidents in several counties especially on these two dates. Some cars overturned on slick roads, pinning in drivers, even in areas with only a dusting of snowfall. March 1 st 8 th The big chill continued through a second week. The state average temperature has remained below normal for 14 consecutive days. Precipitation was also less than normal for a second straight week, although totals were actually higher. Snow fell across most of the state to start the month. Winter should wind down soon as March transitions into spring. Another cold front was passing through Indiana on March 1 st, holding the state average temperature cold at 9 F below normal. The front pushed south of the Ohio River the next day as cold arctic air arrived, dropping temperatures still further to 16 F below normal. Strong high pressure muscled in behind the front, clearing Indiana skies in time for even colder temperatures of 23 F below normal on March 3 rd, the coldest day of the 8 day interval. This high pressure ridge was big and strong, sprawling ever wider from Arkansas to Pennsylvania on March 4 th. As the ridge crept east, Indiana temperatures climbed higher each of the next 4 days under clear skies. By March 7 th the state temperature had reached 4 F below normal, the warmest of the 8 day interval. A new cold front crossed Indiana on March 8 th, only the second cold front of the month. The state temperature fell slightly to 5 F below normal. Overall the first 8 days of March averaged 13 F below normal. Typical daily maximum temperatures this time of year should range between 42 F near the Michigan border to 52 F in far southwest Indiana. Normal daily minimums should vary from 25 F to 32 F north to south across the state. Snow continued to fall almost daily in the northern half of the state. The major storm that brought arctic cold back to Indiana on March 2 nd deposited 1 to 2 inches along the Michigan border and in central Indiana but thrashed Lake and Porter counties with up to 9 inches. Precipitation in far southern Indiana counties began as rain, then changed to freezing rain which coated the ground with ice 0.10 inch to 0.25 inch thick. About a half inch of sleet followed the freezing rain that afternoon before it all changed to snow. The cold front marched south the next day, adding an extra inch of snow in the northern half of Indiana with 1 to 2 inches across the southern half. Some spots in southeast Indiana received another 3 inches of snow before the storm moved east. No new snow was reported on March 4 th. As high pressure drifted east of Indiana on March 5 th and 6 th, moisture from a storm southwest of the state lifted and cooled over Lake Michigan. Another inch of snow fell in this northwest corner of the state with a half inch in northeast Indiana on March 5 th. The next day up to 2 inches was added in the northern third of the state. Yet up to another 2 inches was noted the morning of March 8 th in the lake effect region. By the end of the 8 days snow had piled up in Lake and Porter counties. Some of the larger snow totals in the CoCoRaHS network included 15.1 inches at St John, 13.5 inches in Porter, 11.0 inches
3 at the Lakes of the Four Seasons, 8.8 inches in Trail Creek, and 8.5 inches at Chesterton. Most of this total had arrived by the morning of March 2 nd when Porter received 8.7 inches in 24 hours. Some of the other high single day snowfall amounts included 8.5 inches in St John, with reports of 8.4 inches and 8.0 inches in Portage. Hobart noted 7.0 inches that morning. Most new moisture in the southern half of the state counted as rain and freezing rain. On March 3 rd the largest single day precipitation reports ranged from 1.18 inch at Newburgh to 1.24 inch in Elizabeth. Fredericksburg recorded 1.22 inch that morning while Evansville noted 1.19 inch. Over the 8 days Plymouth topped the precipitation totals list with 1.73 inch while Fredericksburg had 1.26 inch, Elizabeth 1.24 inch, and two Evansville volunteers measured 1.19 and 1.18 inch totals. Regional averages came in at about one-third inch in northern and central Indiana with 0.6 inch across the south. These precipitation totals equate to about 50% of normal in northern Indiana, a third of normal in central areas, and 60% of normal in the southern region. March 9 th 15 th The long cold spell ended on March 9 th at 15 consecutive days of below normal state temperatures. Then came this week as temperatures varied widely on both sides of normal, more typical of March. The snow season wasn t over yet as a surprise snow storm arrived in Indiana in mid-week. High pressure settled over Indiana as the week began March 9 th. The state average temperature was near 5 F below normal. Finally two weeks of cold relented. High pressure drifted southeast of Indiana the next day and the state average temperature responded to reach 5 F above normal. A storm system in Kansas on March 11 th stretched a long stationary front from there eastward across Indiana to Pennsylvania. Warmer air flowed into Indiana and temperatures continued to rise to 13 F above normal, the warmest day of the week.
4 A Canadian cold front surged south the next day and caught up with the stationary front where they merged and pushed into Kentucky. Arctic air reclaimed Indiana, dragging temperatures lower to 2 F below normal. A high pressure ridge settled over Indiana on March 13 th as state temperatures continued to fall to 13 F below normal, the coldest of the week. The next day an Alberta clipper system dove south into Wisconsin. Its warm front quickly crossed Indiana. A new warming trend lifted the state temperature to 4 F below normal. The week ended on March 15 th with the clipper cold front sliding through Indiana, followed by another cold front right behind it. Yet these fronts were much weaker than the mid-week system and were already slowing down. The state average temperature closed out the week at 2 F above normal. The extreme temperature swings this week both above and below normal nearly balanced with a net weekly temperature of less than 1 F below normal. Typically for the second week of March daily maximum temperatures should vary between 45 F in far northern Indiana to 55 F in the far southwest corner. Daily minimums normally range from 27 F to 34 F north to south across the state. Up to 2 inches of new snowfall was measured on the morning of March 9 th in the northwest lake effect region. This moisture came with the cold front that passed through Indiana at the very end of last week. A few pleasant spring like days followed and some Hoosiers thought winter was finally over. The reality of winter came roaring back in the early morning hours of March 12 th. The storm began as rain, transitioned to sleet, and finally to snow before dawn. The CoCoRaHS data a few hours later revealed that 5 to 7 inches of snow had fallen along the Lake Michigan shore, with about 2 to 5 inches elsewhere across northern Indiana. Snowfall amounts in central Indiana ranged from around a half inch to 2 inches with nearly all of this snow north of Indianapolis. Rain did not turn to snow across the southern half of the state until later on March 12 th. All precipitation had turned to snow before the next CoCoRaHS daily measurement on March 13 th. On that morning 3 to 7 inches of new snow had fallen in the northeast quarter of the state while up to 2 more inches had arrived in northwest Indiana. In central counties new snow amounts varied from a half to 3 inches. Just a trace was recorded generally in the southeast third of the state. Snow was streaky in southwest Indiana with narrow bands of up to 2 inches but most areas had nothing. The heaviest local snowfall noted on March 13 th was 11.0 inches in Valparaiso. Nearby Portage had 8.0 inches, while in the northeast Columbia City had 7.5 inches and Huntertown 6.5 inches. Grand snowfall totals for the week included 16.9 inches at Valparaiso, 8.7 and 8.4 inches at two Fort Wayne locations, 8.5 inches in Leo, and 8.3 inches at Syracuse. The heaviest local single day precipitation numbers on March 12 th had New Ross with 1.59 inch, West Terre Haute at 1.49 inch, and Clayton with 1.41 inch. Whitestown noted 1.39 inch while in Lebanon 1.37 inch was recorded. Overall for the week New Ross totaled 1.66 inch, Atlanta 1.48 inch, Zionsville and Clayton 1.45 inch, with 1.42 inch at Kokomo. Regional averages came in at near 0.7 inch across northern Indiana, 1.1 inch in central sections, and just 0.3 inch in the south. These amounts equate to about 130% of normal in the north, 150% of normal in central Indiana, and right about normal across the southern third of the state. Some drivers were caught off guard by the mid-week snow storm. While the long winter provided many snow events with which to improve winter driving skills, some drivers had already shelved
5 those skills until next winter. Several county police departments had already reported dozens of slide offs and accidents on area roadways just hours after the snow had started on March 12 th. Winds became gusty after the first round of snow ended that afternoon. Besides difficult travel conditions the high winds snapped trees and limbs which fell on power lines. A few thousand homes in west central Indiana lost power until evening. Some traffic signals became plastered by wind driven snow and snarled traffic with driver confusion in these areas. March 16 th 22 nd Despite a cold start the state average temperature rode a warming trend through most of this week. It was rather dry with precipitation concentrated in the far northern and southern tier of counties, along the Michigan border and Ohio River. The sun crossed the equator into the northern hemisphere on March 20 th so daylight hours now exceed the duration of darkness. A high pressure ridge was building into Indiana from the southwest as the week began, keeping the state temperature cold at 10 F below normal. A weak weather system, a low pressure trough, moved through the state on March 18 th in advance of warmer air. By the next day it was obvious Indiana was within the warm air sector of the next storm system as temperatures had rebounded to normal. The cold front of this storm moved through Indiana on March 20 th but warming continued another day with the state temperature gaining to 5 F above normal, the warmest day of the week. The air mass behind this storm had originated from the Pacific Ocean rather than Canada. The path of the jet stream in the upper atmosphere was primarily zonal this week, steering air masses west to east while blocking new surges of arctic air from Canada. Along came another storm system on March 21 st, its leading warm front stalling over central Indiana as a stationary front. Weather conditions were changing and now it was time for another cold blast from western Canada. A cold front passed through Indiana on March 22 nd, opening the door to the transport of cold air into our state driven by high pressure plunging southward from the Yukon. The week ended with the state temperature at 1 F below normal. It had taken several days this week to lift temperatures back to normal. The weekly temperature averaged to 3 F below normal. Usually by this time in March daily maximum temperatures should
6 vary between 48 F near the Michigan border to 58 F in the far southwest corner of the state. Daily minimums normally range from 29 F to 36 F north to south across Indiana. The path of storms early in the week tended to be south of Indiana and north of the state later on. The lack of a direct hit was evident in the snowfall pattern: more on the northern and southern edges of the state with less across the center. On the morning of March 17 th about 1 to 2 inches of snow was recorded in the vicinity of Louisville, up to an inch in counties near the Ohio River, but nothing elsewhere in the state. The north end of the state received snowfall a few days later. A trace was measured in extreme northwest Indiana the morning of March 20 th. The next day up to an inch fell in the lake effect region, generally north of highway US 30. Up to 2 inches was noted in northeast Indiana but little to no snow elsewhere. Another half inch of snow was observed in northeast Indiana in readings taken the morning of March 22 nd. Of interest is that the heaviest single day snowfall amounts this week all occurred in far southern Indiana. On the morning of March 17 th two CoCoRaHS observers in Jeffersonville recorded 2.0 inches as did the Evansville volunteer. The Galena report was 1.8 inch. These were also the largest weekly snowfall totals around the state. The largest precipitation totals for the week were noted in both far northern and southern counties. The South Bend observer accumulated 0.92 inch while nearby Long Beach had 0.69 inch. Laporte tallied 0.66 inch. In southern Indiana New Pekin measured 0.68 inch and Jasper summed to 0.67 inch. None of these numbers are extraordinarily high, which reflects the drier than normal status in precipitation this week. Regionally northern Indiana averaged about 0.25 inch, central near 0.05 inch, with 0.20 inch across the south. These values equate to about 40% of normal in the north, just 5% of normal in the central third, and 20% of normal in southern Indiana. March 23 rd 31 st State average temperatures the final 9 days of March persisted below normal until the very last day of the month. Snowfall was heaviest in the center of the state with new measureable snowfall also coming to most of northern Indiana and in southwest areas. About half the state had only a trace or no snowfall. Precipitation totals trended heavier north to south but overall were below normal.
7 Cold air was pouring into Indiana on March 23 rd with state temperatures running about 9 F below normal. High pressure moved overhead the state from Nebraska the next day, forcing temperatures downward to 14 F below normal. The high pressure center quickly moved eastward but no warm up followed. Two cold fronts pushed through Indiana on March 25 th to reinforce the cold already in place. State temperatures held steady at 14 F below normal through the next day. Another high pressure ridge had moved southeast from Alberta into Indiana on March 26 th and locked the cold air in place. The cold air influx was finally halted on March 27 th as the warm front of a new Great Plains storm complex crossed Indiana. The state temperature rebounded to 9 F below normal. A second warm front moved through the next day and temperatures continued upward to 3 F below normal. The warming trend was slowed temporarily as a cold front followed closely behind the second warm front. The state average temperature gave up its gains and fell back to 9 F below normal by March 29 th. The high pressure ridge behind this last cold front was very narrow east to west, so the cool down was very brief. Warm southerly winds quickly returned to Indiana. By March 31 st the state average temperature had reached 1 F above normal, only the fifth date this month that temperatures exceeded normal. The overall intense cold of these final 9 days was evident with an average state temperature at near 9 F below normal. Typically in late March daily maximum temperatures should range between 51 F and 61 F north to south. Normal daily minimums vary between 32 F in far northern counties to 38 F in the southwest corner of the state. The snowfall season is ending in Indiana as snow events are becoming more localized and less organized statewide. Up to a half inch of snow was observed in extreme northwest Indiana on March 23 rd with about an inch more in Lake county the next day. On March 25 th up to a half inch fell in the northwest quarter of the state and in a part of southwest Indiana. Up to 1.5 inch was noted in Lake and Porter counties. The snow moved east on March 26 th with variable amounts up to an inch except in northwest and west central Indiana. The next snow came on March 29 th when an inch was recorded only in the Indianapolis area. Up to another inch fell there and in northeast Indiana which was tallied on March 30 th. Over the 9 day interval the largest snow total in the CoCoRaHS network was 4.3 inches in New Ross. In central Indiana two observers in Atlanta recorded 3.2 and 2.5 inches. The Frankfort volunteer had 2.3 inches while 1.8 inch was measured in Thorntown. While snow fell throughout the 9 day interval rainfall was limited mostly to the southern half of the state during the last few days when temperatures were warmer. The highest single day precipitation, the water equivalent of melted snowfall and rainfall, was observed on the morning of March 29 th. Two CoCoRaHS volunteers in Newburgh measured 1.32 and 1.30 inch. The Taylorsville observer had 1.24 inch while at Williams 1.22 inch was collected. Over the entire 9 days the New Salisbury gage accumulated 2.25 inches. Two Milltown volunteers had 2.13 and 2.06 inches. The Boonville total was 2.11 inches and Newburgh summed to 2.09 inches. Regional average precipitation trended heavier moving south across Indiana. About 0.3 inch of precipitation fell in northern Indiana, 0.8 inch in central, and 1.3 inch in the south. These amounts equate to about 30% of normal in the northern third of the state, about 80% in central, and to right about normal in southern Indiana.

8 Now that spring has arrived Indiana drivers cannot wait for that last snowfall of the season to have come and gone. Slide offs and accidents continued through March later than usual. On March 25 th some counties reported a few cars overturned and their drivers pinned inside, surprised yet again by slick pavement where only a dusting of snow had fallen.
9 March 2014 Temperature Region Temperature Normal Deviation Northwest North Central Northeast West Central Central East Central Southwest South Central Southeast State Precipitation Region Precipitation Normal Deviation Percent of Normal Northwest North Central Northeast West Central Central East Central Southwest South Central Southeast State
10 Spring so far (same as March) Temperature Region Temperature Normal Deviation Northwest North Central Northeast West Central Central East Central Southwest South Central Southeast State Precipitation Region Precipitation Normal Deviation Percent of Normal Northwest North Central Northeast West Central Central East Central Southwest South Central Southeast State
11 2014 Annual so far Temperature Region Temperature Normal Deviation Northwest North Central Northeast West Central Central East Central Southwest South Central Southeast State Precipitation Region Precipitation Normal Deviation Percent of Normal Northwest North Central Northeast West Central Central East Central Southwest South Central Southeast State
12
13
14
15

16 Drought Summary from the U.S. Drought Monitor Below is a drought summary for the state of Indiana from the U.S. Drought Monitor. Areas in white are not experiencing any drought. Yellow areas are abnormally dry, but not considered a drought. Drought begins when the moisture levels become more severe, with beige, orange, red, and brown indicating increasing levels of drought (moderate, severe, extreme, and exceptional, respectively). The table below indicates what percentage of the state is drought free, and how much of the state is in drought by degree of severity (D1 - D4 category).
17 March 4 th Drought Summary
18 March 11 th Drought Summary
19 March 18 th Drought Summary
20 March 25 th Drought Summary
21 April 1 st Drought Summary
October 2011 Climate Summary
 Ken Scheeringa and Kayla Hudson Nov 4, 2011 http://www.iclimate.org October 2011 Climate Summary Month Summary October weather evolved as a two part story. Weather conditions the first half of the month
December 2011 Climate Summary
 Ken Scheeringa and Kayla Hudson Jan 17, 2012 (765) 494-8105 http://www.iclimate.org December 2011 Climate Summary Month Summary What a difference a year makes! A year ago the misery of a harsh, cold, and
January 2008 Climate Summary
 Joseph Mays (765) 494-6574 Feb 5, 2008 http://www.iclimate.org Summary January 2008 Climate Summary January was a mix bag of conditions, with an oscillatory pattern developing. We experienced phases of
November 2014 Climate Summary
 Ken Scheeringa And Matt Price Dec 10, 2014 (765) 494-8105 http://www.iclimate.org November 2014 Climate Summary Month Summary Unseasonable cold headlined the Indiana and national news in November. The
August 2013 Climate Summary
 Ken Scheeringa and Matt Price Sep 6, 2013 (765) 494-8105 http://www.iclimate.org August 2013 Climate Summary Month Summary August weather began cool and wet but became progressively warmer and drier through
July 2007 Climate Summary
 Dan Bowman (765) 494-6574 Sep 3, 2007 http://www.iclimate.org Summary July 2007 Climate Summary The month of July ended as a very unusual month. Many events occurred during the month of July that is not
November 2012 Climate Summary
 Ken Scheeringa and Kayla Hudson Dec 6, 2012 (765) 494-8105 http://www.iclimate.org November 2012 Climate Summary Month Summary November was one of those rare weather months in Indiana when not much happened:
January 2018 Climate Summary
 Ken Scheeringa and Andy Eggert Feb 8, 2018 (765) 494-8105 http://www.iclimate.org January 2018 Climate Summary Month Summary January temperature swings were amazing. In the first few days arctic cold pushed
May 2005 Climate Summary
 Ashley Brooks (765) 494-6574 Jun 7, 2005 http://iclimate.org May 2005 Climate Summary May 1-5 Early May was characterized by an upper-level trough that was in place over Indiana that brought in very cool
August 2017 Climate Summary
 Ken Scheeringa And Andy Eggert Sep 7, 2017 (765) 494-8105 http://www.iclimate.org August 2017 Climate Summary Month Summary The coolest August in 13 years featured long cool and warm spells, below normal
October 2014 Climate Summary
 Ken Scheeringa And Matt Price Nov 10, 2014 (765) 494-8105 http://www.iclimate.org October 2014 Climate Summary Month Summary October featured a mix of weather. A very wet first half of the month evolved
January 2017 Climate Summary
 Ken Scheeringa And Andy Eggert Feb 8, 2017 (765) 494-8105 http://www.iclimate.org January 2017 Climate Summary Month Summary The warmest January in 11 years was nearly 4 F warmer than December 2016. An
February 2016 Climate Summary
 Ken Scheeringa And Andy Eggert Mar 9, 2016 (765) 494-8105 http://www.iclimate.org February 2016 Climate Summary Month Summary February was the 6 th consecutive month with an above normal state average
2011 Year in Review TORNADOES
 2011 Year in Review The year 2011 had weather events that will be remembered for a long time. Two significant tornado outbreaks in April, widespread damage and power outages from Hurricane Irene in August
March 2016 Climate Summary
 Ken Scheeringa And Andy Eggert Apr 8, 2016 (765) 494-8105 http://www.iclimate.org March 2016 Climate Summary Month Summary Count March as the 7 th month in a row that the state average temperature has
August 2006 Summary. August 1-5
 Ashley Brooks (765) 494-6574 Sep 8, 2006 http://www.iclimate.org August 1-5 August 2006 Summary The heat wave that started during the end of July continued into the beginning parts of August with temperatures
March 2009 Climate Summary
 Joseph Mays (765) 494-6574 Apr 1, 2009 http://www.iclimate.org Summary March 2009 Climate Summary March is in the books and it continued the trend of extreme weather we have experienced during the first
May 2018 Climate Summary
 Ken Scheeringa and Andy Eggert Jun 7, 2018 (765) 494-8105 http://www.iclimate.org May 2018 Climate Summary Month Summary As the calendar turned from April to May temperatures flipped dramatically away
January 2012 Climate Summary
 Ken Scheeringa and Kayla Hudson Feb 6, 2012 (765) 494-8105 http://www.iclimate.org January 2012 Climate Summary Month Summary Where is winter? This question found its way into many conversations throughout
March 2018 Climate Summary
 Ken Scheeringa and Andy Eggert Apr 5, 2018 (765) 494-8105 http://www.iclimate.org March 2018 Climate Summary Month Summary March turned cold with below normal temperatures on two-thirds of its days. Along
September 2011 Climate Summary
 Ken Scheeringa and Kayla Hudson Oct 5, 2011 (765) 494-8105 http://www.iclimate.org September 2011 Climate Summary Month Summary The final blast of summer heat arrived at the start of September. It lasted
November 2010 Climate Summary
 Ken Scheeringa (765) 494-8105 Dec 6, 2010 http://www.iclimate.org November 2010 Climate Summary Summary A four month drought in Indiana is collapsing as significant rain fell the final week of November.
The Pennsylvania Observer
 The Pennsylvania Observer April 2, 2009 March 2009 Pennsylvania Weather Recap Prepared by Curt Harpster For the month of March the saying, In like a lion and out like a lamb really fit the pattern quite
August 2015 Climate Summary
 Ken Scheeringa And Mary Rose Mangan Sep 4, 2015 (765) 494-8105 http://www.iclimate.org August 2015 Climate Summary Month Summary A very active wet summer weather pattern turned much calmer and drier in
November 2015 Climate Summary
 Ken Scheeringa And Mary Rose Mangan Dec 8, 2015 (765) 494-8105 http://www.iclimate.org November 2015 Climate Summary Month Summary November was much warmer than normal while precipitation was very near
January 2013 Climate Summary
 Ken Scheeringa and Kayla Hudson Feb 7, 2013 (765) 494-8105 http://www.iclimate.org January 2013 Climate Summary Month Summary Winter or spring? January featured several dramatic swings in temperature and
The Pennsylvania Observer
 The Pennsylvania Observer January 5, 2009 December 2008 Pennsylvania Weather Recap The final month of 2008 was much wetter than average and a bit colder than normal. In spite of this combination, most
May 2016 Climate Summary
 Ken Scheeringa And Andy Eggert Jun 6, 2016 (765) 494-8105 http://www.iclimate.org May 2016 Climate Summary Month Summary Cold weather dominated in May until the last week of the month. May began wet but
October 2017 Climate Summary
 Ken Scheeringa and Andy Eggert Nov 6, 2017 (765) 494-8105 http://www.iclimate.org October 2017 Climate Summary Month Summary After more than three weeks of warm temperatures October turned suddenly cold
NWS FORM E-5 U.S. DEPARTMENT OF COMMERCE I HYDRO SERVICE AREA NOAA, NATIONAL WEATHER SERVICE I Indianapolis, IN MONTHLY REPORT
 NWS FORM E-5 U.S. DEPARTMENT OF COMMERCE I HYDRO SERVICE AREA NOAA, NATIONAL WEATHER SERVICE I Indianapolis, IN. 1-------------------- MONTHLY REPORT OF RIVER AND FLOOD CONDITIONSI REPORT FOR I November
October 2012 Climate Summary
 Ken Scheeringa and Kayla Hudson Nov 8, 2012 (765) 494-8105 http://www.iclimate.org October 2012 Climate Summary Month Summary In a reversal from the hot and dry summer, cooler and wetter than normal conditions
Champaign-Urbana 1998 Annual Weather Summary
 Champaign-Urbana 1998 Annual Weather Summary ILLINOIS STATE WATER SURVEY Audrey Bryan, Weather Observer 2204 Griffith Dr. Champaign, IL 61820 wxobsrvr@sparc.sws.uiuc.edu The development of the El Nìno
February 2017 Climate Summary
 Ken Scheeringa And Andy Eggert Mar 9, 2017 (765) 494-8105 http://www.iclimate.org February 2017 Climate Summary Month Summary February 2017 was the warmest February in Indiana since state climate records
January 2006 Climate Summary
 Ashley Brooks (765) 494-6574 Feb 9, 2006 http://www.iclimate.org January 1-3 January 2006 Climate Summary Unseasonably warm conditions welcomed in the New Year with highs in the 40s across the northern
September 2005 Climate Summary
 Ashley Brooks (765) 494-6574 Oct 5, 2005 http://iclimate.org September 2005 Climate Summary September 1-7 A cold front came through on the 1 st of the month, however little moisture was associated with
September 2016 Climate Summary
 Ken Scheeringa And Andy Eggert Oct 6, 2016 (765) 494-8105 http://www.iclimate.org September 2016 Climate Summary Month Summary The warmest September in 77 years brought alternating weeks of dry and wet
April 2015 Climate Summary
 Ken Scheeringa And Mary Rose Mangan May 8, 2015 http://www iclimate org April 2015 Climate Summary Month Summary April was a month of extremes. Severe weather erupted on 4 days of the first week with multiple
May 2015 Climate Summary
 Ken Scheeringa And Mary Rose Mangan Jun 8, 2015 (765) 494-8105 http://www.iclimate.org May 2015 Climate Summary Month Summary May was a very warm month. Rainfall averaged near normal but was distributed
The hydrologic service area (HSA) for this office covers Central Kentucky and South Central Indiana.
 for this office covers Central Kentucky and South Central Indiana.") January 2012 February 13, 2012 An X inside this box indicates that no flooding occurred within this hydrologic service area. January 2012 continued the string of wet months this winter. Rainfall was generally
January 2012 February 13, 2012 An X inside this box indicates that no flooding occurred within this hydrologic service area. January 2012 continued the string of wet months this winter. Rainfall was generally
Champaign-Urbana 1999 Annual Weather Summary
 Champaign-Urbana 1999 Annual Weather Summary ILLINOIS STATE WATER SURVEY 2204 Griffith Dr. Champaign, IL 61820 wxobsrvr@sws.uiuc.edu Maria Peters, Weather Observer A major snowstorm kicked off the new
The hydrologic service area (HSA) for this office covers Central Kentucky and South Central Indiana.
 for this office covers Central Kentucky and South Central Indiana.") MONTH YEAR January 2011 February 15, 2011 X An X inside this box indicates that no flooding occurred within this hydrologic service area. January 2011 was drier than normal in all locations in the area.
MONTH YEAR January 2011 February 15, 2011 X An X inside this box indicates that no flooding occurred within this hydrologic service area. January 2011 was drier than normal in all locations in the area.
June 2010 Climate Summary
 Ken Scheeringa (765) 494-8105 Jul 6, 2010 http://www.iclimate.org June 2010 Climate Summary Summary Summer like heat and humidity arrived in Indiana on May 22 nd and dominated our weather scene nearly
April 2013 Climate Summary
 Ken Scheeringa and Kayla Hudson May 6, 2013 (765) 494-8105 http://www.iclimate.org April 2013 Climate Summary Month Summary Temperatures bounced high and low this month, keeping Hoosiers guessing which
NIDIS Weekly Climate, Water and Drought Assessment Summary. Upper Colorado River Basin July 31, 2012
 NIDIS Weekly Climate, Water and Drought Assessment Summary Upper Colorado River Basin July 31, 2012 Fig. 1: July month-to-date precipitation in inches. Fig. 2: SNOTEL WYTD precipitation percentiles (50%
Climate versus Weather
 Climate versus Weather What is climate? Climate is the average weather usually taken over a 30-year time period for a particular region and time period. Climate is not the same as weather, but rather,
July 2010 Climate Summary
 Ken Scheeringa (765) 494-8105 Aug 4, 2010 http://www.iclimate.org July 2010 Climate Summary Summary The warm summer of 2010 continues. Daily state average temperatures were above normal on all but seven
Weather and Climate Summary and Forecast April 2018 Report
 Weather and Climate Summary and Forecast April 2018 Report Gregory V. Jones Linfield College April 4, 2018 Summary: A near Miracle March played out bringing cooler and wetter conditions to the majority
Weather and Climate Summary and Forecast February 2018 Report
 Weather and Climate Summary and Forecast February 2018 Report Gregory V. Jones Linfield College February 5, 2018 Summary: For the majority of the month of January the persistent ridge of high pressure
Weather and Climate Summary and Forecast March 2018 Report
 Weather and Climate Summary and Forecast March 2018 Report Gregory V. Jones Linfield College March 7, 2018 Summary: The ridge pattern that brought drier and warmer conditions from December through most
MONTHLY REPORT OF RIVER AND FLOOD CONDITIONS
 NWS FORM E-5 U.S. DEPARTMENT OF COMMERCE HSA OFFICE: NOAA, NATIONAL WEATHER SERVICE NWS Northern Indiana (IWX) REPORT FOR (MONTH&YEAR): January 2005 MONTHLY REPORT OF RIVER AND FLOOD CONDITIONS DATE: February
Weather and Climate Summary and Forecast Winter
 Weather and Climate Summary and Forecast Winter 2016-17 Gregory V. Jones Southern Oregon University February 7, 2017 What a difference from last year at this time. Temperatures in January and February
April 2016 Climate Summary
 Ken Scheeringa And Andy Eggert May 9, 2016 (765) 494-8105 http://www.iclimate.org April 2016 Climate Summary Month Summary One month but two seasons. The first half of April was cold with snow. Wind damage
JEFF JOHNSON S Winter Weather Outlook
 JEFF JOHNSON S 2017-2018 Winter Weather Outlook TABLE OF CONTENTS ABOUT THE AUTHOR Components of the seasonal outlook... 2 ENSO state/ocean temperatures... 3 Sub-seasonal outlooks... 4 Forecast models...
Weather and Climate Summary and Forecast October 2017 Report
 Weather and Climate Summary and Forecast October 2017 Report Gregory V. Jones Linfield College October 4, 2017 Summary: Typical variability in September temperatures with the onset of fall conditions evident
Monthly Long Range Weather Commentary Issued: July 18, 2014 Steven A. Root, CCM, President/CEO
 Monthly Long Range Weather Commentary Issued: July 18, 2014 Steven A. Root, CCM, President/CEO sroot@weatherbank.com JUNE 2014 REVIEW Climate Highlights The Month in Review The average temperature for
Impacts of the April 2013 Mean trough over central North America
 Impacts of the April 2013 Mean trough over central North America By Richard H. Grumm National Weather Service State College, PA Abstract: The mean 500 hpa flow over North America featured a trough over
KANSAS CLIMATE SUMMARY January 2018
 KANSAS CLIMATE SUMMARY January 2018 Some welcome moisture After an extended period with little to no moisture, parts of Kansas recorded some significant precipitation. At Tribune, a small snow event on
W I N T E R STORM HAZARD DESCRIPTION
 W I N T E R STORM HAZARD DESCRIPTION... 1 LOCATION... 2 EXTENT... 2 HISTORICAL OCCURRENCES... 4 SIGNIFICANT PAST EVENTS... 4 PROBABILITY OF FUTURE EVENTS... 5 VULNERABILITY AND IMPACT... 5 HAZARD DESCRIPTION
Arizona Climate Summary May 2012
 Arizona Climate Summary May 2012 Summary of conditions for April 2012 April 2012 Temperature and Precipitation Summary April 1 st 16 th : Although April began with another low pressure system sweeping
Air Masses, Fronts, Storm Systems, and the Jet Stream
 Air Masses, Fronts, Storm Systems, and the Jet Stream Air Masses When a large bubble of air remains over a specific area of Earth long enough to take on the temperature and humidity characteristics of
National Wildland Significant Fire Potential Outlook
 National Wildland Significant Fire Potential Outlook National Interagency Fire Center Predictive Services Issued: September, 2007 Wildland Fire Outlook September through December 2007 Significant fire
X An X inside this box indicates that no flooding occurred within this Hydrologic Service Area.
 NWS FORM E-5 U.S. DEPARTMENT OF COMMERCE HSA OFFICE: NOAA, NATIONAL WEATHER SERVICE MONTHLY REPORT OF RIVER AND FLOOD CONDITIONS DATE: TO: North Webster, IN REPORT FOR (MONTH &YEAR): January, 2003 February
The Pennsylvania Observer
 The Pennsylvania Observer August 3, 2015 July 2015 - Pennsylvania Weather Recap By: Arthur Person Although this seventh month of 2015 was fairly normal across Pennsylvania as a whole, the details reveal
Weather and Climate Summary and Forecast March 2019 Report
 Weather and Climate Summary and Forecast March 2019 Report Gregory V. Jones Linfield College March 2, 2019 Summary: Dramatic flip from a mild winter to a top five coldest February on record in many locations
March 2011 Climate Summary
 Ken Scheeringa (765) 494-8105 Apr 5, 2011 http://www.iclimate.org March 2011 Climate Summary Summary The fast paced weather action of February slowed some in March. The major March weather features were
NWS FORM E-5 U.S. DEPARTMENT OF COMMERCE HSA OFFICE:
 NWS FORM E-5 U.S. DEPARTMENT OF COMMERCE HSA OFFICE: NOAA, NATIONAL WEATHER SERVICE MONTHLY REPORT OF RIVER AND FLOOD CONDITIONS DATE: TO: North Webster, IN REPORT FOR (MONTH &YEAR): July 1998 August 5,
Monthly Long Range Weather Commentary Issued: APRIL 18, 2017 Steven A. Root, CCM, Chief Analytics Officer, Sr. VP,
 Monthly Long Range Weather Commentary Issued: APRIL 18, 2017 Steven A. Root, CCM, Chief Analytics Officer, Sr. VP, sroot@weatherbank.com MARCH 2017 Climate Highlights The Month in Review The average contiguous
Weather and Climate Summary and Forecast January 2018 Report
 Weather and Climate Summary and Forecast January 2018 Report Gregory V. Jones Linfield College January 5, 2018 Summary: A persistent ridge of high pressure over the west in December produced strong inversions
Weather and Climate Summary and Forecast October 2018 Report
 Weather and Climate Summary and Forecast October 2018 Report Gregory V. Jones Linfield College October 4, 2018 Summary: Much of Washington, Oregon, coastal California and the Bay Area and delta region
The Pennsylvania Observer
 The Pennsylvania Observer October 1, 2015 September 2015 - Pennsylvania Weather Recap By: Quinn Lease The month of September will be remembered for its above normal temperatures and dry conditions that
Summary of November Central U.S. Winter Storm By Christopher Hedge
 Summary of November 12-13 2010 Central U.S. Winter Storm By Christopher Hedge Event Overview The first significant snowfall of the 2010-2011 season affected portions of the plains and upper Mississippi
Pacific Decadal Oscillation ( PDO ):
:") Time again for my annual Winter Weather Outlook. Here's just a small part of the items I considered this year and how I think they will play out with our winter of 2015-2016. El Nino / La Nina: When looking
Time again for my annual Winter Weather Outlook. Here's just a small part of the items I considered this year and how I think they will play out with our winter of 2015-2016. El Nino / La Nina: When looking
The Pennsylvania Observer
 The Pennsylvania Observer May 31, 2012 May 2012 - Pennsylvania Weather Recap By: Paul Knight The majority of the fifth month had temperatures averaging well above seasonal levels with two distinct hot
NATIONAL WEATHER SERVICE
 January 2016 February 9, 2016 This was a dry month across the HSA despite one large and several smaller snowfalls. Most locations ended up 1-2 inches below normal for the month. The driest locations at
Drought Update May 11, 2018
 Drought Update May 11, 2018 Current status After a record cold April, May has started with much warmer than normal temperatures. The statewide average temperature for the week ending on May 8th was 65.7
Flood warnings were issued for the Maumee, St. Marys, Blanchard, St. Joseph (Ohio), Tippecanoe, Tiffin, Eel and Wabash Rivers on the 30 th and 31 st.
, Tippecanoe, Tiffin, Eel and Wabash Rivers on the 30 th and 31 st.") NWS FORM E-5 U.S. DEPARTMENT OF COMMERCE HSA OFFICE: NOAA, NATIONAL WEATHER SERVICE MONTHLY REPORT OF RIVER AND FLOOD CONDITIONS DATE: TO: North Webster, IN REPORT FOR (MONTH &YEAR): January 2002 February
NWS FORM E-5 U.S. DEPARTMENT OF COMMERCE HSA OFFICE: NOAA, NATIONAL WEATHER SERVICE MONTHLY REPORT OF RIVER AND FLOOD CONDITIONS DATE: TO: North Webster, IN REPORT FOR (MONTH &YEAR): January 2002 February
TFS WEATHER BRIEF. Monday, March 25
 TFS WEATHER BRIEF Monday, March 25 Review: The leading edge of cooler and drier air was pushing through Central and East TX this morning. A few lingering thunderstorms were in progress south of I-20 in
Colorado CoCoRaHS. Colorado CoCoRaHS. Because Every Drop Counts! November 2014 Volume 2, Issue 11
 U.S. PRECIPITATION (% OF AVERAGE) LOOKING BACK AT OCTOBER 2014 October was a fairly dry month for much of the nation with the exception of the Pacific Northwest, portions of New England and the Tennessee
2012 Growing Season Weather Summary for North Dakota. Adnan Akyüz and Barbara A. Mullins Department of Soil Science October 30, 2012
 2012 Growing Season Weather Summary for North Dakota Adnan Akyüz and Barbara A. Mullins Department of Soil Science October 30, 2012 Introduction The 2012 growing season (the period from April through September)
May 2016 Volume 23 Number 5
 The Weather Wire May 2016 Volume 23 Number 5 Contents: Winter Summary Current Colorado and West-wide Snow Pack Drought Monitor April Summary/Statistics May Preview Snowfall Totals Winter Summary The Front
New Hampshire State Climate Office Dr. Mary D. Stampone, State Climatologist
 New Hampshire State Climate Office Dr. Mary D. Stampone, State Climatologist University of New Hampshire c/o Department of Geography 73 Main Street Durham, NH 03824 Phone: 603-862-3136 Fax: 603-862-4362
KANSAS CLIMATE SUMMARY February 2015
 KANSAS CLIMATE SUMMARY February 2015 Extended Cold Despite some record warm readings at a few locations, February was characterized by colder than normal conditions. This was particularly true during the
National Wildland Significant Fire Potential Outlook
 National Wildland Significant Fire Potential Outlook National Interagency Fire Center Predictive Services Issued: April 1, 2008 Next Issue: May 1, 2008 Wildland Fire Outlook April 2008 through July 2008
Winter. Here s what a weak La Nina usually brings to the nation with tempseraures:
 2017-2018 Winter Time again for my annual Winter Weather Outlook. Here's just a small part of the items I considered this year and how I think they will play out with our winter of 2017-2018. El Nino /
Monthly Long Range Weather Commentary Issued: February 15, 2015 Steven A. Root, CCM, President/CEO
 Monthly Long Range Weather Commentary Issued: February 15, 2015 Steven A. Root, CCM, President/CEO sroot@weatherbank.com JANUARY 2015 Climate Highlights The Month in Review During January, the average
UNITED STATES AND SOUTH AMERICA OUTLOOK (FULL REPORT) Wednesday, April 18, 2018
 Wednesday, April 18, 2018") T-storm Weather Summary Coolness continues over the next week in much of the central U.S., most likely producing the coldest April since 1907 in the Corn Belt, but followed by seasonable to mild weather
T-storm Weather Summary Coolness continues over the next week in much of the central U.S., most likely producing the coldest April since 1907 in the Corn Belt, but followed by seasonable to mild weather
but 2012 was dry Most farmers pulled in a crop
 After a winter that wasn t, conditions late in the year pointed to a return to normal snow and cold conditions Most farmers pulled in a crop but 2012 was dry b y M i k e Wr o b l e w s k i, w e a t h e
Illinois Drought Update, December 1, 2005 DROUGHT RESPONSE TASK FORCE Illinois State Water Survey, Department of Natural Resources
 Illinois Drought Update, December 1, 2005 DROUGHT RESPONSE TASK FORCE Illinois State Water Survey, Department of Natural Resources For more drought information please go to http://www.sws.uiuc.edu/. SUMMARY.
July 2011 Climate Summary
 Ken Scheeringa (765) 494-8105 Aug 8, 2011 http://www.iclimate.org July 2011 Climate Summary Month Summary The upper atmospheric high pressure dome which baked the Texas area in heat and drought the past
The Pennsylvania Observer
 The Pennsylvania Observer April 2, 2010 March 2010 Pennsylvania Weather Recap Prepared by: Katelyn Johnson March did come in as a lion cub this year. The 1 st proved to be a calm day; however most of Pennsylvania
L.O Students will learn about factors that influences the environment
 Name L.O Students will learn about factors that influences the environment Date 1. At the present time, glaciers occur mostly in areas of A) high latitude or high altitude B) low latitude or low altitude
Weather and Climate Summary and Forecast August 2018 Report
 Weather and Climate Summary and Forecast August 2018 Report Gregory V. Jones Linfield College August 5, 2018 Summary: July 2018 will likely go down as one of the top five warmest July s on record for many
WeatherManager Weekly
 Issue 288 July 14, 2016 WeatherManager Weekly Industries We Serve Agriculture Energy/Utilities Construction Transportation Retail Our Weather Protection Products Standard Temperature Products Lowest Daily
UNITED STATES AND SOUTH AMERICA OUTLOOK (FULL REPORT) Thursday, December 28, 2017
 Thursday, December 28, 2017") T-storm Weather Summary Despite scattered t-storms Sat.-Sun. in central and northern areas in Argentina, more will likely be needed especially in sunflower areas of the southwest. Some t-storms likely
T-storm Weather Summary Despite scattered t-storms Sat.-Sun. in central and northern areas in Argentina, more will likely be needed especially in sunflower areas of the southwest. Some t-storms likely
Storm and Storm Systems Related Vocabulary and Definitions. Magnitudes are measured differently for different hazard types:
 Storm and Storm Systems Related Vocabulary and Definitions Magnitude: this is an indication of the scale of an event, often synonymous with intensity or size. In natural systems, magnitude is also related
The hydrologic service area (HSA) for this office covers Central Kentucky and South Central Indiana.
 for this office covers Central Kentucky and South Central Indiana.") NWS Form E-5 (04-2006) NATIONAL OCEANIC AND ATMOSPHERIC ADMINISTRATION (PRES. BY NWS Instruction 10-924) NATIONAL WEATHER SERVICE MONTHLY REPORT OF HYDROLOGIC CONDITIONS HYDROLOGIC SERVICE AREA (HSA) Louisville
NWS Form E-5 (04-2006) NATIONAL OCEANIC AND ATMOSPHERIC ADMINISTRATION (PRES. BY NWS Instruction 10-924) NATIONAL WEATHER SERVICE MONTHLY REPORT OF HYDROLOGIC CONDITIONS HYDROLOGIC SERVICE AREA (HSA) Louisville
HAZARD DESCRIPTION... 1 LOCATION... 1 EXTENT... 1 HISTORICAL OCCURRENCES...
 WINTER STORM HAZARD DESCRIPTION... 1 LOCATION... 1 EXTENT... 1 HISTORICAL OCCURRENCES... 3 SIGNIFICANT PAST EVENTS... 4 PROBABILITY OF FUTURE EVENTS... 5 VULNERABILITY AND IMPACT... 5 Hazard Description
NIDIS Drought and Water Assessment
 NIDIS Drought and Water Assessment PRECIPITATION The images above use daily precipitation statistics from NWS COOP, CoCoRaHS, and CoAgMet stations. From top to bottom, and left to right: most recent 7-days
Arizona Climate Summary January 2017 Summary of conditions for December 2016
 Arizona Climate Summary January 2017 Summary of conditions for December 2016 December 2016 Temperature and Precipitation Summary December 1 st 15 th : Similar to November, December began with a dry trough
KANSAS CLIMATE SUMMARY May 2018
 KANSAS CLIMATE SUMMARY May 2018 From Cold to Hot May came close to setting the record as the hottest since 1895. The state-wide average temperature for the month was 70.6 o F. This was 7.2 degrees warmer