August 2015 Climate Summary
|
|
|
- Jonathan Parks
- 5 years ago
- Views:
Transcription

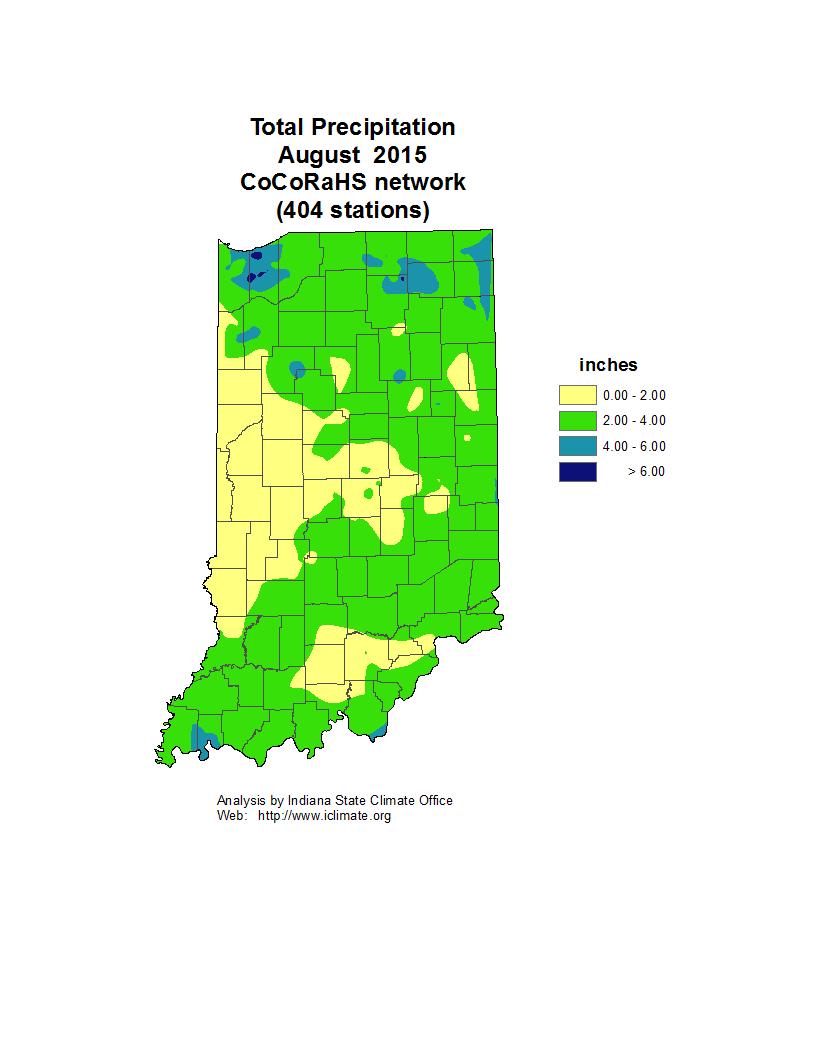
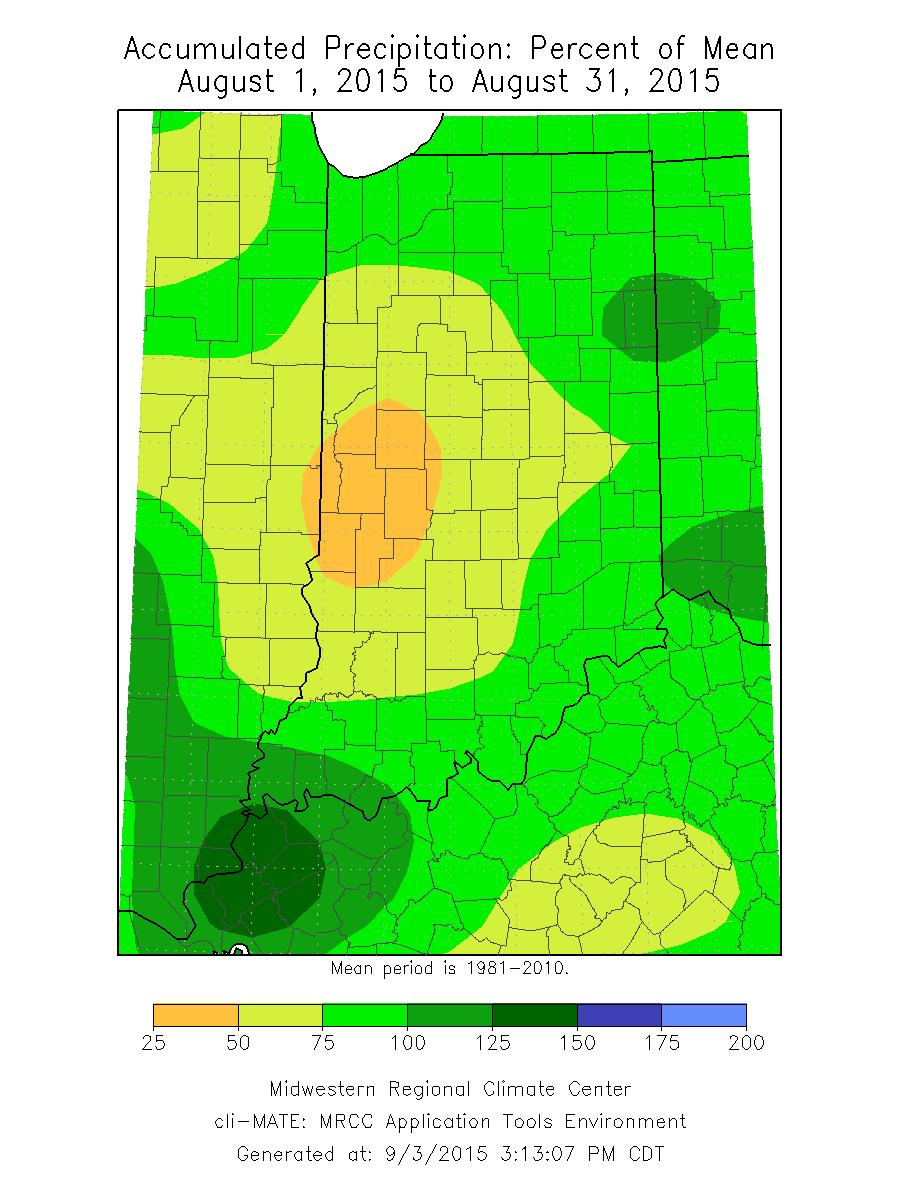
1 Ken Scheeringa And Mary Rose Mangan Sep 4, 2015 (765) August 2015 Climate Summary Month Summary A very active wet summer weather pattern turned much calmer and drier in August. Just five storm systems moved through Indiana this month as evidenced by fewer rainy days and below normal rainfall. Near normal temperatures trended cool late in the month. Severe weather occurred on 7 days with most events localized to a few counties. No weather related injuries or deaths were reported. August continued the cool trend set in July. The state average temperature for August 2015 was 71.0 F which is 1.6 F below normal. This ties 1903 as the 29 th coolest August on record. The most recent cooler August was in 2009 with a state average 70.7 F in 26 th place. Before then the 68.6 F average in 2004 was good for 6 th coolest. The coldest August on record came in 1927 with its 66.3 F temperature average. The day split in August 2015 was 18 days of below normal temperature, 11 days above normal, and 2 days at normal. There were no days when the state temperature was more than 10 F above or below normal. The highest temperature of the month in the cooperative observer network was 96 F on August 3 rd in Terre Haute. The coldest minimum was 42 F on August 25 th in Elnora. The August state precipitation average of 2.59 was 1.20 below normal, the 29 th driest August on record. The most recent drier August was in 2013 when a 1.84 average was recorded. This amount tied 2010 for the 5 th driest August on record in Indiana. The 2.55 value for 2011 comes in at 28 th driest. In 2008 the average rainfall was calculated at 2.01 in the 9 th spot. The driest August on record was 1.60 as reported in The highest single day precipitation among cooperative stations in August 2015 was 3.26 recorded on August 18 th at Crawfordsville. The highest daily total in the CoCoRaHS network was 6.18 measured that same day at Lakes of the Four Seasons. The highest monthly total in the cooperative network was 7.85 as tallied at Decatur 1n. In the CoCoRaHS network the highest monthly total was 8.94 noted by the volunteer in Portage 2.8e. Regionally August 2015 precipitation was near 85% of normal in northern Indiana, 55% of normal in central counties, and 70% of normal across the south. Normal August precipitation ranges from 3.6 in east central to 4.0 in west central Indiana. Widespread precipitation fell on about 11 days this month.
2 August 1 st 8 th The opening days of August were slightly warmer than normal but state temperatures the rest of the 8 day interval turned cool. Light to moderate rain fell mostly during this cooler weather. Just one storm system passed through Indiana over the interval but was responsible for severe weather on three consecutive days: August 2 nd, 3 rd, and 4 th. Despite a very wet June and July farms with sandy soils dried quickly and some farmers decided to start their irrigation systems. High pressure moved into Indiana on August 1 st with state temperatures poised right at normal. The ridge remained overhead the state the next day and coaxed the state average temperature upward to 2 F above normal. A cold front reached Indiana on August 3 rd. The state temperature nudged barely colder to 1 F above normal. The slowing front crossed the state the next day as temperatures gradually slid to 1 F below normal. The front inched its way into Kentucky on August 5 th. The cold front stalled then drifted slightly northward as a near stationary front the next day, settling along the Ohio River. The Indiana state temperature fell to 3 F below normal, the coolest of the 8 day interval. On August 7 th the stationary front reverted to a cold front and resumed its travel to the southern states. A triplet of low pressure centers gathered in Minnesota, leaving Indiana positioned between the two weather systems. The state temperature held at 3 F below normal. On August 8 th a minor storm system with its own stationary front reached Chicago while the old southern cold front halted again over the southern states. The 8 days closed with the state temperature at 2 F below normal. Over the 8 day interval the state temperature averaged to 1 F below normal. Typically in this first week of August the daily maximum temperature should range between 82 F in far northern Indiana to 88 F in the far southwest corner of the state. The daily minimum normally varies between 63 F and 67 F north to south across the state. The warmest daily maximum temperature in the cooperative station network during the interval was 96 F at Terre Haute on August 3 rd. The coolest daily minimum in this same network was 51 F at Shoals 5s on August 2 nd. Rainfall was light the first few August days then became heavier once the cold front stalled along the Ohio River. More than 2 inches fell over the 8 day interval generally along a southwest to east central Indiana line between Gibson and Union counties. Less than a half inch was measured across much of west central Indiana. The heaviest single day amounts were noted in central Indiana in the CoCoRaHS morning reports of August 7 th. On that day the Taylorsville volunteer measured 2.73 while three Columbus observers collected 2.35, 2.10, and 1.90 in their rain gages. In Greensburg 2.07 was recorded that morning. Over the full 8 days Richmond tallied 3.11 and Taylorsville had An observer 9 miles outside Columbus noted 2.71, Plainville had 2.59, and in Evansville 2.31 was summed. Regionally about 0.8 was common across northern and central Indiana while near 1.50 was typical across the south. These totals equate to near 80% of normal in northern Indiana, 90% of normal in central areas, and 120% of normal in the south. Wind damage occurred in a handful of Indiana counties on August 2 nd. In Fulton county the roof of a round barn was damaged and fallen trees caused power outages. Nearby in Miami county several trees fell on to a chicken coop. Wind gusts to 60 mph tore down sparking power lines in Porter and Laporte counties on to roadways below. In Porter county a dozen trees were uprooted in a city park
3 with several more trees down in a neighborhood nearby, one landing on a house causing damage. Wind gust damage was reported throughout the city of Valparaiso. Uprooted trees in Laporte and Steuben counties blocked roadways. Large hail was reported in 5 counties of east central Indiana the next day. Hail to 1.25 in diameter was noted in Randolph county with 1.75 stones in Delaware county. One inch hail was noted in Randolph and Wayne counties. Still larger hail with sizes of 1.75 and 2.00 were recorded in Union county while hail to 2.50 was observed in Fayette county. Meanwhile thunderstorm winds leveled several trees in Wayne and Union counties. Severe weather was limited to two far southern Indiana counties on August 4 th. A few trees were taken down by storms in Spencer and Harrison counties with one tree reported on a local roadway. The August 10 th edition of the USDA Indiana crop bulletin reports recent warmer weather has dried remaining wet spots in fields. Some farmers in sandy soils have commenced irrigation to keep crops from drying out further where crops were showing light to moderate stress. Soybeans have recovered more quickly than corn after the heavy summer rains. Many corn plants were still yellow with the tips of ears aborting kernels due to lack of nitrogen. Corn ears were reported small while soybeans were showing fewer nodes. Weeds were competing greatly with soybeans for space and nutrients. Overall less than half the Indiana crop of corn and soybeans is rated in excellent to good condition Livestock condition remained good due to adequate pastures. Some long term impacts from the rainy early summer are easing. Reservoir water levels in Miami county were dropping about 1 foot per day yet remain above normal. Water levels are expected to return to normal by early September. Most recreational facilities remained closed. Heavy rainfall this summer has hampered other projects. Officials in Blackford, Delaware, and Henry counties reported that patching thousands of street potholes had fallen far behind due to the summer rainfall and the shear number of roads needing repair work after the rough winter. County roads in many Indiana counties were rated in deplorable condition.
4 August 9 th 15 th August weather was rather quiet this week. The state average temperature held within 3 F of normal as, like the week before, just one weather system passed through the state. The week began and ended slightly warmer than normal with temperatures a bit cooler than normal in mid-week. Rainfall followed the temperature trend with dry weather on cool days and precipitation falling during warmer days. Severe weather was localized to one county which reported wind damage at the end of the week. The week opened with the state average temperature right at normal. High pressure was retreating east of Indiana on August 9 th. A storm system from Kansas approached the state later in the day. The storm s warm front crossed into central Indiana the next day, lifting the state temperature to 3 F above normal, the warmest day of the week. The cold front side of the storm moved through and beyond Indiana on August 11 th, replacing rainy days with sunny skies. Over the next 4 days a large ridge of high pressure settled overhead the state. The arrival of cooler air on August 12 th forced the state temperature down to 3 F below normal. The ridge sprawled northeast of Indiana over the next 4 days, slowly raising the state temperature to 2 F below normal on August 13 th, then to 1 F below normal the next day. On August 15 th the ridge started its exit to the east of Indiana. The state temperature continued to rise to wrap up the week at 1 F above normal. Overall the state temperature averaged to right about normal this week Typically at this point in August the daily maximum temperature should range between 81 F and 88 F north to south across Indiana. Daily minimums should vary from 62 F in far northern Indiana to near 66 F in the southwest corner of the state. The warmest maximum temperature this week in the cooperative station network was 91 F at Terre Haute on August 11 th and at Farmersburg on August 15 th. The coolest minimum temperature in this same network was 53 F at several locations on August 13 th and 14 th. Generally only the northeast quarter of the state received more than a half inch of rain this week. Within this area only far eastern communities bordering Ohio received the heaviest totals of 1 to 2 of rainfall. Regionally for the week about 0.7 of rain dropped in northern Indiana, 0.4 fell in central counties, and about 0.2 wet the ground in the south. These amounts equate to about 80% of normal across the north, 50% of normal in the central section of the state, and 30% of normal in southern Indiana. The heaviest single day amounts were found in northern Indiana in the August 15 th morning reports. In the CoCoRaHS network the Urbana observer collected 1.65 while 1.28 was measured near Wanatah. In Hamilton a volunteer noted 1.04 while 1.02 fell outside Rochester. Over the full week northeast and north central Indiana reports were largest with the Hamilton observer tallying 1.74, Urbana 1.67, Albany 1.61, Portland 1.51, and Angola Severe weather was limited to just one county on one day this week. A localized storm in Dubois county on August 15 th downed trees and power poles there. No other reports of damages or injuries were received from across the state. There was good news for Indiana farmers this week. On August 12 th the USDA declared farms in 53 Indiana counties were eligible for federal aid due to the heavy rain and flooding experienced in
5 June and July. The declaration permits farmers in these counties to apply for low interest emergency loans through their county Farm Service Agency office. Sunny and dry weather is extracting moisture from Indiana soils according to the August 17 th edition of the USDA Indiana crop bulletin. Irrigation systems are running in some of the drier areas. The report said corn was finally greening up and soybeans were filling pods in response to the past 3 weeks of warm temperatures and light precipitation. But low levels of nitrogen and potassium are still a concern in some fields. Late cuttings of hay were underway while livestock are in good condition despite some minor heat stress. Still less than half of Indiana corn and soybean crops are rated in good to excellent condition. August 16 th 22 nd Mostly tranquil weather persisted into this third week of August. Only one weather system each week thus far has passed through Indiana this month. Early this week warm air on the front side of the single weather system brought warmer than normal temperatures into the state. Cooler than normal temperatures behind the system s cold front finished off the final 3 days. Light to moderate rain fell on all but the last day, making for a wetter than normal week. Two northern Indiana counties reported local wind damage on August 17 th as the lone weather system moved closer to the state. Local soil dryness is forcing crop dry down to begin in some farmer fields where crops were planted early. Strong high pressure in West Virginia transported warm air into Indiana from the Gulf states. The state average temperature held at 3 F above normal on August 16 th and 17 th. The storm system slowed to a halt near Chicago on August 18 th, unable to proceed against the high pressure block over Indiana and eastern states. The state temperature edged lower to 2 F above normal. The storm retrograded but strengthened the next day, planting its warm front in northern Michigan and its cold front in Illinois. Indiana was positioned firmly inside the storm s warm sector. On August 20 th the cold front finally pushed through Indiana, tapping into colder Canadian air and dropping the state temperature to 5 F below normal. Cold high pressure behind the front lingered
6 over Ohio and Indiana the next day. The high center passed to the east of Indiana on August 22 nd, setting up a weak backside flow into the state to nudge the state temperature to 4 F below normal. Over the 7 days the state temperature averaged to 1 F below normal. Usually in the third week of August daily maximum temperatures should range from about 81 F in far northern counties to 88 F in the southwest corner of the state. Daily minimums should vary between 62 F and 65 F north to south across the state. The warmest temperature of the week among cooperative stations was 92 F at Elnora on August 16 th and at Vincennes 5ne on August 17 th. The coolest temperature in this same network was 48 F at West Lafayette 6nw on August 21 st and at New Castle 4sse on August 22 nd. Rain fell every day somewhere in Indiana until the cold front passed through and cleared Indiana skies. Generally more than an inch of rain accumulated north of a Fowler to South Bend line and in the southern tier of counties bordering the Ohio River. Rainfall was very heavy in Porter county. Regionally about 1.0 fell across northern and southern Indiana and about 0.7 across the central part of the state. These amounts equate to about 120% of normal in the north, right at normal in central Indiana, and 140% of normal across the south. The heaviest single day rainfall was revealed in the daily morning reports of August 18 th. Two CoCoRaHS network volunteers at the Lakes of the Four Seasons measured 6.18 and 5.05 that day. Nearby in Portage 4.54 was recorded while 4.48 was noted outside the city of Valparaiso. A Syracuse gage in Kosciusko county collected Over the full week the Portage observer summed 6.44 of rain while three Valparaiso area residents tallied 4.83, 3.97, and 3.89 for the week. A Mount Ayr volunteer noted Wind gust damage was reported in Kosciusko and Miami counties on August 17 th. In Kosciusko county trees were uprooted with one tree falling on to a roadway. The heavy rainfall also flooded a garage there. In Miami county a few trees were toppled by the wind and scattered power outages were noted. The August 24 th edition of the USDA Indiana crop bulletin reports that the dry down process for early planted corn and soybeans has started early in response to recent cool and mostly dry weather conditions. The sudden transition from very wet weather has left some corn stunted or nutrient deficient with below average filling of ears. Less than half of all corn and soybeans continues to be rated in excellent or good condition. Some of the poor corn was being harvested for silage. Growth in other crops has also slowed due to the cooler weather. Diseases are becoming more apparent. Some pastures are starting to show brown grasses due to lack of moisture but livestock condition remains good.
7 August 23 rd 31 st The final 9 days of August marked the coldest time of the month. The state average temperature exceeded normal on only the last 2 of these 9 days. Rainfall totals were generally well below normal. Just two storm systems rolled through the state as August weather remained rather tranquil. One county reported wind damage on August 23 rd, the only severe weather report in these closing days of the month. The state average temperature on August 23 rd was 2 F below normal. A strong cold front in Illinois swept quickly through Indiana and raced to Pennsylvania by the next morning. Indiana temperatures dipped to 7 F below normal on August 24 th. Cold air funneled into the state the next day as rainfall stopped and high pressure took over, clearing the skies. The state temperature fell to 9 F below normal, the coldest of the month. The high pressure ridge drifted slowly overhead Indiana on August 27 th and slid to the east a day later. The state temperature slowly rebounded to 6 F below normal by August 28 th as southerly winds behind the ridge tapped into warmer air. On August 29 th an Iowa storm system set a stationary front just north of Indiana and a slowing cold front in Missouri and Kansas. Warm air flow ahead of this storm helped bump the Indiana temperature to 2 F below normal. The next day the cold front stalled as a stationary front that extended from Oklahoma into northern Indiana. Yet the transport of warm air continued, lifting the state temperature to 3 F above normal. The front dissolved later in the day as warmer air mixed well north and south of the front. High pressure behind the fizzled front pushed east of Indiana on August 31 st, allowing warming to continue. The state temperature on the last August day rose to 4 F above normal. Over these 9 days the state temperature averaged to 4 F below normal. Typically in the final days of August the daily maximum temperature would range between 80 F and 87 F north to south across the state. Normal daily minimums should vary from 60 F in far northern counties of the state to 64 F in southwest Indiana. The warmest temperature among cooperative network stations over the 9 day interval was 92 F at Terre Haute on August 31 st. The coolest temperature in this same network was 42 F at Elnora on August 25 th.
8 Rain fell mostly at the very start and end of the 9 days with dry conditions in the colder middle of the interval. Less than a half inch accumulated across central and southern Indiana. Near 1 was common in the north with isolated spots receiving more than 2. On August 24 th the CoCoRaHS reporter at Leesburg measured 1.57 while in Leo 1.46 was collected. Six days later early on August 30 th the Monticello volunteer read 2.20 in the gage. Two Rensselaer observers noted 1.85 and 1.31 that morning. The highest 9 day totals included 2.48 at Monticello, 1.83 in Leo, 1.73 at North Webster, and 1.31 in Granger. Regionally about 0.6 fell across the northern third of Indiana with about 0.1 in central and southern parts of the state. These totals equate to near 60% of normal in the north but just 10% of normal in the rest of Indiana. Only Allen county reported damage due to severe weather. On August 23 rd part of a barn roof was torn off and tree limbs were ripped down in local storm gusts. On August 31 st Governor Pence requested federal grants from FEMA for nonprofit and government organizations in 19 counties that were impacted by the summer flooding. The grants would pay 75% of eligible expenses for damage to structures such as roads, bridges, utilities, building contents and equipment, water control facilities, parks and recreational facilities, and for debris removal and emergency actions such as traffic control and rescue operations. Farmers are concerned about the pending harvest season if cool and dry weather persists according to the August 31 st edition of the USDA Indiana weekly crop report. The report notes that crop maturity has slowed. Cool weather can cause underfill of corn kernels and soybean pods. Due to extreme early summer rains root systems are shallow and are susceptible to drought and root diseases. The drier weather has been beneficial for hay cutting and livestock were in very good condition the report states.
9 August 2015 Temperature Region Temperature Normal Deviation Northwest North Central Northeast West Central Central East Central Southwest South Central Southeast State Precipitation Region Precipitation Normal Deviation Percent of Normal Northwest North Central Northeast West Central Central East Central Southwest South Central Southeast State
10 Summer (June - August) Temperature Region Temperature Normal Deviation Northwest North Central Northeast West Central Central East Central Southwest South Central Southeast State Precipitation Region Precipitation Normal Deviation Percent of Normal Northwest North Central Northeast West Central Central East Central Southwest South Central Southeast State
11 2015 Annual (through August) Temperature Region Temperature Normal Deviation Northwest North Central Northeast West Central Central East Central Southwest South Central Southeast State Precipitation Region Precipitation Normal Deviation Percent of Normal Northwest North Central Northeast West Central Central East Central Southwest South Central Southeast State
12
13
14

15 Drought Summary from the U.S. Drought Monitor Below is a drought summary for the state of Indiana from the U.S. Drought Monitor. Areas in white are not experiencing any drought. Yellow areas are abnormally dry, but not considered a drought. Drought begins when the moisture levels become more severe, with beige, orange, red, and brown indicating increasing levels of drought (moderate, severe, extreme, and exceptional, respectively). The table below indicates what percentage of the state is drought free, and how much of the state is in drought by degree of severity (D1 - D4 category).
16 August 4 th Drought Summary
17 August 11 th Drought Summary
18 August 18 th Drought Summary
19 August 25 th Drought Summary
20 September 1 st Drought Summary
July 2007 Climate Summary
 Dan Bowman (765) 494-6574 Sep 3, 2007 http://www.iclimate.org Summary July 2007 Climate Summary The month of July ended as a very unusual month. Many events occurred during the month of July that is not
August 2013 Climate Summary
 Ken Scheeringa and Matt Price Sep 6, 2013 (765) 494-8105 http://www.iclimate.org August 2013 Climate Summary Month Summary August weather began cool and wet but became progressively warmer and drier through
August 2017 Climate Summary
 Ken Scheeringa And Andy Eggert Sep 7, 2017 (765) 494-8105 http://www.iclimate.org August 2017 Climate Summary Month Summary The coolest August in 13 years featured long cool and warm spells, below normal
October 2011 Climate Summary
 Ken Scheeringa and Kayla Hudson Nov 4, 2011 http://www.iclimate.org October 2011 Climate Summary Month Summary October weather evolved as a two part story. Weather conditions the first half of the month
November 2012 Climate Summary
 Ken Scheeringa and Kayla Hudson Dec 6, 2012 (765) 494-8105 http://www.iclimate.org November 2012 Climate Summary Month Summary November was one of those rare weather months in Indiana when not much happened:
September 2016 Climate Summary
 Ken Scheeringa And Andy Eggert Oct 6, 2016 (765) 494-8105 http://www.iclimate.org September 2016 Climate Summary Month Summary The warmest September in 77 years brought alternating weeks of dry and wet
March 2014 Climate Summary
 Ken Scheeringa And Matt Price Apr 8, 2014 (765) 494-8105 http://www.iclimate.org March 2014 Climate Summary Month Summary Winter had officially ended by the calendar but snow and cold persisted in Indiana
August 2006 Summary. August 1-5
 Ashley Brooks (765) 494-6574 Sep 8, 2006 http://www.iclimate.org August 1-5 August 2006 Summary The heat wave that started during the end of July continued into the beginning parts of August with temperatures
May 2018 Climate Summary
 Ken Scheeringa and Andy Eggert Jun 7, 2018 (765) 494-8105 http://www.iclimate.org May 2018 Climate Summary Month Summary As the calendar turned from April to May temperatures flipped dramatically away
January 2006 Climate Summary
 Ashley Brooks (765) 494-6574 Feb 9, 2006 http://www.iclimate.org January 1-3 January 2006 Climate Summary Unseasonably warm conditions welcomed in the New Year with highs in the 40s across the northern
September 2012 Climate Summary
 Ken Scheeringa and Kayla Hudson Oct 5, 2012 (765) 494-8105 http://www.iclimate.org September 2012 Climate Summary Month Summary Summer slipped away and it felt a lot more like autumn in Indiana this month
May 2016 Climate Summary
 Ken Scheeringa And Andy Eggert Jun 6, 2016 (765) 494-8105 http://www.iclimate.org May 2016 Climate Summary Month Summary Cold weather dominated in May until the last week of the month. May began wet but
November 2015 Climate Summary
 Ken Scheeringa And Mary Rose Mangan Dec 8, 2015 (765) 494-8105 http://www.iclimate.org November 2015 Climate Summary Month Summary November was much warmer than normal while precipitation was very near
September 2005 Climate Summary
 Ashley Brooks (765) 494-6574 Oct 5, 2005 http://iclimate.org September 2005 Climate Summary September 1-7 A cold front came through on the 1 st of the month, however little moisture was associated with
October 2014 Climate Summary
 Ken Scheeringa And Matt Price Nov 10, 2014 (765) 494-8105 http://www.iclimate.org October 2014 Climate Summary Month Summary October featured a mix of weather. A very wet first half of the month evolved
October 2017 Climate Summary
 Ken Scheeringa and Andy Eggert Nov 6, 2017 (765) 494-8105 http://www.iclimate.org October 2017 Climate Summary Month Summary After more than three weeks of warm temperatures October turned suddenly cold
May 2015 Climate Summary
 Ken Scheeringa And Mary Rose Mangan Jun 8, 2015 (765) 494-8105 http://www.iclimate.org May 2015 Climate Summary Month Summary May was a very warm month. Rainfall averaged near normal but was distributed
October 2012 Climate Summary
 Ken Scheeringa and Kayla Hudson Nov 8, 2012 (765) 494-8105 http://www.iclimate.org October 2012 Climate Summary Month Summary In a reversal from the hot and dry summer, cooler and wetter than normal conditions
December 2011 Climate Summary
 Ken Scheeringa and Kayla Hudson Jan 17, 2012 (765) 494-8105 http://www.iclimate.org December 2011 Climate Summary Month Summary What a difference a year makes! A year ago the misery of a harsh, cold, and
The hydrologic service area (HSA) for this office covers Central Kentucky and South Central Indiana.
 for this office covers Central Kentucky and South Central Indiana.") January 2012 February 13, 2012 An X inside this box indicates that no flooding occurred within this hydrologic service area. January 2012 continued the string of wet months this winter. Rainfall was generally
January 2012 February 13, 2012 An X inside this box indicates that no flooding occurred within this hydrologic service area. January 2012 continued the string of wet months this winter. Rainfall was generally
October 2016 Climate Summary
 Ken Scheeringa And Andy Eggert Nov 9, 2016 (765) 494-8105 http://www.iclimate.org October 2016 Climate Summary Month Summary October was the 9 th month so far this year to average above normal in temperature.
March 2016 Climate Summary
 Ken Scheeringa And Andy Eggert Apr 8, 2016 (765) 494-8105 http://www.iclimate.org March 2016 Climate Summary Month Summary Count March as the 7 th month in a row that the state average temperature has
January 2017 Climate Summary
 Ken Scheeringa And Andy Eggert Feb 8, 2017 (765) 494-8105 http://www.iclimate.org January 2017 Climate Summary Month Summary The warmest January in 11 years was nearly 4 F warmer than December 2016. An
April 2015 Climate Summary
 Ken Scheeringa And Mary Rose Mangan May 8, 2015 http://www iclimate org April 2015 Climate Summary Month Summary April was a month of extremes. Severe weather erupted on 4 days of the first week with multiple
September 2011 Climate Summary
 Ken Scheeringa and Kayla Hudson Oct 5, 2011 (765) 494-8105 http://www.iclimate.org September 2011 Climate Summary Month Summary The final blast of summer heat arrived at the start of September. It lasted
November 2014 Climate Summary
 Ken Scheeringa And Matt Price Dec 10, 2014 (765) 494-8105 http://www.iclimate.org November 2014 Climate Summary Month Summary Unseasonable cold headlined the Indiana and national news in November. The
April 2013 Climate Summary
 Ken Scheeringa and Kayla Hudson May 6, 2013 (765) 494-8105 http://www.iclimate.org April 2013 Climate Summary Month Summary Temperatures bounced high and low this month, keeping Hoosiers guessing which
January 2008 Climate Summary
 Joseph Mays (765) 494-6574 Feb 5, 2008 http://www.iclimate.org Summary January 2008 Climate Summary January was a mix bag of conditions, with an oscillatory pattern developing. We experienced phases of
June 2016 Climate Summary
 Ken Scheeringa And Andy Eggert Jul 8, 2016 (765) 494-8105 http://www.iclimate.org June 2016 Climate Summary Month Summary June was a warm month with below normal temperature on just 6 days. Rainfall was
November 2010 Climate Summary
 Ken Scheeringa (765) 494-8105 Dec 6, 2010 http://www.iclimate.org November 2010 Climate Summary Summary A four month drought in Indiana is collapsing as significant rain fell the final week of November.
May 2005 Climate Summary
 Ashley Brooks (765) 494-6574 Jun 7, 2005 http://iclimate.org May 2005 Climate Summary May 1-5 Early May was characterized by an upper-level trough that was in place over Indiana that brought in very cool
National Wildland Significant Fire Potential Outlook
 National Wildland Significant Fire Potential Outlook National Interagency Fire Center Predictive Services Issued: September, 2007 Wildland Fire Outlook September through December 2007 Significant fire
August 2016 Climate Summary
 Ken Scheeringa And Andy Eggert Sep 12, 2016 (765) 494-8105 http://www.iclimate.org August 2016 Climate Summary Month Summary Hot but tranquil weather the first half of August transitioned to a tormented
2012 Growing Season Weather Summary for North Dakota. Adnan Akyüz and Barbara A. Mullins Department of Soil Science October 30, 2012
 2012 Growing Season Weather Summary for North Dakota Adnan Akyüz and Barbara A. Mullins Department of Soil Science October 30, 2012 Introduction The 2012 growing season (the period from April through September)
July 2011 Climate Summary
 Ken Scheeringa (765) 494-8105 Aug 8, 2011 http://www.iclimate.org July 2011 Climate Summary Month Summary The upper atmospheric high pressure dome which baked the Texas area in heat and drought the past
January 2013 Climate Summary
 Ken Scheeringa and Kayla Hudson Feb 7, 2013 (765) 494-8105 http://www.iclimate.org January 2013 Climate Summary Month Summary Winter or spring? January featured several dramatic swings in temperature and
February 2017 Climate Summary
 Ken Scheeringa And Andy Eggert Mar 9, 2017 (765) 494-8105 http://www.iclimate.org February 2017 Climate Summary Month Summary February 2017 was the warmest February in Indiana since state climate records
NATIONAL WEATHER SERVICE
 January 2016 February 9, 2016 This was a dry month across the HSA despite one large and several smaller snowfalls. Most locations ended up 1-2 inches below normal for the month. The driest locations at
The hydrologic service area (HSA) for this office covers Central Kentucky and South Central Indiana.
 for this office covers Central Kentucky and South Central Indiana.") MONTH YEAR January 2011 February 15, 2011 X An X inside this box indicates that no flooding occurred within this hydrologic service area. January 2011 was drier than normal in all locations in the area.
MONTH YEAR January 2011 February 15, 2011 X An X inside this box indicates that no flooding occurred within this hydrologic service area. January 2011 was drier than normal in all locations in the area.
Champaign-Urbana 2001 Annual Weather Summary
 Champaign-Urbana 2001 Annual Weather Summary ILLINOIS STATE WATER SURVEY 2204 Griffith Dr. Champaign, IL 61820 wxobsrvr@sws.uiuc.edu Maria Peters, Weather Observer January: After a cold and snowy December,
November 2016 Climate Summary
 Ken Scheeringa And Andy Eggert Dec 15, 2016 (765) 494-8105 http://www.iclimate.org November 2016 Climate Summary Month Summary Unseasonably warm, pleasant, and sunny weather the first half of the month
July 2010 Climate Summary
 Ken Scheeringa (765) 494-8105 Aug 4, 2010 http://www.iclimate.org July 2010 Climate Summary Summary The warm summer of 2010 continues. Daily state average temperatures were above normal on all but seven
April 2016 Climate Summary
 Ken Scheeringa And Andy Eggert May 9, 2016 (765) 494-8105 http://www.iclimate.org April 2016 Climate Summary Month Summary One month but two seasons. The first half of April was cold with snow. Wind damage
KANSAS CLIMATE SUMMARY August 2015
 KANSAS CLIMATE SUMMARY August 2015 Cool and Dry August was drier than normal in most of the state. State-wide average precipitation was 2.80 inches or 85 percent of normal. The Northeast division of the
NWS FORM E-5 U.S. DEPARTMENT OF COMMERCE I HYDRO SERVICE AREA NOAA, NATIONAL WEATHER SERVICE I Indianapolis, IN MONTHLY REPORT
 NWS FORM E-5 U.S. DEPARTMENT OF COMMERCE I HYDRO SERVICE AREA NOAA, NATIONAL WEATHER SERVICE I Indianapolis, IN. 1-------------------- MONTHLY REPORT OF RIVER AND FLOOD CONDITIONSI REPORT FOR I November
Champaign-Urbana 1998 Annual Weather Summary
 Champaign-Urbana 1998 Annual Weather Summary ILLINOIS STATE WATER SURVEY Audrey Bryan, Weather Observer 2204 Griffith Dr. Champaign, IL 61820 wxobsrvr@sparc.sws.uiuc.edu The development of the El Nìno
July 2015 Climate Summary
 Ken Scheeringa And Mary Rose Mangan Aug 6, 2015 (765) 494-8105 http://www.iclimate.org July 2015 Climate Summary Month Summary Record setting rainfall in June persisted into the first three weeks of July.
Champaign-Urbana 1999 Annual Weather Summary
 Champaign-Urbana 1999 Annual Weather Summary ILLINOIS STATE WATER SURVEY 2204 Griffith Dr. Champaign, IL 61820 wxobsrvr@sws.uiuc.edu Maria Peters, Weather Observer A major snowstorm kicked off the new
2011 Year in Review TORNADOES
 2011 Year in Review The year 2011 had weather events that will be remembered for a long time. Two significant tornado outbreaks in April, widespread damage and power outages from Hurricane Irene in August
April 2017 Climate Summary
 Ken Scheeringa And Andy Eggert May 8, 2017 (765) 494-8105 http://www.iclimate.org April 2017 Climate Summary Month Summary April was a very warm and wet month in Indiana, nearly setting a new monthly temperature
UNITED STATES AND SOUTH AMERICA OUTLOOK (FULL REPORT) Thursday, December 28, 2017
 Thursday, December 28, 2017") T-storm Weather Summary Despite scattered t-storms Sat.-Sun. in central and northern areas in Argentina, more will likely be needed especially in sunflower areas of the southwest. Some t-storms likely
T-storm Weather Summary Despite scattered t-storms Sat.-Sun. in central and northern areas in Argentina, more will likely be needed especially in sunflower areas of the southwest. Some t-storms likely
November 2017 Climate Summary
 Ken Scheeringa and Andy Eggert Dec 8, 2017 (765) 494-8105 http://www.iclimate.org November 2017 Climate Summary Month Summary November temperatures alternated spells of warm and cool while precipitation
June 2011 Climate Summary
 Ken Scheeringa (765) 494-8105 Jul 8, 2011 http://www.iclimate.org June 2011 Climate Summary Month Summary The abundance of extreme weather this year extended yet another month into June. This month has
March 2009 Climate Summary
 Joseph Mays (765) 494-6574 Apr 1, 2009 http://www.iclimate.org Summary March 2009 Climate Summary March is in the books and it continued the trend of extreme weather we have experienced during the first
The Pennsylvania Observer
 The Pennsylvania Observer August 3, 2015 July 2015 - Pennsylvania Weather Recap By: Arthur Person Although this seventh month of 2015 was fairly normal across Pennsylvania as a whole, the details reveal
The Pennsylvania Observer
 The Pennsylvania Observer October 1, 2015 September 2015 - Pennsylvania Weather Recap By: Quinn Lease The month of September will be remembered for its above normal temperatures and dry conditions that
New Hampshire State Climate Office Dr. Mary D. Stampone, State Climatologist
 New Hampshire State Climate Office Dr. Mary D. Stampone, State Climatologist University of New Hampshire c/o Department of Geography 73 Main Street Durham, NH 03824 Phone: 603-862-3136 Fax: 603-862-4362
Monthly Long Range Weather Commentary Issued: July 18, 2014 Steven A. Root, CCM, President/CEO
 Monthly Long Range Weather Commentary Issued: July 18, 2014 Steven A. Root, CCM, President/CEO sroot@weatherbank.com JUNE 2014 REVIEW Climate Highlights The Month in Review The average temperature for
Nebraska experienced a wide
 Issue 1 August 2016 CLIMATE UPDATE A MONTHLY SUMMARY FROM THE neclimate.unl.edu August saw reprieve from dryness, cooler temps Overview Nebraska experienced a wide range of conditions across the state
CropCast Corn and Soybean Report Kyle Tapley Monday, March 20, 2017
 Accumulated Rainfall (inches) Accumulated GDDs Temperature ( F)/Wind Speed (mph) Precipitation (inches) CropCast Corn and Soybean Report Kyle Tapley Monday, March 20, 2017 Peoria, IL Regional Forecast
Illinois Drought Update, December 1, 2005 DROUGHT RESPONSE TASK FORCE Illinois State Water Survey, Department of Natural Resources
 Illinois Drought Update, December 1, 2005 DROUGHT RESPONSE TASK FORCE Illinois State Water Survey, Department of Natural Resources For more drought information please go to http://www.sws.uiuc.edu/. SUMMARY.
June 2015 Climate Summary
 Ken Scheeringa And Mary Rose Mangan Jul 10, 2015 (765) 494-8105 http://www.iclimate.org June 2015 Climate Summary Month Summary Indiana set a new June rainfall record this month with a state average 8.99.
Above normal temperatures and precipitation continue across the HSA
 NWS Form E-5 (PRES. BY NWS Instruction 10-924) MONTHLY REPORT OF HYDROLOGIC CONDITIONS HYDROLOGIC SERVICE AREA (HSA) MONTH YEAR TO: Hydrologic Information Center, W/OS31 NOAA s National Weather Service
January 2018 Climate Summary
 Ken Scheeringa and Andy Eggert Feb 8, 2018 (765) 494-8105 http://www.iclimate.org January 2018 Climate Summary Month Summary January temperature swings were amazing. In the first few days arctic cold pushed
January 25, Summary
 January 25, 2013 Summary Precipitation since the December 17, 2012, Drought Update has been slightly below average in parts of central and northern Illinois and above average in southern Illinois. Soil
SIGNIFICANT EVENTS Severe Storms November 1994 January 1996 August 1998 and May 2000 March 2002 May 2002 Champaign County
 SIGNIFICANT EVENTS Severe Storms November 1994 On Nov. 1, 1994, high winds gusted over 60 mph at times across the northwest third of Ohio. The highest measured wind gust was 63 mph at Columbus Grove (Putnam).
July 2014 Climate Summary
 Ken Scheeringa And Matt Price Aug 8, 2014 (765) 494-8105 http://www.iclimate.org July 2014 Climate Summary Month Summary July was unseasonably cool and drier than normal. Rainfall was light in parts of
June 2010 Climate Summary
 Ken Scheeringa (765) 494-8105 Jul 6, 2010 http://www.iclimate.org June 2010 Climate Summary Summary Summer like heat and humidity arrived in Indiana on May 22 nd and dominated our weather scene nearly
NWS FORM E-5 U.S. DEPARTMENT OF COMMERCE HSA OFFICE:
 NWS FORM E-5 U.S. DEPARTMENT OF COMMERCE HSA OFFICE: NOAA, NATIONAL WEATHER SERVICE MONTHLY REPORT OF RIVER AND FLOOD CONDITIONS DATE: TO: North Webster, IN REPORT FOR (MONTH &YEAR): July 1998 August 5,
2018 Year in Review for Central and Southeast Illinois By: Chris Geelhart, Meteorologist National Weather Service, Lincoln IL
 By: Chris Geelhart, Meteorologist National Weather Service, Lincoln IL While 2018 featured some significant out-of-season weather, including below zero temperatures in April and 90-degree highs in early
NIDIS Drought and Water Assessment
 NIDIS Drought and Water Assessment PRECIPITATION The images above use daily precipitation statistics from NWS COOP, CoCoRaHS, and CoAgMet stations. From top to bottom, and left to right: most recent 7-days
The hydrologic service area (HSA) for this office covers Central Kentucky and South Central Indiana.
 for this office covers Central Kentucky and South Central Indiana.") NWS Form E-5 (04-2006) NATIONAL OCEANIC AND ATMOSPHERIC ADMINISTRATION (PRES. BY NWS Instruction 10-924) NATIONAL WEATHER SERVICE MONTHLY REPORT OF HYDROLOGIC CONDITIONS HYDROLOGIC SERVICE AREA (HSA) Louisville
NWS Form E-5 (04-2006) NATIONAL OCEANIC AND ATMOSPHERIC ADMINISTRATION (PRES. BY NWS Instruction 10-924) NATIONAL WEATHER SERVICE MONTHLY REPORT OF HYDROLOGIC CONDITIONS HYDROLOGIC SERVICE AREA (HSA) Louisville
Table 1. August average temperatures and departures from normal ( F) for selected cities.
 for selected cities.") Climate Summary for Florida August 2016 Prepared by Lydia Stefanova and David Zierden Florida Climate Center, The Florida State University, Tallahassee, Florida Online at: http://climatecenter.fsu.edu/products-services/summaries
Climate Summary for Florida August 2016 Prepared by Lydia Stefanova and David Zierden Florida Climate Center, The Florida State University, Tallahassee, Florida Online at: http://climatecenter.fsu.edu/products-services/summaries
March 2018 Climate Summary
 Ken Scheeringa and Andy Eggert Apr 5, 2018 (765) 494-8105 http://www.iclimate.org March 2018 Climate Summary Month Summary March turned cold with below normal temperatures on two-thirds of its days. Along
March 2011 Climate Summary
 Ken Scheeringa (765) 494-8105 Apr 5, 2011 http://www.iclimate.org March 2011 Climate Summary Summary The fast paced weather action of February slowed some in March. The major March weather features were
MIAMI-SOUTH FLORIDA National Weather Service Forecast Office
 MIAMI-SOUTH FLORIDA National Weather Service Forecast Office http://www.weather.gov/miami June 2015 South Florida Weather Summary Dry East, Wet West...Drought Remains SE Florida July 3, 2015: Depending
Monthly Long Range Weather Commentary Issued: SEPTEMBER 19, 2016 Steven A. Root, CCM, Chief Analytics Officer, Sr. VP,
 Monthly Long Range Weather Commentary Issued: SEPTEMBER 19, 2016 Steven A. Root, CCM, Chief Analytics Officer, Sr. VP, sroot@weatherbank.com SEPTEMBER 2016 Climate Highlights The Month in Review The contiguous
UNITED STATES AND SOUTH AMERICA OUTLOOK (FULL REPORT) Wednesday, April 18, 2018
 Wednesday, April 18, 2018") T-storm Weather Summary Coolness continues over the next week in much of the central U.S., most likely producing the coldest April since 1907 in the Corn Belt, but followed by seasonable to mild weather
T-storm Weather Summary Coolness continues over the next week in much of the central U.S., most likely producing the coldest April since 1907 in the Corn Belt, but followed by seasonable to mild weather
WeatherManager Weekly
 Issue 288 July 14, 2016 WeatherManager Weekly Industries We Serve Agriculture Energy/Utilities Construction Transportation Retail Our Weather Protection Products Standard Temperature Products Lowest Daily
X An X inside this box indicates that no flooding occurred within this Hydrologic Service Area.
 NWS FORM E-5 U.S. DEPARTMENT OF COMMERCE HSA OFFICE: NOAA, NATIONAL WEATHER SERVICE MONTHLY REPORT OF RIVER AND FLOOD CONDITIONS DATE: TO: North Webster, IN REPORT FOR (MONTH &YEAR): January, 2003 February
The Pennsylvania Observer
 The Pennsylvania Observer January 5, 2009 December 2008 Pennsylvania Weather Recap The final month of 2008 was much wetter than average and a bit colder than normal. In spite of this combination, most
NIDIS Weekly Climate, Water and Drought Assessment Summary. Upper Colorado River Basin July 31, 2012
 NIDIS Weekly Climate, Water and Drought Assessment Summary Upper Colorado River Basin July 31, 2012 Fig. 1: July month-to-date precipitation in inches. Fig. 2: SNOTEL WYTD precipitation percentiles (50%
Crop / Weather Update
 Crop / Weather Update Corn Crop Condition Percent of Acreage Rated Good or Excellent 85 80 75 70 65 60 55 50 45 The U.S. corn crop was rated 69% good-to-excellent on September 23, up 1% from week-ago,
CropCast Corn and Soybean Report Kenny Miller Tuesday, March 14, 2017
 Accumulated Rainfall (inches) Accumulated GDDs Temperature ( F)/Wind Speed (mph) Precipitation (inches) CropCast Corn and Soybean Report Kenny Miller Tuesday, March 14, 2017 Peoria, IL Regional Forecast
Arizona Climate Summary May 2012
 Arizona Climate Summary May 2012 Summary of conditions for April 2012 April 2012 Temperature and Precipitation Summary April 1 st 16 th : Although April began with another low pressure system sweeping
NATIONAL WEATHER SERVICE
 NWS Form E-5 (PRES. BY NWS Instruction 10-924) MONTHLY REPORT OF HYDROLOGIC CONDITIONS HYDROLOGIC SERVICE AREA (HSA) NORTHERN INDIANA (IWX) MONTH YEAR TO: Hydrologic Information Center, W/OS31 NOAA s National
The Pennsylvania Observer
 The Pennsylvania Observer September 3, 2008 Summer 2008 Weather Summary Written by: Brian Thompson The opening days of June started dry, but a warm front brought a widespread rain a couple of days into
UNITED STATES AND SOUTH AMERICA WEATHER ROUNDUP Sunday, December 17, 2017
 T-storm Weather Summary Extreme heat was followed by heavy rain in some key areas of Argentina yesterday. T-storms affect much of the driest Argentina, southern Brazil, and Paraguay through 7 to 10 days,
Arizona Climate Summary September 2014 Summary of conditions for August 2014
 Arizona Climate Summary September 2014 Summary of conditions for August 2014 August 2014 Temperature and Precipitation Summary August 1 st 16 th : The first 5 days of August were quite wet with high pressure
The Pennsylvania Observer
 The Pennsylvania Observer April 2, 2009 March 2009 Pennsylvania Weather Recap Prepared by Curt Harpster For the month of March the saying, In like a lion and out like a lamb really fit the pattern quite
KANSAS CLIMATE SUMMARY February 2015
 KANSAS CLIMATE SUMMARY February 2015 Extended Cold Despite some record warm readings at a few locations, February was characterized by colder than normal conditions. This was particularly true during the
Weather and Climate Summary and Forecast October 2017 Report
 Weather and Climate Summary and Forecast October 2017 Report Gregory V. Jones Linfield College October 4, 2017 Summary: Typical variability in September temperatures with the onset of fall conditions evident
The Pennsylvania Observer
 The Pennsylvania Observer May 31, 2012 May 2012 - Pennsylvania Weather Recap By: Paul Knight The majority of the fifth month had temperatures averaging well above seasonal levels with two distinct hot
Crop / Weather Update
 Crop / Weather Update Corn Crop Condition Percent of Acreage Rated Good or Excellent 85 80 75 70 65 60 55 50 45 In its weekly Crop Progress Report for September 16, the USDA stated the 18-state average
Arizona Climate Summary February 2012
 Arizona Climate Summary February 2012 Summary of conditions for January 2012 January 2012 Temperature and Precipitation Summary January 1 st 20 th : The New Year has started on a very dry note. The La
but 2012 was dry Most farmers pulled in a crop
 After a winter that wasn t, conditions late in the year pointed to a return to normal snow and cold conditions Most farmers pulled in a crop but 2012 was dry b y M i k e Wr o b l e w s k i, w e a t h e
Crop / Weather Update
 Crop / Weather Update Corn Crop Condition Percent of Acreage Rated Good or Excellent 85 80 75 70 65 60 55 50 45 As of September 9, USDA rates the crop at 68% good to excellent. The rating is up one point
Monthly Long Range Weather Commentary Issued: May 15, 2014 Steven A. Root, CCM, President/CEO
 Monthly Long Range Weather Commentary Issued: May 15, 2014 Steven A. Root, CCM, President/CEO sroot@weatherbank.com APRIL 2014 REVIEW Climate Highlights The Month in Review The average temperature for
Weather and Climate Summary and Forecast Summer 2017
 Weather and Climate Summary and Forecast Summer 2017 Gregory V. Jones Southern Oregon University August 4, 2017 July largely held true to forecast, although it ended with the start of one of the most extreme
INDIANAPOLIS, INDIANA
 The NWS FORM E-5 U.S. DEPARTMENT OF COMMERCE HYDROLOGIC SERVICE AREA: NATIONAL OCEANIC AND ATMOSPHERIC ADMINISTRATION NATIONAL WEATHER SERVICE INDIANAPOLIS, INDIANA REPORT FOR: MONTHLY REPORT OF RIVER