May 2018 Climate Summary
|
|
|
- Penelope Garrison
- 5 years ago
- Views:
Transcription

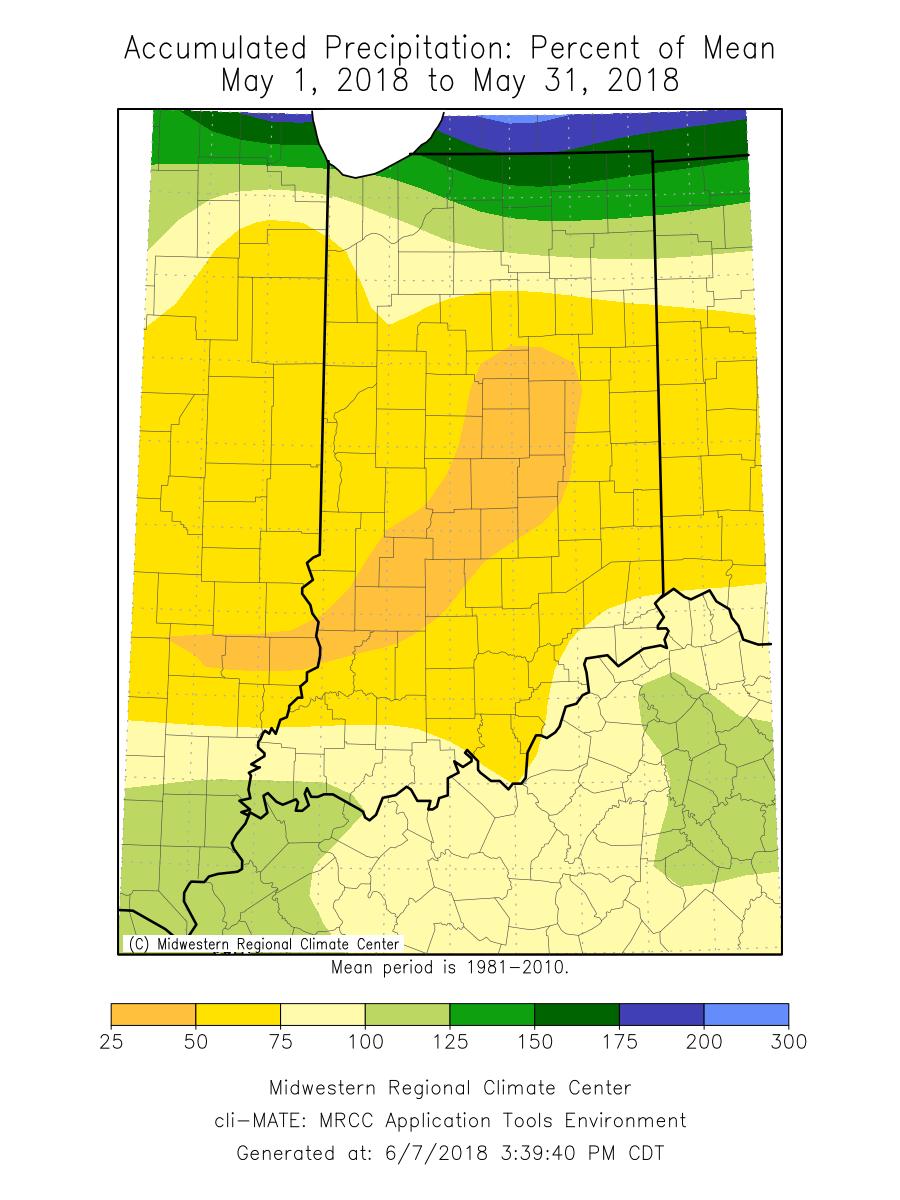
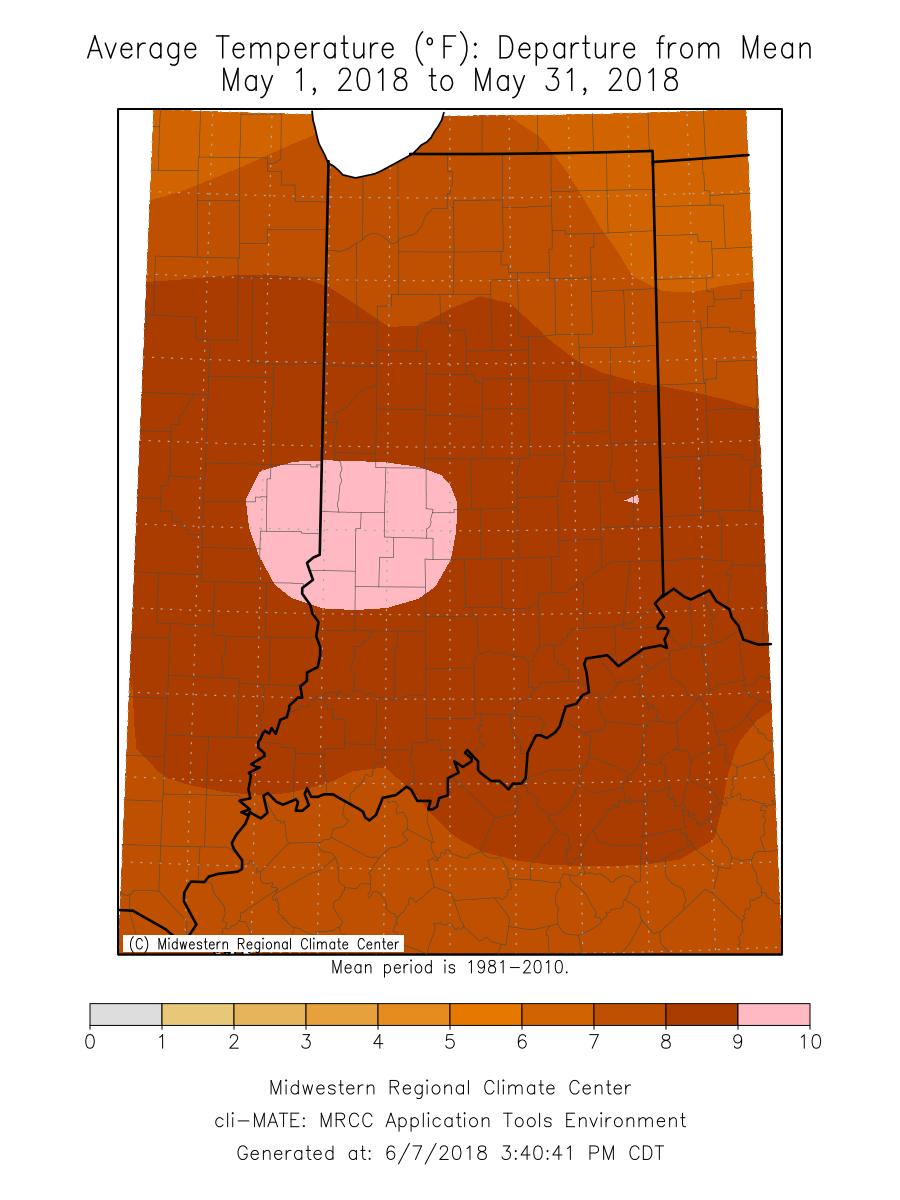
1 Ken Scheeringa and Andy Eggert Jun 7, 2018 (765) May 2018 Climate Summary Month Summary As the calendar turned from April to May temperatures flipped dramatically away from the 3 rd coldest April recorded in Indiana into its warmest May! Despite an abundance of severe weather days May rainfall was overall below normal for the month. Each severe weather event was mostly confined to a handful of counties. Then came May 31 st when an early appearance by the remnants of a subtropical storm cranked up wind damage reports in about half the state. An area of southwest Indiana was often skipped by rain showers, prompting the US Drought Monitor to declare an abnormally dry soil moisture rating in that region near the end of May. The state average temperature for May was 70.1 F, a remarkable 8.1 above normal. This temperature easily breaks the old warmest May record of 68.5 F set in State averages begin in Some recent Mays since 2000 that were nearly as warm include 2013 at 64.4 F, tied for 25 th warmest, 2015 with 65.0 tied for the 21 st slot, 2004 with its 65.9 F in 15 th place, 2007 at 66.2 F pegged in 14 th, and the 2012 average of 67.7 F which sits as the 6 th warmest on record. The day split in May 2018 was no days of below normal temperature and all 31 days above normal! There were 12 days when the daily state average temperature was 10 F or more above normal. No days were at least 20 F above normal. The highest temperature of the month was 98 F at several locations on May 28 th and 29 th. The coldest was 29 F on May 1 st at Huntington and New Castle 3sw. May state average precipitation was low at 3.38 which is 1.02 below normal. This ranks May 2018 as the 41 st driest May on record. Some recent drier Mays since 2000 include 2012 with its average 2.75 as the 22 nd driest May, 2005 at 2.57 coming in as 18 th driest, and 2007 with 1.75 ranking as the 8 th driest May on the list. At the top of the list overall is May 1934 with just 1.13 during the Dust Bowl years as the driest May on record. The heaviest single day precipitation in May 2018 among cooperative network stations was 3.01 on May 15 th at the South Bend water treatment plant. The highest in the CoCoRaHS network was 3.47 on May 3 rd at Culver 0.8wnw. The largest month total in the cooperative network was 8.61 at Newburgh Lock and Dam. In the CoCoRaHS network the largest total was 9.37 at Granger 1.8ene. Widespread precipitation fell on about 15 days this month. Regionally May 2018 precipitation summed to near 105% of normal across northern Indiana, 60% of normal in central, and 75% of normal across southern Indiana. Normal May precipitation ranges from 3.8 in northeast Indiana to 5.0 in southwest and south central counties.
2 May 1 st 7 th The near record cold April has ended. In this first week of May the daily state average temperature reached above normal on all 7 days despite a cooling trend the latter half of the week. Rainfall was above normal in northern Indiana but central and southern Indiana received less than the usual amount. Wind gusts in 5 far northern counties caused tree damage, power outages, a train derailment injuring 2 crew, and a semi-trailer to flip late on May 2 nd. An isolated large hail report was noted in Gibson county on May 6 th. A high pressure ridge dominated the east half of the country on May 1 st. Indiana skies were sunny with light southerly winds. The month opened with the daily state temperature at 6 F above normal. A cold front in Nebraska moved slightly east to Iowa the next day while the monster ridge anchored over West Virginia strengthened. Warm air behind the ridge raised the Indiana state temperature to 13 F above normal. The unstable air mass in southern Michigan and northern Indiana triggered severe weather late in the evening. The western portion of the cold front stalled as a stationary front over Iowa and Nebraska on May 3 rd. The eastern part of this front dipped south into central Michigan. The flow of warm air behind the east ridge intensified. The Indiana state temperature peaked for the week at 14 F above normal. The next day the Michigan cold front reversed and became a warm front, moving away from Indiana. To the west the front persisted into Illinois and Iowa. The warm sector bound by these two fronts that contained Indiana began to collapse. The temperature ascent ended and a cooling trend had begun. The Indiana state temperature fell slightly to 13 F above normal. On May 5 th the warm sector finally collapsed as the first cold front of the month crossed through Indiana and into Kentucky. A cooler air mass driven by a narrow east-west ridge of high pressure settled over Indiana, lowering the state temperature to 6 F above normal. Meanwhile a new cold front advanced out of Canada into central Wisconsin and Michigan. The next day this front became stationary at the Indiana-Michigan border, setting off thunderstorms in far northwest Indiana. The state temperature remained nearly constant at 6 F above normal. The stationary front in far northern Indiana drifted south past the Ohio River on May 7 th. Cooler air covered the Midwest, dropping the Indiana state temperature to 2 F above normal to close out the week. Over the 7 days the state temperature averaged to 9 F above normal. Usually in the first week of May daily maximum temperatures should vary from 66 F in far northern Indiana to 74 F in the far southwest counties. Normal daily minimums should range between 45 F and 51 F north to south across the state. The warmest temperature of the week according to cooperative network stations was 91 F at Wanatah 2wnw on May 3 rd. The coolest temperature among stations in this same network was 29 F at Huntington and New Castle 3sw on May 1 st. On the weekly rainfall map totals ranged between 1.5 and 3.5 in the northern tier of Indiana counties where the heaviest thunderstorms were concentrated. Similar amounts were summed in Starke, Marshall, Kosciusko, Noble, and DeKalb counties, that is, mostly east of the city of Laporte to the Ohio border. Floyd county also reported isolated heavy amounts. In contrast less than 0.5 fell across much of the central third of Indiana. Elsewhere 0.5 to 1.5 was common.
3 Regionally about 1.1 was observed in the northern third of Indiana, 0.4 in central areas, and 0.8 across the south. These totals equate to about 160% of normal in the north, 40% in central, and 70% of normal across southern Indiana. The heaviest single day rainfall was recorded on May 3 rd in north central counties. Some of the heavier amounts included 3.47 in Culver, 3.11 at Middlebury, with readings of 3.07 and 3.01 in the vicinity of South Bend. An observer near Goshen measured Some heavy weekly totals were 3.10 and 3.04 by two South Bend volunteers, 3.04 outside Goshen, 2.88 at Angola, and 2.85 near Mishawaka. Rain was observed statewide on May 4 th and scattered around the state on May 5 th. The northern half of Indiana collected rainfall on May 3 rd, the south tier of counties on May 6 th, with good coverage across the southeast quarter of Indiana on May 7 th. Wind damage was widespread across 5 far northern counties in thunderstorms on the evening of May 2 nd. In Lake county a power pole and trees were snapped. A trailer was flipped on to US41 where wind speeds reached 61 mph. Hail to 1.25 in diameter was also reported there. Up to 1700 people had lost power during the storm. In Laporte county high winds tossed a tree on to a roadway. More trees were broken in Starke county. Power poles and lines were torn down by 71 mph winds in St Joseph county, causing power outages. Trees were uprooted and branches snapped. Winds to 60 mph in Elkhart county took down trees, fences, power lines, and snapped limbs. Debris on a railroad track due to a severe thunderstorm two hours earlier may have been the cause of a freight train derailment that injured 2 crew men. They were taken to the hospital for treatment of minor injuries. On May 6th an isolated 1.0 hail report was made from Gibson county.
4 May 8 th 14 th The May warm spell persisted through a second week. Daily state temperatures have averaged above normal every day so far this month. Significant rainfall was again concentrated in northern Indiana with much less in the central and southern parts of the state. Severe weather events have become more frequent. Wind damage was reported in northwest counties on the evening of May 9 th. The action moved to the southwest corner of the state the next day with both hail and wind damage noted. On May 14 th wind and hail returned to far northern Indiana. A high pressure ridge was sprawled over the east half of the country on May 8 th. A cold front was located over the upper Great Lakes and an occluded system in the Dakotas and Nebraska. The Indiana state temperature opened the week at 4 F above normal. The ridge drifted to the Atlantic states the next day and its western edge eroded. The Nebraska storm system advanced to Iowa. The warm air flow behind the east ridge helped increase the Indiana state temperature to 6 F above normal. The ridge collapsed on May 10 th and was cornered on the southeast coast. An Alberta high center was announced by two cold fronts. The first front pushed through Indiana that morning while the second followed close behind in northern Illinois. Large hail and strong winds struck far southwest Indiana. The Indiana state temperature peaked at 8 F above normal. The next day the second cold front caught up with the first. The merged front stalled over central Indiana. The northern high pressure center had moved east into the Great Lakes rather than continuing south and transformed the cold fronts into a stationary front. The Indiana state temperature dipped a few degrees to 5 F above normal. A northern ridge stretched between west Canada and Wisconsin on May 12 th. A southern ridge was anchored over North Carolina. The stationary front over central Indiana marked the boundary between the two ridges and moved little since the previous day. The state temperature didn t budge either, remaining at 5 F above normal. The weather map changed little on May 13 th, the third day of residence of the stationary front in central Indiana. Opposing ridges were now positioned over Michigan and Alabama. The heat from the southern ridge grew faster, however, and the Indiana state temperature rose to 10 F above normal. The southern ridge continued to intensify on May 14 th, drawing the stationary front into northern Indiana. Large hail and some wind damage resulted in some far northern Indiana counties. The state temperature continued to climb to 13 F above normal to close out the week. Overall for the week the daily state temperature averaged to 8 F above normal. Typically in this second week of the month the daily maximum temperature would vary between 68 F and 75 F north to south across the state. The daily minimums normally range from 47 F in far northern Indiana to 53 F in the far southwest corner of the state. The warmest daily temperature among stations in the cooperative observation network was 93 F at Rockville and Boonville 1s on May 14 th. The coolest daily temperature among stations within this same network was 34 F at Huntington on May 11 th. The weekly total rainfall map shows more than a half inch fell generally across the northern two tiers of counties and in Gibson and Spencer counties of far southwest Indiana. The heaviest amounts up to 3 were dumped by thunderstorms along the Michigan border. This was the region
5 with hail and wind damage on May 9 th and 14 th. The vast majority of Indiana though had little rainfall for the week, mostly less than a half inch. Part of Daviess county remained dry with no rain recorded. Regionally on average about 0.9 was measured across the northern third of Indiana. Central counties averaged about 0.2 while 0.1 was common across the south. These amounts equate to about 120% of normal in northern Indiana, but just 30% in central Indiana, and 10% of normal across the southern third of the state. The heaviest single day rainfall was recorded by volunteers in the CoCoRaHS network on May 14 th. On that morning two South Bend observers had 2.05 and 1.59 in their rain gages. Two rain gages in Elkhart came in with 1.90 and In extreme northwest Indiana 1.37 was caught by the volunteer in Hammond. Over the full week a South Bend gage tallied The Granger total was 3.03 while two Elkhart gages summed to 2.91 and Near Goshen the week total was Rain fell statewide on May 10 th, in far northern Indiana on May 12 th, across the northern third of the state on May 13 th and 14 th, and along the northern and southern tiers of counties on May 11 th. Severe weather was reported on 3 dates this week: May 9 th, 10 th, and 14 th. On the evening of May 9 th wind damage was noted in 7 counties. Winds to 70 mph in Lake county toppled trees, one onto a vehicle, and damaged a fence and siding. Some communities lost electrical power. In Porter county power lines and fences were downed in addition to the usual trees and branches. Laporte county escaped with a few limbs down but in St Joseph county a tree fell through a house. The worst of the storm seemed to be in Starke county where a tree fell onto a house, a barn was ripped down, a roof collapsed, and a tree fell onto a road. In central Indiana the roof of a house was damaged in Jay county. A tree limb fell on a car and power lines were taken down by winds in Marion county. Severe weather action moved from far northern Indiana to far southwest Indiana the next day. On May 10 th large hail was observed in 3 counties. Hail to 1.0 diameter was reported in Gibson county but hail was much larger and damaging just to the south. In Vanderburgh county hail sizes ranged from 1.0 to 1.5 and even 2.0 in diameter caused by a severe thunderstorm there. This was large enough to shatter vehicle windshields. Hail stones to 1.5 were also noted in adjacent Warrick county. High wind damage was also seen in Warrick and Spencer counties just to the east. Winds to 70 mph caused tree damage in both counties. Severe weather activity returned from the southern tier of counties to the northern tier on May 14 th. One inch diameter hail was observed in Laporte, Starke, Noble, and DeKalb counties. Much larger hail up to 1.75 was measured in Elkhart and in parts of DeKalb counties. Heavy rainfall in Porter county covered parts of the interstate causing vehicles to hydroplane on the roadway. These poor driving conditions caused a 5 vehicle accident which injured 9 people and sent them to the hospital. Winds to 60 mph in Lake county uprooted a tree there while also taking down a tree in DeKalb county.

6 May 15 th 21 st The May warm spell powered through yet another week. There have been no days so far this month when the daily state average temperature was below normal! Cool weather was lacking but not precipitation. Rain was reported every day somewhere in Indiana. After the passage of two cold fronts, a sluggish nearly stationary front drifted northward, then southward across the state. Isolated severe weather was noted in two Indiana counties on the last day. A stationary front was located across northern Indiana on May 15 th. Warm air south of the front helped lift the daily state temperature to 11 F above normal. Meanwhile high pressure over Ontario had driven a cold front into central Michigan. The next day this cold front caught and merged with the stationary front. The combined system slowed as it scooted south to the Ohio River. The state temperature cooled slightly to 8 F above normal. The stationary front continued south into Tennessee on May 17 th. Another wave of cooler air advanced into central Michigan. Indiana was positioned between the two fronts. The state temperature fell a bit more to 6 F above normal. Manitoba high pressure skirted east to Ontario the next day, driving the second Michigan cold front through Indiana, again as far as the Ohio River. Still cooler air entered the state and drove the daily temperature to 3 F above normal, the coolest day of the week. The Ohio River front stalled, then meandered back to northern Indiana as a stationary front on May 19 th. The state temperature recovered slightly to 5 F above normal. The next day the stationary front reformed back into a cold front and waved southward into central Indiana. The state temperature responded by cooling very slightly to 4 F above normal. The front over Indiana was quite weak and had easily converted between stationary and cold status the past few days. To close the week the cold front halted yet again over southern Indiana as a stationary front. The state temperature remained nearly the same at 5 F above normal. In summary two cold fronts were followed by a wavering stationary front after mid-week, yet the state temperature persisted above normal on all 7 days. For the week the daily state temperature averaged to 6 F above normal. Typically in the third week of May the daily maximum temperature
7 should range between 71 F in far northern counties to 77 F in southwest Indiana. Daily minimums normally vary between 49 F and 55 F north to south across the state. The warmest temperature of the week at cooperative network stations was 97 F at Patoka Lake on May 16 th. The coolest temperature among stations in this same network was 35 F at Huntington on May 18 th. The heaviest weekly rainfall was along the Michigan border with 2 to 3 amounts. Totals were nearly as large over the southeast and southwest corners of the state. But less than 0.5 was noted over several counties of southwest and south central Indiana and in smaller areas of east central and northwest Indiana. About 0.5 to 1.5 was common elsewhere. Regionally about 1.2 was recorded on average across the northern third of Indiana with 0.9 in central counties and 0.8 across the south. These amounts equate to about 140% of normal in the north, right at normal in central Indiana, and 80% of normal in the southern third of the state. The heaviest single day rainfall was found among the May 15 th morning CoCoRaHS reports in northwest and north central Indiana. The gage operated by a volunteer near Portage measured 2.02 while outside Goshen and South Bend 1.89 was observed. On May 17 th Boonville read 1.90 and in the New Carlisle vicinity 1.87 was received. Over the week the Moores Hill gage caught 2.93 while West Lafayette summed to In Boonville 2.61 was captured with 2.47 near Goshen and 2.43 at Hanover. Daily fronts over Indiana translated into every day rainfall. The northern half and southwest portion of Indiana recorded rainfall on May 15 th and 16 th. Rain was scattered over the south half of the state on May 17 th and 18 th. Rain fell statewide on May 19 th and 20 th. On May 21 st rain was observed in the northern third of the state and scattered over southern counties. Two isolated severe weather reports were made on May 21 st. In Greene county 1.00 diameter hail was seen. High winds brought down tree limbs and tore the shingles off a roof in Johnson county.
8 May 22 nd 31 st A lengthy warm spell which began the first of May remained unbroken to the very last day. The state average temperature on each of the last 10 days of the month persisted above normal. The early part of this final interval was warm but the latter half could be described as hot as maximum temperatures soared into the 90 s. Precipitation was below normal in northern and central counties and near normal in the southern third of Indiana. Severe weather events were isolated from May27 th through May 30 th. On May 31 st wind damage was extensive across the south half of the state. Abnormally dry soils made a first reappearance in Indiana since February according to the US Drought Monitor. On May 22 nd a stationary front extended from central Indiana to New York state. The Indiana state average temperature had risen to 6 F above normal. High pressure in Iowa moved into northwest Indiana the next day, chasing a converted stationary to cold front into Kentucky. The Indiana state temperature did cool a few degrees to 4 F above normal. The cold front continued south on May 24 th into the Gulf states. High pressure in Indiana drifted east enabling the start of a warming backflow. The state temperature increased slightly to 5 F above normal. A warm front evolved over Minnesota and Iowa. The next day the high pressure core traveled to West Virginia. The warming behind it intensified over Indiana as the warm front lifted north into Michigan. The Indiana state temperature was on a faster warming trend. The state temperature rose to 8 F above normal. Manitoba low pressure dove into upper Michigan on May 26 th, placing a stationary front over Michigan and a new cold front into Wisconsin and Iowa. This positioned Indiana into a strong warm sector with southerly winds and partly sunny skies. The state temperature pushed higher to 12 F above normal. High pressure in the Atlantic Ocean sprawled westward to the Midwest and Indiana the next day. The large ridge blocked three fronts over the Great Lakes, allowing the daily Indiana state temperature to peak at 15 F above normal. Subtropical storm Alberto arrived off the west coast of Florida. On May 28 th Alberto traveled to the Florida panhandle. High pressure built in between Alberto and the stationary front in Michigan. Cooler air began to infiltrate New England and the northern Rocky Mountains. The Indiana state temperature began a slow decline, falling slightly to 14 F above normal. Alberto came ashore to central Alabama the next day and the Indiana high center passed east into Pennsylvania, but the Michigan stationary front settled on the Indiana border. The Indiana state temperature dipped to 12 F above normal. The remnants of Alberto accelerated north to the southwest corner of Indiana on May 30 th. The stationary front on the northern Indiana border moved little, although the western portion of this front traveled extensively south into Missouri and Kansas. Rainfall over Indiana became heavy at times. The state temperature continued to fall to 10 F above normal. Alberto pushed north to Lake Huron the last day of May. The stationary front on the Indiana border reverted to a warm front and was carried northward along with Alberto to northern Michigan. The warm sector over Indiana persisted. The state temperature was unchanged at 10 F above normal to close out the month. Over the final 10 days of May the state temperature averaged to 10 F above normal. Usually near the end of May the daily maximum temperature would range between 73 F and 80 F north to south
9 across the state. The daily minimums normally vary from 52 F in far northern counties to 58 F in the southwest corner of the state. The warmest temperature of the 10 day interval according to stations in the cooperative network was 98 F at several locations on May 28 th and 29 th. The coolest temperature of the interval among stations in this same network was 41 F at Columbia City on May 29 th. Less than 0.5 of rain fell generally within an area bounded from Fort Wayne to Frankfort to Richmond. This drier region was mostly beyond the reach of the remnants of Alberto which contributed most of the 10 day rainfall to the state by the morning of May 31 st. Alberto did add bands of 2 to 4 along the Ohio River and in southwest Indiana up the Wabash River valley. The most common rainfall totals in the 10 days was between 1 and 2. Regionally northern Indiana averaged about 0.9 over 10 days while central Indiana had about 1.1 and 1.9 was typical in the southern third of the state. These amounts equate to about 60% of normal in the north, 70% in central counties, and 110% of normal across southern Indiana. The heaviest single day rainfall was measured on May 30 th and 31 st due to Alberto. On May 30 th two CoCoRaHS volunteers in Poseyville had 2.35 and 2.14 in their gages. The West Terre Haute observer noted By the next morning the Mishawaka rain gage had collected 2.09 and 2.06 was caught in the Rensselaer vicinity as Alberto moved north overnight. During the complete 10 days one of the Poseyville gages summed to Two Boonville reports tallied 3.54 and 3.18 over that time. The Paoli observer had captured 3.11 while in the Evansville vicinity 3.07 had accumulated in the 10 day interval. It was a wet 10 day period with rain seen on all but 2 of these days. Rain was observed statewide on the mornings of May 22 nd and 31 st. Moisture was reported as scattered in northern Indiana on May 26 th, in central counties on May 27 th, and across south central Indiana on May 28 th. Rain was noted along the Ohio River in morning reports taken May 29 th and over southern sections on May 30 th. No precipitation was recorded for the dates of May 24 th and 25 th. Severe weather was reported on each of the final 5 days of May. Storm reports were few and isolated on every day except the last. On May 27 th two counties reported large hail with one of these also reporting wind damage. Newton county relayed a hail diameter size of 1.75 while Pike county noted 1.00 hail. Pike county also recorded isolated tree damage due to high winds during a thunderstorm. Putnam and Vanderburgh counties each noted isolated wind damage on May 28 th. In Putnam county wind gusts to 59 mph brought down tree limbs and tore shingles from a few homes. In Vanderburgh county wind gusts caused tree damage. Damage in both counties was very localized. On May 29 th wind damage occurred on opposite ends of the state. In far north central Indiana hay fields in St Joseph county were flattened and a barn was damaged. In extreme southwest Indiana power was lost in Warrick county due to wind gusts there. Each wind event was an isolated case and no other wind gust reports were relayed throughout Indiana.
10 On May 30 th wind events were again isolated and noted only on the eastern side of the state. In Lagrange, Allen, and Jay counties gusts snapped trees which fell and blocked county and state roads. Another tree was uprooted in Allen county and limbs were found on the ground. On May 31 st the northward passage of the remnants of Alberto along the western side of Indiana caused major wind damage in more than 40 counties. The affected areas included nearly all the southern half of the state and the 3 northern counties of Fountain, Jay, and Pulaski. Fallen or uprooted trees due to 60 mph wind gusts were common in nearly all impacted counties but there were also other types of damage. Two barns were destroyed, one in Ripley county and a metal barn in Clark county. A roof was ripped off a Jay county business while roof shingles were torn from a building in Hamilton county. A home in Floyd county suffered some damage. A semi trailer was blown over while traveling US41 in Vanderburgh county. Trees fell on houses in Warrick and Clark county and on to a Brown county porch. Downed trees blocked roads in Martin, Spencer, Crawford, Harrison, Bartholomew, Henry, and Dearborn counties. A tree fell on I-65 in Clark county and halted traffic there. Power outages caused by trees falling on to power lines and utility poles blown over by strong winds were reported in several counties, including Vanderburgh, Gibson, Crawford, Morgan, Jackson, Washington, Floyd, Jennings, Hancock, and Decatur. Two power poles snapped in Fountain county and in Dubois county power poles and lines caught fire and remained live on the ground. Utilities reported at least 56,000 customers lost power in central and southern Indiana. The hot weather in May caused dryness in some Indiana soils due to high evaporative demand. The appearance of abnormally dry soils in southwest Indiana brought back a D0 abnormally dry category rating into parts of Knox, Daviess, Sullivan, and Greene counties in the May 29 th edition of the US Drought Monitor. The affected region accounts for about 5% of total Indiana land area. The last time the USDM assigned any D0 rating in Indiana was in its February 13 th edition earlier this year.
11 May 2018 Temperature Region Temperature Normal Deviation Northwest North Central Northeast West Central Central East Central Southwest South Central Southeast State Precipitation Region Precipitation Normal Deviation Percent of Normal Northwest North Central Northeast West Central Central East Central Southwest South Central Southeast State
12 Spring (March - May) Temperature Region Temperature Normal Deviation Northwest North Central Northeast West Central Central East Central Southwest South Central Southeast State Precipitation Region Precipitation Normal Deviation Percent of Normal Northwest North Central Northeast West Central Central East Central Southwest South Central Southeast State
13 2018 Annual so far Temperature Region Temperature Normal Deviation Northwest North Central Northeast West Central Central East Central Southwest South Central Southeast State Precipitation Region Precipitation Normal Deviation Percent of Normal Northwest North Central Northeast West Central Central East Central Southwest South Central Southeast State
14
15
16

17 Drought Summary from the U.S. Drought Monitor Below is a drought summary for the state of Indiana from the U.S. Drought Monitor. Areas in white are not experiencing any drought. Yellow areas are abnormally dry, but not considered a drought. Drought begins when the moisture levels become more severe, with beige, orange, red, and brown indicating increasing levels of drought (moderate, severe, extreme, and exceptional, respectively). The table below indicates what percentage of the state is drought free, and how much of the state is in drought by degree of severity (D1 - D4 category).
18 May 1 st Drought Summary
19 May 8 th Drought Summary
20 May 15 th Drought Summary
21 May 22 nd Drought Summary
22 May 29 th Drought Summary
August 2013 Climate Summary
 Ken Scheeringa and Matt Price Sep 6, 2013 (765) 494-8105 http://www.iclimate.org August 2013 Climate Summary Month Summary August weather began cool and wet but became progressively warmer and drier through
October 2011 Climate Summary
 Ken Scheeringa and Kayla Hudson Nov 4, 2011 http://www.iclimate.org October 2011 Climate Summary Month Summary October weather evolved as a two part story. Weather conditions the first half of the month
August 2006 Summary. August 1-5
 Ashley Brooks (765) 494-6574 Sep 8, 2006 http://www.iclimate.org August 1-5 August 2006 Summary The heat wave that started during the end of July continued into the beginning parts of August with temperatures
August 2017 Climate Summary
 Ken Scheeringa And Andy Eggert Sep 7, 2017 (765) 494-8105 http://www.iclimate.org August 2017 Climate Summary Month Summary The coolest August in 13 years featured long cool and warm spells, below normal
July 2007 Climate Summary
 Dan Bowman (765) 494-6574 Sep 3, 2007 http://www.iclimate.org Summary July 2007 Climate Summary The month of July ended as a very unusual month. Many events occurred during the month of July that is not
February 2017 Climate Summary
 Ken Scheeringa And Andy Eggert Mar 9, 2017 (765) 494-8105 http://www.iclimate.org February 2017 Climate Summary Month Summary February 2017 was the warmest February in Indiana since state climate records
January 2017 Climate Summary
 Ken Scheeringa And Andy Eggert Feb 8, 2017 (765) 494-8105 http://www.iclimate.org January 2017 Climate Summary Month Summary The warmest January in 11 years was nearly 4 F warmer than December 2016. An
September 2011 Climate Summary
 Ken Scheeringa and Kayla Hudson Oct 5, 2011 (765) 494-8105 http://www.iclimate.org September 2011 Climate Summary Month Summary The final blast of summer heat arrived at the start of September. It lasted
March 2014 Climate Summary
 Ken Scheeringa And Matt Price Apr 8, 2014 (765) 494-8105 http://www.iclimate.org March 2014 Climate Summary Month Summary Winter had officially ended by the calendar but snow and cold persisted in Indiana
January 2008 Climate Summary
 Joseph Mays (765) 494-6574 Feb 5, 2008 http://www.iclimate.org Summary January 2008 Climate Summary January was a mix bag of conditions, with an oscillatory pattern developing. We experienced phases of
September 2016 Climate Summary
 Ken Scheeringa And Andy Eggert Oct 6, 2016 (765) 494-8105 http://www.iclimate.org September 2016 Climate Summary Month Summary The warmest September in 77 years brought alternating weeks of dry and wet
October 2017 Climate Summary
 Ken Scheeringa and Andy Eggert Nov 6, 2017 (765) 494-8105 http://www.iclimate.org October 2017 Climate Summary Month Summary After more than three weeks of warm temperatures October turned suddenly cold
September 2005 Climate Summary
 Ashley Brooks (765) 494-6574 Oct 5, 2005 http://iclimate.org September 2005 Climate Summary September 1-7 A cold front came through on the 1 st of the month, however little moisture was associated with
April 2016 Climate Summary
 Ken Scheeringa And Andy Eggert May 9, 2016 (765) 494-8105 http://www.iclimate.org April 2016 Climate Summary Month Summary One month but two seasons. The first half of April was cold with snow. Wind damage
August 2015 Climate Summary
 Ken Scheeringa And Mary Rose Mangan Sep 4, 2015 (765) 494-8105 http://www.iclimate.org August 2015 Climate Summary Month Summary A very active wet summer weather pattern turned much calmer and drier in
May 2016 Climate Summary
 Ken Scheeringa And Andy Eggert Jun 6, 2016 (765) 494-8105 http://www.iclimate.org May 2016 Climate Summary Month Summary Cold weather dominated in May until the last week of the month. May began wet but
March 2016 Climate Summary
 Ken Scheeringa And Andy Eggert Apr 8, 2016 (765) 494-8105 http://www.iclimate.org March 2016 Climate Summary Month Summary Count March as the 7 th month in a row that the state average temperature has
January 2018 Climate Summary
 Ken Scheeringa and Andy Eggert Feb 8, 2018 (765) 494-8105 http://www.iclimate.org January 2018 Climate Summary Month Summary January temperature swings were amazing. In the first few days arctic cold pushed
April 2017 Climate Summary
 Ken Scheeringa And Andy Eggert May 8, 2017 (765) 494-8105 http://www.iclimate.org April 2017 Climate Summary Month Summary April was a very warm and wet month in Indiana, nearly setting a new monthly temperature
December 2011 Climate Summary
 Ken Scheeringa and Kayla Hudson Jan 17, 2012 (765) 494-8105 http://www.iclimate.org December 2011 Climate Summary Month Summary What a difference a year makes! A year ago the misery of a harsh, cold, and
July 2010 Climate Summary
 Ken Scheeringa (765) 494-8105 Aug 4, 2010 http://www.iclimate.org July 2010 Climate Summary Summary The warm summer of 2010 continues. Daily state average temperatures were above normal on all but seven
October 2014 Climate Summary
 Ken Scheeringa And Matt Price Nov 10, 2014 (765) 494-8105 http://www.iclimate.org October 2014 Climate Summary Month Summary October featured a mix of weather. A very wet first half of the month evolved
October 2016 Climate Summary
 Ken Scheeringa And Andy Eggert Nov 9, 2016 (765) 494-8105 http://www.iclimate.org October 2016 Climate Summary Month Summary October was the 9 th month so far this year to average above normal in temperature.
May 2015 Climate Summary
 Ken Scheeringa And Mary Rose Mangan Jun 8, 2015 (765) 494-8105 http://www.iclimate.org May 2015 Climate Summary Month Summary May was a very warm month. Rainfall averaged near normal but was distributed
April 2015 Climate Summary
 Ken Scheeringa And Mary Rose Mangan May 8, 2015 http://www iclimate org April 2015 Climate Summary Month Summary April was a month of extremes. Severe weather erupted on 4 days of the first week with multiple
March 2018 Climate Summary
 Ken Scheeringa and Andy Eggert Apr 5, 2018 (765) 494-8105 http://www.iclimate.org March 2018 Climate Summary Month Summary March turned cold with below normal temperatures on two-thirds of its days. Along
November 2014 Climate Summary
 Ken Scheeringa And Matt Price Dec 10, 2014 (765) 494-8105 http://www.iclimate.org November 2014 Climate Summary Month Summary Unseasonable cold headlined the Indiana and national news in November. The
November 2012 Climate Summary
 Ken Scheeringa and Kayla Hudson Dec 6, 2012 (765) 494-8105 http://www.iclimate.org November 2012 Climate Summary Month Summary November was one of those rare weather months in Indiana when not much happened:
June 2016 Climate Summary
 Ken Scheeringa And Andy Eggert Jul 8, 2016 (765) 494-8105 http://www.iclimate.org June 2016 Climate Summary Month Summary June was a warm month with below normal temperature on just 6 days. Rainfall was
November 2010 Climate Summary
 Ken Scheeringa (765) 494-8105 Dec 6, 2010 http://www.iclimate.org November 2010 Climate Summary Summary A four month drought in Indiana is collapsing as significant rain fell the final week of November.
November 2015 Climate Summary
 Ken Scheeringa And Mary Rose Mangan Dec 8, 2015 (765) 494-8105 http://www.iclimate.org November 2015 Climate Summary Month Summary November was much warmer than normal while precipitation was very near
January 2012 Climate Summary
 Ken Scheeringa and Kayla Hudson Feb 6, 2012 (765) 494-8105 http://www.iclimate.org January 2012 Climate Summary Month Summary Where is winter? This question found its way into many conversations throughout
November 2016 Climate Summary
 Ken Scheeringa And Andy Eggert Dec 15, 2016 (765) 494-8105 http://www.iclimate.org November 2016 Climate Summary Month Summary Unseasonably warm, pleasant, and sunny weather the first half of the month
September 2012 Climate Summary
 Ken Scheeringa and Kayla Hudson Oct 5, 2012 (765) 494-8105 http://www.iclimate.org September 2012 Climate Summary Month Summary Summer slipped away and it felt a lot more like autumn in Indiana this month
March 2009 Climate Summary
 Joseph Mays (765) 494-6574 Apr 1, 2009 http://www.iclimate.org Summary March 2009 Climate Summary March is in the books and it continued the trend of extreme weather we have experienced during the first
January 2013 Climate Summary
 Ken Scheeringa and Kayla Hudson Feb 7, 2013 (765) 494-8105 http://www.iclimate.org January 2013 Climate Summary Month Summary Winter or spring? January featured several dramatic swings in temperature and
May 2005 Climate Summary
 Ashley Brooks (765) 494-6574 Jun 7, 2005 http://iclimate.org May 2005 Climate Summary May 1-5 Early May was characterized by an upper-level trough that was in place over Indiana that brought in very cool
July 2011 Climate Summary
 Ken Scheeringa (765) 494-8105 Aug 8, 2011 http://www.iclimate.org July 2011 Climate Summary Month Summary The upper atmospheric high pressure dome which baked the Texas area in heat and drought the past
November 2017 Climate Summary
 Ken Scheeringa and Andy Eggert Dec 8, 2017 (765) 494-8105 http://www.iclimate.org November 2017 Climate Summary Month Summary November temperatures alternated spells of warm and cool while precipitation
January 2006 Climate Summary
 Ashley Brooks (765) 494-6574 Feb 9, 2006 http://www.iclimate.org January 1-3 January 2006 Climate Summary Unseasonably warm conditions welcomed in the New Year with highs in the 40s across the northern
June 2011 Climate Summary
 Ken Scheeringa (765) 494-8105 Jul 8, 2011 http://www.iclimate.org June 2011 Climate Summary Month Summary The abundance of extreme weather this year extended yet another month into June. This month has
The hydrologic service area (HSA) for this office covers Central Kentucky and South Central Indiana.
 for this office covers Central Kentucky and South Central Indiana.") January 2012 February 13, 2012 An X inside this box indicates that no flooding occurred within this hydrologic service area. January 2012 continued the string of wet months this winter. Rainfall was generally
January 2012 February 13, 2012 An X inside this box indicates that no flooding occurred within this hydrologic service area. January 2012 continued the string of wet months this winter. Rainfall was generally
2011 Year in Review TORNADOES
 2011 Year in Review The year 2011 had weather events that will be remembered for a long time. Two significant tornado outbreaks in April, widespread damage and power outages from Hurricane Irene in August
April 2013 Climate Summary
 Ken Scheeringa and Kayla Hudson May 6, 2013 (765) 494-8105 http://www.iclimate.org April 2013 Climate Summary Month Summary Temperatures bounced high and low this month, keeping Hoosiers guessing which
IC ARTICLE 19. DESCRIBING REAL PROPERTY; INDIANA COORDINATE SYSTEM. IC Chapter 1. Designation of Indiana Coordinate System; Zones
 IC 32-19 ARTICLE 19. DESCRIBING REAL PROPERTY; INDIANA COORDINATE SYSTEM IC 32-19-1 Chapter 1. Designation of Indiana Coordinate System; Zones IC 32-19-1-1 Designation of systems Sec. 1. The systems of
Monthly Long Range Weather Commentary Issued: July 18, 2014 Steven A. Root, CCM, President/CEO
 Monthly Long Range Weather Commentary Issued: July 18, 2014 Steven A. Root, CCM, President/CEO sroot@weatherbank.com JUNE 2014 REVIEW Climate Highlights The Month in Review The average temperature for
August 2016 Climate Summary
 Ken Scheeringa And Andy Eggert Sep 12, 2016 (765) 494-8105 http://www.iclimate.org August 2016 Climate Summary Month Summary Hot but tranquil weather the first half of August transitioned to a tormented
June 2015 Climate Summary
 Ken Scheeringa And Mary Rose Mangan Jul 10, 2015 (765) 494-8105 http://www.iclimate.org June 2015 Climate Summary Month Summary Indiana set a new June rainfall record this month with a state average 8.99.
SIGNIFICANT EVENTS Severe Storms November 1994 January 1996 August 1998 and May 2000 March 2002 May 2002 Champaign County
 SIGNIFICANT EVENTS Severe Storms November 1994 On Nov. 1, 1994, high winds gusted over 60 mph at times across the northwest third of Ohio. The highest measured wind gust was 63 mph at Columbus Grove (Putnam).
National Wildland Significant Fire Potential Outlook
 National Wildland Significant Fire Potential Outlook National Interagency Fire Center Predictive Services Issued: September, 2007 Wildland Fire Outlook September through December 2007 Significant fire
July 2014 Climate Summary
 Ken Scheeringa And Matt Price Aug 8, 2014 (765) 494-8105 http://www.iclimate.org July 2014 Climate Summary Month Summary July was unseasonably cool and drier than normal. Rainfall was light in parts of
October 2012 Climate Summary
 Ken Scheeringa and Kayla Hudson Nov 8, 2012 (765) 494-8105 http://www.iclimate.org October 2012 Climate Summary Month Summary In a reversal from the hot and dry summer, cooler and wetter than normal conditions
June 2010 Climate Summary
 Ken Scheeringa (765) 494-8105 Jul 6, 2010 http://www.iclimate.org June 2010 Climate Summary Summary Summer like heat and humidity arrived in Indiana on May 22 nd and dominated our weather scene nearly
W I N T E R STORM HAZARD DESCRIPTION
 W I N T E R STORM HAZARD DESCRIPTION... 1 LOCATION... 2 EXTENT... 2 HISTORICAL OCCURRENCES... 4 SIGNIFICANT PAST EVENTS... 4 PROBABILITY OF FUTURE EVENTS... 5 VULNERABILITY AND IMPACT... 5 HAZARD DESCRIPTION
The Pennsylvania Observer
 The Pennsylvania Observer October 1, 2015 September 2015 - Pennsylvania Weather Recap By: Quinn Lease The month of September will be remembered for its above normal temperatures and dry conditions that
Champaign-Urbana 1998 Annual Weather Summary
 Champaign-Urbana 1998 Annual Weather Summary ILLINOIS STATE WATER SURVEY Audrey Bryan, Weather Observer 2204 Griffith Dr. Champaign, IL 61820 wxobsrvr@sparc.sws.uiuc.edu The development of the El Nìno
The hydrologic service area (HSA) for this office covers Central Kentucky and South Central Indiana.
 for this office covers Central Kentucky and South Central Indiana.") MONTH YEAR January 2011 February 15, 2011 X An X inside this box indicates that no flooding occurred within this hydrologic service area. January 2011 was drier than normal in all locations in the area.
MONTH YEAR January 2011 February 15, 2011 X An X inside this box indicates that no flooding occurred within this hydrologic service area. January 2011 was drier than normal in all locations in the area.
National Wildland Significant Fire Potential Outlook
 National Wildland Significant Fire Potential Outlook National Interagency Fire Center Predictive Services Issued: April 1, 2008 Next Issue: May 1, 2008 Wildland Fire Outlook April 2008 through July 2008
INDIANAPOLIS, INDIANA
 The NWS FORM E-5 U.S. DEPARTMENT OF COMMERCE HYDROLOGIC SERVICE AREA: NATIONAL OCEANIC AND ATMOSPHERIC ADMINISTRATION NATIONAL WEATHER SERVICE INDIANAPOLIS, INDIANA REPORT FOR: MONTHLY REPORT OF RIVER
Weather and Climate Summary and Forecast Summer 2017
 Weather and Climate Summary and Forecast Summer 2017 Gregory V. Jones Southern Oregon University August 4, 2017 July largely held true to forecast, although it ended with the start of one of the most extreme
Weather and Climate Summary and Forecast February 2018 Report
 Weather and Climate Summary and Forecast February 2018 Report Gregory V. Jones Linfield College February 5, 2018 Summary: For the majority of the month of January the persistent ridge of high pressure
Weather and Climate Summary and Forecast March 2018 Report
 Weather and Climate Summary and Forecast March 2018 Report Gregory V. Jones Linfield College March 7, 2018 Summary: The ridge pattern that brought drier and warmer conditions from December through most
The Pennsylvania Observer
 The Pennsylvania Observer August 3, 2015 July 2015 - Pennsylvania Weather Recap By: Arthur Person Although this seventh month of 2015 was fairly normal across Pennsylvania as a whole, the details reveal
National Drought Summary August 14, 2018
 National Drought Summary August 14, 2018 The discussion in the Looking Ahead section is a description of what the official national guidance from the National Weather Service (NWS) National Centers for
Weather and Climate Summary and Forecast October 2017 Report
 Weather and Climate Summary and Forecast October 2017 Report Gregory V. Jones Linfield College October 4, 2017 Summary: Typical variability in September temperatures with the onset of fall conditions evident
Monthly Long Range Weather Commentary Issued: SEPTEMBER 19, 2016 Steven A. Root, CCM, Chief Analytics Officer, Sr. VP,
 Monthly Long Range Weather Commentary Issued: SEPTEMBER 19, 2016 Steven A. Root, CCM, Chief Analytics Officer, Sr. VP, sroot@weatherbank.com SEPTEMBER 2016 Climate Highlights The Month in Review The contiguous
March 2012 Climate Summary
 Ken Scheeringa and Kayla Hudson Apr 4, 2012 (765) 494-8105 http://www.iclimate.org March 2012 Climate Summary Month Summary March was a month of weather extremes with records shattered almost as a daily
Weather and Climate Summary and Forecast January 2018 Report
 Weather and Climate Summary and Forecast January 2018 Report Gregory V. Jones Linfield College January 5, 2018 Summary: A persistent ridge of high pressure over the west in December produced strong inversions
Weather and Climate Summary and Forecast April 2018 Report
 Weather and Climate Summary and Forecast April 2018 Report Gregory V. Jones Linfield College April 4, 2018 Summary: A near Miracle March played out bringing cooler and wetter conditions to the majority
Monthly Long Range Weather Commentary Issued: May 15, 2014 Steven A. Root, CCM, President/CEO
 Monthly Long Range Weather Commentary Issued: May 15, 2014 Steven A. Root, CCM, President/CEO sroot@weatherbank.com APRIL 2014 REVIEW Climate Highlights The Month in Review The average temperature for
Monthly Long Range Weather Commentary Issued: APRIL 18, 2017 Steven A. Root, CCM, Chief Analytics Officer, Sr. VP,
 Monthly Long Range Weather Commentary Issued: APRIL 18, 2017 Steven A. Root, CCM, Chief Analytics Officer, Sr. VP, sroot@weatherbank.com MARCH 2017 Climate Highlights The Month in Review The average contiguous
NIDIS Weekly Climate, Water and Drought Assessment Summary. Upper Colorado River Basin July 31, 2012
 NIDIS Weekly Climate, Water and Drought Assessment Summary Upper Colorado River Basin July 31, 2012 Fig. 1: July month-to-date precipitation in inches. Fig. 2: SNOTEL WYTD precipitation percentiles (50%
The Pennsylvania Observer
 The Pennsylvania Observer April 2, 2009 March 2009 Pennsylvania Weather Recap Prepared by Curt Harpster For the month of March the saying, In like a lion and out like a lamb really fit the pattern quite
Champaign-Urbana 2001 Annual Weather Summary
 Champaign-Urbana 2001 Annual Weather Summary ILLINOIS STATE WATER SURVEY 2204 Griffith Dr. Champaign, IL 61820 wxobsrvr@sws.uiuc.edu Maria Peters, Weather Observer January: After a cold and snowy December,
Arizona Climate Summary May 2012
 Arizona Climate Summary May 2012 Summary of conditions for April 2012 April 2012 Temperature and Precipitation Summary April 1 st 16 th : Although April began with another low pressure system sweeping
April 2011 Climate Summary
 Ken Scheeringa (765) 494-8105 May 9, 2011 http://www.iclimate.org April 2011 Climate Summary Summary After somewhat of a respite in March Indiana weather ramped up with a vengeance in April. Extreme weather
The Pennsylvania Observer
 The Pennsylvania Observer September 3, 2008 Summer 2008 Weather Summary Written by: Brian Thompson The opening days of June started dry, but a warm front brought a widespread rain a couple of days into
February 2016 Climate Summary
 Ken Scheeringa And Andy Eggert Mar 9, 2016 (765) 494-8105 http://www.iclimate.org February 2016 Climate Summary Month Summary February was the 6 th consecutive month with an above normal state average
The Pennsylvania Observer
 The Pennsylvania Observer May 31, 2012 May 2012 - Pennsylvania Weather Recap By: Paul Knight The majority of the fifth month had temperatures averaging well above seasonal levels with two distinct hot
Champaign-Urbana 1999 Annual Weather Summary
 Champaign-Urbana 1999 Annual Weather Summary ILLINOIS STATE WATER SURVEY 2204 Griffith Dr. Champaign, IL 61820 wxobsrvr@sws.uiuc.edu Maria Peters, Weather Observer A major snowstorm kicked off the new
TFS WEATHER BRIEF. Monday, March 25
 TFS WEATHER BRIEF Monday, March 25 Review: The leading edge of cooler and drier air was pushing through Central and East TX this morning. A few lingering thunderstorms were in progress south of I-20 in
New Hampshire State Climate Office Dr. Mary D. Stampone, State Climatologist
 New Hampshire State Climate Office Dr. Mary D. Stampone, State Climatologist University of New Hampshire c/o Department of Geography 73 Main Street Durham, NH 03824 Phone: 603-862-3136 Fax: 603-862-4362
NATIONAL WEATHER SERVICE
 January 2016 February 9, 2016 This was a dry month across the HSA despite one large and several smaller snowfalls. Most locations ended up 1-2 inches below normal for the month. The driest locations at
Summary of November Central U.S. Winter Storm By Christopher Hedge
 Summary of November 12-13 2010 Central U.S. Winter Storm By Christopher Hedge Event Overview The first significant snowfall of the 2010-2011 season affected portions of the plains and upper Mississippi
2012 Growing Season Weather Summary for North Dakota. Adnan Akyüz and Barbara A. Mullins Department of Soil Science October 30, 2012
 2012 Growing Season Weather Summary for North Dakota Adnan Akyüz and Barbara A. Mullins Department of Soil Science October 30, 2012 Introduction The 2012 growing season (the period from April through September)
Crop / Weather Update
 Crop / Weather Update Corn Crop Condition Percent of Acreage Rated Good or Excellent 85 80 75 70 65 60 55 50 45 As of September 9, USDA rates the crop at 68% good to excellent. The rating is up one point
Weather and Climate Summary and Forecast Winter
 Weather and Climate Summary and Forecast Winter 2016-17 Gregory V. Jones Southern Oregon University February 7, 2017 What a difference from last year at this time. Temperatures in January and February
Monthly Long Range Weather Commentary Issued: February 15, 2015 Steven A. Root, CCM, President/CEO
 Monthly Long Range Weather Commentary Issued: February 15, 2015 Steven A. Root, CCM, President/CEO sroot@weatherbank.com JANUARY 2015 Climate Highlights The Month in Review During January, the average
but 2012 was dry Most farmers pulled in a crop
 After a winter that wasn t, conditions late in the year pointed to a return to normal snow and cold conditions Most farmers pulled in a crop but 2012 was dry b y M i k e Wr o b l e w s k i, w e a t h e
October 2010 Climate Summary
 Ken Scheeringa (765) 494-8105 Nov 5, 2010 http://www.iclimate.org October 2010 Climate Summary Summary Rain fell on about 10 days in October but did little to slow the drought raging across Indiana. For
Weather and Climate Summary and Forecast January 2019 Report
 Weather and Climate Summary and Forecast January 2019 Report Gregory V. Jones Linfield College January 4, 2019 Summary: December was mild and dry over much of the west, while the east was much warmer than
Illinois Drought Update, December 1, 2005 DROUGHT RESPONSE TASK FORCE Illinois State Water Survey, Department of Natural Resources
 Illinois Drought Update, December 1, 2005 DROUGHT RESPONSE TASK FORCE Illinois State Water Survey, Department of Natural Resources For more drought information please go to http://www.sws.uiuc.edu/. SUMMARY.
Weather and Climate Summary and Forecast December 2017 Report
 Weather and Climate Summary and Forecast December 2017 Report Gregory V. Jones Linfield College December 5, 2017 Summary: November was relatively cool and wet from central California throughout most of
NATIONAL WEATHER SERVICE
 NWS Form E-5 (PRES. BY NWS Instruction 10-924) MONTHLY REPORT OF HYDROLOGIC CONDITIONS HYDROLOGIC SERVICE AREA (HSA) NORTHERN INDIANA (IWX) MONTH YEAR TO: Hydrologic Information Center, W/OS31 NOAA s National
NWS FORM E-5 U.S. DEPARTMENT OF COMMERCE HSA OFFICE:
 NWS FORM E-5 U.S. DEPARTMENT OF COMMERCE HSA OFFICE: NOAA, NATIONAL WEATHER SERVICE MONTHLY REPORT OF RIVER AND FLOOD CONDITIONS DATE: TO: North Webster, IN REPORT FOR (MONTH &YEAR): July 1998 August 5,
Weather and Climate Summary and Forecast March 2019 Report
 Weather and Climate Summary and Forecast March 2019 Report Gregory V. Jones Linfield College March 2, 2019 Summary: Dramatic flip from a mild winter to a top five coldest February on record in many locations
Weather and Climate Summary and Forecast November 2017 Report
 Weather and Climate Summary and Forecast November 2017 Report Gregory V. Jones Linfield College November 7, 2017 Summary: October was relatively cool and wet north, while warm and very dry south. Dry conditions
Nebraska experienced a wide
 Issue 1 August 2016 CLIMATE UPDATE A MONTHLY SUMMARY FROM THE neclimate.unl.edu August saw reprieve from dryness, cooler temps Overview Nebraska experienced a wide range of conditions across the state
March 2011 Climate Summary
 Ken Scheeringa (765) 494-8105 Apr 5, 2011 http://www.iclimate.org March 2011 Climate Summary Summary The fast paced weather action of February slowed some in March. The major March weather features were
July 2015 Climate Summary
 Ken Scheeringa And Mary Rose Mangan Aug 6, 2015 (765) 494-8105 http://www.iclimate.org July 2015 Climate Summary Month Summary Record setting rainfall in June persisted into the first three weeks of July.