June 2015 Climate Summary
|
|
|
- Clarence Hunter
- 5 years ago
- Views:
Transcription

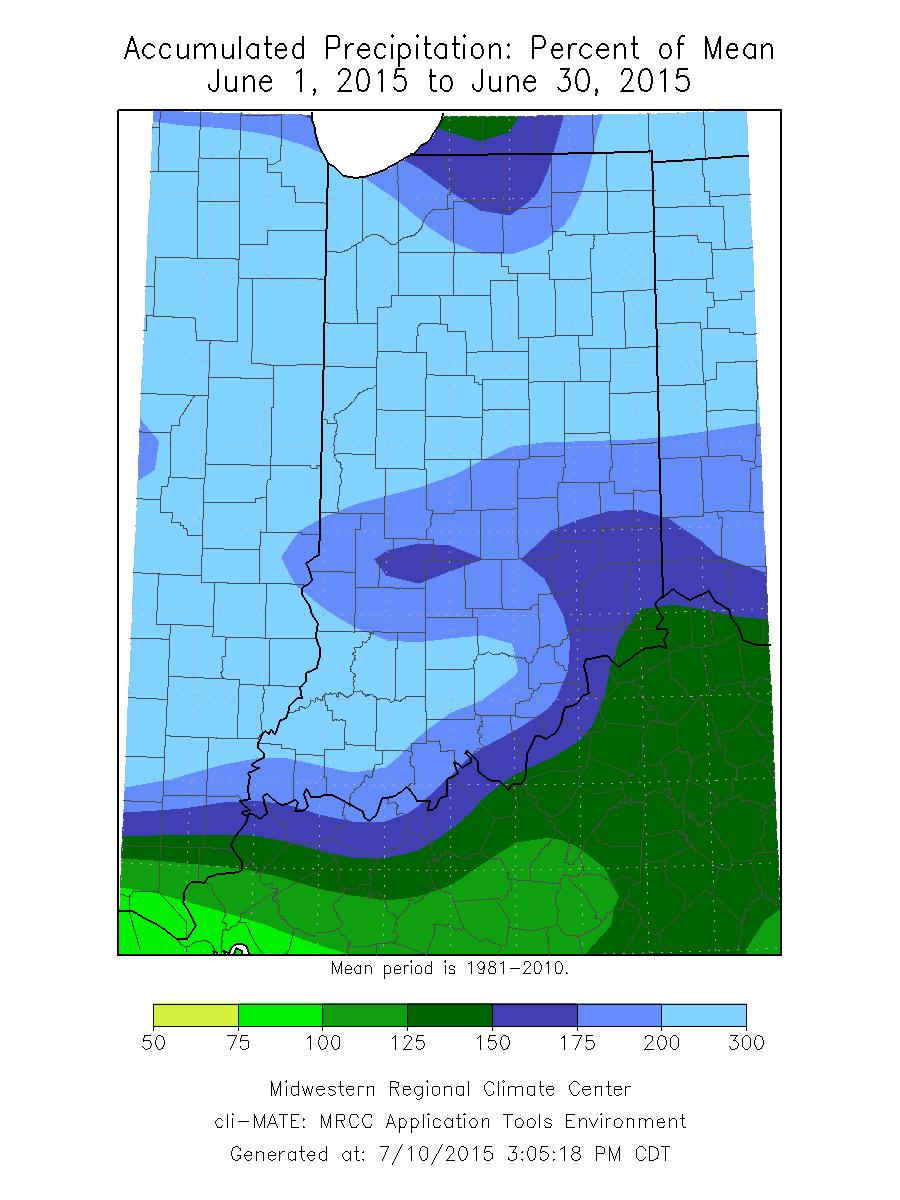
1 Ken Scheeringa And Mary Rose Mangan Jul 10, 2015 (765) June 2015 Climate Summary Month Summary Indiana set a new June rainfall record this month with a state average This new record easily breaks the old June record of 8.13 set in Three weather patterns delivered the heavy rainfall to parts of the state in different weeks of the month. Severe weather was reported on 19 days as repeated floods, hail, wind, and 3 tornadoes ravaged the state, resulting in 2 weather related deaths. The agricultural sector was especially hard hit with initial crop losses estimated at $475 million. The state average temperature for June was 71.4 F. This is 0.5 F above normal and ties 1941 and 1959 as the 47 th warmest June on record. Some recent warmer Junes include 2012 with its 71.6 F in 40 th place. A year earlier the 72.2 F average landed at 30 th warmest. Last year came in at 25 th place with a 72.6 F average. In 2010 its 74.1 F number claimed the 10 th warmest spot. The warmest June on record was in 1934 with a 76.5 F state average temperature. The day split in June 2015 was 11 days of below normal temperature, 18 days above normal, and 1 day at normal. There was 1 day with the state average temperature at 10 F or more below normal. The highest temperature of the month in the cooperative observer network was 94 F on June 11 th in Boonville 1s. The coldest minimum was 40 F on June 3 rd at Lagrange 1n. The June state precipitation average of 8.99 was 4.80 above normal, the wettest June on record. June 2015 was also the 4 th wettest of any month on record in Indiana since Some recent wet Junes include last year with 5.61 at 18 th wettest. Two years ago the state average June rainfall was 6.24, good for 11 th place. In 2010 June rainfall was 7.68, pegged as the 4 th wettest June in the record books. The highest single day precipitation among cooperative stations in June 2015 was 5.06 recorded on June 20 th at Elnora. The highest daily total in the CoCoRaHS network was 6.77 measured that same day at Plainville 1.3s. The highest monthly total was as recorded at Rensselaer 6.2se. Many CoCoRaHS stations exceeded a foot of rain for the month. A list can be found at by selecting a date interval of June 1 st - 30 th in 2015 for Indiana, then clicking the Total Precip in. column title on the output page to sort the values. Regionally June 2015 precipitation was near 220% of normal in northern and central Indiana and 200% of normal in the south. Normal June precipitation ranges from 4.1 in northeast, central, and southwest Indiana to 4.3 in northcentral and west central Indiana. Widespread precipitation fell on about 23 days this month.
2 June 1 st 7 th The opening days of June were cold but a warming trend was underway. Temperatures the second half of the week held slightly warmer than normal. Only one front passed through the state this week which kept most rainfall totals low. Wind gusts with this front caused local damage in just one county. Severe weather was more extensive at the end of the week, evidenced by 3 tornadoes and several reports of wind damage across the northwest quarter of the state. Dry soils expanded in southern Indiana this week due to the below normal rainfall. Yet field work delays were common elsewhere due to cool and damp soils carried over from last month. June 1 st was chilly with the state temperature 11 F below normal. High pressure in eastern Canada transported cold air via a back door route southwest into Indiana. The next day this ridge itself sprawled into the state, clearing local skies but keeping temperatures low at 9 F below normal. On June 3 rd the ridge continued to spread southwest toward Arkansas. Warmer air began to return to Indiana with state temperatures rising to 5 F below normal. By the next day high pressure had spread coast to coast, from Maine to Mississippi, and was centered overhead Indiana. The state temperature responded by crossing the normal line to 1 F above normal. A cold front had slowly advanced from Minnesota and by June 5 th had entered northern Indiana. It remained warmer in central and southern Indiana, allowing the state temperature a slight bump to 2 F above normal. By the next morning the cold front had advanced through Indiana and crossed the Ohio River. Ahead of the front minor local wind damage was reported in Jackson county. The temperature had dipped back to normal. High pressure in Canada had pushed the cold front through. On June 7 th the Canadian high traveled quickly from Hudson Bay to New Hampshire. The departing high center and a new approaching storm in Minnesota forced warm unstable air north into Indiana. Severe weather broke out in the northwest quarter of the state. Three tornadoes and several pockets of wind damage erupted the evening of June 7 th. The state temperature wrapped up the week at 2 F above normal. Overall for the week the state temperature averaged to 3 F below normal. Typically in this first week of June daily maximum temperatures should range between 76 F and 83 F north to south across Indiana. Daily minimums normally vary from 55 F in far northern counties to 61 F in the far southwest corner of the state. The warmest daily maximum temperature reported in the cooperative network this week was 92 F on June 7 th at Boonville 1s and the Evansville Airport. The coolest minimum was 40 F at Lagrange 1n on June 3 rd. Generally rainfall was light this week but heavier rains on May 31 st tally into the June 1 st morning report. The heaviest amounts that morning were found in northeast Indiana. Hamilton had 1.21 while Angola had 1.13 and 1.04 was recorded in Auburn. These single day amounts were also the weekly totals at these locations, another indicator of a mostly dry week. Some other weekly sums were 1.08 in Richmond and 1.00 at Taylorsville. Regionally for the week northern Indiana averaged 0.3, central counties about 0.1, while 0.2 was typical in southern Indiana. These totals equate to about 30% of normal in the north, 10% of normal in central areas, and 20% of normal across southern Indiana.
3 Several large trees were uprooted in Jackson county on June 5 th by high winds. This is the only storm damage reported in Indiana that day. Severe weather on June 7 th came in the form of torrential downpours, flash flooding, hail and wind damage, and tornadoes. An EF-0 tornado was confirmed in Jasper county near Demotte. The 35 second tornado was on the ground for 0.25 mile and caused no reported damage. Another EF-0 tornado was confirmed about a mile away. Its path length was 2.8 miles and lasted 5 minutes, also with no observed damage. An EF-1 tornado was confirmed in Starke county. This tornado had winds to 95 mph and a path length of less than a quarter mile, wiping out dozens of trees. The tornado damaged roofs and siding of homes in North Judson and ripped through a wooded area. There were no injuries. Downpours of 1.5 to 4.0 were widespread in northern Lake and Porter counties on Sunday afternoon, resulting in flash flooding and washed out roads. Deep rain water overran low lying roads in Lake county where it rained intensely for 45 minutes. Some vehicles were stranded on roadways and a few dozen homes experienced flooding. Some water rescues were required. Some of the heavier rainfall reports included 4.95 in Kouts, 4.07 at Hebron, 3.79 in Cedar Lake, 2.72 at Lakes of the Four Seasons, and 2.5 in Fowler. A few roads had to be closed in southern Porter county. Meanwhile high winds caused widespread havoc. Gusts removed a building roof in Newton county and tore down a power line in Fulton county. Trees were snapped or uprooted in Pulaski county where winds reached 75 mph. A tree blocked a major city roadway in Tippecanoe county. Tree limbs littered the ground in Laporte, Pulaski, Tippecanoe, Montgomery, Hamilton, and in Fountain counties where wind speeds were recorded up to 65 mph. According to the June 9 th edition of the US Drought Monitor, there were two pockets of soil dryness in Indiana. One was in northeast Indiana and the second in southern Indiana, mostly south of a Dale to Martinsville to Liberty line. The total Indiana area rated abnormally dry stood at 30%, an 8% increase in coverage since the June 2 nd report. That left 70% of Indiana in normal soil moisture status for this time of year. Northern Indiana counties in the abnormally dry D0 category included Steuben, DeKalb, Lagrange, Noble, Kosciusko, and most of Whitley county. In southern Indiana counties new to the D0 list on June 9 th included parts of Orange, Lawrence, Jackson, Brown, Bartholomew, Johnson, Shelby, Rush, Decatur, Fayette, Union and Franklin. Previously Ohio River counties between Spencer and Dearborn were already classified as abnormally dry and in the D0 category of the US Drought Monitor. Spring planting is nearing completion according to the June 8 th edition of the USDA Indiana crop report. But corn and soybeans in northern and central Indiana have yellowed where soils were soaked earlier. Some ponded areas have been or will soon be replanted. Generally recent cool but dry weather has slowed field work and crop growth.
4 June 8 th 14 th In stark contrast to a week ago storm systems and their fronts were in the vicinity of Indiana every day. Rain fell daily in much of northern and central Indiana, racking up large rainfall sums. The week total was more reasonable across the southern third of the state. The range in daily state temperature was small, just 7 F this week. Yet with fronts constantly in the area the atmosphere was quite unstable, triggering 5 days of reported hail and wind damage in Indiana. The week began with a cold front approaching the state. The state average temperature opened at 1 F above normal. The cold front pushed through Indiana on June 9 th but stalled just beyond the Ohio River. High pressure in Mississippi blocked its further advance. On June 10 th a new storm system passed north of the Great Lakes. The system s warm front moved through Indiana and helped lift the state temperature to 6 F above normal. The next day the cold front in the rear part of this storm stopped at the Michigan border as another stationary front. The failure of the cold front allowed the flow of warm moist air into Indiana to continue. The state temperature responded by rising to 8 F above normal on June 11 th, the warmest day of the week. There was little movement of the stationary front over the next 2 days. The warm unstable air mass lingered over Indiana and triggered several rounds of severe weather. The temperature dipped only slightly to 6 F above normal by June 13 th. Finally on June 14 th a new storm system helped unlatch the stationary front and it began to retreat north into Michigan again as a warm front. Indiana continued in the warm air mass of the previous few days. The state average temperature barely moved, ending the week at 6 F above normal. Overall the weekly state temperature averaged to 5 F above normal. Typically in this second week of June daily maximum temperatures would range between 78 F in far northern counties to 85 F in the southwest corner of the state. Normal daily minimums vary between 58 F and 63 F north to south across Indiana. The warmest daily maximum temperature in the cooperative station network this week was 94 F at Terre Haute and Boonville 1s on June 11 th. The coolest daily minimum was 54 F at Indiana Dunes and Woodburn 3n on June 9 th and at Lagrange 3n on June 10 th. Rainfall was heavy at the start of the week with more moderate daily amounts afterward. Some of the heavier rainfall in the June 8 th morning CoCoRaHS reports included 4.95 at Kouts, 4.25 at
5 Rensselaer, 4.20 in Lake Village, with 4.47 and 4.07 noted by two Hebron volunteers. All these places are in northwest Indiana. The largest weekly totals included 7.02 in Craigville, 6.89 and 5.86 at two spots in Rensselaer, 6.09 at Bluffton, and 5.92 in Crown Point. Regionally on average about 3.1 of rainfall was measured in northern Indiana, 2.4 in central, and 1.0 across southern Indiana. These amounts equate to about 280% of normal in the north, 240% of normal in central counties, and 110% of normal in the southern third of the state. The frequent rainfall was a headache for road construction crews. Start of a project on I-65 in Tippecanoe county had to be postponed yet again due to the daily rainfall. On June 10 th in the same county a rural road collapsed and was closed when soil washed out from underneath the road. Log jams near bridges were being watched closely and cleared away before damage was caused by high river levels. In White county streets and homes were flooded by torrential rainfall on June 12 th. Water surrounded homes where sump pumps had failed. The county collected sand bags in anticipation of an extended flooding period with more rain in the forecast. Severe weather reports rolled in on 5 days this week. On June 8 th 1.0 to 1.5 diameter hail was reported in Lake, Newton, Jasper, Starke, Laporte, and St Joseph counties in northwest Indiana and in Hendricks county near the center of the state. In Lake county hail up to 1.75 in diameter damaged vehicles. There were many reports of trees down in St Joseph, Pulaski, Jasper, and Allen counties. Wind speeds reached 60 mph. In Grant county large branches fell and damaged a truck while in Madison county trees snagged power lines and poles, pulling them to the ground. A tree took down a power line in Marshall county. On June 10 th 1.0 hail was seen in Marshall county. In nearby Kosciusko county an irrigation system was destroyed and a second system blown over by 60 mph winds. Power lines got tangled in falling trees here as well. High winds in Lake county did marginal damage to trees. Weather damage continued the next day in far northern Indiana. Hail 1.0 to 1.25 in diameter fell in Elkhart and Lagrange counties. High winds in St Joseph county blew over a semi truck on the tollway. In Starke county many trees and power lines were downed. The most widespread wind damage occurred on June 12 th in northern and central Indiana. Trees fell on homes and other structures in Miami and Huntington counties. Trees were uprooted and one fell on a car. In Madison county there were 15 locations of wind damage identified including trees and power lines falling on a state road. Traffic had to be diverted for a time. A barn was half destroyed by high winds and a falling tree damaged a car there. A pole barn was ripped apart in Shelby county and its metal pieces strewn about in a nearby field. Trees fell on power lines. There were several more reports of trees falling on and pulling down power lines in White, Tippecanoe, Carroll, Cass, and Morgan counties. In White county 1.0 diameter hail was also reported. Wind damage continued in northeast Indiana on June 13 th. In Adams county two barn trusses were blown off and trees taken down. Trees snapped and fell on power lines in Allen county. In Huntington county deep water was reported running over roads after intense thunderstorms. A tree blocked a road there.
6 While severe storms and torrential rain drenched northern Indiana, dryness was expanding in southern Indiana according to the June 16 th edition of the US Drought Monitor. An additional 5% of Indiana land joined a growing region of dry soils. That left about two-thirds of Indiana in normal soil moisture status. Not only was the dry region expanding but a portion of the existing abnormally dry D0 area was changed to moderate drought status, the D1 category, claiming almost 15% of total Indiana area. The new moderately dry region is generally south of a Eureka to Scipio to Saint-Leon line, or roughly from Spencer to Jennings to Dearborn counties. The altered abnormally dry region lie adjacent and north of the moderately dry region, generally south of a Boonville to Jasper to Martinsville to Connersville line. This area claims about 20% of total Indiana area. There was no change made in the northeast Indiana abnormally dry pocket as of June 16 th. The June 15 th edition of the USDA Indiana crop report contrasts northern Indiana with its storms, heavy rain, and excess moisture with the dryness in southeast Indiana. Several fields have ponded in the north and halted field work. Soybean planting has nearly finished. Some wheat and hay fields have been flattened by excess water and oversaturated corn and soybeans have turned a yellow color. Replanting options will need to be evaluated over the next few weeks. June 15 th 21 st Two major weather patterns dominated Indiana weather this week. The Bermuda ridge had moved inland from its typical location off the east Florida coast on June 11 th. This ridge expanded and blocked storms from moving normally across the southeast this week, forcing storm systems to go around through a narrow corridor in northern Indiana to reach the Atlantic Coast. This pattern funneled large rain amounts to this part of the state. Then on June 19 th and 20 th the remnants of Tropical Storm Bill carried heavy rain across the southern half of Indiana, an area which was largely missed earlier in the month. The influence of these two patterns generated an extremely stormy and wet week. Rain fell every day with severe weather reported on 6 of 7 days including a confirmed tornado on June 19 th. While rainfall was extreme state average temperatures were rather stable in a slight cooling trend.
7 Weather fronts were present in Indiana every day this week. Field crops suffered extreme flooding conditions and wind damage in parts of northern Indiana. On June 15 th Indiana was positioned inside a large warm air sector in the back flow of surface high pressure located in eastern Tennessee. The state average temperature was mild at 6 F above normal. The next day a cold front stalled in central Indiana, dumping heavy rain in the northern part of the state. The stationary front remained there on June 17 th. The state temperature began a slow drop to 2 F above normal as cooler air trickled into the state from the north. On June 18 th the stationary front converted into a warm front that returned north into Michigan. The remnants of Tropical Storm Bill had moved to Oklahoma and joined forces with the Bermuda high to its east to reinforce the flow of warmer air north through Indiana. Yet the state temperature barely moved at 3 F above normal. On June 19 th a storm that had passed over northern Indiana the day before reversed the warm front again into a slow moving cold front that inched across central Indiana. The state temperature fell to 1 F below normal. The remnants of Tropical Storm Bill moved to southern Indiana on June 20 th. The sluggish cold front drifted from central to southern Indiana, teaming up with Bill to pound southern Indiana with heavy rainfall. The state temperature lifted slightly to 1 F above normal. The remains of Bill moved east and left southern Indiana on June 21 st. The old cold front disappeared from the map as the air had been well mixed by Bill. To close out the week a new but weak cold front entered northern Indiana, placing the state temperature at 2 F above normal. Overall for the week the state temperature averaged to 2 F above normal. Typically in mid-june the daily maximum temperature should range from 81 F to 87 F north to south across Indiana. Normal daily minimums vary between 60 F in far northern counties to 65 F in far southwest Indiana. The warmest daily maximum temperature in the cooperative station network this week was 92 F at Boonville 1s on June 15 th. The coolest daily minimum was 54 F at Marion 2n on June 16 th and at Indiana Dunes on June 19 th. Rain fell on all 7 days but the heaviest amounts were reported the mornings of June 16 th and 20 th. On June 16 th in the CoCoRaHS network the Huntington observer measured 4.90 inches while in La Fontaine 4.75 was recorded. On June 20 th the Plainville observer noted 6.77 while Bicknell had 4.90 and Holland received The heaviest weekly totals included Plainville at 9.04, Rochester with 7.94, and Andrews with Two Evansville volunteers had 7.09 and 7.00 for the week. Regionally northern Indiana averaged about 3.2 for the week, central counties had 3.6, and in southern Indiana about 4.6 fell. These totals equate to about 370% of normal in northern and central Indiana and 480% of normal in the south. Rainfall was most extreme in a west to east band across northern Indiana stretching from Newton to Adams counties. Heavy crop losses were expected in this region as young corn plants would likely only survive submerged for up to 4 days. Later planted soybeans could also be vulnerable to flooding. Farmers who suffered losses due to flooding were encouraged to contact the county Farm Service Agency office to inquire about assistance. On June 16 th water rescues were underway in early morning for residents of White county stranded by flood waters. A flood warning was issued as dam levels were very high and rising. Local rivers were being monitored closely. In Carroll county residents in already flooded homes were evacuated as utility crews were turning off gas meters to avert the threat of fire. In the southwest corner of the
8 state 1.0 inch diameter hail was observed in Vanderburgh county while high winds blew down construction signs in adjacent Gibson county. The next day wind gusts dislodged some large tree limbs in Clark county but no other damage was reported across the state. Wind damage was more extensive on June 18 th across the eastern half of Indiana. Gusts to 60 mph pulled down a utility pole and tree limbs in Allen county. Uprooted trees snagged power lines which blocked roads in Wells county. Power lines and trees were also down in Huntington county while tree limbs blocked roads in Noble county. More trees were uprooted or snapped and damaged power poles and lines in Wayne county. Power poles came down in Hendricks county. Fallen trees but without further damage were reported in Marshall, Howard, Putnam, Jefferson, and Scott counties. High winds tore shingles off a roof in Clark county. On June 19 th an EF-0 tornado touched down in Perry county for about 0.3 mile. Some trees were stripped of limbs or snapped in half by high winds but there were no injuries. The tornado was spun off by Tropical Storm Bill as it passed through southern Indiana. High winds in nearby Crawford county damaged trees that day as well. Meanwhile in Jasper county the worst flooding since at least the 1940 s shut down many roads and highways north of Rensselaer. A few families were set up at Red Cross shelters. Jasper and White counties each filed a local Disaster Emergency Declaration with the state to request assistance. Pulaski county declared a severe flooding emergency until further notice as many roads there were impassable. IDHS sent more than 200,000 sandbags to Jasper, Porter, and especially Adams counties. On June 20 th wind gusts up to 100 mph caused damage along a west to east line from Warren to Delaware counties. As expected trees were uprooted or snapped in all these counties. In Warren county trees fell on a car, a porch, a camper, a garage, and split a house in half. The home was a complete loss. Trees fell on a house and power line in Tippecanoe county and blew an outhouse off its base in Clinton county. Another line of wind damage occurred in Boone, Hendricks, and Morgan counties. Power lines fell in Hendricks county while corn was lodged in Morgan county. Heavy rain in thunderstorms knocked out power and damaged homes in Warren, Tippecanoe, Tipton, and Fountain counties. In Fountain county 2 homes suffered minor damage from storms which also brought trees and branches down on to roads and power lines. Several hundred homes lost power. Moderate flooding continued in central and southern Indiana. Hazardous travel watches had been issued in 11 northern Indiana counties and in Knox county in southwest Indiana. Severe weather moved south on June 21 st. Trees fell and blocked county roads in Owen county. Many trees fell on power lines in Crawford and Perry counties near the Ohio River. By the end of the week flood waters had begun receding in Jasper county but county officials reminded residents water levels were still too high to begin cleanup or assess the damage. Sandbags were still being offered to residents who needed them. The bounty of rainfall helped reduce the abnormally dry area coverage in Indiana this week according to the June 23 rd edition of the US Drought Monitor. While most of Kosciusko and
9 Whitley counties were removed from the D0 category in northern Indiana, much larger reductions were made across the south. All D1 moderate drought category was removed. A strip of D0 abnormally dry category land remains along the Ohio River including most of Harrison, Floyd, Clark, Switzerland, and Ohio counties. The net result was that only 8% of Indiana land remains classified as abnormally dry while the remaining 92% is rated in normal or surplus soil moisture status for this time of year. The June 22 nd edition of the USDA Indiana crop report laments the fields which were underwater due to the persistent heavy rains. It was reported that several corn and wheat fields were knocked down by hail and strong winds and that flooding is widespread. Overall crop conditions have declined with corn yellowing and lodging. Hay harvest has been severely delayed past the usual first cutting date. About 61% of topsoil is now surveyed to be surplus in moisture while 50% of subsoil is rated in that condition. June 22 nd 30 th The rainy June weather pattern continued to the end of the month. Once again rain fell every day somewhere in the state. Flooding resulted in 2 Indiana deaths. Severe weather was reported on 6 of these last 9 June days but was usually local in coverage. Daily temperatures after June 23 rd trended cooler until the last two days of the month. On June 22 nd a warm front was moving north through Indiana. The daily state temperature stood at a warm 4 F above normal. The cold front at the rear of the storm passed through the state the next day. When high pressure behind the front settled overhead Indiana on June 24 th the state temperature fell to 2 F below normal. The cold front slowed to a stop once south of Indiana. Rain overran this stationary front into the state on June 25 th helping to steady the temperature at 1 F below normal. The stationary front morphed into a warm front ahead of a new storm system approaching Indiana from the southwest. Moderate rainfall kept state temperatures cool at 3 F below normal. The cold front side of this storm crossed through the state on June 27 th and the state temperature dropped to 7 F below normal. Skies cleared over Indiana on June 28 th as high pressure rolled in and shut off the heavy rainfall. The state temperature dipped to 8 F below normal, the coolest day of the 9 day interval. A new
10 storm raced to Indiana on June 29 th, pushing its warm front into southern Indiana. The cooling trend was reversed as the state temperature lifted to 5 F below normal. The warm front stalled there on June 30 th as the state temperature closed out the month at 2 F below normal. Over the 9 day interval the daily state temperature averaged to 2 F below normal. Usually the daily maximum temperature in late June would vary between 82 F in far northern Indiana to 88 F in the southwest corner of the state. Daily minimums normally range from 62 F to 67 F north to south across the state. The warmest daily maximum temperature in the cooperative station network over the 9 days was 92 F on June 25 th at Boonville 1s, Evansville Airport, and Newburgh and on June 26 th at Mount Vernon. The coolest daily minimum in the same network was 50 F on June 28 th at the Indiana Dunes and Goshen Airport. Rain fell on all 9 days but was heaviest with the passage of the second cold front in mid-interval. The CoCoRaHS volunteer at Newberry measured 5.66 in the June 26 th morning report, the highest single day amount. The next morning the observer at Willow Branch had 4.31 while just west of Muncie 4.27 was recorded. Two east side Indianapolis reports of 4.18 and 4.16 were also noted that day. Over the entire 9 days the east Indianapolis tally came to 5.69 and Muncie had At Leopold 5.39 was collected. A Portland volunteer summed 5.18 in the gage while in Huntertown 5.14 was caught over the 9 days. Regionally about 2.8 fell in northern Indiana, 3.3 in central areas, and 2.4 across the south. These totals equate to about 220% of normal in the northern third of the state, 260% of normal in central, and 210% of normal in southern Indiana. Severe weather was reported on 6 of 9 days but damage was much more localized than in previous June events. Minor wind damage was reported to 2 homes in Fountain county on June 22 nd. Trees fell on roads and power lines there and trees were reported down on Cass county roads as well. One inch diameter hail was noted in Newton county. High winds in Greene county on June 24 th took down many trees and tossed a ripped barn roof across a road. The next day wind gusts tore a barn roof in Floyd county and damaged a home porch. Many trees were broken in that area. Across the state in northeast Indiana power poles were toppled in Allen county. Tree branches were scattered on roadways in Lagrange county. After the June 25 th storm utility crews in Allen county found 81 broken power poles and 72 poles with damaged equipment as repairs were underway. On June 26 th Muncie streets were submerged after a deluge there, requiring the rescue of at least 15 stranded vehicles. The city continued to make sand bags available to residents who needed them. In Vermillion county police closed a westbound lane of I-74 due to flash flooding. In far southern Indiana large hail up to 1.75 in diameter pounded Perry county in a thunderstorm that tossed outdoor furniture around. Trees fell in Crawford county while in neighboring Harrison county wind gusts dropped power lines on to state highways. More trees fell on Floyd county roads. On June 27 th neighborhoods throughout Indiana were flooded and power was out to several thousand homes and businesses. Many roads in the northern half of the state were closed due to

11 high water. Two people died when their car skidded on a water logged road into a utility pole in Hamilton county. In Jay county city streets were covered in a foot of water during a downpour and had to be shut down for hours. Sandbagging efforts were underway downtown. In Delaware county water in roadways reached a two foot depth. Manhole covers popped off streets when storm sewers couldn t handle the water flow after downpours hit. About a dozen vehicles were stranded and had to be rescued. Meanwhile in Allen county 60 mph wind gusts uprooted large trees, sending them crashing into homes. Power outages hit 30,000 customers. In Delaware county two kayakers had to be rescued from the fast moving White River on June 28 th. In Tippecanoe county a boat capsized with 2 people on board. Crews rescued 1 passenger while the other was later found safely at home. On June 29 th debris that was picked up by water in a field blocked part of a county road in Delaware county. Corn was lodged in some of these fields. Hail and wind damage was more widespread on June 30 th. Hail diameter reached 1.50 in Clark county while one inch hail was observed in Clark, Ripley, and Shelby counties. High winds in Ohio county pulled trees down onto roads there while more trees and branches came down in Ripley, Washington, Scott, and Clark counties. All trace of abnormally dry soils across Indiana disappeared according to the June 30 th edition of the US Drought Monitor (USDM). The last time the USDM indicated that no dry soils were present in Indiana was in its March 17 th edition. Soils returned to normal or surplus soil moisture status during this last week of June. According to the USDA Indiana crop bulletin edition of June 29 th, prolonged flooding and ponding had essentially shut down field work. Many crops were submerged in standing water, had lodged, yellowed, or had snapped stalks. Some crops showed hail damage. Harvesting of wheat and hay had been suspended in several areas. Farmers were unable to apply needed nitrogen or herbicides. By the end of the month Indiana crop losses were estimated at $475 million due to June flooding. At this late date some crops will not be replanted. Such large Indiana crop losses may impact market prices and insurance costs for the duration of summer.
12 June 2015 Temperature Region Temperature Normal Deviation Northwest North Central Northeast West Central Central East Central Southwest South Central Southeast State Precipitation Region Precipitation Normal Deviation Percent of Normal Northwest North Central Northeast West Central Central East Central Southwest South Central Southeast State
13 Summer so far (same as June) Temperature Region Temperature Normal Deviation Northwest North Central Northeast West Central Central East Central Southwest South Central Southeast State Precipitation Region Precipitation Normal Deviation Percent of Normal Northwest North Central Northeast West Central Central East Central Southwest South Central Southeast State
14 2015 Annual (through June) Temperature Region Temperature Normal Deviation Northwest North Central Northeast West Central Central East Central Southwest South Central Southeast State Precipitation Region Precipitation Normal Deviation Percent of Normal Northwest North Central Northeast West Central Central East Central Southwest South Central Southeast State
15
16
17

18 Drought Summary from the U.S. Drought Monitor Below is a drought summary for the state of Indiana from the U.S. Drought Monitor. Areas in white are not experiencing any drought. Yellow areas are abnormally dry, but not considered a drought. Drought begins when the moisture levels become more severe, with beige, orange, red, and brown indicating increasing levels of drought (moderate, severe, extreme, and exceptional, respectively). The table below indicates what percentage of the state is drought free, and how much of the state is in drought by degree of severity (D1 - D4 category).
19 June 2 nd Drought Summary
20 June 9 th Drought Summary

21 June 16 th Drought Summary
22 June 23 rd Drought Summary
23 June 30 th Drought Summary
August 2006 Summary. August 1-5
 Ashley Brooks (765) 494-6574 Sep 8, 2006 http://www.iclimate.org August 1-5 August 2006 Summary The heat wave that started during the end of July continued into the beginning parts of August with temperatures
July 2007 Climate Summary
 Dan Bowman (765) 494-6574 Sep 3, 2007 http://www.iclimate.org Summary July 2007 Climate Summary The month of July ended as a very unusual month. Many events occurred during the month of July that is not
August 2013 Climate Summary
 Ken Scheeringa and Matt Price Sep 6, 2013 (765) 494-8105 http://www.iclimate.org August 2013 Climate Summary Month Summary August weather began cool and wet but became progressively warmer and drier through
September 2005 Climate Summary
 Ashley Brooks (765) 494-6574 Oct 5, 2005 http://iclimate.org September 2005 Climate Summary September 1-7 A cold front came through on the 1 st of the month, however little moisture was associated with
May 2015 Climate Summary
 Ken Scheeringa And Mary Rose Mangan Jun 8, 2015 (765) 494-8105 http://www.iclimate.org May 2015 Climate Summary Month Summary May was a very warm month. Rainfall averaged near normal but was distributed
August 2017 Climate Summary
 Ken Scheeringa And Andy Eggert Sep 7, 2017 (765) 494-8105 http://www.iclimate.org August 2017 Climate Summary Month Summary The coolest August in 13 years featured long cool and warm spells, below normal
October 2011 Climate Summary
 Ken Scheeringa and Kayla Hudson Nov 4, 2011 http://www.iclimate.org October 2011 Climate Summary Month Summary October weather evolved as a two part story. Weather conditions the first half of the month
IC ARTICLE 19. DESCRIBING REAL PROPERTY; INDIANA COORDINATE SYSTEM. IC Chapter 1. Designation of Indiana Coordinate System; Zones
 IC 32-19 ARTICLE 19. DESCRIBING REAL PROPERTY; INDIANA COORDINATE SYSTEM IC 32-19-1 Chapter 1. Designation of Indiana Coordinate System; Zones IC 32-19-1-1 Designation of systems Sec. 1. The systems of
August 2015 Climate Summary
 Ken Scheeringa And Mary Rose Mangan Sep 4, 2015 (765) 494-8105 http://www.iclimate.org August 2015 Climate Summary Month Summary A very active wet summer weather pattern turned much calmer and drier in
June 2016 Climate Summary
 Ken Scheeringa And Andy Eggert Jul 8, 2016 (765) 494-8105 http://www.iclimate.org June 2016 Climate Summary Month Summary June was a warm month with below normal temperature on just 6 days. Rainfall was
September 2011 Climate Summary
 Ken Scheeringa and Kayla Hudson Oct 5, 2011 (765) 494-8105 http://www.iclimate.org September 2011 Climate Summary Month Summary The final blast of summer heat arrived at the start of September. It lasted
May 2018 Climate Summary
 Ken Scheeringa and Andy Eggert Jun 7, 2018 (765) 494-8105 http://www.iclimate.org May 2018 Climate Summary Month Summary As the calendar turned from April to May temperatures flipped dramatically away
June 2011 Climate Summary
 Ken Scheeringa (765) 494-8105 Jul 8, 2011 http://www.iclimate.org June 2011 Climate Summary Month Summary The abundance of extreme weather this year extended yet another month into June. This month has
April 2016 Climate Summary
 Ken Scheeringa And Andy Eggert May 9, 2016 (765) 494-8105 http://www.iclimate.org April 2016 Climate Summary Month Summary One month but two seasons. The first half of April was cold with snow. Wind damage
December 2011 Climate Summary
 Ken Scheeringa and Kayla Hudson Jan 17, 2012 (765) 494-8105 http://www.iclimate.org December 2011 Climate Summary Month Summary What a difference a year makes! A year ago the misery of a harsh, cold, and
September 2012 Climate Summary
 Ken Scheeringa and Kayla Hudson Oct 5, 2012 (765) 494-8105 http://www.iclimate.org September 2012 Climate Summary Month Summary Summer slipped away and it felt a lot more like autumn in Indiana this month
July 2015 Climate Summary
 Ken Scheeringa And Mary Rose Mangan Aug 6, 2015 (765) 494-8105 http://www.iclimate.org July 2015 Climate Summary Month Summary Record setting rainfall in June persisted into the first three weeks of July.
January 2008 Climate Summary
 Joseph Mays (765) 494-6574 Feb 5, 2008 http://www.iclimate.org Summary January 2008 Climate Summary January was a mix bag of conditions, with an oscillatory pattern developing. We experienced phases of
January 2017 Climate Summary
 Ken Scheeringa And Andy Eggert Feb 8, 2017 (765) 494-8105 http://www.iclimate.org January 2017 Climate Summary Month Summary The warmest January in 11 years was nearly 4 F warmer than December 2016. An
November 2012 Climate Summary
 Ken Scheeringa and Kayla Hudson Dec 6, 2012 (765) 494-8105 http://www.iclimate.org November 2012 Climate Summary Month Summary November was one of those rare weather months in Indiana when not much happened:
April 2015 Climate Summary
 Ken Scheeringa And Mary Rose Mangan May 8, 2015 http://www iclimate org April 2015 Climate Summary Month Summary April was a month of extremes. Severe weather erupted on 4 days of the first week with multiple
November 2010 Climate Summary
 Ken Scheeringa (765) 494-8105 Dec 6, 2010 http://www.iclimate.org November 2010 Climate Summary Summary A four month drought in Indiana is collapsing as significant rain fell the final week of November.
March 2009 Climate Summary
 Joseph Mays (765) 494-6574 Apr 1, 2009 http://www.iclimate.org Summary March 2009 Climate Summary March is in the books and it continued the trend of extreme weather we have experienced during the first
June 2010 Climate Summary
 Ken Scheeringa (765) 494-8105 Jul 6, 2010 http://www.iclimate.org June 2010 Climate Summary Summary Summer like heat and humidity arrived in Indiana on May 22 nd and dominated our weather scene nearly
May 2016 Climate Summary
 Ken Scheeringa And Andy Eggert Jun 6, 2016 (765) 494-8105 http://www.iclimate.org May 2016 Climate Summary Month Summary Cold weather dominated in May until the last week of the month. May began wet but
November 2015 Climate Summary
 Ken Scheeringa And Mary Rose Mangan Dec 8, 2015 (765) 494-8105 http://www.iclimate.org November 2015 Climate Summary Month Summary November was much warmer than normal while precipitation was very near
August 2016 Climate Summary
 Ken Scheeringa And Andy Eggert Sep 12, 2016 (765) 494-8105 http://www.iclimate.org August 2016 Climate Summary Month Summary Hot but tranquil weather the first half of August transitioned to a tormented
April 2013 Climate Summary
 Ken Scheeringa and Kayla Hudson May 6, 2013 (765) 494-8105 http://www.iclimate.org April 2013 Climate Summary Month Summary Temperatures bounced high and low this month, keeping Hoosiers guessing which
October 2014 Climate Summary
 Ken Scheeringa And Matt Price Nov 10, 2014 (765) 494-8105 http://www.iclimate.org October 2014 Climate Summary Month Summary October featured a mix of weather. A very wet first half of the month evolved
November 2017 Climate Summary
 Ken Scheeringa and Andy Eggert Dec 8, 2017 (765) 494-8105 http://www.iclimate.org November 2017 Climate Summary Month Summary November temperatures alternated spells of warm and cool while precipitation
SIGNIFICANT EVENTS Severe Storms November 1994 January 1996 August 1998 and May 2000 March 2002 May 2002 Champaign County
 SIGNIFICANT EVENTS Severe Storms November 1994 On Nov. 1, 1994, high winds gusted over 60 mph at times across the northwest third of Ohio. The highest measured wind gust was 63 mph at Columbus Grove (Putnam).
October 2017 Climate Summary
 Ken Scheeringa and Andy Eggert Nov 6, 2017 (765) 494-8105 http://www.iclimate.org October 2017 Climate Summary Month Summary After more than three weeks of warm temperatures October turned suddenly cold
September 2016 Climate Summary
 Ken Scheeringa And Andy Eggert Oct 6, 2016 (765) 494-8105 http://www.iclimate.org September 2016 Climate Summary Month Summary The warmest September in 77 years brought alternating weeks of dry and wet
April 2017 Climate Summary
 Ken Scheeringa And Andy Eggert May 8, 2017 (765) 494-8105 http://www.iclimate.org April 2017 Climate Summary Month Summary April was a very warm and wet month in Indiana, nearly setting a new monthly temperature
March 2016 Climate Summary
 Ken Scheeringa And Andy Eggert Apr 8, 2016 (765) 494-8105 http://www.iclimate.org March 2016 Climate Summary Month Summary Count March as the 7 th month in a row that the state average temperature has
January 2012 Climate Summary
 Ken Scheeringa and Kayla Hudson Feb 6, 2012 (765) 494-8105 http://www.iclimate.org January 2012 Climate Summary Month Summary Where is winter? This question found its way into many conversations throughout
July 2011 Climate Summary
 Ken Scheeringa (765) 494-8105 Aug 8, 2011 http://www.iclimate.org July 2011 Climate Summary Month Summary The upper atmospheric high pressure dome which baked the Texas area in heat and drought the past
March 2014 Climate Summary
 Ken Scheeringa And Matt Price Apr 8, 2014 (765) 494-8105 http://www.iclimate.org March 2014 Climate Summary Month Summary Winter had officially ended by the calendar but snow and cold persisted in Indiana
May 2005 Climate Summary
 Ashley Brooks (765) 494-6574 Jun 7, 2005 http://iclimate.org May 2005 Climate Summary May 1-5 Early May was characterized by an upper-level trough that was in place over Indiana that brought in very cool
February 2017 Climate Summary
 Ken Scheeringa And Andy Eggert Mar 9, 2017 (765) 494-8105 http://www.iclimate.org February 2017 Climate Summary Month Summary February 2017 was the warmest February in Indiana since state climate records
October 2012 Climate Summary
 Ken Scheeringa and Kayla Hudson Nov 8, 2012 (765) 494-8105 http://www.iclimate.org October 2012 Climate Summary Month Summary In a reversal from the hot and dry summer, cooler and wetter than normal conditions
INDIANAPOLIS, INDIANA
 The NWS FORM E-5 U.S. DEPARTMENT OF COMMERCE HYDROLOGIC SERVICE AREA: NATIONAL OCEANIC AND ATMOSPHERIC ADMINISTRATION NATIONAL WEATHER SERVICE INDIANAPOLIS, INDIANA REPORT FOR: MONTHLY REPORT OF RIVER
July 2010 Climate Summary
 Ken Scheeringa (765) 494-8105 Aug 4, 2010 http://www.iclimate.org July 2010 Climate Summary Summary The warm summer of 2010 continues. Daily state average temperatures were above normal on all but seven
January 2013 Climate Summary
 Ken Scheeringa and Kayla Hudson Feb 7, 2013 (765) 494-8105 http://www.iclimate.org January 2013 Climate Summary Month Summary Winter or spring? January featured several dramatic swings in temperature and
The hydrologic service area (HSA) for this office covers Central Kentucky and South Central Indiana.
 for this office covers Central Kentucky and South Central Indiana.") January 2012 February 13, 2012 An X inside this box indicates that no flooding occurred within this hydrologic service area. January 2012 continued the string of wet months this winter. Rainfall was generally
January 2012 February 13, 2012 An X inside this box indicates that no flooding occurred within this hydrologic service area. January 2012 continued the string of wet months this winter. Rainfall was generally
July 2014 Climate Summary
 Ken Scheeringa And Matt Price Aug 8, 2014 (765) 494-8105 http://www.iclimate.org July 2014 Climate Summary Month Summary July was unseasonably cool and drier than normal. Rainfall was light in parts of
November 2014 Climate Summary
 Ken Scheeringa And Matt Price Dec 10, 2014 (765) 494-8105 http://www.iclimate.org November 2014 Climate Summary Month Summary Unseasonable cold headlined the Indiana and national news in November. The
November 2016 Climate Summary
 Ken Scheeringa And Andy Eggert Dec 15, 2016 (765) 494-8105 http://www.iclimate.org November 2016 Climate Summary Month Summary Unseasonably warm, pleasant, and sunny weather the first half of the month
January 2006 Climate Summary
 Ashley Brooks (765) 494-6574 Feb 9, 2006 http://www.iclimate.org January 1-3 January 2006 Climate Summary Unseasonably warm conditions welcomed in the New Year with highs in the 40s across the northern
October 2016 Climate Summary
 Ken Scheeringa And Andy Eggert Nov 9, 2016 (765) 494-8105 http://www.iclimate.org October 2016 Climate Summary Month Summary October was the 9 th month so far this year to average above normal in temperature.
2012 Growing Season Weather Summary for North Dakota. Adnan Akyüz and Barbara A. Mullins Department of Soil Science October 30, 2012
 2012 Growing Season Weather Summary for North Dakota Adnan Akyüz and Barbara A. Mullins Department of Soil Science October 30, 2012 Introduction The 2012 growing season (the period from April through September)
2011 Year in Review TORNADOES
 2011 Year in Review The year 2011 had weather events that will be remembered for a long time. Two significant tornado outbreaks in April, widespread damage and power outages from Hurricane Irene in August
The hydrologic service area (HSA) for this office covers Central Kentucky and South Central Indiana.
 for this office covers Central Kentucky and South Central Indiana.") MONTH YEAR January 2011 February 15, 2011 X An X inside this box indicates that no flooding occurred within this hydrologic service area. January 2011 was drier than normal in all locations in the area.
MONTH YEAR January 2011 February 15, 2011 X An X inside this box indicates that no flooding occurred within this hydrologic service area. January 2011 was drier than normal in all locations in the area.
April 2011 Climate Summary
 Ken Scheeringa (765) 494-8105 May 9, 2011 http://www.iclimate.org April 2011 Climate Summary Summary After somewhat of a respite in March Indiana weather ramped up with a vengeance in April. Extreme weather
March 2011 Climate Summary
 Ken Scheeringa (765) 494-8105 Apr 5, 2011 http://www.iclimate.org March 2011 Climate Summary Summary The fast paced weather action of February slowed some in March. The major March weather features were
October 2010 Climate Summary
 Ken Scheeringa (765) 494-8105 Nov 5, 2010 http://www.iclimate.org October 2010 Climate Summary Summary Rain fell on about 10 days in October but did little to slow the drought raging across Indiana. For
Some concepts are so simple
 Density: How Concentrated is Our Population? Morton J. Marcus Director Emeritus, Indiana Business Research Center, Kelley School of Business, Indiana University Some concepts are so simple to understand.
NATIONAL WEATHER SERVICE
 January 2016 February 9, 2016 This was a dry month across the HSA despite one large and several smaller snowfalls. Most locations ended up 1-2 inches below normal for the month. The driest locations at
Table 1. August average temperatures and departures from normal ( F) for selected cities.
 for selected cities.") Climate Summary for Florida August 2016 Prepared by Lydia Stefanova and David Zierden Florida Climate Center, The Florida State University, Tallahassee, Florida Online at: http://climatecenter.fsu.edu/products-services/summaries
Climate Summary for Florida August 2016 Prepared by Lydia Stefanova and David Zierden Florida Climate Center, The Florida State University, Tallahassee, Florida Online at: http://climatecenter.fsu.edu/products-services/summaries
NWS FORM E-5 U.S. DEPARTMENT OF COMMERCE I HYDRO SERVICE AREA NOAA, NATIONAL WEATHER SERVICE I Indianapolis, IN MONTHLY REPORT
 NWS FORM E-5 U.S. DEPARTMENT OF COMMERCE I HYDRO SERVICE AREA NOAA, NATIONAL WEATHER SERVICE I Indianapolis, IN. 1-------------------- MONTHLY REPORT OF RIVER AND FLOOD CONDITIONSI REPORT FOR I November
New Hampshire State Climate Office Dr. Mary D. Stampone, State Climatologist
 New Hampshire State Climate Office Dr. Mary D. Stampone, State Climatologist University of New Hampshire c/o Department of Geography 73 Main Street Durham, NH 03824 Phone: 603-862-3136 Fax: 603-862-4362
NWS FORM E-5 U.S. DEPARTMENT OF COMMERCE HSA OFFICE:
 NWS FORM E-5 U.S. DEPARTMENT OF COMMERCE HSA OFFICE: NOAA, NATIONAL WEATHER SERVICE MONTHLY REPORT OF RIVER AND FLOOD CONDITIONS DATE: TO: North Webster, IN REPORT FOR (MONTH &YEAR): July 1998 August 5,
WeatherManager Weekly
 Issue 288 July 14, 2016 WeatherManager Weekly Industries We Serve Agriculture Energy/Utilities Construction Transportation Retail Our Weather Protection Products Standard Temperature Products Lowest Daily
FLOOD/SCS EVENT, APRIL 28 MAY 4
 REPORT DATE: May 4, 2017 EVENT DATE: April 28-May 4, 2017 FLOOD/SCS EVENT, APRIL 28 MAY 4 Event Summary General Significant Flood Outlook. SOURCE: National Weather Service. A significant severe thunderstorm
January 2018 Climate Summary
 Ken Scheeringa and Andy Eggert Feb 8, 2018 (765) 494-8105 http://www.iclimate.org January 2018 Climate Summary Month Summary January temperature swings were amazing. In the first few days arctic cold pushed
NATIONAL WEATHER SERVICE
 NWS Form E-5 (PRES. BY NWS Instruction 10-924) MONTHLY REPORT OF HYDROLOGIC CONDITIONS HYDROLOGIC SERVICE AREA (HSA) NORTHERN INDIANA (IWX) MONTH YEAR TO: Hydrologic Information Center, W/OS31 NOAA s National
MARKET ANALYSIS FOR DRIED. DISTILLERS GRAINS IN INDIANA a. Dept. of Agricultural Economics. Purdue University
 MARKET ANALYSIS FOR DRIED DISTILLERS GRAINS IN INDIANA a by Dr. Frank J. Dooley Working Paper # 08-11 December 2008 Dept. of Agricultural Economics Purdue University a Findings are those only of the author.
March 2018 Climate Summary
 Ken Scheeringa and Andy Eggert Apr 5, 2018 (765) 494-8105 http://www.iclimate.org March 2018 Climate Summary Month Summary March turned cold with below normal temperatures on two-thirds of its days. Along
2018 Year in Review for Central and Southeast Illinois By: Chris Geelhart, Meteorologist National Weather Service, Lincoln IL
 By: Chris Geelhart, Meteorologist National Weather Service, Lincoln IL While 2018 featured some significant out-of-season weather, including below zero temperatures in April and 90-degree highs in early
MIAMI-SOUTH FLORIDA National Weather Service Forecast Office
 MIAMI-SOUTH FLORIDA National Weather Service Forecast Office http://www.weather.gov/miami June 2015 South Florida Weather Summary Dry East, Wet West...Drought Remains SE Florida July 3, 2015: Depending
Champaign-Urbana 2001 Annual Weather Summary
 Champaign-Urbana 2001 Annual Weather Summary ILLINOIS STATE WATER SURVEY 2204 Griffith Dr. Champaign, IL 61820 wxobsrvr@sws.uiuc.edu Maria Peters, Weather Observer January: After a cold and snowy December,
Above normal temperatures and precipitation continue across the HSA
 NWS Form E-5 (PRES. BY NWS Instruction 10-924) MONTHLY REPORT OF HYDROLOGIC CONDITIONS HYDROLOGIC SERVICE AREA (HSA) MONTH YEAR TO: Hydrologic Information Center, W/OS31 NOAA s National Weather Service
KANSAS CLIMATE SUMMARY August 2015
 KANSAS CLIMATE SUMMARY August 2015 Cool and Dry August was drier than normal in most of the state. State-wide average precipitation was 2.80 inches or 85 percent of normal. The Northeast division of the
February 2016 Climate Summary
 Ken Scheeringa And Andy Eggert Mar 9, 2016 (765) 494-8105 http://www.iclimate.org February 2016 Climate Summary Month Summary February was the 6 th consecutive month with an above normal state average
NATIONAL WEATHER SERVICE
 NWS Form E-5 (PRES. BY NWS Instruction 10-924) MONTHLY REPORT OF HYDROLOGIC CONDITIONS HYDROLOGIC SERVICE AREA (HSA) MONTH YEAR TO: Hydrologic Information Center, W/OS31 NOAA s National Weather Service
NATIONAL WEATHER SERVICE
 NWS Form E-5 (PRES. BY NWS Instruction 10-924) MONTHLY REPORT OF HYDROLOGIC CONDITIONS HYDROLOGIC SERVICE AREA (HSA) MONTH YEAR TO: Hydrologic Information Center, W/OS31 NOAA s National Weather Service
X An X inside this box indicates that no flooding occurred within this Hydrologic Service Area.
 NWS FORM E-5 U.S. DEPARTMENT OF COMMERCE HSA OFFICE: NOAA, NATIONAL WEATHER SERVICE MONTHLY REPORT OF RIVER AND FLOOD CONDITIONS DATE: TO: North Webster, IN REPORT FOR (MONTH &YEAR): January, 2003 February
The Pennsylvania Observer
 The Pennsylvania Observer April 2, 2009 March 2009 Pennsylvania Weather Recap Prepared by Curt Harpster For the month of March the saying, In like a lion and out like a lamb really fit the pattern quite
The Weather Wire. Contents: Summer 2018 Outlook. Summer 2018 Outlook Drought Monitor May Summary/Statistics June Preview Rainfall Totals
 The Weather Wire June 2018 Volume 25 Number 6 Contents: Summer 2018 Outlook Drought Monitor May Summary/Statistics June Preview Rainfall Totals Summer 2018 Outlook June 1 st marked the first day of meteorological
How strong does wind have to be to topple a garbage can?
 How strong does wind have to be to topple a garbage can? Imagine winds powerful enough to pick up a truck and toss it the length of a football field. Winds of this extreme sometimes happen in a tornado.
Natural Disasters. in Florida. Severe Thunderstorms
 Natural Disasters in Florida SC.6.E.7.7 Investigate how natural disasters have affected human life in Florida. Severe Thunderstorms While the typical afternoon thunderstorm in Florida may not appear to
3 Severe Weather. Critical Thinking
 CHAPTER 2 3 Severe Weather SECTION Understanding Weather BEFORE YOU READ After you read this section, you should be able to answer these questions: What are some types of severe weather? How can you stay
Flood warnings were issued for the Maumee, St. Marys, Blanchard, St. Joseph (Ohio), Tippecanoe, Tiffin, Eel and Wabash Rivers on the 30 th and 31 st.
, Tippecanoe, Tiffin, Eel and Wabash Rivers on the 30 th and 31 st.") NWS FORM E-5 U.S. DEPARTMENT OF COMMERCE HSA OFFICE: NOAA, NATIONAL WEATHER SERVICE MONTHLY REPORT OF RIVER AND FLOOD CONDITIONS DATE: TO: North Webster, IN REPORT FOR (MONTH &YEAR): January 2002 February
NWS FORM E-5 U.S. DEPARTMENT OF COMMERCE HSA OFFICE: NOAA, NATIONAL WEATHER SERVICE MONTHLY REPORT OF RIVER AND FLOOD CONDITIONS DATE: TO: North Webster, IN REPORT FOR (MONTH &YEAR): January 2002 February
Champaign-Urbana 1998 Annual Weather Summary
 Champaign-Urbana 1998 Annual Weather Summary ILLINOIS STATE WATER SURVEY Audrey Bryan, Weather Observer 2204 Griffith Dr. Champaign, IL 61820 wxobsrvr@sparc.sws.uiuc.edu The development of the El Nìno
COMMUNITY EMERGENCY RESPONSE TEAM TORNADOES
 Tornadoes are powerful, circular windstorms that may be accompanied by winds in excess of 200 miles per hour. Tornadoes typically develop during severe thunderstorms and may range in width from several
UNITED STATES AND SOUTH AMERICA WEATHER ROUNDUP Sunday, December 17, 2017
 T-storm Weather Summary Extreme heat was followed by heavy rain in some key areas of Argentina yesterday. T-storms affect much of the driest Argentina, southern Brazil, and Paraguay through 7 to 10 days,
Tornadoes pose a high risk because the low atmospheric pressure, combined with high wind velocity, can:
 Tornadoes are powerful, circular windstorms that may be accompanied by winds in excess of 200 miles per hour. Tornadoes typically develop during severe thunderstorms and may range in width from several
One person killed when tornadoes hit Oklahoma, Arkansas (Update) 25 March 2015, byjustin Juozapavicius
 25 March 2015, byjustin Juozapavicius") One person killed when tornadoes hit Oklahoma, Arkansas (Update) 25 March 2015, byjustin Juozapavicius from those. A small tornado swept across parts of Moore, an Oklahoma City suburb where 24 people died
One person killed when tornadoes hit Oklahoma, Arkansas (Update) 25 March 2015, byjustin Juozapavicius from those. A small tornado swept across parts of Moore, an Oklahoma City suburb where 24 people died
The Pennsylvania Observer
 The Pennsylvania Observer May 31, 2012 May 2012 - Pennsylvania Weather Recap By: Paul Knight The majority of the fifth month had temperatures averaging well above seasonal levels with two distinct hot
The hydrologic service area (HSA) for this office covers Central Kentucky and South Central Indiana.
 for this office covers Central Kentucky and South Central Indiana.") NWS Form E-5 (04-2006) NATIONAL OCEANIC AND ATMOSPHERIC ADMINISTRATION (PRES. BY NWS Instruction 10-924) NATIONAL WEATHER SERVICE MONTHLY REPORT OF HYDROLOGIC CONDITIONS HYDROLOGIC SERVICE AREA (HSA) Louisville
NWS Form E-5 (04-2006) NATIONAL OCEANIC AND ATMOSPHERIC ADMINISTRATION (PRES. BY NWS Instruction 10-924) NATIONAL WEATHER SERVICE MONTHLY REPORT OF HYDROLOGIC CONDITIONS HYDROLOGIC SERVICE AREA (HSA) Louisville
Nebraska experienced a wide
 Issue 1 August 2016 CLIMATE UPDATE A MONTHLY SUMMARY FROM THE neclimate.unl.edu August saw reprieve from dryness, cooler temps Overview Nebraska experienced a wide range of conditions across the state
Unit 4. This unit will enable you to improve coordination and communication with State and local agencies when hazardous weather threatens.
 Unit 4 This unit will enable you to improve coordination and communication with State and local agencies when hazardous weather threatens. In this unit we will discuss the role of Emergency Managers in
Severe Winter Weather in
 Transactions of the Illinois State Academy of Science received 4/19/10 (2010), Volume 103, #3&4, pp. 131-140 accepted 9/6/10 Severe Winter Weather in 2009-2010 Stanley A. Changnon Changnon Climatologist,
Crop / Weather Update
 Crop / Weather Update Corn Crop Condition Percent of Acreage Rated Good or Excellent 85 80 75 70 65 60 55 50 45 As of September 9, USDA rates the crop at 68% good to excellent. The rating is up one point
KANSAS CLIMATE SUMMARY February 2015
 KANSAS CLIMATE SUMMARY February 2015 Extended Cold Despite some record warm readings at a few locations, February was characterized by colder than normal conditions. This was particularly true during the
The Pennsylvania Observer
 The Pennsylvania Observer August 3, 2015 July 2015 - Pennsylvania Weather Recap By: Arthur Person Although this seventh month of 2015 was fairly normal across Pennsylvania as a whole, the details reveal
Monthly Long Range Weather Commentary Issued: May 15, 2014 Steven A. Root, CCM, President/CEO
 Monthly Long Range Weather Commentary Issued: May 15, 2014 Steven A. Root, CCM, President/CEO sroot@weatherbank.com APRIL 2014 REVIEW Climate Highlights The Month in Review The average temperature for
The Pennsylvania Observer
 The Pennsylvania Observer October 1, 2015 September 2015 - Pennsylvania Weather Recap By: Quinn Lease The month of September will be remembered for its above normal temperatures and dry conditions that
Crop / Weather Update
 Crop / Weather Update Corn Crop Condition Percent of Acreage Rated Good or Excellent 85 80 75 70 65 60 55 50 45 The U.S. corn crop was rated 69% good-to-excellent on September 23, up 1% from week-ago,
Your Task: Read each slide then use the underlined red or underlined information to fill in your organizer.
 Severe Weather: Tornadoes and Hurricanes Thunderstorms and Lightning S6E4 d. Construct an explanation of the relationship between air pressure, weather fronts, and air masses and meteorological events