A Comparative Study of the National Water Model Forecast to Observed Streamflow Data
|
|
|
- Prosper Cain
- 5 years ago
- Views:
Transcription
1 A Comparative Study of the National Water Model Forecast to Observed Streamflow Data CE394K GIS in Water Resources Term Project Report Fall 2018 Leah Huling
2 Introduction As global temperatures increase, the volatility of localized weather patterns increases. Precipitation distribution becomes more severe, leading to storm and flooding events with higher frequency and greater intensity (Armel et al, 2018). In order to adapt to this change, there is a need for the scientific community to advance our methods of predicting events of high precipitation and stream flows. This would assist in preparation for large coastal storm events, such as hurricanes, as well as localized flash floods. Emergency response systems require both projected and current flooding information in order to protect the people at risk during these events. In August 2016, the National Oceanic and Atmospheric Administration (NOAA) released a new modeling system named the National Water Model (NWM) that revolutionized the precision and scope in which precipitation and streamflow in the continental United States can be predicted. The NWM uses a vast array of inputs, such as stream gages, atmospheric modeling, soil moisture content, and Radar data, to forecast the flow of rivers and streams at 2.7 million stream locations nationwide. The forecasts are classified into four categories: analysis and assimilation, short-range, medium-range, and long-range forecasts. The analysis and assimilation step in the NWM operates as an hourly snapshot of the current hydrological conditions at the time of forecast. Observed data such as meteorological radar, 8,000 USGS gages, and water monitoring from 1,506 reservoirs is forced into the algorithms to provide the most accurate estimate of current conditions. This snapshot is then used as a baseline to initialize the three other types of forecast. This study examines the accuracy of the National Water Model through a comparison to a network of stream gages outside the USGS gage network. There are currently 8,000 USGS gages and 2.7 million reach catchments within the NWM, leaving the vast majority of stream reaches without the real-time correction of stage data. Therefore, it is critical that the NWM provides acceptable estimates of stream flow, even when not forced with streamflow observations. This study focuses on the National Water Model reach within the city of Austin, Texas. The Texas Department of Transportation (TxDOT) maintains a network of 44 stream gages throughout Austin, 32 of which are located on NWM stream reaches. A sample size of 19 gages had continuous data for the target date range of January 2017 to September 2017 (Figure 1).

3 Figure 1. Network of total City of Austin gages. The gages analyzed in this study are illustrated in green. The objective of this comparison will be to analyze how the NWM performs with respect to observed flow data in stream reaches with and without USGS gages. Ultimately, this study will qualitatively and quantitatively evaluate the National Water Model within a small study area and search for methods of improving the forecasting and forcing process for the NWM.
4 Methods Data Analysis City of Austin (COA) gage data is managed by the data information company KISTERS. Matt Ables of KISTERS created a tool that performs Height Above Nearest Drainage (HAND) calculations to transform the NWM flow rate outputs into equivalent stage heights at the locations of the City of Austin gages. HAND is a method of converting flow rate data to equivalent stage heights (Nobre et al, 2011). In order to retrieve both the COA and NWM gage data, a python code was developed to perform an API call to the KISTERS database. The COA gages collect data every 15 minutes and the NWM every hour. Therefore, it was necessary to sort and select COA data from the same hourly timestamp as NWM outputs. Once the two data sources were temporally matched, the stage data could be directly compared (Figure 2-a) and compared over time (Figure 2-b). Figure 2-a. Direct comparison of observed stage height to the predicted National Water Model stage height. The trendline of the relationship indicates a positive correlation.
5 Figure 2-b. National Water Model and City of Austin stage heights over the time of study. Method of Comparison The Pearson correlation coefficient was used to measure the correlation between the National Water Model and the observed stage data. The formula is as follows: This correlation coefficient centers and standardizes the raw data points by subtracting the mean of each data set and adjusts the scales of the datasets to have equal units (Rodgers and Nicewander, 1988). This was an essential qualification for the correlation analysis of the datasets because two of the COA gages have baseline measurements above zero. This was most likely because the gages are buried in debris or something similar. By definition of the Pearson correlation coefficient, 1 is a perfectly positive correlation, -1 is a totally negative correlation, and 0 indicates no correlation. The downsides to the Pearson correlation coefficient are: 1) if neither dataset varies over the given timeframe, no coefficient is given; 2) if one dataset is zero for the given timeframe, no coefficient is given; and 3) the python application for this operation occasionally returns inf
6 Stage Height (ft) and -inf for non-ideal data. In this study, if any of these issues occurred, no correlation coefficient was applied to the return matrix. Two storm events that registered at all gage locations were chosen for correlation analysis. The first event, Storm A, was simple with one streamflow surge over the span of approximately 48 hours (Figure 3). The second storm event, Storm B was more complicated, with three defined flow surges over 6 days (Figure 4). 5 City of Austin and National Water Model Stage Heights at all Gage Locations Storm Duration Figure 3. Visual representation of Storm A duration. Data from all stage locations and both resource forms is included to characterize the total storm behavior.
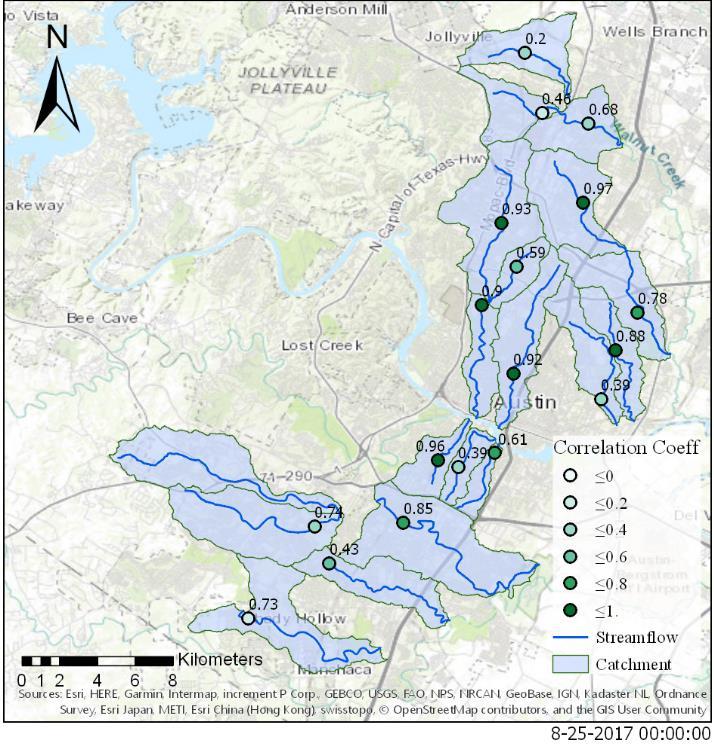
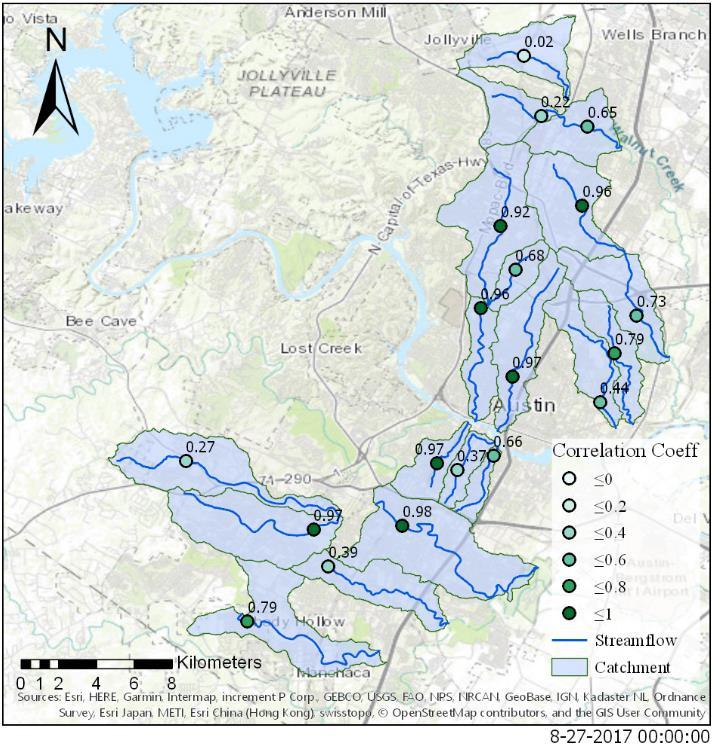
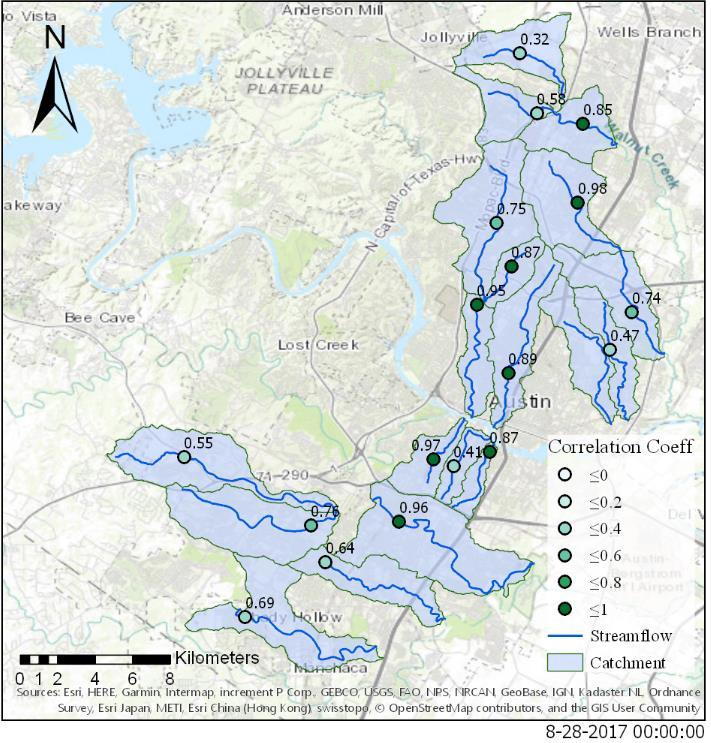
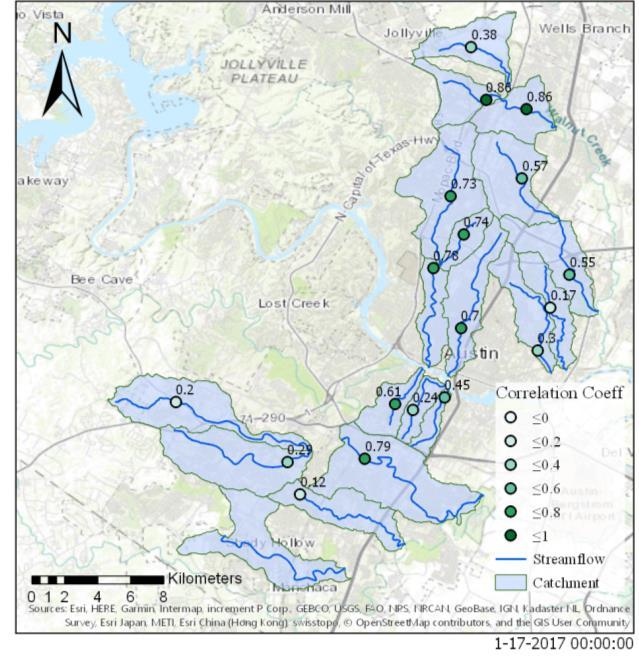
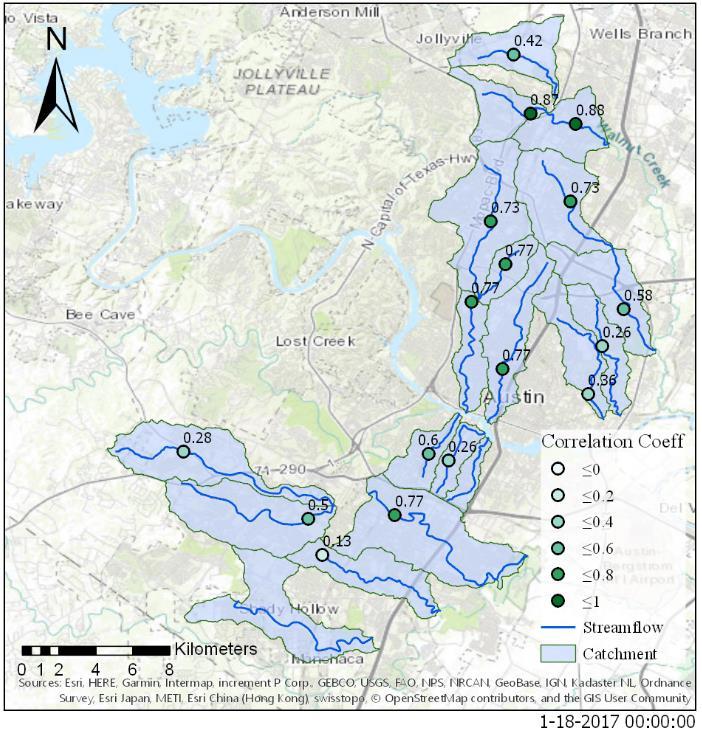
7 Figure 4. Visual representation of Storm B duration. Data from all stage locations and both resource forms is included to characterize the total storm behavior. The correlation coefficients were calculated with a 48-hour rolling window for every hour within a week of the storm events. For example, at the timestamp :00, a correlation coefficient was calculated from that point through the next 48 hours. Then the next correlation would be calculated at :00 through :00, and so on. To analyze how the National Water Model forecasts behaved both spatially and throughout the storm events, correlation coefficients were chosen at all 19 gage locations every 24 hours at the 00:00 timestamp for 5 days. For Storm A, the correlation coefficients were collected from to For Storm B, coefficients are collected from to The correlation coefficients spatial distribution is illustrated in Figures 5 and 6.
8
9 Figure 5. Example of correlation coefficient spatial distribution of Storm A through the 5 sampled timestamps.
10
11 Figure 6. Series of correlation coefficient spatial distribution of Storm B through the 5 sampled timestamps.
12 Programming Process In order to achieve these figures, the following process was implemented: 1. Python script: A storm time frame was isolated at each gage location and the correlation coefficients were calculated. An Excel spreadsheet was then generated with the stage heights and correlation coefficients. 2. Excel to Table: Excel spreadsheets containing the geographical coordinates and correlation coefficients of each gage location were imported into the GIS geodatabase. 3. XY Table to Point: Point features were created out of the coordinates of the at the gage locations. 4. Symbology: The visual representation in the GIS maps was manipulated by classifying the color and labels by the correlation coefficients for each timestamp.

13 Results General Pattern The correlation coefficients for both storms displayed a similar overall trend. The coefficients leading up to and during the storm events largely indicated a positive correlation. However, during the end of and immediately following a significant storm event, most correlation coefficients took a considerable dip in otherwise steady correlation coefficient values. In Storm A, this occurred in the timestamp and in the timestamp for Storm B. The decrease was significant, with 37% of the correlation coefficients across both storms switching to negative values. The average difference between the other 4 correlation coefficients and the one decreased value was 0.57 and 0.47 for storm A and storm B respectively. Figure 7 illustrates the discrepancies of the correlation coefficients for the three flow surges of Storm B. Figure 7. Correlation Coefficients for all City of Austin gage locations for Storm B. This clearly demonstrates the atypical behavior of the coefficients at the end of storm events. Because of this anomalous behavior, the two timestamps above were excluded from further data analysis and will be discussed in the conclusions.

14 Storm A The data for storm A was strongly positively correlated. For this simple isolated storm event 79% of all locations had an average correlation coefficient above 0.5, with a lowest average of 0.2 and greatest of Figure 8 illustrates the distribution of coefficients for each timestamp as well as the average. Figure 8. Distribution of Storm A coefficients. The results indicate a majority of the data points fall within regions of significant correlation.

15 Storm B The data for Storm B was positively correlated, but not as strongly as in Storm A. 59% of the gage locations had an average correlation coefficient above 0.5, with the lowest average of and the greatest average of Four individual correlation coefficients were less than 0. One gage location (Slaughter Creek) registered no observable increase of flow but the NWM predicted a small storm surge (Figure 9). This resulted in no correlation coefficients for the entire storm event at this location. Figure 9. Frequency distribution of correlation coefficients across the 5 timestamps and overall average coefficient values.

16 USGS stream gages There are 20 USGS stream gages within the catchments of interest for this study area. Thirteen City of Austin gages are on stream reaches that also have a USGS gage, and 5 of those have the USGS gages upstream of the COA gage. Figure 10. Spatial relationship of City of Austin gages to USGS stream gages within study area. The data indicate a positive relationship between the correlation coefficients and the presence of USGS gages. The average Pearson correlation coefficient for a COA gage with a USGS gage upstream is 0.69, with a USGS gage downstream is 0.58, and with no USGS gage on the reach is Table 1. Correlation coefficients with respect to the presence of USGS stream gages. Correlation Coefficients of locations relative to USGS gages USGS gage upstream USGS game downstream No USGS gage Storm A Storm B Average Within the upstream and downstream datasets, there was no significant correlation between the distance to a USGS gage and the coefficient value.

17 Catchment size The catchments in the study area varied from 6.82 km 2 to 26.9 km 2. To examine the relationship to the correlation coefficients within the catchments, the catchments and correlation coefficients were distributed evenly across six intervals so that an even number of observations fell within each interval (Figure 11). There was no meaningful relationship between the two variables, with the lowest average correlation coefficients frequently within the largest catchments and vice versa. Figure 11. Correlation between catchment area and Pearson Correlation Coefficient. The ranges for both variables are evenly split into six classes.
18 Conclusions The National Water Model analysis and assimilation outputs were positively correlated with observed stream flow data. The 48-hour range Pearson correlation coefficients averaged between 0.44 to 0.82 leading up to and during significant storm events. On the downhill side of the increased flows, the correlation coefficients behaved erratically. This was most likely because the trailing end of a storm is difficult to predict, and the Pearson correlation coefficient performs poorly in times of low to no flow. An example of a typical data point at no flow is a NWM forecast of 0 ft and an observational reading of 0.1 or Although the difference is physically insignificant, if the reading is repeated for a large portion of the 48 hours, the correlation coefficient formula registers a poor correlation. Further investigation into the data is needed to confirm this theory. The National Water Model more accurately estimated stream flows for a simple single storm event like Storm A. Two gage locations, Mearns Meadow Dam and West Bouldin Creek at Oltorf, registered an average correlation of The series of flow surges in Storm B registered lower correlation values. This may present an issue for prolonged storm events of multiple rain spells. Spatially, the positive correlation was greater in the central cluster of gage locations. The gages located on the peripheral edges of the study area chiefly represented the lower half of the correlation values. This could be because USGS gages are more densely located in the central area of the city. This would further vindicate the USGS relation data from Table 1 that shows COA gages with USGS gages located upstream within the same reach have an average correlation coefficient 0.22 greater than those with no USGS gages within the reach. In evaluation of the National Water Model, this study concludes that, with the exception of a few outliers, the analysis and assimilation outputs are satisfactorily correlated to physical observed data. The accuracy of the prediction suffers when no USGS stages are present to actively correct the NWM algorithms. In order to progress the National Water Model, it is proposed that in the analysis and assimilation step is forced with stream gage networks outside the USGS systems. Several major metropolitan areas maintain valuable gage network resources that are currently unutilized by the NWM. An implementation of this policy would likely increase the accuracy of all National Water Model predictions and further the overall goal of improving analysis and saving lives in emergency flood response.
19 References Armal, S., N. Devineni, and R. Khanbilvardi Trends in extreme rainfall frequency in the contiguous United States: Attribution to climate change and climate variability modes. Journal of Climate 31(1): Nobre, A. D., Cuartas, L. A., Hodnett, M., Rennó, C. D., Rodrigues, G., Silveira, A.,... Saleska, S. (2011). Height Above the Nearest Drainage - a hydrologically relevant new terrain model. Journal of Hydrology, 404(1-2), Rodgers, J; Nicewander, W. (1988). Thirteen Ways to Look at the Correlation Coefficient. The American Statistician, 42(1)
Model Calibration and Forecast Error for NFIE-Hydro
 Corey Van Dyk C E 397 Flood Forecasting 5/8/15 Model Calibration and Forecast Error for NFIE-Hydro Introduction The forecasting component of the National Flood Interoperability Experiment (NFIE), like
Leon Creek Watershed October 17-18, 1998 Rainfall Analysis Examination of USGS Gauge Helotes Creek at Helotes, Texas
 Leon Creek Watershed October 17-18, 1998 Rainfall Analysis Examination of USGS Gauge 8181400 Helotes Creek at Helotes, Texas Terrance Jackson MSCE Candidate University of Texas San Antonio Abstract The
Overview of a Changing Climate in Rhode Island
 Overview of a Changing Climate in Rhode Island David Vallee, Hydrologist in Charge, National Weather Service Northeast River Forecast Center, NOAA Lenny Giuliano, Air Quality Specialist, Rhode Island Department
USING GIS TO MODEL AND ANALYZE HISTORICAL FLOODING OF THE GUADALUPE RIVER NEAR NEW BRAUNFELS, TEXAS
 USING GIS TO MODEL AND ANALYZE HISTORICAL FLOODING OF THE GUADALUPE RIVER NEAR NEW BRAUNFELS, TEXAS ASHLEY EVANS While the state of Texas is well-known for flooding, the Guadalupe River Basin is one of
Basins-Level Heavy Rainfall and Flood Analyses
 Basins-Level Heavy Rainfall and Flood Analyses Peng Gao, Greg Carbone, and Junyu Lu Department of Geography, University of South Carolina (gaop@mailbox.sc.edu, carbone@mailbox.sc.edu, jlu@email.sc.edu)
An Overview of Operations at the West Gulf River Forecast Center Gregory Waller Service Coordination Hydrologist NWS - West Gulf River Forecast Center
 National Weather Service West Gulf River Forecast Center An Overview of Operations at the West Gulf River Forecast Center Gregory Waller Service Coordination Hydrologist NWS - West Gulf River Forecast
United States Multi-Hazard Early Warning System
 United States Multi-Hazard Early Warning System Saving Lives Through Partnership Lynn Maximuk National Weather Service Director, Central Region Kansas City, Missouri America s s Weather Enterprise: Protecting
The Hydrologic Cycle: How Do River Forecast Centers Measure the Parts?
 The Hydrologic Cycle: How Do River Forecast Centers Measure the Parts? Greg Story Meteorologist National Weather Service Fort Worth, TX Overview n Introduction What is the mission of an RFC? n The Hydrologic
Hurricane Harvey Flood Emergency Response
 Hot Science - Cool Talk # 114 Hurricane Harvey Flood Emergency Response Dr. David Maidment September 14, 2018 Produced by and for Hot Science - Cool Talks by the Environmental Science Institute. We request
Haiti and Dominican Republic Flash Flood Initial Planning Meeting
 Dr Rochelle Graham Climate Scientist Haiti and Dominican Republic Flash Flood Initial Planning Meeting September 7 th to 9 th, 2016 Hydrologic Research Center http://www.hrcwater.org Haiti and Dominican
Flooding in Western North Carolina: Some Spatial, Hydrologic, and Seasonal Characteristics CAUTION!! Outline. Basic Flood Facts.
 Flooding in Western North Carolina: Some Spatial, Hydrologic, and Seasonal Characteristics J. Greg Dobson CAUTION!! National Environmental Modeling and Analysis Center RENCI at UNC-Asheville Engagement
Presented by Jerry A. Gomez, P.E. National Hydropower Association Northeast Regional Meeting - September 17, 2009
 Presented by Jerry A. Gomez, P.E. National Hydropower Association Northeast Regional Meeting - September 17, 2009 Defining Probable Maximum Precipitation (PMP) PMP is the theoretically greatest depth of
CENTRAL TEXAS HILL COUNTRY FLOOD
 CENTRAL TEXAS HILL COUNTRY FLOOD Term project report DECEMBER 7, 2018 UNIVERSITY OF TEXAS AT AUSTIN CE394K: GIS in Water Resources Engineering RIFAAI Mohamed Talha Table of Contents Introduction... 3 Context...
Speakers: NWS Buffalo Dan Kelly and Sarah Jamison, NERFC Jeane Wallace. NWS Flood Services for the Black River Basin
 Speakers: NWS Buffalo Dan Kelly and Sarah Jamison, NERFC Jeane Wallace NWS Flood Services for the Black River Basin National Weather Service Who We Are The National Oceanic and Atmospheric Administration
An Analysis of Past River Flooding at Select National Weather Service River Forecast Locations in South Carolina
 An Analysis of Past River Flooding at Select National Weather Service River Forecast Locations in South Carolina Jeff C. Dobur AUTHOR: Sr. Hydrologist. National Oceanic and Atmospheric Administration,
Near Real-Time Runoff Estimation Using Spatially Distributed Radar Rainfall Data. Jennifer Hadley 22 April 2003
 Near Real-Time Runoff Estimation Using Spatially Distributed Radar Rainfall Data Jennifer Hadley 22 April 2003 Introduction Water availability has become a major issue in Texas in the last several years,
A Cloud-Based Flood Warning System For Forecasting Impacts to Transportation Infrastructure Systems
 A Cloud-Based Flood Warning System For Forecasting Impacts to Transportation Infrastructure Systems Jon Goodall Associate Professor, Civil and Environmental Engineering Associate Director, Link Lab April
Introduction to Weather Analytics & User Guide to ProWxAlerts. August 2017 Prepared for:
 Introduction to Weather Analytics & User Guide to ProWxAlerts August 2017 Prepared for: Weather Analytics is a leading data and analytics company based in Washington, DC and Dover, New Hampshire that offers
USGS ATLAS. BACKGROUND
 USGS ATLAS. BACKGROUND 1998. Asquith. DEPTH-DURATION FREQUENCY OF PRECIPITATION FOR TEXAS. USGS Water-Resources Investigations Report 98 4044. Defines the depth-duration frequency (DDF) of rainfall annual
Flooding in Manayunk Neighborhood of Philadelphia
 Flooding in Manayunk Neighborhood of Philadelphia Samuel Brodfuehrer GIS in Water Resources December 8, 2017 Introduction... 3 Philadelphia Overview... 3 Manayunk Overview... 4 Project Objective... 6 Methods
WMS 10.1 Tutorial GSSHA Applications Precipitation Methods in GSSHA Learn how to use different precipitation sources in GSSHA models
 v. 10.1 WMS 10.1 Tutorial GSSHA Applications Precipitation Methods in GSSHA Learn how to use different precipitation sources in GSSHA models Objectives Learn how to use several precipitation sources and
Analysis of the Sacramento Soil Moisture Accounting Model Using Variations in Precipitation Input
 Meteorology Senior Theses Undergraduate Theses and Capstone Projects 12-216 Analysis of the Sacramento Soil Moisture Accounting Model Using Variations in Precipitation Input Tyler Morrison Iowa State University,
EFFICIENCY OF THE INTEGRATED RESERVOIR OPERATION FOR FLOOD CONTROL IN THE UPPER TONE RIVER OF JAPAN CONSIDERING SPATIAL DISTRIBUTION OF RAINFALL
 EFFICIENCY OF THE INTEGRATED RESERVOIR OPERATION FOR FLOOD CONTROL IN THE UPPER TONE RIVER OF JAPAN CONSIDERING SPATIAL DISTRIBUTION OF RAINFALL Dawen YANG, Eik Chay LOW and Toshio KOIKE Department of
Height Above Nearest Drainage in Houston THE UNIVERSITY OF TEXAS AT AUSTIN
 Height Above Nearest Drainage in Houston THE UNIVERSITY OF TEXAS AT AUSTIN Jeff Yuanhe Zheng GIS in Water Resources December 2 nd, 2016 Table of Contents 1.0 Introduction... 1 2.0 Project Objective...
Talk Overview. Concepts. Climatology. Monitoring. Applications
 Atmospheric Rivers Talk Overview Concepts Climatology Monitoring Applications Satellite View Where is the storm? Where is the impact? Atmospheric Rivers Plume or fire hose of tropical moisture Heavy precipitation
A GEOGRAPHIC ASSESSMENT OF MAJOR DISASTER DECLARATIONS ACROSS THE LOWER 48 STATES
 A GEOGRAPHIC ASSESSMENT OF MAJOR DISASTER DECLARATIONS ACROSS THE LOWER 48 STATES A summary report produced by the Southern Climate Impacts Planning Program (SCIPP) Author: James Hocker Southern Climate
Areal Reduction Factors for the Colorado Front Range and Analysis of the September 2013 Colorado Storm
 Areal Reduction Factors for the Colorado Front Range and Analysis of the September 2013 Colorado Storm Doug Hultstrand, Bill Kappel, Geoff Muhlestein Applied Weather Associates, LLC - Monument, Colorado
Application of Satellite Data for Flood Forecasting and Early Warning in the Mekong River Basin in South-east Asia
 MEKONG RIVER COMMISSION Vientiane, Lao PDR Application of Satellite Data for Flood Forecasting and Early Warning in the Mekong River Basin in South-east Asia 4 th World Water Forum March 2006 Mexico City,
SAMPLE. SITE SPECIFIC WEATHER ANALYSIS Wind Report. Robinson, Smith & Walsh. John Smith. July 1, 2017 REFERENCE: 1 Maple Street, Houston, TX 77034
 SAMPLE SITE SPECIFIC WEATHER ANALYSIS Wind Report PREPARED FOR: Robinson, Smith & Walsh John Smith July 1, 2017 REFERENCE: JACK HIGGINS / 4151559-01 1 Maple Street, Houston, TX 77034 CompuWeather Sample
NATIONAL WEATHER SERVICE
 January 2016 February 9, 2016 This was a dry month across the HSA despite one large and several smaller snowfalls. Most locations ended up 1-2 inches below normal for the month. The driest locations at
The NEXRAD Revolution: Scientific Basis for Updating the HMR-49 Statistical Storm Intensities and PMPs
 The NEXRAD Revolution: Scientific Basis for Updating the HMR-49 Statistical Storm Intensities and PMPs Bill Kappel, Senior Meteorologist/President Applied Weather Associates, Monument, CO www.appliedweatherassociates.com
Water & Climate; Floods & Droughts (The yin & yang of water availablilty) Water & Climate; Floods & Droughts (The yin & yang of water availablilty)
 Water & Climate; Floods & Droughts (The yin & yang of water availablilty)") (Acknowledgment: This presentation was developed in collaboration with ESA, NEON and NCEAS, federal agencies and academic team members from minority serving institutions.) Water & Climate; Floods & Droughts
(Acknowledgment: This presentation was developed in collaboration with ESA, NEON and NCEAS, federal agencies and academic team members from minority serving institutions.) Water & Climate; Floods & Droughts
Flash Flood Guidance System On-going Enhancements
 Flash Flood Guidance System On-going Enhancements Hydrologic Research Center, USA Technical Developer SAOFFG Steering Committee Meeting 1 10-12 July 2017 Jakarta, INDONESIA Theresa M. Modrick Hansen, PhD
Development and Land Use Change in the Central Potomac River Watershed. Rebecca Posa. GIS for Water Resources, Fall 2014 University of Texas
 Development and Land Use Change in the Central Potomac River Watershed Rebecca Posa GIS for Water Resources, Fall 2014 University of Texas December 5, 2014 Table of Contents I. Introduction and Motivation..4
The Delaware Environmental Monitoring & Analysis Center
 The Delaware Environmental Monitoring & Analysis Center Tina Callahan Delaware Estuary Science & Environmental Summit 2013 January 27-30, 2013 What is DEMAC? Delaware Environmental Monitoring & Analysis
HEC & GIS Modeling of the Brushy Creek HEC & GIS Watershed Modeling of the
 HEC & GIS Modeling of the Brushy Creek HEC & GIS Watershed Modeling of the By Cassandra Fagan 5, December 2014 http://ubcwatershedstudy.ursokr.com/images/ Contents Introduction... 3 Figure 1: 24-hour rainfall
Pompton Lakes Dam Downstream Effects of the Floodgate Facility. Joseph Ruggeri Brian Cahill Michael Mak Andy Bonner
 Pompton Lakes Dam Downstream Effects of the Joseph Ruggeri Brian Cahill Michael Mak Andy Bonner ASFPM 2013: Overview Page 2 Overview Page 3 Overview Page 4 Overview Page 5 Overview - Historical Pompton
Guide to Hydrologic Information on the Web
 NOAA s National Weather Service Guide to Hydrologic Information on the Web Colorado River at Lees Ferry Photo: courtesy Tim Helble Your gateway to web resources provided through NOAA s Advanced Hydrologic
Estimating the Spatial Distribution of Power Outages during Hurricanes for Risk Management
 Estimating the Spatial Distribution of Power Outages during Hurricanes for Risk Management Marco Palmeri Independent Consultant Master s Candidate, San Francisco State University Dept. of Geography September
David R. Vallee Hydrologist-in-Charge NOAA/NWS Northeast River Forecast Center
 David R. Vallee Hydrologist-in-Charge NOAA/NWS Northeast River Forecast Center Record flooding along the Shawsheen River during the 2006 Mother s Day Floods Calibrate and implement a variety of hydrologic
Global Flash Flood Guidance System Status and Outlook
 Global Flash Flood Guidance System Status and Outlook HYDROLOGIC RESEARCH CENTER San Diego, CA 92130 http://www.hrcwater.org Initial Planning Meeting on the WMO HydroSOS, Entebbe, Uganda 26-28 September
Coastal Emergency Risks Assessment - CERA Real-Time Storm Surge and Wave Visualization Tool
 Coastal Emergency Risks Assessment - CERA Real-Time Storm Surge and Wave Visualization Tool Introduction This document provides guidance for using the Coastal Emergency Risks Assessment (CERA) visualization
Chapter 5 CALIBRATION AND VERIFICATION
 Chapter 5 CALIBRATION AND VERIFICATION This chapter contains the calibration procedure and data used for the LSC existing conditions model. The goal of the calibration effort was to develop a hydraulic
Results of Intensity-Duration- Frequency Analysis for Precipitation and Runoff under Changing Climate
 Results of Intensity-Duration- Frequency Analysis for Precipitation and Runoff under Changing Climate Supporting Casco Bay Region Climate Change Adaptation RRAP Eugene Yan, Alissa Jared, Julia Pierce,
GRAPEVINE LAKE MODELING & WATERSHED CHARACTERISTICS
 GRAPEVINE LAKE MODELING & WATERSHED CHARACTERISTICS Photo Credit: Lake Grapevine Boat Ramps Nash Mock GIS in Water Resources Fall 2016 Table of Contents Figures and Tables... 2 Introduction... 3 Objectives...
Design Storms for Hydrologic Analysis
 Design Storms for Hydrologic Analysis Course Description This course is designed to fulfill two hours of continuing education credit for Professional Engineers. Its objective is to provide students with
Areal Reduction Factors for the Colorado Front Range and Analysis of the September 2013 Colorado Storm
 Areal Reduction Factors for the Colorado Front Range and Analysis of the September 2013 Colorado Storm Doug Hultstrand, Bill Kappel, Geoff Muhlestein Applied Weather Associates, LLC - Monument, Colorado
Measures Also Significant Factors of Flood Disaster Reduction
 Non-Structual Measures Also Significant Factors of Flood Disaster Reduction Babiaková Gabriela, Leškov ková Danica Slovak Hydrometeorological Institute, Bratislava Hydrological Forecasts and Warning Department
Using ArcGIS 10 to Estimate the U.S. Population Affected by Drought
 Using ArcGIS 10 to Estimate the U.S. Population Affected by Drought Jeff Nothwehr National Drought Mitigation Center University of Nebraska-Lincoln Overview What is the U.S. Drought Monitor Mapping Process
Another 100-Year Storm. October 26, 2016 Mark Dennis, PE, CFM
 Another 100-Year Storm October 26, 2016 Mark Dennis, PE, CFM Agenda Are severe rainfall events becoming more frequent? Is there confusion about the 100-year storm that makes it seem like they happen all
NRC Workshop - Probabilistic Flood Hazard Assessment Jan 2013
 Regional Precipitation-Frequency Analysis And Extreme Storms Including PMP Current State of Understanding/Practice Mel Schaefer Ph.D. P.E. MGS Engineering Consultants, Inc. Olympia, WA NRC Workshop - Probabilistic
Ground Water Protection Council 2017 Annual Forum Boston, Massachusetts. Ben Binder (303)
") Ground Water Protection Council 2017 Annual Forum Boston, Massachusetts Protecting Groundwater Sources from Flood Borne Contamination Ben Binder (303) 860-0600 Digital Design Group, Inc. The Problem Houston
Ground Water Protection Council 2017 Annual Forum Boston, Massachusetts Protecting Groundwater Sources from Flood Borne Contamination Ben Binder (303) 860-0600 Digital Design Group, Inc. The Problem Houston
SAMPLE. SITE SPECIFIC WEATHER ANALYSIS Rainfall Report. Bevins Engineering, Inc. Susan M. Benedict. July 1, 2017 REFERENCE:
 SAMPLE SITE SPECIFIC WEATHER ANALYSIS Rainfall Report PREPARED FOR: Bevins Engineering, Inc. Susan M. Benedict July 1, 2017 REFERENCE: DUBOWSKI RESIDENCE / FILE# 11511033 1500 Water Street, Pensacola,
Moving Freshwater to the Ocean: Hydrology-Ocean Model Coupling
 Moving Freshwater to the Ocean: Hydrology-Ocean Model Coupling Cheryl Ann Blain 1, Tim Campbell 1, Song Yang 2, Aubrey Dugger 3, Paul Martin 1, Tommy Jenson 1 Naval Research Laboratory 1 Oceanography Division,
CoCoRaHS. Community Collaborative Rain, Hail, & Snow Network. Ashley Wolf Meteorologist NWS Green Bay Northeast Wisconsin CoCoRaHS Coordinator
 CoCoRaHS Community Collaborative Rain, Hail, & Snow Network Ashley Wolf Meteorologist NWS Green Bay Northeast Wisconsin CoCoRaHS Coordinator What is CoCoRaHS Who, What, Where and Whys of CoCoRaHS What?
1990 Intergovernmental Panel on Climate Change Impacts Assessment
 1990 Intergovernmental Panel on Climate Change Impacts Assessment Although the variability of weather and associated shifts in the frequency and magnitude of climate events were not available from the
D DAVID PUBLISHING. Vulnerability to Landslides in the City of Sao Paulo. 1. Introduction. 2. Methodology
 Journal of Civil Engineering and Architecture 10 (2016) 1160-1167 doi: 10.17265/1934-7359/2016.10.007 D DAVID PUBLISHING Vulnerability to Landslides in the City of Sao Paulo Letícia Palazzi Perez 1, 2
Coastal Flooding in Brevard County, Florida
 Helen Gerlach CE 394K.3 December 4, 2015 Coastal Flooding in Brevard County, Florida Introduction My project was to create a model of the coastal flooding that occurred in Brevard County, Florida in August
An overview of the applications for early warning and mapping of the flood events in New Brunswick
 Flood Recovery, Innovation and Reponse IV 239 An overview of the applications for early warning and mapping of the flood events in New Brunswick D. Mioc 1, E. McGillivray 2, F. Anton 1, M. Mezouaghi 2,
CLIMATE MODEL DOWNSCALING: HOW DOES IT WORK AND WHAT DOES IT TELL YOU?
 rhgfdjhngngfmhgmghmghjmghfmf CLIMATE MODEL DOWNSCALING: HOW DOES IT WORK AND WHAT DOES IT TELL YOU? YAN FENG, PH.D. Atmospheric and Climate Scientist Environmental Sciences Division Argonne National Laboratory
Guided Notes Weather. Part 2: Meteorology Air Masses Fronts Weather Maps Storms Storm Preparation
 Guided Notes Weather Part 2: Meteorology Air Masses Fronts Weather Maps Storms Storm Preparation The map below shows North America and its surrounding bodies of water. Country borders are shown. On the
Lecture 3. Data Sources for GIS in Water Resources
 Lecture 3 Data Sources for GIS in Water Resources GIS in Water Resources Spring 2015 http://www.data.gov/ 1 USGS GIS data for Water http://water.usgs.gov/maps.html Watersheds of the US 2-digit water resource
13.2 USING VIRTUAL GLOBES TO IMPROVE SITUATIONAL AWARENESS IN THE NATIONAL WEATHER SERVICE
 13.2 USING VIRTUAL GLOBES TO IMPROVE SITUATIONAL AWARENESS IN THE NATIONAL WEATHER SERVICE Andy Foster* National Weather Service Springfield, Missouri* Keith Stellman National Weather Service Shreveport,
RAINFALL FREQUENCY ANALYSIS FOR NEW BRAUNFELS, TX (or Seems like we ve been having lots of 100-yr storms)
") RAINFALL FREQUENCY ANALYSIS FOR NEW BRAUNFELS, TX (or Seems like we ve been having lots of 100-yr storms) Presented By: SAUL NUCCITELLI, PE, CFM (LAN) BLAKE KRONKOSKY, EIT (LAN) JIM KLEIN, PE (CITY OF
RAINFALL FREQUENCY ANALYSIS FOR NEW BRAUNFELS, TX (or Seems like we ve been having lots of 100-yr storms) Presented By: SAUL NUCCITELLI, PE, CFM (LAN) BLAKE KRONKOSKY, EIT (LAN) JIM KLEIN, PE (CITY OF
Geoprocessing Hydrometeorological Datasets to Assess National Weather Service (NWS) Forecasts
 Forecasts") Geoprocessing Hydrometeorological Datasets to Assess National Weather Service (NWS) Forecasts Jack Settelmaier National Weather Service Southern Region HQ Fort Worth, Texas ABSTRACT The National Weather
Geoprocessing Hydrometeorological Datasets to Assess National Weather Service (NWS) Forecasts Jack Settelmaier National Weather Service Southern Region HQ Fort Worth, Texas ABSTRACT The National Weather
URBAS Prediction and management of flash floods in urban areas
 URBAS Prediction and management of flash floods in urban areas 1 Thomas Einfalt, Klaus Friedeheim, Andreas Wagner Project funded by the Federal Ministry of Education and Research BMBF (Germany) as a part
Module 11: Meteorology Topic 5 Content: Weather Maps Notes
 Introduction A variety of weather maps are produced by the National Weather Service and National Oceanographic Atmospheric Administration. These maps are used to help meteorologists accurately predict
Risk Analysis for Assessment of Vegetation Impact on Outages in Electric Power Systems. T. DOKIC, P.-C. CHEN, M. KEZUNOVIC Texas A&M University USA
 21, rue d Artois, F-75008 PARIS CIGRE US National Committee http : //www.cigre.org 2016 Grid of the Future Symposium Risk Analysis for Assessment of Vegetation Impact on Outages in Electric Power Systems
A Near Real-time Flood Prediction using Hourly NEXRAD Rainfall for the State of Texas Bakkiyalakshmi Palanisamy
 A Near Real-time Flood Prediction using Hourly NEXRAD for the State of Texas Bakkiyalakshmi Palanisamy Introduction Radar derived precipitation data is becoming the driving force for hydrological modeling.
BSYSE 456/556 Surface Hydrologic Processes and Modeling
 BSYSE 456/556 Surface Hydrologic Processes and Modeling Lab 9 (Prepared by Erin Brooks and Jan Boll, UI, and Joan Wu, WSU) P Introduction One of the most difficult tasks in watershed assessment and management
FLORA: FLood estimation and forecast in complex Orographic areas for Risk mitigation in the Alpine space
 Natural Risk Management in a changing climate: Experiences in Adaptation Strategies from some European Projekts Milano - December 14 th, 2011 FLORA: FLood estimation and forecast in complex Orographic
A GIS-based Approach to Watershed Analysis in Texas Author: Allison Guettner
 Texas A&M University Zachry Department of Civil Engineering CVEN 658 Civil Engineering Applications of GIS Instructor: Dr. Francisco Olivera A GIS-based Approach to Watershed Analysis in Texas Author:
DETECTION AND FORECASTING - THE CZECH EXPERIENCE
 1 STORM RAINFALL DETECTION AND FORECASTING - THE CZECH EXPERIENCE J. Danhelka * Czech Hydrometeorological Institute, Prague, Czech Republic Abstract Contribution presents the state of the art of operational
George Mason University Department of Civil, Environmental and Infrastructure Engineering. Dr. Celso Ferreira Prepared by Lora Baumgartner
 George Mason University Department of Civil, Environmental and Infrastructure Engineering Dr. Celso Ferreira Prepared by Lora Baumgartner Exercise Topic: Downloading Spatial Data Objectives: a) Become
Laboratory Exercise #3 The Hydrologic Cycle and Running Water Processes
 Laboratory Exercise #3 The Hydrologic Cycle and Running Water Processes page - 1 Section A - The Hydrologic Cycle Figure 1 illustrates the hydrologic cycle which quantifies how water is cycled throughout
The Documentation of Extreme Hydrometeorlogical Events: Two Case Studies in Utah, Water Year 2005
 The Documentation of Extreme Hydrometeorlogical Events: Two Case Studies in Utah, Water Year 2005 Tim Bardsley1*, Mark Losleben2, Randy Julander1 1. USDA, NRCS, Snow Survey Program, Salt Lake City, Utah.
CASE STUDY #9 - Brushy Fork Dam, Sugar Grove, West Virginia
 CASE STUDY #9 - Brushy Fork Dam, Sugar Grove, West Virginia Brushy Fork Dam is a flood control structure built by the Soil Conservation Service southeast of the city of Franklin in Pendleton County, West
ENGINEERING HYDROLOGY
 ENGINEERING HYDROLOGY Prof. Rajesh Bhagat Asst. Professor Civil Engineering Department Yeshwantrao Chavan College Of Engineering Nagpur B. E. (Civil Engg.) M. Tech. (Enviro. Engg.) GCOE, Amravati VNIT,
Ed Tomlinson, PhD Bill Kappel Applied Weather Associates LLC. Tye Parzybok Metstat Inc. Bryan Rappolt Genesis Weather Solutions LLC
 Use of NEXRAD Weather Radar Data with the Storm Precipitation Analysis System (SPAS) to Provide High Spatial Resolution Hourly Rainfall Analyses for Runoff Model Calibration and Validation Ed Tomlinson,
Preparing a NFIE-Geo Database for Travis County
 Preparing a NFIE-Geo Database for Travis County By David R. Maidment Center for Research in Water Resources University of Texas at Austin 2 February 2015 Contents Introduction... 1 Step 1. Download and
TROPICAL STORM HARVEY BRIEFING
 TROPICAL STORM HARVEY BRIEFING 10:00 AM CDT Sunday, August 27, 2017 Prepared by: NWS LIX NWSNewOrleans www.weather.gov/neworleans Situation Overview New Information Tropical Storm Winds 40mph Immediate
Robert Shedd Northeast River Forecast Center National Weather Service Taunton, Massachusetts, USA
 Robert Shedd Northeast River Forecast Center National Weather Service Taunton, Massachusetts, USA Outline River Forecast Centers FEWS Implementation Status Forcing Data Ensemble Forecasting The Northeast
Badger Flood Situation Report. Robert Picco Amir Ali Khan Ken Rollings. Department of Environment Water Resources Management Division
 Badger Flood 2003 Situation Report Robert Picco Amir Ali Khan Ken Rollings Department of Environment Water Resources Management Division Table of Contents 1. Background... 1 2. Antecedent Conditions...
Comparative Analysis of Hurricane Vulnerability in New Orleans and Baton Rouge. Dr. Marc Levitan LSU Hurricane Center. April 2003
 Comparative Analysis of Hurricane Vulnerability in New Orleans and Baton Rouge Dr. Marc Levitan LSU Hurricane Center April 2003 In order to compare hurricane vulnerability of facilities located in different
RISK ASSESSMENT COMMUNITY PROFILE NATURAL HAZARDS COMMUNITY RISK PROFILES. Page 13 of 524
 RISK ASSESSMENT COMMUNITY PROFILE NATURAL HAZARDS COMMUNITY RISK PROFILES Page 13 of 524 Introduction The Risk Assessment identifies and characterizes Tillamook County s natural hazards and describes how
Due: Monday November 26 th LAB 7: Rivers and Flood Frequency
 1 12.001 Due: Monday November 26 th LAB 7: Rivers and Flood Frequency Overview and Objectives This exercise will provide some hands-on experience with methods used for predicting flood frequency and magnitude.
CLIMATE READY BOSTON. Climate Projections Consensus ADAPTED FROM THE BOSTON RESEARCH ADVISORY GROUP REPORT MAY 2016
 CLIMATE READY BOSTON Sasaki Steering Committee Meeting, March 28 nd, 2016 Climate Projections Consensus ADAPTED FROM THE BOSTON RESEARCH ADVISORY GROUP REPORT MAY 2016 WHAT S IN STORE FOR BOSTON S CLIMATE?
WEATHER FORECASTING Acquisition of Weather Information WFO Regions Weather Forecasting Tools Weather Forecasting Tools Weather Forecasting Methods
 1 2 3 4 5 6 7 8 WEATHER FORECASTING Chapter 13 Acquisition of Weather Information 10,000 land-based stations, hundreds of ships and buoys; four times a day, airports hourly Upper level: radiosonde, aircraft,
Impact assessment on disasters
 The 5th International Coordination Group (ICG) Meeting GEOSS Asian Water Cycle Initiative (AWCI), Dec. 16, 2009. Impact assessment on disasters Eiichi Nakakita Disaster Prevention Research Institute Kyoto
Hydrologic Overview & Quantities
 Hydrologic Overview & Quantities It is important to understand the big picture when attempting to forecast. This includes the interactive components and hydrologic quantities. Hydrologic Cycle The complexity
NWS Mission 5/25/2017. Innovations in Flood Forecasting at the National Weather Service West Gulf River Forecast Center
 Innovations in Flood Forecasting at the National Weather Service West Gulf River Forecast Center Kris Lander, PE, CFM Gregory Waller NWS West Gulf River Forecast Center NWS Mission To provide weather,
Spatiotemporal Variation of Extreme Rainfall Events in Greater New York Area
 1 Spatiotemporal Variation of Extreme Rainfall Events in Greater New York Area Ali Hamidi, CCNY, NOAA-CREST Naresh Devineni, CCNY, NOAA-CREST James F. Booth, CCNY, NOAA-CREST Ralph R. Ferraro, NOAA STAR,
Improving Reservoir Management Using the Storm Precipitation Analysis System (SPAS) and NEXRAD Weather Radar
 and NEXRAD Weather Radar") Improving Reservoir Management Using the Storm Precipitation Analysis System (SPAS) and NEXRAD Weather Radar Bill D. Kappel, Applied Weather Associates, LLC, Monument, CO Edward M. Tomlinson, Ph.D., Applied
Improving Reservoir Management Using the Storm Precipitation Analysis System (SPAS) and NEXRAD Weather Radar Bill D. Kappel, Applied Weather Associates, LLC, Monument, CO Edward M. Tomlinson, Ph.D., Applied
SAMPLE. SITE SPECIFIC WEATHER ANALYSIS Wind Report. Robinson, Smith & Walsh. John Smith REFERENCE:
 SAMPLE SITE SPECIFIC WEATHER ANALYSIS Wind Report PREPARED FOR: Robinson, Smith & Walsh John Smith REFERENCE: JACK HIGGINS / 4151559-01 CompuWeather Sample Report Please note that this report contains
2017 rainfall by zip code
 Search Search pages & people Search Search Search pages & people Search 2017 rainfall by zip code Monthly Rainfall Analysis. Weather.gov > Wakefield, VA > Monthly Rainfall Analysis. MONTHLY RAINFALL ANALYSIS
RHOAPS. Real-time Hydrology Ocean Atmosphere Prediction System. Pronunciation: Ropes Motto: More than just THREDDS
 RHOAPS Real-time Hydrology Ocean Atmosphere Prediction System Pronunciation: Ropes Motto: More than just THREDDS Key Aspects Integrated real-time data systems Atmospheric Hydrologic Coastal oceans Societal
Unraveling the Mysteries of Seismicity in Oklahoma. A Story Map
 Unraveling the Mysteries of Seismicity in Oklahoma A Story Map Background Why create a story map? Visualization of various types of data (graphics, text, symbols, etc.) within a geographical context to
At the start of the talk will be a trivia question. Be prepared to write your answer.
 Operational hydrometeorological forecasting activities of the Australian Bureau of Meteorology Thomas Pagano At the start of the talk will be a trivia question. Be prepared to write your answer. http://scottbridle.com/
The Beleaguered Figure 15
 The Beleaguered Figure 15 TFMA 2015 Fall Technical Summit After the Floods: Texas Rising Craig Loftin, PE, CFM US Weather Bureau Technical Paper No. 40, Figure 15 Village Creek Watershed 1 100-Year 30-Minute
The Beleaguered Figure 15 TFMA 2015 Fall Technical Summit After the Floods: Texas Rising
 The Beleaguered Figure 15 TFMA 2015 Fall Technical Summit After the Floods: Texas Rising Craig Loftin, PE, CFM US Weather Bureau Technical Paper No. 40, Figure 15 Village Creek Watershed 100-Year 30-Minute