Lecture 3. Data Sources for GIS in Water Resources
|
|
|
- Clyde May
- 6 years ago
- Views:
Transcription


1 Lecture 3 Data Sources for GIS in Water Resources GIS in Water Resources Spring


2 USGS GIS data for Water Watersheds of the US 2-digit water resource regions 8-digit HUC watersheds Region 01 New England Region 02 Mid-Atlantic Region 03 South Atlantic-Gulf Region 04 Great Lakes Region 05 Ohio Region 06 Tennessee Region 07 Upper Mississippi Region 08 Lower Mississippi Region 09 Souris-Red-Rainy Region 10 Missouri Region 11 Arkansas-White-Red Region 12 Texas-Gulf Region 13 Rio Grande Region 14 Upper Colorado Region 15 Lower Colorado Region 16 Great Basin Region 17 Pacific Northwest Region 18 California Region 19 Alaska (Old numbering system) Region 20 Hawaii Region 21 Caribbea 2
3 Hydrologic Unit Code Watersheds ~ 2000 for US, about the size of counties Region 02 Mid-Atlantic Region -- The drainage within the United States that ultimately discharges into: (a) the Atlantic Ocean within and between the states of New York and Virginia; (b) Long Island Sound south of the New York-Connecticut State Line; and (c) the Riviere Richelieu, a tributary of the St. Lawrence River. Includes all of Delaware and New Jersey and the District of Columbia, and parts of Connecticut, Maryland, Massachusetts, New York, Pennsylvania, Vermont, Virginia, and West Virginia. Subregion Richelieu: The Riviere Richelieu Basin, including Lake Champlain drainage, within the United States. New York, Vermont. Area = 7720 sq.mi. Accounting Unit Richelieu. New York, Vermont. Area = 7720 sq.mi. Cataloging Units Lake George. New York, Vermont. Area = 1390 sq.mi Otter. Vermont. Area = 1090 sq.mi Winooski. Vermont. Area = 1220 sq.mi Ausable. New York. Area = 1070 sq.mi Lamoille. Vermont. Area = 1130 sq.mi Great Chazy-Saranac. New York. Area = 1110 sq.mi Missisquoi. Vermont. Area = 707 sq.mi. Hydrologic Unit Code (8-Digit) Watersheds ~ 2000 for US, about the size of counties 3


4 HUCode (8-Digit) Watersheds Watershed Hierarchy Region Sub-Region Accounting U Catalouging U WaterShed Sub-WaterShed Digit # HUC 10 NHDPlus 12 Available In Progress 4

")


5 Watershed Boundary Dataset National Program by USGS and USDA (NRCS) Boundaries for 10- and 12- digit watersheds First cut is by automated delineation from NED Hand checked and edited 10-digit watersheds Watershed Boundary DataSet 5


6 WBD for Nebraska 2990 HUC12 watersheds of average area 39.3 square miles HUC12:HUC8 ~ 40:1 watersheds EPA River Reach File 1 (RF1) 6


7 River networks for 8-digit HUC watersheds 7
8 Lower West Fork, Trinity River Basin HUC = NHD River Reaches 412 River Reaches In Upper West Fork of Trinity Basin 8

9 River Reach Codes Used for river address locations ReachCode = ReachCode = HUC# Segment# Location on Reach


10 NHDPlus for a Portion of Oregon NHDPlus Reach Catchments ~ 3km 2 Average reach length = 2km 2.3 million reaches for continental US About 1000 reach catchments in each 8-digit HUC 10

 1/3 arc-second (10m)")

11 NHDPlus Reach Attributes Slope Elevation Mean annual flow Corresponding velocity Drainage area % of upstream drainage area in different land uses Stream order National Elevation Dataset Digital Elevation Model with 1 arc-second (30m) 1/3 arc-second (10m) 1/9 arc-second (3m) limited Seamless in 1 blocks for the United States 10 billion data Derived from USGS 1:24,000 quadrangle sheets Get the data: 11
 720 720 Contours 740")

12 Digital Elevation Model (DEM) Contours Austin West 30 Meter DEM 12

13 Eight Direction Pour Point Model Water flows in the direction of steepest descent Flow Direction Grid


14 Delineation of Streams and Watersheds on a DEM 14

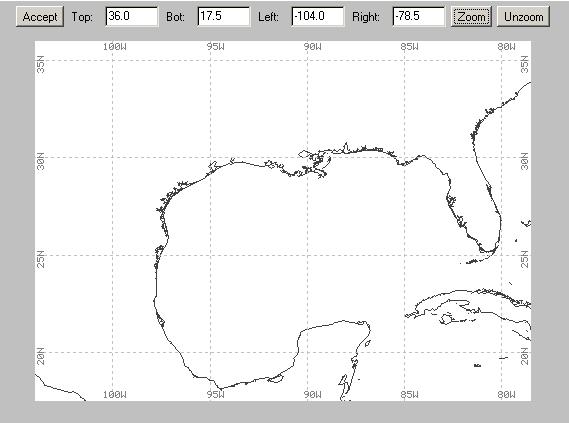
15 1:250,000 Scale Soil Information 15


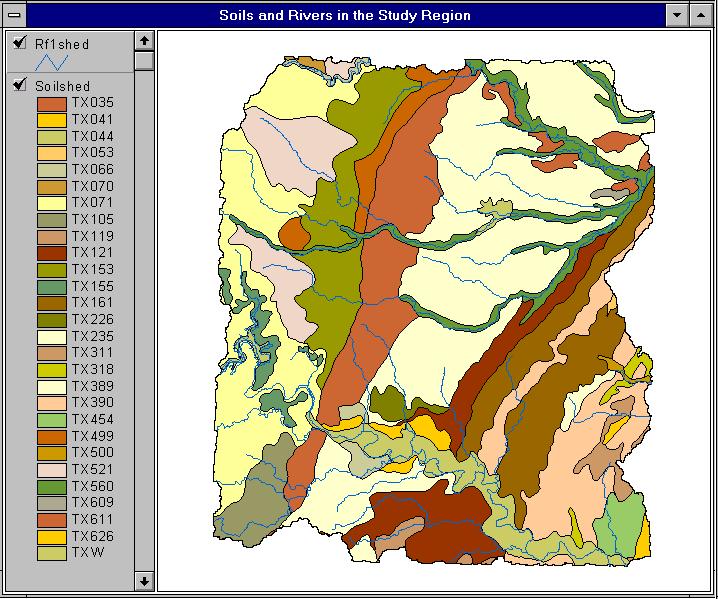
16 SSURGO: County Level Digital Soil Maps 1:24,000 scale soil information Ssurgo for Travis County 103 soil map units described by 7530 polygons of average area ha (87 acres) 16

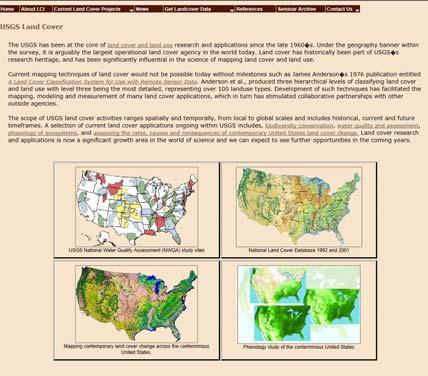
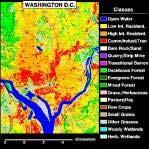
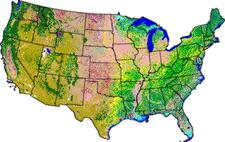
17 National Land Cover Dataset Get the data: 17
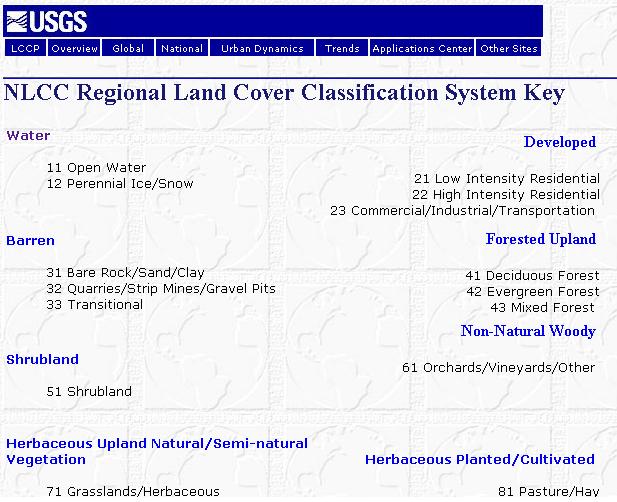

18 18


19 PRISM Mean Annual Precipitation 19
 ** at 2 meters above the surface 2 - specific humidity (kg/kg) ** at 2 meters above the surface 3 - surface pressure (Pa) ** 4 - U")
: from NARR 9 - potential evaporation (kg/m^2): from NARR 10 - precipitation hourly total")
20 NLDAS_DATA National Land Data Assimilation System Spatial Resolution: 1/8 degree Temporal Resol.: hourly 1 - air temperature (K) ** at 2 meters above the surface 2 - specific humidity (kg/kg) ** at 2 meters above the surface 3 - surface pressure (Pa) ** 4 - U wind component (m/s) at 10 meters above the surface 5 - V wind component (m/s) at 10 meters above the surface 6 - surface downward longwave radiation (W/m^2) ** 7 - undefined 8 - CAPE: Convective Available Potential Energy (J/kg): from NARR 9 - potential evaporation (kg/m^2): from NARR 10 - precipitation hourly total (kg/m^2) 11 - surface downward shortwave radiation 20


21 GLDAS_DATA Global Land Data Assimilation System National Weather Service River Forecast Centers Spatial Resolution: 4*4 km Temporal Resol.: daily hourly under way Get Data: / 21


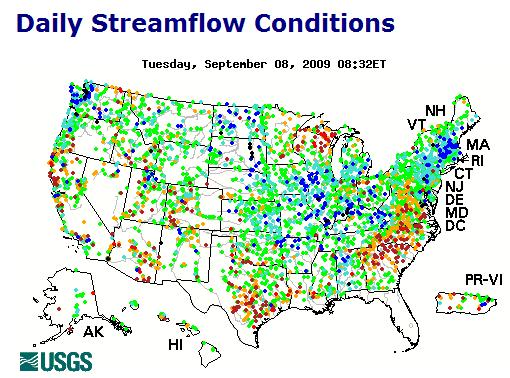
22 National Water Information System Web access to USGS water resources data in real time USGS Water Watch Web access to USGS water resources data in real time 22


23 USGS National Water Information System. Real-time and Historic Data Streamflow and stage Groundwater levels Water Quality Site information Tabular or Graphical Format The Shuttle Radar Topography Mission (SRTM) obtained elevation data on a nearglobal scale to generate the most complete highresolution digital topographic database of Earth. 23

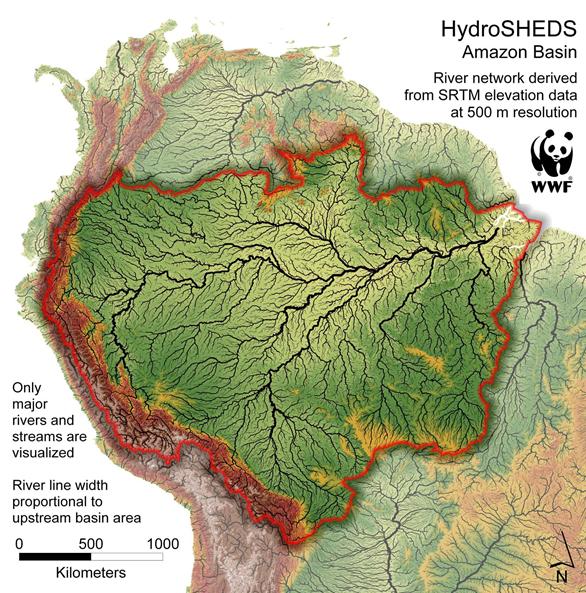
24 HydroSheds derived from SRTM 24


25 1:10,000,000 scale vector data for the world GTOPO30-1 km Digital Elevation Model of the Earth 25

26 Drainage in North America Hydro1K is derived from GTOPO30 using raster GIS analysis NASA Satellite Data 26


27 Global Energy and Water Experiment


28 National Map in New York 28
What s New in Topographic Information - USGS National Map
 + What s New in Topographic Information - USGS National Map SARGIS Workshop November 14, 2016 Rob Dollison, 703-648-5724 rdollison@usgs.gov + USGS 2 National Geospatial Program The National Geospatial
Overview of Data for CREST Model
 Overview of Data for CREST Model Xianwu Xue April 2 nd 2012 CREST V2.0 CREST V2.0 Real-Time Mode Forcasting Mode Data Assimilation Precipitation PET DEM, FDR, FAC, Slope Observed Discharge a-priori parameter
Catchment modelling using PIHMgis By Harish Sangireddy The University of Texas at Austin
 Catchment modelling using PIHMgis By Harish Sangireddy The University of Texas at Austin Contents Goals:... 2 Introduction:... 2 PIHM and contribution to the NFIE hydro... 2 Study Site: Onion Creek...
USGS Hydrography Overview. May 9, 2018
 + 1 USGS Hydrography Overview May 9, 2018 + 2 The National Geospatial Program Provides the geospatial baseline of the Nation s topography, natural landscape and built environment through The National Map,
GRAPEVINE LAKE MODELING & WATERSHED CHARACTERISTICS
 GRAPEVINE LAKE MODELING & WATERSHED CHARACTERISTICS Photo Credit: Lake Grapevine Boat Ramps Nash Mock GIS in Water Resources Fall 2016 Table of Contents Figures and Tables... 2 Introduction... 3 Objectives...
ENGRG Introduction to GIS
 ENGRG 59910 Introduction to GIS Michael Piasecki November 17, 2017 Lecture 11: Terrain Analysis Outline: Terrain Analysis Earth Surface Representation Contour TIN Mass Points Digital Elevation Models Slope
Designing a Dam for Blockhouse Ranch. Haley Born
 Designing a Dam for Blockhouse Ranch Haley Born CE 394K GIS in Water Resources Term Paper Fall 2011 Table of Contents Introduction... 1 Data Sources... 2 Precipitation Data... 2 Elevation Data... 3 Geographic
ENGRG Introduction to GIS
 ENGRG 59910 Introduction to GIS Michael Piasecki March 17, 2014 Lecture 08: Terrain Analysis Outline: Terrain Analysis Earth Surface Representation Contour TIN Mass Points Digital Elevation Models Slope
Hourly Precipitation Data Documentation (text and csv version) February 2016
 February 2016") I. Description Hourly Precipitation Data Documentation (text and csv version) February 2016 Hourly Precipitation Data (labeled Precipitation Hourly in Climate Data Online system) is a database that gives
I. Description Hourly Precipitation Data Documentation (text and csv version) February 2016 Hourly Precipitation Data (labeled Precipitation Hourly in Climate Data Online system) is a database that gives
USING IFSAR AND SRTM ELEVATION DATA FOR WATERSHED DELINEATION OF A COASTAL WATERSHED INTRODUCTION
 USING AND SRTM ELEVATION DATA FOR WATERSHED DELINEATION OF A COASTAL WATERSHED Vladimir J. Alarcon, Research Associate Chuck O Hara, Research Professor GeoResources Institute Mississippi State University
Correction to Spatial and temporal distributions of U.S. winds and wind power at 80 m derived from measurements
 JOURNAL OF GEOPHYSICAL RESEARCH, VOL. 109,, doi:10.1029/2004jd005099, 2004 Correction to Spatial and temporal distributions of U.S. winds and wind power at 80 m derived from measurements Cristina L. Archer
USING GIS TO MODEL AND ANALYZE HISTORICAL FLOODING OF THE GUADALUPE RIVER NEAR NEW BRAUNFELS, TEXAS
 USING GIS TO MODEL AND ANALYZE HISTORICAL FLOODING OF THE GUADALUPE RIVER NEAR NEW BRAUNFELS, TEXAS ASHLEY EVANS While the state of Texas is well-known for flooding, the Guadalupe River Basin is one of
Using ArcGIS for Hydrology and Watershed Analysis:
 Using ArcGIS 10.2.2 for Hydrology and Watershed Analysis: A guide for running hydrologic analysis using elevation and a suite of ArcGIS tools Anna Nakae Feb. 10, 2015 Introduction Hydrology and watershed
Remote Sensing and GIS Applications for Hilly Watersheds SUBASHISA DUTTA DEPARTMENT OF CIVIL ENGINEERING IIT GUWAHATI
 Remote Sensing and GIS Applications for Hilly Watersheds SUBASHISA DUTTA DEPARTMENT OF CIVIL ENGINEERING IIT GUWAHATI Deciding Alternative Land Use Options in a Watershed Using GIS Source: Anita Prakash
THE ROLE OF GEOCOMPUTATION IN THE HYDROLOGICAL SCIENCES
 INTERNATIONAL SYMPOSIUM ON GEOCOMPUTATION AND ANALYSIS THE ROLE OF GEOCOMPUTATION IN THE HYDROLOGICAL SCIENCES JOHN P. WILSON UNIVERSITY OF SOUTHERN CALIFORNIA GIS RESEARCH LABORATORY Outline Background
Development and Land Use Change in the Central Potomac River Watershed. Rebecca Posa. GIS for Water Resources, Fall 2014 University of Texas
 Development and Land Use Change in the Central Potomac River Watershed Rebecca Posa GIS for Water Resources, Fall 2014 University of Texas December 5, 2014 Table of Contents I. Introduction and Motivation..4
Technical Report Documentation Page
 1. Report No. 2. Government Accession No. 3. Recipient's Catalog No. FHW A!TX-98/1738-2 4. Title and Subtitle 5. Report Date DIGITAL SPATIAL DATA OF TEXAS: AN INTERNET AND August 1997 LITERATURE REVIEW
Hydrologically Consistent Pruning of the High- Resolution National Hydrography Dataset to 1:24,000-scale
 Hydrologically Consistent Pruning of the High- Resolution National Hydrography Dataset to 1:24,000-scale Lawrence V. Stanislawski 1, Ariel Doumbouya 2, Barbara P. Buttenfield 3, 1 Center for Excellence
A GIS View of Hydrology
 Quantitative Elements of Hydrology A GIS View of Hydrology Contact information: Jack Hermance Environmental Geophysics/Hydrology Department of Geological Sciences Brown University, Providence, RI 02912-1846
A Simple Drainage Enforcement Procedure for Estimating Catchment Area Using DEM Data
 A Simple Drainage Enforcement Procedure for Estimating Catchment Area Using DEM Data David Nagel, John M. Buffington, and Charles Luce U.S. Forest Service, Rocky Mountain Research Station Boise Aquatic
Summary of Natural Hazard Statistics for 2008 in the United States
 Summary of Natural Hazard Statistics for 2008 in the United States This National Weather Service (NWS) report summarizes fatalities, injuries and damages caused by severe weather in 2008. The NWS Office
George Mason University Department of Civil, Environmental and Infrastructure Engineering. Dr. Celso Ferreira Prepared by Lora Baumgartner
 George Mason University Department of Civil, Environmental and Infrastructure Engineering Dr. Celso Ferreira Prepared by Lora Baumgartner Exercise Topic: Downloading Spatial Data Objectives: a) Become
USGS National Hydrography Dataset (NHD) and NHDPlus
 and NHDPlus") + 1 + USGS National Hydrography Dataset (NHD) and NHDPlus Al Rea USGS National Geospatial Program Western States Water Council August 1, 2018 + 2 USGS National Hydrography Datasets Hydrologic networks,
+ 1 + USGS National Hydrography Dataset (NHD) and NHDPlus Al Rea USGS National Geospatial Program Western States Water Council August 1, 2018 + 2 USGS National Hydrography Datasets Hydrologic networks,
MODULE 7 LECTURE NOTES 5 DRAINAGE PATTERN AND CATCHMENT AREA DELINEATION
 MODULE 7 LECTURE NOTES 5 DRAINAGE PATTERN AND CATCHMENT AREA DELINEATION 1. Introduction Topography of the river basin plays an important role in hydrologic modelling, by providing information on different
Utility of National Spatial Data for Conservation Design Projects
 Utility of National Spatial Data for Conservation Design Projects Steve Williams Biodiversity and Spatial Information Center North Carolina State University PIF CDW St. Louis, MO April 11, 2006 Types of
A GIS-based Approach to Watershed Analysis in Texas Author: Allison Guettner
 Texas A&M University Zachry Department of Civil Engineering CVEN 658 Civil Engineering Applications of GIS Instructor: Dr. Francisco Olivera A GIS-based Approach to Watershed Analysis in Texas Author:
VIC Hydrology Model Training Workshop Part II: Building a model
 VIC Hydrology Model Training Workshop Part II: Building a model 11-12 Oct 2011 Centro de Cambio Global Pontificia Universidad Católica de Chile Ed Maurer Civil Engineering Department Santa Clara University
4. GIS Implementation of the TxDOT Hydrology Extensions
 4. GIS Implementation of the TxDOT Hydrology Extensions A Geographic Information System (GIS) is a computer-assisted system for the capture, storage, retrieval, analysis and display of spatial data. It
A. Geography Students know the location of places, geographic features, and patterns of the environment.
 Learning Targets Elementary Social Studies Grade 5 2014-2015 A. Geography Students know the location of places, geographic features, and patterns of the environment. A.5.1. A.5.2. A.5.3. A.5.4. Label North
Near Real-Time Runoff Estimation Using Spatially Distributed Radar Rainfall Data. Jennifer Hadley 22 April 2003
 Near Real-Time Runoff Estimation Using Spatially Distributed Radar Rainfall Data Jennifer Hadley 22 April 2003 Introduction Water availability has become a major issue in Texas in the last several years,
BSYSE 456/556 Surface Hydrologic Processes and Modeling
 BSYSE 456/556 Surface Hydrologic Processes and Modeling Lab 9 (Prepared by Erin Brooks and Jan Boll, UI, and Joan Wu, WSU) P Introduction One of the most difficult tasks in watershed assessment and management
River Modeling as Big as Texas. Cédric H. David David R. Maidment, Zong-Liang Yang
 River Modeling as Big as Texas Cédric H. David David R. Maidment, Zong-Liang Yang First Water Forum Austin, TX 13 February 2012 1 Atmospheric modeling Equations of fluid mechanics and thermodynamics of
Figure 0-18: Dendrogeomorphic analysis of streambank erosion and floodplain deposition (from Noe and others, 2015a)
") Appendix 9A: Stream to River During the development of the Phase 6 Watershed Model, multiple methods for determining coefficients were often attempted. In some cases, the methods are averaged or otherwise
Appendix 9A: Stream to River During the development of the Phase 6 Watershed Model, multiple methods for determining coefficients were often attempted. In some cases, the methods are averaged or otherwise
Creating Watersheds and Stream Networks. Steve Kopp
 Creating Watersheds and Stream Networks Steve Kopp Workshop Overview Demo Data Understanding the tools Elevation Data Types DEM : Digital Elevation Model bare Earth DSM : Digital Surface Model Data Structure
Lidar-derived Hydrography as a Source for the National Hydrography Dataset
 Lidar-derived Hydrography as a Source for the National Hydrography Dataset Lidar-Derived Hydrography, Bathymetry, and Topobathymetry in the National Hydrography Dataset and 3-Dimensional Elevation Program
Standard Indicator That s the Latitude! Students will use latitude and longitude to locate places in Indiana and other parts of the world.
 Standard Indicator 4.3.1 That s the Latitude! Purpose Students will use latitude and longitude to locate places in Indiana and other parts of the world. Materials For the teacher: graph paper, globe showing
4.5 Comparison of weather data from the Remote Automated Weather Station network and the North American Regional Reanalysis
 4.5 Comparison of weather data from the Remote Automated Weather Station network and the North American Regional Reanalysis Beth L. Hall and Timothy. J. Brown DRI, Reno, NV ABSTRACT. The North American
Hydrologic and Hydraulic Analyses Using ArcGIS
 Hydrologic and Hydraulic Analyses Using ArcGIS Two day training class Overview ArcGIS and Arc Hydro provide strong foundation for support of hydrologic and hydraulic (H&H) analyses. This two-day course
RHOAPS. Real-time Hydrology Ocean Atmosphere Prediction System. Pronunciation: Ropes Motto: More than just THREDDS
 RHOAPS Real-time Hydrology Ocean Atmosphere Prediction System Pronunciation: Ropes Motto: More than just THREDDS Key Aspects Integrated real-time data systems Atmospheric Hydrologic Coastal oceans Societal
used to transport sediments throughout the lands. In this regard, understanding erosion is
 David Rounce GIS in Water Resources 11/23/2010 Erosion Potential in Travis County INTRODUCTION Erosion has played a vital role in the morphology of the Earth as its processes have been used to transport
NAVAJO NATION PROFILE
 NAVAJO NATION PROFILE Largest land based area and federally recognized tribe in the United States Over 27,000 square miles (or 17.2 million acres with a population of over 300,000 people. Covers Arizona,
Digital Elevation Models. Using elevation data in raster format in a GIS
 Digital Elevation Models Using elevation data in raster format in a GIS What is a Digital Elevation Model (DEM)? Digital representation of topography Model based on scale of original data Commonly a raster
Model Calibration and Forecast Error for NFIE-Hydro
 Corey Van Dyk C E 397 Flood Forecasting 5/8/15 Model Calibration and Forecast Error for NFIE-Hydro Introduction The forecasting component of the National Flood Interoperability Experiment (NFIE), like
GIS in Water Resources Midterm Exam Fall 2008 There are 4 questions on this exam. Please do all 4.
 Page 1 of 8 Name: GIS in Water Resources Midterm Exam Fall 2008 There are 4 questions on this exam. Please do all 4. 1. Basic Concepts [20 points] Find the letter with the best answer for each term: 1.
3D Elevation Program- Status and Updates. Oklahoma GI Council Meeting November 2, 2018 Claire DeVaughan US Geological Survey
 + 1 3D Elevation Program- Status and Updates Oklahoma GI Council Meeting November 2, 2018 Claire DeVaughan US Geological Survey + 2 3D Elevation Program (3DEP) Goals Complete acquisition in 8 years Address
Watershed Delineation
 Foundations of Physical Hydrology Watershed Delineation Contact information: Jack Hermance Environmental Geophysics/Hydrology Department of Geological Sciences Brown University, Providence, RI 02912-1846
A Comparison of Manual and Computer-Assisted Drainage Delineation Methods for Hydrologic-Unit Map Development
 This paper was peer-reviewed for scientific content. Pages 1118-1127. In: D.E. Stott, R.H. Mohtar and G.C. Steinhardt (eds). 2001. Sustaining the Global Farm. Selected papers from the 10th International
Delineation of the Watersheds Basin in the Konya City and Modelling by Geographical Information System
 Delineation of the Watersheds Basin in the Konya City and Modelling by Geographical Information System Nahida Hameed Hamza Alqaysi a,b,, Mushtaq Abdulameer Alwan Almuslehi a a Environmental Engineering
Cooperative Program Allocation Budget Receipts Southern Baptist Convention Executive Committee May 2018
 Cooperative Program Allocation Budget Receipts May 2018 Cooperative Program Allocation Budget Current Current $ Change % Change Month Month from from Contribution Sources 2017-2018 2016-2017 Prior Year
Cooperative Program Allocation Budget Receipts Southern Baptist Convention Executive Committee October 2017
 Cooperative Program Allocation Budget Receipts October 2017 Cooperative Program Allocation Budget Current Current $ Change % Change Month Month from from Contribution Sources 2017-2018 2016-2017 Prior
Cooperative Program Allocation Budget Receipts Southern Baptist Convention Executive Committee October 2018
 Cooperative Program Allocation Budget Receipts October 2018 Cooperative Program Allocation Budget Current Current $ Change % Change Month Month from from Contribution Sources 2018-2019 2017-2018 Prior
A Near Real-time Flood Prediction using Hourly NEXRAD Rainfall for the State of Texas Bakkiyalakshmi Palanisamy
 A Near Real-time Flood Prediction using Hourly NEXRAD for the State of Texas Bakkiyalakshmi Palanisamy Introduction Radar derived precipitation data is becoming the driving force for hydrological modeling.
Using PRISM Climate Grids and GIS for Extreme Precipitation Mapping
 Using PRISM Climate Grids and GIS for Extreme Precipitation Mapping George H. Taylor, State Climatologist Oregon Climate Service 316 Strand Ag Hall Oregon State University Corvallis OR 97331-2209 Tel:
Basin characteristics
 Basin characteristics From hydrological processes at the point scale to hydrological processes throughout the space continuum: point scale à river basin The watershed characteristics (shape, length, topography,
Preparing a NFIE-Geo Database for Travis County
 Preparing a NFIE-Geo Database for Travis County By David R. Maidment Center for Research in Water Resources University of Texas at Austin 2 February 2015 Contents Introduction... 1 Step 1. Download and
Hydrologic Modelling of the Upper Malaprabha Catchment using ArcView SWAT
 Hydrologic Modelling of the Upper Malaprabha Catchment using ArcView SWAT Technical briefs are short summaries of the models used in the project aimed at nontechnical readers. The aim of the PES India
The National Hydrography Dataset in the Pacific Region. U.S. Department of the Interior U.S. Geological Survey
 The National Hydrography Dataset in the Pacific Region U.S. Department of the Interior U.S. Geological Survey The National Map The National Map is built on partnerships and standards The National Map consists
The Global Width Database for Large Rivers. (GWD-LR) version 1.2
 version 1.2") GWD-LR ver1.2 August 2014 1 2 The Global Width Database for Large Rivers (GWD-LR) version 1.2 3 4 5 Dai Yamazaki JAMSTEC Japan Agency for Marine Earth Science and Technology d-yamazaki@jamstec.go.jp 6
GWD-LR ver1.2 August 2014 1 2 The Global Width Database for Large Rivers (GWD-LR) version 1.2 3 4 5 Dai Yamazaki JAMSTEC Japan Agency for Marine Earth Science and Technology d-yamazaki@jamstec.go.jp 6
Focus Areas. Colorado Rio Grande Jemez. San Pedro. An NSF Science and Technology Center SAHRA
 Focus Areas 1 San Pedro Colorado Rio Grande Jemez Geo-database Structure 2 SGB Schemas Upper Rio Grande Research Data Flux Tower Data Public Data Hydrology Rules, Users and Procedures Jemez River Colorado
NCTCOG GIS File Locations
 Boundaries Area Codes k:\bnd\region\area_codes.shp Area Type k:\bnd\region\areatype.shp Ciry Centroids (World) k:\bnd\usa_world\cities.shp City Centroids (NCTCOG Region) k:\bnd\region\city_point.shp vector.vector.bnd_city_point
Notes to project: Conflict and cooperation over shared water resources
 Notes to project: Conflict and cooperation over shared water resources Jan Ketil Rød Department of geography, NTNU jan.rod@svt.ntnu.no Version: 30/06/2006 Abstract This note outlines various dataset that
Name NRS 409 Exam I. 1. (24 Points) Consider the following questions concerning standard data for GIS systems.
 Consider the following questions concerning standard data for GIS systems.") Read every question carefully. You may use a calculator if you wish. Conversion tables are provided at the end of the exam. If you have any questions, raise your hand. Be sure to show your work on computational
Read every question carefully. You may use a calculator if you wish. Conversion tables are provided at the end of the exam. If you have any questions, raise your hand. Be sure to show your work on computational
Development of GIS Tools to Optimize Identification of Road Segments Prone to Flood Damage
 A Report from the University of Vermont Transportation Research Center Development of GIS Tools to Optimize Identification of Road Segments Prone to Flood Damage Final Report TRC Report 15-005 September
discussion of North America s physical features, including its landforms and bodies of
 Chapter 7 Natural Environments of North America Chapter 7 focuses on the natural environments of North America. The chapter opens with a discussion of North America s physical features, including its landforms
Meteorology 110. Lab 1. Geography and Map Skills
 Meteorology 110 Name Lab 1 Geography and Map Skills 1. Geography Weather involves maps. There s no getting around it. You must know where places are so when they are mentioned in the course it won t be
Regional Haze Metrics Trends and HYSPLIT Trajectory Analyses. May 2017
 Regional Haze Metrics Trends and HYSPLIT Trajectory Analyses May 2017 Principal Contributors: Tom Downs, CCM, ME DEP Project manager Martha Webster, ME DEP Trajectory analyses and GIS mapping Rich Greves,
New Educators Campaign Weekly Report
 Campaign Weekly Report Conversations and 9/24/2017 Leader Forms Emails Collected Text Opt-ins Digital Journey 14,661 5,289 4,458 7,124 317 13,699 1,871 2,124 Pro 13,924 5,175 4,345 6,726 294 13,086 1,767
Objectives: After completing this assignment, you should be able to:
 Data Analysis Assignment #1 Evaluating the effects of watershed land use on storm runoff Assignment due: 21 February 2013, 5 pm Objectives: After completing this assignment, you should be able to: 1) Calculate
HyMet Company. Streamflow and Energy Generation Forecasting Model Columbia River Basin
 HyMet Company Streamflow and Energy Generation Forecasting Model Columbia River Basin HyMet Inc. Courthouse Square 19001 Vashon Hwy SW Suite 201 Vashon Island, WA 98070 Phone: 206-463-1610 Columbia River
GIS feature extraction tools in diverse landscapes
 CE 394K.3 GIS in Water Resources GIS feature extraction tools in diverse landscapes Final Project Anna G. Kladzyk M.S. Candidate, Expected 2015 Department of Environmental and Water Resources Engineering
CENTRAL TEXAS HILL COUNTRY FLOOD
 CENTRAL TEXAS HILL COUNTRY FLOOD Term project report DECEMBER 7, 2018 UNIVERSITY OF TEXAS AT AUSTIN CE394K: GIS in Water Resources Engineering RIFAAI Mohamed Talha Table of Contents Introduction... 3 Context...
Name NRS 509 Exam I. Right Map
 Read every question carefully. You may use a calculator if you wish. Conversion tables are provided at the end of the exam. If you have any questions, raise your hand. Be sure to show your work on computational
, District of Columbia
 State Capitals These are the State Seals of each state. Fill in the blank with the name of each states capital city. (Hint: You may find it helpful to do the word search first to refresh your memory.),
Watershed Analysis of the Blue Ridge Mountains in Northwestern Virginia
 Watershed Analysis of the Blue Ridge Mountains in Northwestern Virginia Mason Fredericks December 6, 2018 Purpose The Blue Ridge Mountain range is one of the most popular mountain ranges in the United
Watershed Modeling With DEMs
 Watershed Modeling With DEMs Lesson 6 6-1 Objectives Use DEMs for watershed delineation. Explain the relationship between DEMs and feature objects. Use WMS to compute geometric basin data from a delineated
Preview: Making a Mental Map of the Region
 Preview: Making a Mental Map of the Region Draw an outline map of Canada and the United States on the next page or on a separate sheet of paper. Add a compass rose to your map, showing where north, south,
Harrison 1. Identifying Wetlands by GIS Software Submitted July 30, ,470 words By Catherine Harrison University of Virginia
 Harrison 1 Identifying Wetlands by GIS Software Submitted July 30, 2015 4,470 words By Catherine Harrison University of Virginia cch2fy@virginia.edu Harrison 2 ABSTRACT The Virginia Department of Transportation
Influence of spatial variation in precipitation on artificial neural network rainfall-runoff model
 Hydrology Days 212 Influence of spatial variation in precipitation on artificial neural network rainfall-runoff model André Dozier 1 Department of Civil and Environmental Engineering, Colorado State University
Rick Faber CE 513 Watershed and Streamwork Delineation Lab # 3 4/24/2006
 Rick Faber CE 513 Watershed and Streamwork Delineation Lab # 3 4/24/2006 1. Objective & Discussion: 2 To learn to use the ArcHydro tools to produce hydrologically descriptive data sets starting from a
CE 394K.3 GIS in Water Resources Midterm Quiz Fall There are 5 questions on this exam. Please do all 5. They are of equal credit.
 Name: CE 394K.3 GIS in Water Resources Midterm Quiz Fall 2000 There are 5 questions on this exam. Please do all 5. They are of equal credit. 1. The ArcView Geographic Information System can display different
13 Watershed Delineation & Modeling
 Module 4 (L12 - L18): Watershed Modeling Standard modeling approaches and classifications, system concept for watershed modeling, overall description of different hydrologic processes, modeling of rainfall,
Hydrography Webinar Series
 Hydrography Webinar Series Session 2 May 21, 2015 U.S. Department of the Interior U.S. Geological Survey U.S. GEOLOGICAL SURVEY HYDROGRAPHY WEBINAR SERIES Hosted by: Jeff Simley Al Rea Hydrography Webinar
GIS in Water Resources Midterm Exam Fall 2016 There are four questions on this exam. Please do all four. They are not all of equal weight.
 Page 1 of 7 Name: GIS in Water Resources Midterm Exam Fall 2016 There are four questions on this exam. Please do all four. They are not all of equal weight. Question 1. (20%) (a) Three key functions of
HYDROLOGIC AND WATER RESOURCES EVALUATIONS FOR SG. LUI WATERSHED
 HYDROLOGIC AND WATER RESOURCES EVALUATIONS FOR SG. LUI WATERSHED 1.0 Introduction The Sg. Lui watershed is the upper part of Langat River Basin, in the state of Selangor which located approximately 20
Introducing Iowa StreamStats Version 4, a Redesign of the USGS Application for Estimating Streamflow Stats
 Introducing Iowa StreamStats Version 4, a Redesign of the USGS Application for Estimating Streamflow Stats Presented at the 2016 Iowa Water Conference Ames, IA March 24, 2016 by David Eash U.S. Geological
Terrain and Satellite Imagery in Madre de Dios, Peru
 Rhett Butler/mongabay.com Terrain and Satellite Imagery in Madre de Dios, Peru Katherine Lininger CE 394 GIS for Water Resources Term Paper December 1, 2011 Introduction Informal and small-scale gold mining
GISHydro2000: A Tool for Automated Hydrologic Analysis in Maryland. G. E. Moglen 1
 GISHydro2000: A Tool for Automated Hydrologic Analysis in Maryland G. E. Moglen 1 1 Department of Civil and Environmental Engineering, University of Maryland, College Park, MD 20742; PH (301) 405-1964;
MODULE 8 LECTURE NOTES 2 REMOTE SENSING APPLICATIONS IN RAINFALL-RUNOFF MODELLING
 MODULE 8 LECTURE NOTES 2 REMOTE SENSING APPLICATIONS IN RAINFALL-RUNOFF MODELLING 1. Introduction The most common application of the remote sensing techniques in the rainfall-runoff studies is the estimation
GIS in Water Resources Midterm Quiz Fall There are 5 questions on this exam. Please do all 5. They are of equal credit.
 Page 1 of 7 Name: GIS in Water Resources Midterm Quiz Fall 2004 There are 5 questions on this exam. Please do all 5. They are of equal credit. 1. In exercises in this class you have developed the skills
Challenge 1: Learning About the Physical Geography of Canada and the United States
 60ºN S T U D E N T H A N D O U T Challenge 1: Learning About the Physical Geography of Canada and the United States 170ºE 10ºW 180º 20ºW 60ºN 30ºW 1 40ºW 160ºW 50ºW 150ºW 60ºW 140ºW N W S E 0 500 1,000
Exercise 4. Watershed and Stream Network Delineation
 Exercise 4. Watershed and Stream Network Delineation GIS in Water Resources, Fall 2018 Prepared by David G Tarboton and David R. Maidment Revised 9 October, 2018 Purpose The purpose of this exercise is
International Geospatial Harmonization of Sister Datasets Hydrography and Watershed Boundaries between Canada and the U.S.A
 International Geospatial Harmonization of Sister Datasets Hydrography and Watershed Boundaries between Canada and the U.S.A by Judy Kwan and Pete Steeves Environment Canada and US Geological Survey in
QF (Build 1010) Widget Publishing, Inc Page: 1 Batch: 98 Test Mode VAC Publisher's Statement 03/15/16, 10:20:02 Circulation by Issue
 Widget Publishing, Inc Page: 1 Batch: 98 Test Mode VAC Publisher's Statement 03/15/16, 10:20:02 Circulation by Issue") QF 1.100 (Build 1010) Widget Publishing, Inc Page: 1 Circulation by Issue Qualified Non-Paid Circulation Qualified Paid Circulation Individual Assoc. Total Assoc. Total Total Requester Group Qualified
QF 1.100 (Build 1010) Widget Publishing, Inc Page: 1 Circulation by Issue Qualified Non-Paid Circulation Qualified Paid Circulation Individual Assoc. Total Assoc. Total Total Requester Group Qualified
GIS in Water Resources Exercise #4 Solution
 GIS in Water Resources Exercise #4 Solution 1. Table giving the length of the Logan River main stream from NHDPlus Length (km) column, Landscape.gdb\NHDPlusv shape_length and Logan.gdb\Basemap\LoganMain
Using GIS to Delineate Watersheds Ed Poyer NRS 509, Fall 2010
 Using GIS to Delineate Watersheds Ed Poyer NRS 509, Fall 2010 A watershed is an area that contributes flow to a point on the landscape. (Bolstad, 2005). Watersheds are an important focus of study because
Exercise 4. Watershed and Stream Network Delineation
 Exercise 4. Watershed and Stream Network Delineation GIS in Water Resources, Fall 2014 Prepared by David G Tarboton and David R. Maidment Purpose The purpose of this exercise is to illustrate watershed
North American Geography. Lesson 2: My Country tis of Thee
 North American Geography Lesson 2: My Country tis of Thee Unit Overview: As students work through the activities in this unit they will be introduced to the United States in general, different regions
Physiographic Provinces (West, Ch. 13)
") Geology 229 Engineering Geology Lecture 13 Physiographic Provinces (West, Ch. 13) The definition of the term Physiography Physiography (n.) The science which treats of the earth's exterior physical features,
Geology 229 Engineering Geology Lecture 13 Physiographic Provinces (West, Ch. 13) The definition of the term Physiography Physiography (n.) The science which treats of the earth's exterior physical features,
INVISIBLE WATER COSTS
 Every Drop Every Counts... Drop Counts... INVISIBLE WATER COSTS Corn - 108.1 gallons per pound How much water it takes to produce... Apple - 18.5 gallons to grow Beef - 1,581 gallons per pound Oats - 122.7
Watershed Application of WEPP and Geospatial Interfaces. Dennis C. Flanagan
 Watershed Application of WEPP and Geospatial Interfaces Dennis C. Flanagan Research Agricultural Engineer USDA-Agricultural Research Service Adjunct Professor Purdue Univ., Dept. of Agric. & Biol. Eng.