A GEOGRAPHIC ASSESSMENT OF MAJOR DISASTER DECLARATIONS ACROSS THE LOWER 48 STATES
|
|
|
- George Dixon
- 5 years ago
- Views:
Transcription
 Author: James Hocker")


1 A GEOGRAPHIC ASSESSMENT OF MAJOR DISASTER DECLARATIONS ACROSS THE LOWER 48 STATES A summary report produced by the Southern Climate Impacts Planning Program (SCIPP) Author: James Hocker Southern Climate Impacts Planning Program University of Oklahoma March 2011 This publication is issued by the Southern Climate Impacts Planning Program as authorized by the U.S. Department of Commerce, National Oceanic and Atmospheric Administration Cooperative Agreement, NA080AR Copies have not been printed but are available through the SCIPP website at
2


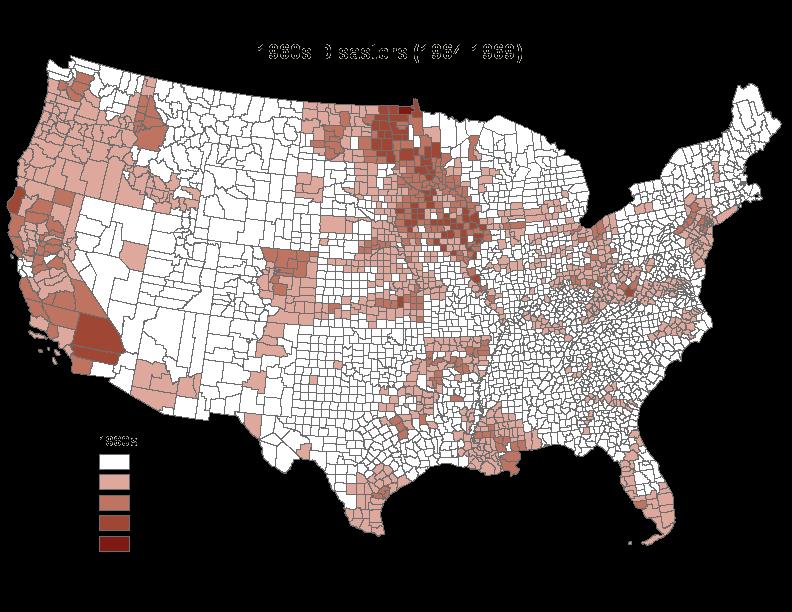
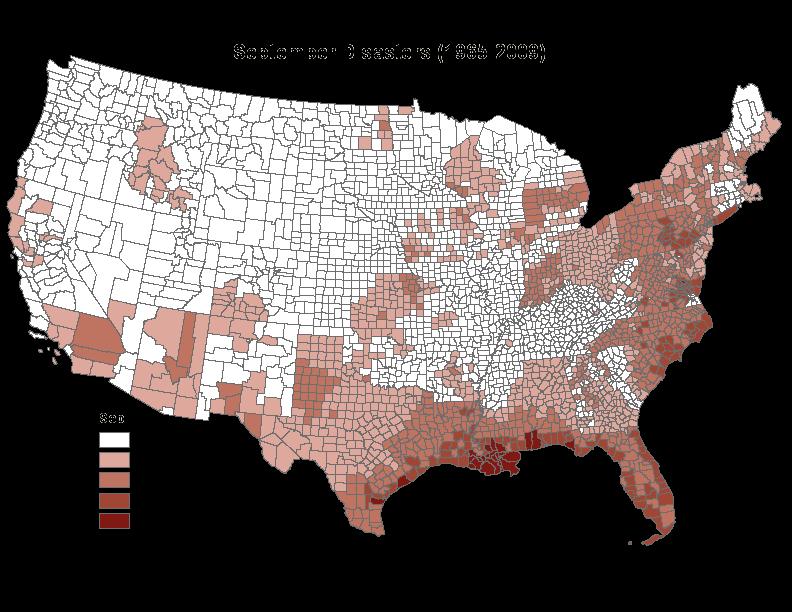
3 OVERVIEW The Federal Emergency Management Agency (FEMA) maintains a historical archive of major disaster declarations dating back to This archive documents a variety of details for each declaration including the date, location, incident type, and a description of the event. From 1953 through the end of 2009, a total of 1,764 separate disasters were declared across the 50 states. Each of these declarations played a critical role in the recovery process by providing affected areas with much-needed federal assistance to recover from a major event. Furthermore, funds also supported mitigation activities to reduce the impacts of future disaster events. The early portion of the disaster archive ( ) contains limited location information with data available only at the state level. Beginning on December 24, 1964 disaster information is available on a county-level scale, which provides an improved level of detail regarding impacted areas. To make use of this detailed information, FEMA has produced several excellent Geographic Information Systems (GIS) maps illustrating the number of disasters declared in each county across the country during the full period of record as well as the most recent 10- year period (e.g., Such maps provide a wealth of information and illustrate areas most susceptible to disasters in the past. Taking this mapping concept and applying it further, the Southern Climate Impacts Planning Program (SCIPP) has recently undertaken a GIS study to assess the past occurrence of disasters across the lower forty-eight contiguous states. The purpose of the study was to geographically assess weather-related disaster declarations in an effort to understand where specific hazards have occurred most frequently and when. Please note that this assessment is focused primarily on weather and climate-related hazards and is limited to hazards recorded by FEMA (i.e., drought is not included in the analysis). Much of the remainder of this report is primarily graphical in nature, with a heavy emphasis on the map results found in the assessment. A brief discussion will follow the GIS imagery to provide an interpretation of the results. ABOUT SCIPP SCIPP is a member of the National Oceanic and Atmospheric Administration (NOAA) Regional Integrated Sciences and Assessments (RISA) program. Based at the University of Oklahoma and Louisiana State University, SCIPP conducts integrated physical and social science research across a large portion of the south central United States including Oklahoma, Texas, Arkansas, Louisiana, Tennessee, and Mississippi. SCIPPʼs research and engagement efforts are focused particularly in the areas of extreme weather events and multi-hazard planning. Additional interests include coastal planning, adaptation planning, and water resources planning. SCIPP conducts a blend of physical and social science research to advance the scientific understanding of the southʼs climate including climate variability and change. Particular emphasis is placed on the application of, use, and need for climate information by a variety of stakeholders. For more information about SCIPP please visit: 1
4 METHODS The dataset used for this assessment was the FEMA Disaster Declarations Summary available from at the following URL (as of March 14, 2011): A series of pre-processing steps were undertaken to get the data into a format needed to develop GIS maps. An initial processing step included assigning unique Federal Information Processing Standards (FIPS) county codes to each county name listed in the FEMA archive. Since a series of identical county names exist across the U.S. (i.e., Washington County, Jefferson County, Franklin County, etc.), this step was undertaken to establish a unique number for each county to prevent duplicate counts. Another critical preprocessing step involved tabulating counts for each U.S. county for a variety of variables including number of disasters for each month, each decade, and each type of hazard. Tabulating counts of disasters by hazard type required further processing due to the way disaster types are recorded in the FEMA archive. The FEMA archive contains two specific columns of information pertaining to the type of disaster: an Incident Type and a more descriptive Title field. For example, here is a sampling of data for one disaster event in a particular county: Disaster Number State Declaration Date Incident Type Title Designated County 229 KS July 18, 1967 Tornado Table 1. Sample of data from the FEMA disaster dataset. TORNADOES, SEVERE STORMS & FLOODING Anderson While the FEMA dataset includes an explicit definition of the Incident Type (i.e., Tornado ) this single classification oftentimes does not completely classify a range of hazards that accompanied a single event (i.e., TORNAOES, SEVERE STORMS & FLOODING ). Due to this limitation, pre-processing steps tabulated hazards using the information in the Title column to best capture the full range of hazards associated with an event. If a particular event had multiple hazards accompanying it, such as SEVERE STORMS, MUDSLIDES & FLOODING, the single disaster event would get counted once in each of those different categories. This method allowed a much more detailed breakdown of hazard types and pulled out critical details contained in the dataset. Each of these pre-processing steps was accomplished through the use of Perl scripting. Table 2 shows the specific words used to tabulate each hazard type based on the disaster title field. The selection of the words was accomplished through a full review of the disaster archive to identify all key words used. In some instances misspelled words were identified ( SEVER STORMS, etc.); every effort was made to account for these errors in the dataset. Additional tabulations were done on a state basis to identify the frequency of disasters at the state scale. The statewide analysis was done using spreadsheet software. For all data analysis only major disaster declarations were included in frequency counts. Additional data in the archive such as emergency declarations, fire management assistance, and fire suppression authorization listings were not included. 2
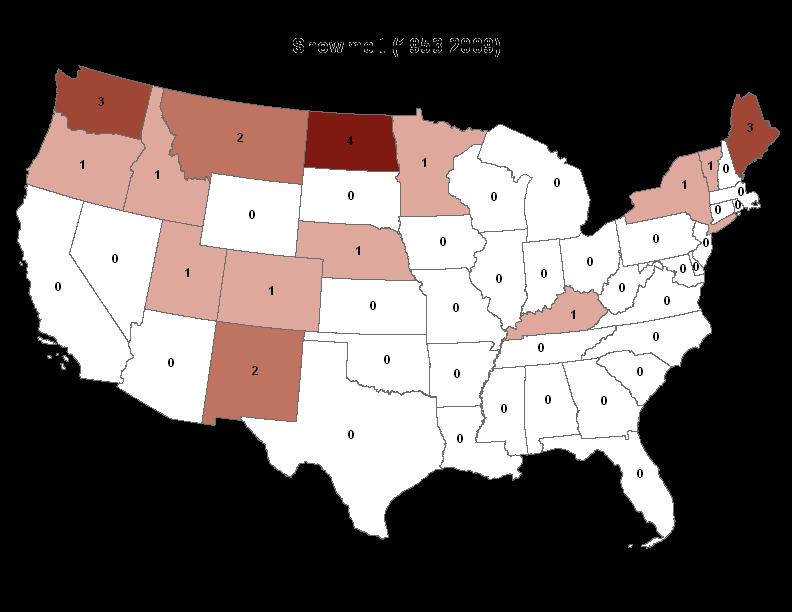
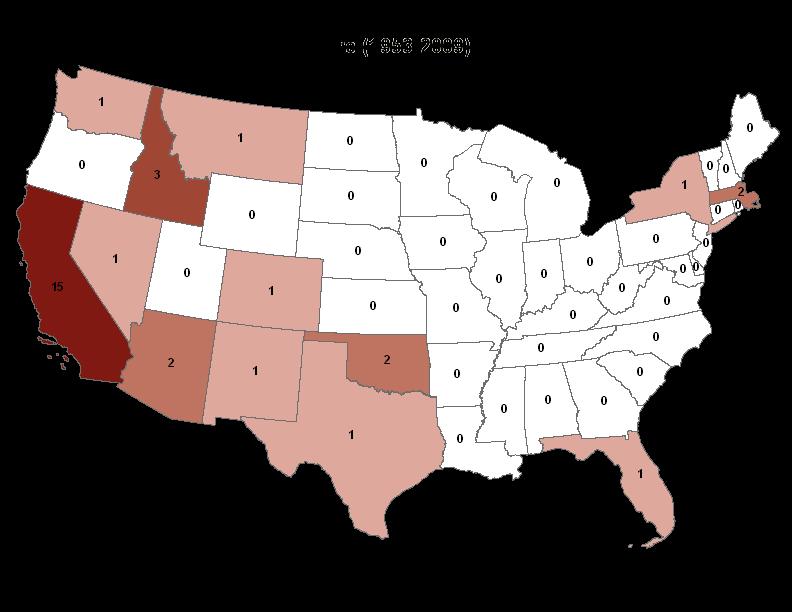
5 Hazard Category Matching Words in Disaster Title Field Could Contain: Coastal Storm COASTAL STORM Fire FIRE Flooding FLOOD, RAIN, SNOWMELT, or SNOW MELT Freeze FREEZE or FREEZING Hurricane HURRICANE or TROPICAL Ice Jam ICE JAM Landslides LAND or LANDSLIDE Mudslides MUD or MUDSLIDE Severe Storms SEVERE STORM, SEVERE WEATHER, SEVERE THUNDERSTORM, or SEVERE WX Snowmelt SNOWMELT or SNOW MELT Tornado TORNADO WINTER, SNOWFALL, SNOWSTORM, HEAVY SNOW, SNOW, Winter Storm BLIZZARD, SLEET, FREEZING RAIN, or ICE STORM (snowmelt was not included in the count) Table 2. Text used to tabulate the different types of hazards. The left column denotes the hazard category, while the right column shows the text in the FEMA disaster Title field used to accumulate a single disaster count for that category. Only one of the words in the right column was needed per disaster event. With pre-processing completed, the data was brought into GIS mapping software (ESRIʼs ArcGIS) to visualize the information in a variety of ways. The data were joined with a 2009 TIGER/Line county boundaries shapefile (obtained from: which connected the myriad of disaster tabulations for each county to a map. On the state basis, the disaster tabulations were joined with a 2009 TIGER/LINE state boundaries shapefile (available at the same URL as above). Maps were then made by visualizing the particular tabulation (e.g., counts by month, by decade, by disaster type, etc). This involved the creation of more than 50 maps, many of which appear in this report. RESULTS A series of GIS maps depicting many different aspects of the FEMA disaster archive is included in this section. Maps include depictions of the number of: All Disasters, Disasters by Hazard Type, Disasters by Decade, and Disasters by Month. The maps appearing in this section use a common color scheme to illustrate the number of disaster declarations at either the county or state-scale through varying shades of red. Light reds depict fewer disaster declarations, darker red colors are associated with more disasters, and white indicates zero disasters. County-scale maps include a legend at the bottom to define the colors while state-scale maps have no legends and include printed text over each state to denote the number of disaster declarations. All images have an associated title that details the contents of the map below it. Please note that state-based and county-based maps pull from different periods of record due to the absence of county-based disaster data prior to December 24, The period depicted in each map is denoted in parentheses. 3
6 ALL DISASTERS 4
7 5
8 DISASTERS BY HAZARD TYPE 6
9 7
10 8
11 9
12 10
13 11
14 12
15 13
16 14
17 15
18 16
19 17
20 DISASTERS BY DECADE 18
21 19
22 20
23 21
24 22
25 23
26 24
27 DISASTERS BY MONTH 25
28 26
29 27
30 28
31 29
32 30
33 31
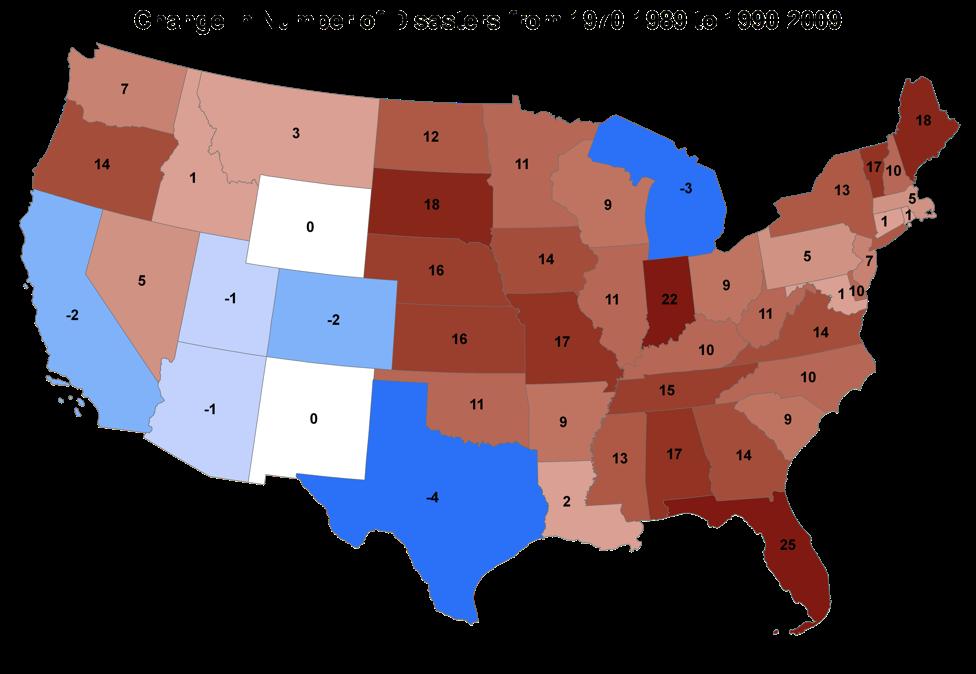
34 BRIEF DISCUSSION FEMAʼs archive of major disaster declarations represents nearly 1,800 separate disaster declarations made across the United States (territories excluded) from May 1953 through December These declarations play a critical role in providing areas impacted by disasters with funding to recover from an event as well as mitigate the impacts of future events. While declarations encompass a wide variety of types spanning weather and climate hazards (severe weather, winter weather, flooding, wildfires, etc.), geologic hazards (e.g., earthquakes, volcanoes, etc.), ecological hazards (e.g., fish losses), and infrastructure/human hazards (e.g., water shortages, dam breaks, terrorist attack, toxic substances, etc.), weather and climate hazards account for a vast majority of FEMA disaster declarations and represented the primary focus of this geographic assessment. While all states have experienced a disaster, the regions most frequently impacted in the past have included the Great Plains eastward through the Midwest, the Gulf Coast states, portions of the U.S. East Coast, and the U.S. West Coast. A review of county-level disaster maps reveals interesting disparities across state borders, such as the relative minima (with respect to surrounding states) apparent in states such as Illinois and Georgia. While this assessment does not focus on the causes, these appear to be highly human and policy related. From a decadal standpoint, disaster declarations have been on the increase nationally since the 1950s. In fact, 40 of the 48 contiguous states experienced increases in disasters from as compared to There are a variety of possible reasons for these increases, including, but not limited to increases in the capacity of state emergency management agencies, increases in the data available to qualify disasters, increased pursuit of declarations at the state level, and increases in U.S. population and built structures, among many other possible causes. Because a vast majority of disaster declarations are weather-related events, their frequencies largely follow annual climatological cycles. The year begins with declarations concentrated along the west coast as well as portions of the central and eastern United States in conjunction with winter storms. During March spring storm activity becomes evident throughout the Mississippi Valley and Southeast before expanding in coverage towards the west and north during April, May, and June. In addition to spring storm activity, flooding issues are pronounced along the Red River in the Northern Plains during April through June. During July, disaster declarations are most prevalent throughout the Plains and northern portions of the United States in conjunction with summertime thunderstorm activity. Hurricanes become evident along the Gulf and East Coast beginning in June with a peak in activity during the month of September. Disaster frequencies hit an annual low during the late fall (November) before winter storm activity resumes. FOR MORE INFORMATION This research was conducted by the Southern Climate Impacts Planning Program, which is a member of the National Oceanic and Atmospheric Administration (NOAA) Regional Integrated Sciences and Assessments Program (RISA). For more information about SCIPP please visit us at or contact us at scipp@mesonet.org. For more information about NOAAʼs RISA program, please see the program website at: 32
5.2. IDENTIFICATION OF NATURAL HAZARDS OF CONCERN
 5.2. IDENTIFICATION OF NATURAL HAZARDS OF CONCERN To provide a strong foundation for mitigation strategies considered in Sections 6 and 9, County considered a full range of natural hazards that could impact
5.2 IDENTIFICATION OF HAZARDS OF CONCERN
 5.2 IDENTIFICATION OF HAZARDS OF CONCERN 2016 HMP Update Changes The 2011 HMP hazard identification was presented in Section 3. For the 2016 HMP update, the hazard identification is presented in subsection
5.2 IDENTIFICATION OF HAZARDS OF CONCERN
 5.2 IDENTIFICATION OF HAZARDS OF CONCERN 2015 HMP Update Changes The 2010 HMP hazard identification was presented in Section 6. For the 2015 HMP update, the hazard identification is presented in subsection
SOUTHERN CLIMATE MONITOR
 SOUTHERN CLIMATE MONITOR MARCH 2011 VOLUME 1, ISSUE 3 IN THIS ISSUE: Page 2 to 4 Severe Thunderstorm Climatology in the SCIPP Region Page 4 Drought Update Page 5 Southern U.S. Precipitation Summary for
5.2 IDENTIFICATION OF HAZARDS OF CONCERN
 5.2 IDENTIFICATION OF HAZARDS OF CONCERN To provide a strong foundation for mitigation actions considered in Sections 6 and 9, County focused on considering a full range of s that could impact area, and
IDENTIFICATION OF HAZARDS OF CONCERN
 IDENTIFICATION OF HAZARDS OF CONCERN To provide a strong foundation for mitigation strategies considered in Section 6, the Village considered a full range of hazards that could impact the area and then
5.2 IDENTIFICATION OF HAZARDS OF CONCERN
 5.2 IDENTIFICATION OF HAZARDS OF CONCERN 2016 HMP Update Changes The 2011 HMP hazard identification was presented in Section 3. For the 2016 HMP update, the hazard identification is presented in subsection
National Wildland Significant Fire Potential Outlook
 National Wildland Significant Fire Potential Outlook National Interagency Fire Center Predictive Services Issued: September, 2007 Wildland Fire Outlook September through December 2007 Significant fire
J8.4 TRENDS OF U.S. SNOWFALL AND SNOW COVER IN A WARMING WORLD,
 J8.4 TRENDS OF U.S. SNOWFALL AND SNOW COVER IN A WARMING WORLD, 1948-2008 Richard R. Heim Jr. * NOAA National Climatic Data Center, Asheville, North Carolina 1. Introduction The Intergovernmental Panel
4.1 Hazard Identification: Natural Hazards
 data is provided in an annex, it should be assumed that the risk and potential impacts to the affected jurisdiction are similar to those described here for the entire Sacramento County Planning Area. This
SOUTHERN CLIMATE MONITOR
 SOUTHERN CLIMATE MONITOR AUGUST 2012 VOLUME 2, ISSUE 8 IN THIS ISSUE: Page 2 to 3 Spotlight on Academic Research: Changes in Temperature and Precipitation in the South Page 4 Drought Update and Southern
5.2 IDENTIFICATION OF NATURAL HAZARDS OF CONCERN
 5.2 IDENTIFICATION OF NATURAL HAZARDS OF CONCERN To provide a strong foundation for mitigation strategies considered in Sections 6 and 9, County considered a full range of natural s that could impact area,
Daily Operations Briefing Friday, March 17, :30 a.m. EDT
 Daily Operations Briefing Friday, March 17, 2017 8:30 a.m. EDT Significant Activity Mar 16-17 Significant Events: None Significant Weather: Heavy snow Cascades Snow and freezing rain Upper Mississippi
Wednesday, May 30, :30 a.m. EDT
 Wednesday, May 30, 2018 8:30 a.m. EDT Significant Activity May 29-30 Significant Events: Remnants of Tropical Depression Alberto Tropical Activity: Western Pacific No activity affecting U.S. interests
Daily Operations Briefing Tuesday, April 4, :30 a.m. EDT
 Daily Operations Briefing Tuesday, April 4, 2017 8:30 a.m. EDT Significant Activity Apr 3-4 Significant Events: Severe Weather Southern Plains to Southeast Significant Weather: Severe Thunderstorms and
National Situation Report As of 5:00 a.m. EDT Tuesday, April 4, 2017
 Overview National Situation Report As of 5:00 a.m. EDT Tuesday, April 4, 2017 Table Of Contents Current Operations Monitoring Recovery National Response Coordination Center: Not Activated National Watch
Friday, April 13, :30 a.m. EDT
 Friday, April 13, 2018 8:30 a.m. EDT Significant Activity April 12-13 Significant Events: Severe Weather Middle and Lower Mississippi Valley 34 Complex Fire Tropical Activity: Western Pacific No activity
Saturday, April 14, :30 a.m. EDT
 Saturday, April 14, 2018 8:30 a.m. EDT Significant Activity April 13-14 Significant Events: Severe Weather Southern/Central Plains and Lower/Middle Mississippi Valley Tropical Activity: Western Pacific
Bossier Parish Hazard Mitigation Plan Update Public Meeting. August 10, 2016 Bossier City, LA
 Bossier Parish Hazard Mitigation Plan Update Public Meeting August 10, 2016 Bossier City, LA Agenda Hazard Mitigation Planning Process SDMI Staff Risk Assessment SDMI Staff Update on Previous/Current Mitigation
Daily Operations Briefing Wednesday, February 8, :30 a.m. EST
 Daily Operations Briefing Wednesday, February 8, 2017 8:30 a.m. EST Significant Activity Feb 7-8 Significant Events: Severe weather/tornadoes - Louisiana Significant Weather: Freezing rain possible Pacific
Daily Operations Briefing Friday, April 3, :30 a.m. EDT
 Daily Operations Briefing Friday, April 3, 2015 8:30 a.m. EDT Significant Activity: Apr 2 3 Significant Events: None Significant Weather: Heavy rain and enhanced severe weather outlook: Lower Mississippi
Wednesday, March 30, 2016
 Total Active DRs 7 Total DRs issued since January 1st 34 Total Number of Shelters Open* 7 (-3) Total Population in Shelters* 143 (-344) Disaster Assessment (Estimated Cumulative) Total: Major + Destroyed:
Monthly Long Range Weather Commentary Issued: APRIL 18, 2017 Steven A. Root, CCM, Chief Analytics Officer, Sr. VP,
 Monthly Long Range Weather Commentary Issued: APRIL 18, 2017 Steven A. Root, CCM, Chief Analytics Officer, Sr. VP, sroot@weatherbank.com MARCH 2017 Climate Highlights The Month in Review The average contiguous
Daily Operations Briefing. Saturday, March 17, :30 a.m. EDT
 Daily Operations Briefing Saturday, March 17, 2018 8:30 a.m. EDT Significant Activity Mar 16-17 Significant Events: None Tropical Activity: Western Pacific No activity affecting U.S. interests Significant
Southern Climate Monitor. In This Issue: April 2018 Volume 8, Issue 4. Page 2-3: Simple Planning Tool for Oklahoma Climate Hazards
 April 2018 Volume 8, Issue 4 In This Issue: Page 2-3: Simple Planning Tool for Oklahoma Climate Hazards Page 4: Drought Summary Page 5: Southern US Temperature Summary for March Page 6: Southern US Precipitation
but 2012 was dry Most farmers pulled in a crop
 After a winter that wasn t, conditions late in the year pointed to a return to normal snow and cold conditions Most farmers pulled in a crop but 2012 was dry b y M i k e Wr o b l e w s k i, w e a t h e
Local Weather History
 Local Weather History 52 40- to 2+ 50-minute sessions ACTIVITY OVERVIEW P RO J E C T Students design and conduct a survey to learn about the history of weather disasters in the local area, and then compare
RISK ASSESSMENT COMMUNITY PROFILE NATURAL HAZARDS COMMUNITY RISK PROFILES. Page 13 of 524
 RISK ASSESSMENT COMMUNITY PROFILE NATURAL HAZARDS COMMUNITY RISK PROFILES Page 13 of 524 Introduction The Risk Assessment identifies and characterizes Tillamook County s natural hazards and describes how
SOUTHERN CLIMATE MONITOR
 SOUTHERN CLIMATE MONITOR NOVEMBER 2011 VOLUME 1, ISSUE 11 IN THIS ISSUE: Page 2 - Winter Forecast for the South Page 3 - Hurricane Season Wrap-up Page 4 - Drought Update Page 4 - Southern U.S. Precipitation
SOUTHERN CLIMATE MONITOR
 SOUTHERN CLIMATE MONITOR DECEMBER 2011 VOLUME 1, ISSUE 12 IN THIS ISSUE: Page 2 to 3 Managing Drought in the Southern Plains Webinar Series Page 3 Drought Update Page 4 Southern U.S. Precipitation Summary
Daily Operations Briefing Friday, January 13, :30 a.m. EST
 Daily Operations Briefing Friday, January 13, 2017 8:30 a.m. EST Significant Activity Jan 12-13 Significant Events: Heavy precipitation - western U.S. FINAL Winter storm central U.S. Significant Weather:
B.2 Sources for Hazard Identification, Profiling, and Ranking (Section 3) Overview of Sussex County s History of Hazards
 Overview of Sussex County s History of Hazards") Appendix B Sources B.1 Sources for Planning Process (Section 2) FEMA. Mitigation Planning Guidance (386 Series). Available on the web at: http://www.fema.gov/plan/mitplanning/planning_resources.shtm FEMA
Appendix B Sources B.1 Sources for Planning Process (Section 2) FEMA. Mitigation Planning Guidance (386 Series). Available on the web at: http://www.fema.gov/plan/mitplanning/planning_resources.shtm FEMA
Weather and Climate Summary and Forecast Winter
 Weather and Climate Summary and Forecast Winter 2016-17 Gregory V. Jones Southern Oregon University February 7, 2017 What a difference from last year at this time. Temperatures in January and February
Ellen L. Mecray NOAA Regional Climate Services Director, Eastern Region Taunton, MA
 Ellen L. Mecray NOAA Regional Climate Services Director, Eastern Region Taunton, MA Regions of the US National Climate Assessment What we Observe: Climate changes and impacts Increasing temperature Increasingly
Impacts of the April 2013 Mean trough over central North America
 Impacts of the April 2013 Mean trough over central North America By Richard H. Grumm National Weather Service State College, PA Abstract: The mean 500 hpa flow over North America featured a trough over
West Carroll Parish Hazard Mitigation Plan Update Public Meeting. August 25, 2015 Oak Grove, LA
 West Carroll Parish Hazard Mitigation Plan Update Public Meeting August 25, 2015 Oak Grove, LA Agenda Hazard Mitigation Planning Process SDMI Staff Risk Assessment SDMI Staff Update on Previous/Current
2015: A YEAR IN REVIEW F.S. ANSLOW
 2015: A YEAR IN REVIEW F.S. ANSLOW 1 INTRODUCTION Recently, three of the major centres for global climate monitoring determined with high confidence that 2015 was the warmest year on record, globally.
Drought Impacts in the Southern Great Plains. Mark Shafer University of Oklahoma Norman, OK
 Drought Impacts in the Southern Great Plains Mark Shafer University of Oklahoma Norman, OK Causes of Drought: Large-Scale, Stationary High Pressure Air rotates clockwise around high pressure steers storms
Daily Operations Briefing Friday, March 10, :30 a.m. EST
 Daily Operations Briefing Friday, March 10, 2017 8:30 a.m. EST Significant Activity Mar 9-10 Significant Events: None Significant Weather: Freezing rain possible Northern/Central Plains and Middle Mississippi
Daily Operations Briefing. Monday, April 2, :30 a.m. EDT
 Daily Operations Briefing Monday, April 2, 2018 8:30 a.m. EDT Significant Activity Mar 31-April 2 Significant Events: None Tropical Activity: No significant activity Significant Weather: Heavy Snow Northern
HAZARD DESCRIPTION... 1 LOCATION... 1 EXTENT... 1 HISTORICAL OCCURRENCES...
 WINTER STORM HAZARD DESCRIPTION... 1 LOCATION... 1 EXTENT... 1 HISTORICAL OCCURRENCES... 3 SIGNIFICANT PAST EVENTS... 4 PROBABILITY OF FUTURE EVENTS... 5 VULNERABILITY AND IMPACT... 5 Hazard Description
Daily Operations Briefing. Friday, May 5, :30 a.m. EDT
 Daily Operations Briefing Friday, May 5, 2017 8:30 a.m. EDT Significant Activity May 4-5 Significant Events: Flooding Southern/Central Plains Significant Weather: Flash flooding possible Mid-Atlantic through
Daily Operations Briefing Saturday, January 16, :30 a.m. EST
 Daily Operations Briefing Saturday, January 16, 2016 8:30 a.m. EST Significant Activity: Jan 15-16 Significant Events: None Significant Weather: Flooding Central and Southern US Nor'easter expected over
Daily Operations Briefing Monday, December 26, :30 a.m. EST
 Daily Operations Briefing Monday, December 26, 2016 8:30 a.m. EST Significant Activity Dec 25-26 Significant Events: None Significant Weather: Heavy Snow Pacific Northwest, Northern Intermountain and the
WINTER STORM Annex II
 WINTER STORM Annex II I. PURPOSE A. This annex has been prepared to ensure a coordinated response by state agencies to requests from local jurisdictions to reduce potential loss of life and to ensure essential
2011 National Seasonal Assessment Workshop for the Eastern, Southern, & Southwest Geographic Areas
 2011 National Seasonal Assessment Workshop for the Eastern, Southern, & Southwest Geographic Areas On January 11-13, 2011, wildland fire, weather, and climate met virtually for the ninth annual National
Weather and Climate Summary and Forecast January 2018 Report
 Weather and Climate Summary and Forecast January 2018 Report Gregory V. Jones Linfield College January 5, 2018 Summary: A persistent ridge of high pressure over the west in December produced strong inversions
Daily Operations Briefing Friday, January 20, :30 a.m. EST
 Daily Operations Briefing Friday, January 20, 2017 8:30 a.m. EST Significant Activity Jan 19-20 Significant Events: 58 th Presidential Inauguration Significant Weather: Flash flooding possible California,
Monthly Long Range Weather Commentary Issued: SEPTEMBER 19, 2016 Steven A. Root, CCM, Chief Analytics Officer, Sr. VP,
 Monthly Long Range Weather Commentary Issued: SEPTEMBER 19, 2016 Steven A. Root, CCM, Chief Analytics Officer, Sr. VP, sroot@weatherbank.com SEPTEMBER 2016 Climate Highlights The Month in Review The contiguous
Daily Operations Briefing. Tuesday, March 27, :30 a.m. EDT
 Daily Operations Briefing Tuesday, March 27, 2018 8:30 a.m. EDT Significant Activity Mar 26-27 Significant Events: None Tropical Activity: Western Pacific No activity affecting U.S. interests Significant
SOUTHERN CLIMATE MONITOR
 SOUTHERN CLIMATE MONITOR FEBRUARY 2011 VOLUME 1, ISSUE 2 IN THIS ISSUE: Page 2 Impacts of February Snowstorms Across the SCIPP Region Page 4 Climate Perspective Page 5 Southern U.S. Temperature and Precipitation
Daily Operations Briefing Tuesday, March 28, :30 a.m. EDT
 Daily Operations Briefing Tuesday, March 28, 2017 8:30 a.m. EDT Significant Activity Mar 27-28 Significant Events: None Significant Weather: Severe Thunderstorms TX & OK Flash Flooding TX & OK Freezing
MODELLING FROST RISK IN APPLE TREE, IRAN. Mohammad Rahimi
 WMO Regional Seminar on strategic Capacity Development of National Meteorological and Hydrological Services in RA II (Opportunity and Challenges in 21th century) Tashkent, Uzbekistan, 3-4 December 2008
Daily Operations Briefing Tuesday, February 4, :30 a.m. EST
 Daily Operations Briefing Tuesday, February 4, 2014 8:30 a.m. EST Significant Activity: February 3 4 Significant Events: Winter Weather Central Plains to Northeast Propane Gas Shortage Midwest Significant
Monthly Long Range Weather Commentary Issued: NOVEMBER 16, 2015 Steven A. Root, CCM, Chief Analytics Officer, Sr. VP, sales
 Monthly Long Range Weather Commentary Issued: NOVEMBER 16, 2015 Steven A. Root, CCM, Chief Analytics Officer, Sr. VP, sales sroot@weatherbank.com OCTOBER 2015 Climate Highlights The Month in Review The
Weather and Climate Summary and Forecast Fall/Winter 2016
 Weather and Climate Summary and Forecast Fall/Winter 2016 Gregory V. Jones Southern Oregon University November 5, 2016 After a year where we were seemingly off by a month in terms of temperatures (March
Tuesday, March 5, :30 a.m. EST
 Tuesday, March 5, 2019 8:30 a.m. EST Significant Activity Mar 4-5 Significant Events: Severe thunderstorms and tornadoes AL and GA Tropical Activity: No activity affecting U.S. interests Significant Weather:
Daily Operations Briefing Sunday, January 8, :30 a.m. EST
 Daily Operations Briefing Sunday, January 8, 2017 8:30 a.m. EST Significant Activity Jan 6-8 Significant Events: Heavy Precipitation forecast to impact CA and NV Significant Weather: Freezing rain Pacific
2011 Year in Review TORNADOES
 2011 Year in Review The year 2011 had weather events that will be remembered for a long time. Two significant tornado outbreaks in April, widespread damage and power outages from Hurricane Irene in August
A Preliminary Severe Winter Storms Climatology for Missouri from
 A Preliminary Severe Winter Storms Climatology for Missouri from 1960-2010 K.L. Crandall and P.S Market University of Missouri Department of Soil, Environmental and Atmospheric Sciences Introduction The
Kentucky Weather Hazards: What is Your Risk?
 Kentucky Weather Hazards: What is Your Risk? Stuart A. Foster State Climatologist for Kentucky 2010 Kentucky Weather Conference Bowling Green, Kentucky January 16, 2010 Perspectives on Kentucky s Climate
Mapping Coastal Change Using LiDAR and Multispectral Imagery
 Mapping Coastal Change Using LiDAR and Multispectral Imagery Contributor: Patrick Collins, Technical Solutions Engineer Presented by TABLE OF CONTENTS Introduction... 1 Coastal Change... 1 Mapping Coastal
LOCAL CLIMATOLOGICAL DATA FOR FREEPORT ILLINOIS
 Climatological Summary: LOCAL CLIMATOLOGICAL DATA FOR FREEPORT ILLINOIS 1905-1990 Freeport (Stephenson County) has a temperate continental climate, dominated by maritime tropical air from the Gulf of Mexico
Esri Disaster Response Program. Ryan Lanclos Jeff Baranyi
 Esri Disaster Response Program Ryan Lanclos Jeff Baranyi Esri was founded to help solve some of the world s most difficult problems. When disaster strikes, we re here to support you. We support disaster
Saturday, June 9, :30 a.m. EDT
 Saturday, June 9, 2018 8:30 a.m. EDT Significant Activity June 8-9 Significant Events: None Tropical Activity: Atlantic No tropical cyclones expected next 48 hours Eastern Pacific Hurricane Aletta; Disturbance
Weather and Climate Summary and Forecast March 2018 Report
 Weather and Climate Summary and Forecast March 2018 Report Gregory V. Jones Linfield College March 7, 2018 Summary: The ridge pattern that brought drier and warmer conditions from December through most
2014 Annual Mitigation Plan Review Meeting
 2014 Annual Mitigation Plan Review Meeting Highland County EMA MEETING OBJECTIVES Understand Your Natural Disaster Risk Review of Previous Plans Current Plan Status Future Activity Plan/Needs of Each Community
extreme weather, climate & preparedness in the american mind
 extreme weather, climate & preparedness in the american mind Extreme Weather, Climate & Preparedness In the American Mind Interview dates: March 12, 2012 March 30, 2012. Interviews: 1,008 Adults (18+)
Monthly Long Range Weather Commentary Issued: APRIL 25, 2016 Steven A. Root, CCM, Chief Analytics Officer, Sr. VP, sales
 Monthly Long Range Weather Commentary Issued: APRIL 25, 2016 Steven A. Root, CCM, Chief Analytics Officer, Sr. VP, sales sroot@weatherbank.com MARCH 2016 Climate Highlights The Month in Review The March
Flooding in Western North Carolina: Some Spatial, Hydrologic, and Seasonal Characteristics CAUTION!! Outline. Basic Flood Facts.
 Flooding in Western North Carolina: Some Spatial, Hydrologic, and Seasonal Characteristics J. Greg Dobson CAUTION!! National Environmental Modeling and Analysis Center RENCI at UNC-Asheville Engagement
Investigation IV: Seasonal Precipitation and Seasonal Surface Runoff in the US
 Investigation IV: Seasonal Precipitation and Seasonal Surface Runoff in the US Purpose Students will consider the seasonality of precipitation and surface runoff and think about how the time of year can
HAZARD IDENTIFICATION... 1 HAZARD EFFECTS OF CLIMATE CHANGE... 2 OVERVIEW OF HAZARD ANALYSIS... 4 BUILDING VALUES... 5 POTENTIAL DOLLAR LOSSES...
 R ISK OVERVIEW IDENTIFICATION... 1 EFFECTS OF CLIMATE CHANGE... 2 OVERVIEW OF ANALYSIS... 4 BUILDING VALUES... 5 POTENTIAL DOLLAR LOSSES... 7 IDENTIFICATION This section begins the risk assessment, which
January 25, Summary
 January 25, 2013 Summary Precipitation since the December 17, 2012, Drought Update has been slightly below average in parts of central and northern Illinois and above average in southern Illinois. Soil
Daily Operations Briefing Wednesday, April 5, :30 a.m. EDT
 Daily Operations Briefing Wednesday, April 5, 2017 8:30 a.m. EDT Significant Activity Apr 4-5 Significant Events: Severe Weather Southern Plains to Southeast Significant Weather: Severe thunderstorms &
Weather and Climate Summary and Forecast January 2019 Report
 Weather and Climate Summary and Forecast January 2019 Report Gregory V. Jones Linfield College January 4, 2019 Summary: December was mild and dry over much of the west, while the east was much warmer than
Monthly Long Range Weather Commentary Issued: February 15, 2015 Steven A. Root, CCM, President/CEO
 Monthly Long Range Weather Commentary Issued: February 15, 2015 Steven A. Root, CCM, President/CEO sroot@weatherbank.com JANUARY 2015 Climate Highlights The Month in Review During January, the average
Tornado Hazard Risk Analysis: A Report for Rutherford County Emergency Management Agency
 Tornado Hazard Risk Analysis: A Report for Rutherford County Emergency Management Agency by Middle Tennessee State University Faculty Lisa Bloomer, Curtis Church, James Henry, Ahmad Khansari, Tom Nolan,
Monday, May 28, :30 a.m. EDT
 Monday, May 28, 2018 8:30 a.m. EDT Significant Activity May 27-28 Significant Events: Subtropical Storm Alberto; Ellicott City, MD flooding Tropical Activity: Atlantic Subtropical Storm Alberto Significant
The Pennsylvania Observer
 The Pennsylvania Observer April 2, 2010 March 2010 Pennsylvania Weather Recap Prepared by: Katelyn Johnson March did come in as a lion cub this year. The 1 st proved to be a calm day; however most of Pennsylvania
Daily Operations Briefing Monday, March 30, :30 a.m. EDT
 Daily Operations Briefing Monday, March 30, 2015 8:30 a.m. EDT Significant Activity: Mar 27 30 Significant Events: Pacific earthquakes; no tsunami Significant Weather: Snow Upper Great Lakes and Northern
W I N T E R STORM HAZARD DESCRIPTION
 W I N T E R STORM HAZARD DESCRIPTION... 1 LOCATION... 2 EXTENT... 2 HISTORICAL OCCURRENCES... 4 SIGNIFICANT PAST EVENTS... 4 PROBABILITY OF FUTURE EVENTS... 5 VULNERABILITY AND IMPACT... 5 HAZARD DESCRIPTION
Sunday, March 24, :30 a.m. EDT
 Sunday, March 24, 2019 8:30 a.m. EDT Significant Activity Mar 23-24 Significant Events: Flooding Central U.S. Tropical Activity: No activity affecting U.S. interests Significant Weather: Severe thunderstorms
Chapter 1 Study Guide
 Chapter 1 Study Guide Reminders: Vocabulary quiz and test will be on Tuesday, September 6th. Complete study guide and bring completed to school Friday, September 2nd. You are NOT required to print the
Daily Operations Briefing Thursday, January 8, :30 a.m. EST
 Daily Operations Briefing Thursday, January 8, 2015 8:30 a.m. EST Significant Activity: Jan 7-8 Significant Events: None Significant Weather: Snow Northern Rockies to Central Plains; Upper Mississippi
Climate Change and Climate Trends in Our Own Backyard
 Climate Change and Climate Trends in Our Own Backyard Dr. Mark Seeley Department of Soil, Water, and Climate University of Minnesota St Paul, MN 55108 For IATP: Winona Rural Climate Dialogue Citizen Jury
National Wildland Significant Fire Potential Outlook
 National Wildland Significant Fire Potential Outlook National Interagency Fire Center Predictive Services Issued: April 1, 2008 Next Issue: May 1, 2008 Wildland Fire Outlook April 2008 through July 2008
Daily Operations Briefing Sunday, January 15, :30 a.m. EST
 Daily Operations Briefing Sunday, January 15, 2017 8:30 a.m. EST Significant Activity Jan 14-15 Significant Events: Winter Storm central U.S. Significant Weather: Severe Thunderstorms TX Flash Flooding
Daily Operations Briefing Monday, March 13, :30 a.m. EDT
 Daily Operations Briefing Monday, March 13, 2017 8:30 a.m. EDT Significant Activity Mar 10-13 Significant Events: Nor easter Northeastern U.S. March 13-14 Significant Weather: Heavy snow possible Mid-Atlantic
STEUBEN COUNTY, NEW YORK. Hazard Analysis Report
 STEUBEN COUNTY, NEW YORK Hazard Analysis Report Prepared by: April 1, 2014 Background On April 1, 2014 the Steuben County Office of Emergency Management conducted a hazard analysis using the automated
Climate Change and Climate Trends in Our Own Backyard
 Climate Change and Climate Trends in Our Own Backyard Dr. Mark Seeley Department of Soil, Water, and Climate University of Minnesota St Paul, MN 55108 For IATP: Rural Climate Dialogue Grand Rapids, MN
Page 1. Name: 4) State the actual air pressure, in millibars, shown at Miami, Florida on the given weather map.
 State the actual air pressure, in millibars, shown at Miami, Florida on the given weather map.") Name: Questions 1 and 2 refer to the following: A partial station model and meteorological conditions table, as reported by the weather bureau in the city of Oswego, New York, are shown below. 1) Using
Name: Questions 1 and 2 refer to the following: A partial station model and meteorological conditions table, as reported by the weather bureau in the city of Oswego, New York, are shown below. 1) Using
Sediment Deposition LET THE RIVER RUN T E A C H E R. Activity Overview. Activity at a Glance. Time Required. Level of Complexity.
 Activity at a Glance Grade: 6 9 Subject: Science Category: Physical Science, Earth Science Topic: Deposition, River Systems Time Required Two 45-minute periods Level of Complexity Medium Materials* TI-73
Daily Operations Briefing Wednesday, March 1, :30 a.m. EST
 Daily Operations Briefing Wednesday, March 1, 2017 8:30 a.m. EST Significant Activity Feb 28-Mar 1 Significant Events: Severe Weather Midwest to East Coast Significant Weather: Severe Thunderstorms Lower
The Pennsylvania Observer
 The Pennsylvania Observer January 5, 2009 December 2008 Pennsylvania Weather Recap The final month of 2008 was much wetter than average and a bit colder than normal. In spite of this combination, most
Daily Operations Briefing Wednesday, May 3, :30 a.m. EDT
 Daily Operations Briefing Wednesday, May 3, 2017 8:30 a.m. EDT Significant Activity May 2-3 Significant Events: Flooding Southern/Central Plains Significant Weather: Severe thunderstorms possible Southern
Miami-Dade County Overview
 Miami-Dade County Overview 2,000 square miles World s busiest cruise port 2.6 million residents Second busiest US airport for international travelers Gateway to the Caribbean and Latin America Natural
Sunday, December 9, :30 a.m. EST
 Sunday, December 9, 2018 8:30 a.m. EST Significant Activity Dec 8-9 Significant Events: Winter Weather Southern U.S. Tropical Activity: Western Pacific No activity affecting U.S. interests Significant
National Situation Report As of 3:00 a.m. EDT Sunday, April 30, 2017
 Overview National Situation Report As of 3:00 a.m. EDT Sunday, April 30, 2017 Table Of Contents Current Operations Monitoring Recovery National Response Coordination Center: Not Activated National Watch
Daily Operations Briefing. Tuesday, June 27, :30 a.m. EDT
 Daily Operations Briefing Tuesday, June 27, 2017 8:30 a.m. EDT Significant Activity June 26-27 Significant Events: None Tropical Activity: Atlantic Disturbance 1: Low (near 0%) Eastern Pacific Hurricane
Daily Operations Briefing Monday, February 13, :30 a.m. EST
 Daily Operations Briefing Monday, February 13, 2017 8:30 a.m. EST Significant Activity Feb 10-13 Significant Events: Oroville Dam Spillway Erosion CA Significant Weather: Heavy Snow Southwest to Southern