Combining sensor and forecast information to aid decision making: real-time determination of hydrological peat fire risk in Kalimantan
|
|
|
- Logan Fletcher
- 5 years ago
- Views:
Transcription
1 Combining sensor and forecast information to aid decision making: real-time determination of hydrological peat fire risk in Kalimantan Jaap Schellekens Based on work by: Aljosja Hooijer, Ronald Vernimmen, Marnix vd Vat Peter Gijsbers, and Albrecht Weerts
2 Peat and Fire Overall research objective: Improve understanding of relations between SE Asian peatland hydrology (water management), peatland functioning (CO2 emissions, fire risk, production loss) and ecology (remaining forest values, rehabilitation options), in support of improved management. This presentation focusses on the possibilities for forecasting the hydrological peat fire risk using remotely sensed data and models


3 Large CO2 emissions by peat: Oxidation due to drainage Peat Fires

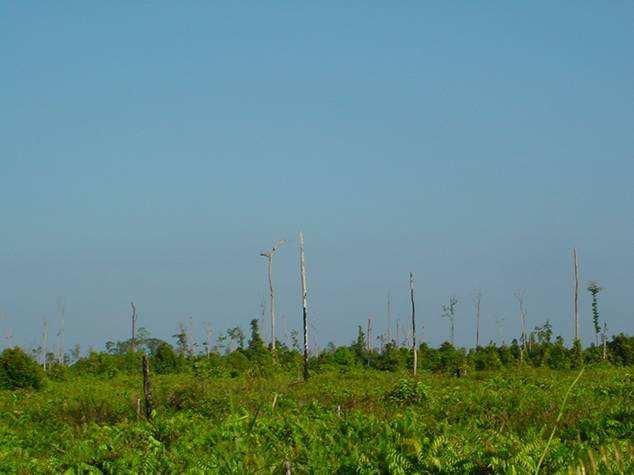
4 Why peat? Why Fires?
 water")

5 Why peat? Why Fires? Established (but poor) water management Previous peat level Leaning oil palms because of soft soils & subsidence
")

6 Why peat? Why Fires? Palm oil plantation Deep drainage (1-3m in canals) causing major CO2 emissions, fire risk and subsidence/production loss. Palm fruit (for oil) not sold because palm oil export as biofuel decreasing.
7 Processes Peat dome Clay / sand substrate 5 to 50 km 1 to 10 m Stream channel Natural situation: Water table close to surface Peat accumulation from vegetation over thousands of years Drainage: Water tables lowered Peat surface subsidence and CO 2 emission starts Continued drainage: Decomposition of dry peat: CO 2 emission High fire risk in dry peat: CO 2 emission Peat surface subsidence due to decomposition and shrinkage PEAT-CO2 / Delft Hydraulics End stage: Most peat carbon above drainage limit released to the atmosphere, unless conservation / mitigation measures are taken
8 Processes 120 CO2 emission (t ha-1 y-1) Ali and others 2006 Armentano and Menges 1986 Jauhiainen and others 2004 Melling and others 2005 Murayama and Bakar 1996 Wösten and Ritzema 2001 y=91x R2= Groundwater depth (m)
9 Relation water depth and fire risk Tentative relation established between peatland water depth and fire risk, by determining correlation between annual water depth and annual fire extent in a fire-prone area ( Block C in Central Kalimantan) as determined by timeseries analysis of burn scar extent (by University of Leicester). Number of days groundwater table below threshold value Area of Block C burnt (%) Days < -0.4m EMRP S Days <- 0.8m EMRP S Days < -1m EMRP S % Burnt = 0,17*GWD + 1,75 R2 = 0, Number of days GWD < -0.8 m (Block C South) 1995 Area of Block C burnt (%) % Burnt = 0.24*GWD R 2 = Number of days GWD < -1 m (Block C South) 2007
10 Peat fire forecasting systems Current fire forecasts are short-term and arguably of little use: no fire fighting response possible. Long-term forecast would allow some sort of fire prevention response..but this requires a far longer warning time than can be provided by current systems. At the same time global medium-term climate forecasts have improved a lot in recent years, and appear to now beat statistical methods GW Level as an indicator for peat fire risk?
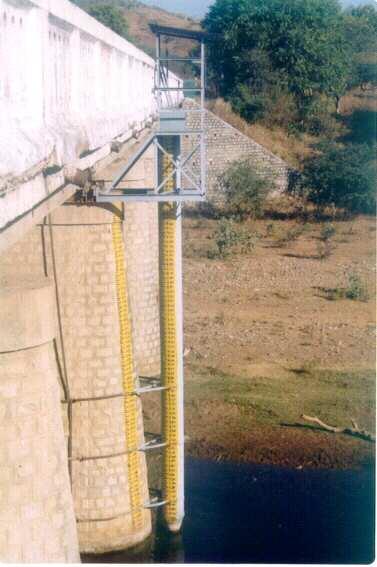
11 Simple water budget groundwater level model groundwater depth below surface (m) tr.1 measured (avg. 22 dipwells) modelled (forest) modelled (noforest) 8-Jun-04 5-Dec-04 3-Jun Nov May Nov-06 Model written in pcraster environment embedded in delft-fews. Allows gridded operation over SE Asia (only grid cells with peat land-cover) groundwater depth below surface (m) tr.2 measured (avg. 22 dipwells) modelled (forest) modelled (noforest) Jun-04 5-Dec-04 3-Jun Nov May Nov-06
12 Refine the research questions (1) Can the TRMM precipitation estimates be used to reliably (as good as the simulations with the ground based data) simulate peatland groundwater levels in the selected areas in Kalimantan? (2) Can a freely available seasonal forecast system be used to drive the groundwater model and what is the maximum lead time for which the peat fire risk can be forecasted? (3) Can Delft-FEWS be used to set-up a near real-time hydrological peatland fire risk forecasting system based on the available data?

 Palangka Raya - 2007 2002 2003 Palangkaraya Banjarmasin 2004 2005 0 0.")
 y = 0.9579x + 52.071 R 2 = 0.6138 Dry-season rainfall, Jul-Oct.")
13 TRMM input peatland fire forecasting TRMM satellite rainfall data shown to be comparable to ground based data, but more reliable and with much better spatial coverage TRMM sliding observed 30 day monthly P (mm) precipitation (mm) Palangka Raya (all months) Palangka Raya Palangkaraya Banjarmasin Mar Apr Jun Aug Sep Nov Jan measured measured monthly TRMM precipitation (mm) y = x R 2 = Dry-season rainfall, Jul-Oct. The extreme drought & fire years of 02 and 06 come out well. Regional variability is clear.
14 Testing model with different inputs Model results with TRMM are as good as those with measured P We can estimate the current GW level (and thus fire risk) with some confidence groundwater depth below surface [m] Measured groundwater depth Modelled - TRMM precipitation -1.2 Modelled - Measured precipitation 01-Jan Jan Jan-2008
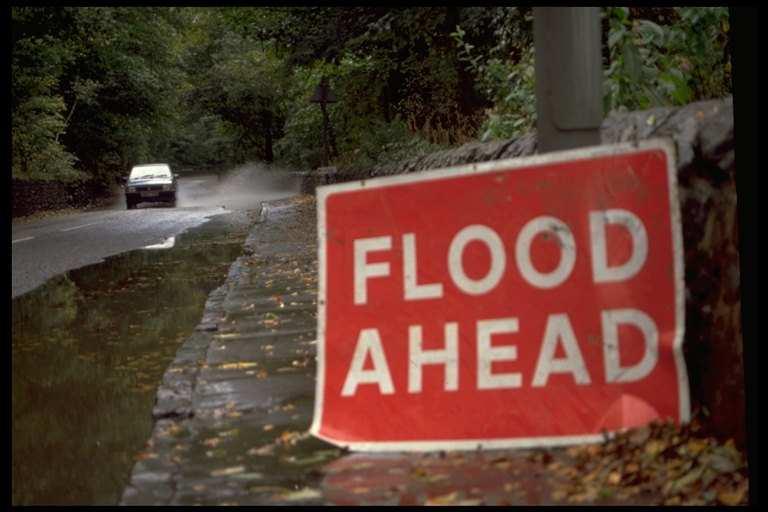
15 The fire warning process Detection Present state of the system (fire, dry soil..) Warning Dissemination to public and authorities Response Take action to reduce damage and loss of life
16 The fire warning process Increase lead time Detection Present state of the system (fire, dry soil..) Forecasting Future state of the system (fire, dry soil..) Warning Dissemination to public and authorities Response Take action to reduce damage and loss of life
17 Forecasting Now Historical run. Initial conditions updated regularly. Data source: TRMM Forecast, Run in ensemble mode source: CFS Monitoring Warning Response Forecasting groundwater depth below surface [m] Measured groundwater depth -1 Modelled - TRMM precipitation Modelled - Measured precipitation Jan Jan Jan-2008 Simulation
18 CFS Forecasts The NCEP Climate Forecast System (CFS) was developed at the Environmental Modeling Center at NCEP. It is a fully coupled model representing the interaction between the Earth's oceans, land and atmosphere. A description of the CFS is given in Saha et al, Four forecasts (ensemble members) per day available via ftp (grib format) Archive with retrospective forecasts (1981 to 2006) 1 forecast per month 15 ensemble members In general, the following steps must be taken to correct the raw forecast field and apply a (bias) correction: Retrieve the raw daily forecast Subtract the forecast climatological value (available for download) Add the observed climatological values (constructed from ERA 40 dataset)
19 Forecasting Evaluating forecast performance: retrospective forecasts for period with TRMM data ( ) Total of 26K forecasts processsing > 4TB of data in total Performed using Batch mode in Delft- 0 Fews Groundwater Level [m] TRMM 30 day 90 day 180 day 270 day Days since Sept
20 Results based on ensemble mean R2 (Nash/Sutcliff) Bias Lead Time All points Model Efficiency Bias MSE lead time (days) lead time (days) Mean sqr err all values <-0.1 < lead time (days) R2 (Nash/Sutcliff) lead time (days)
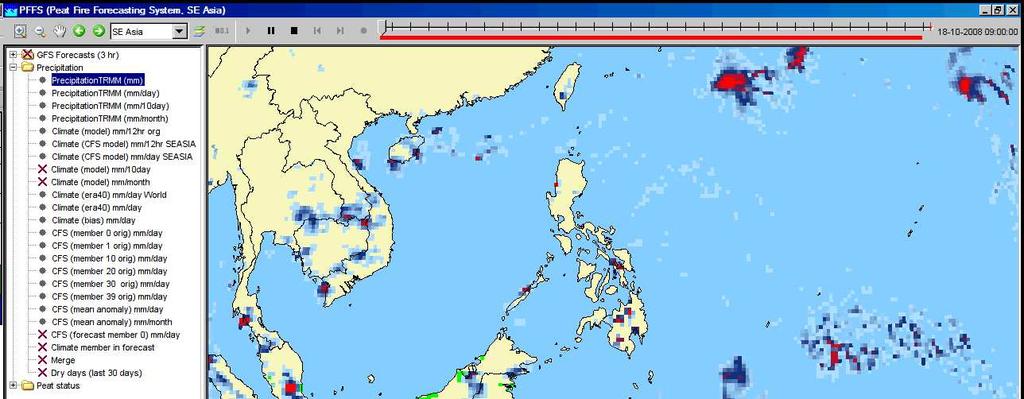
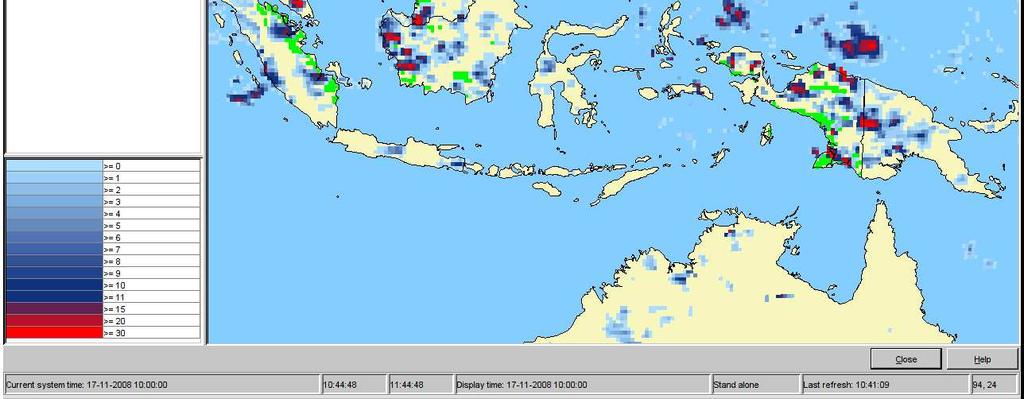
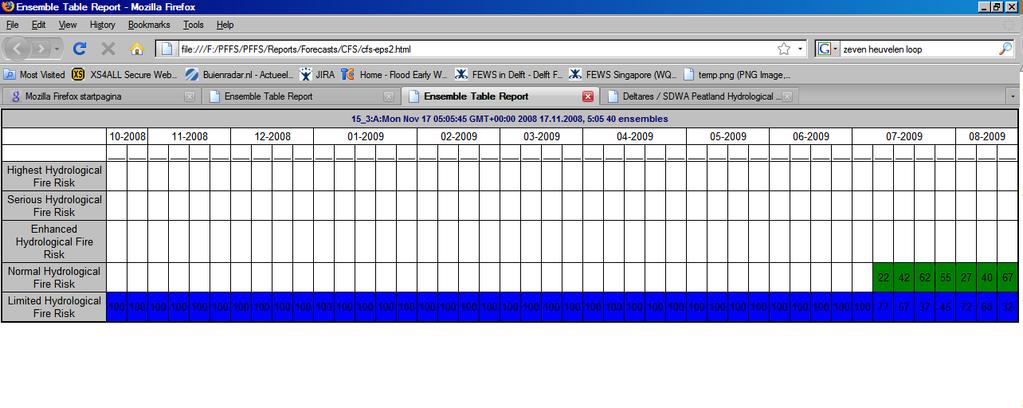
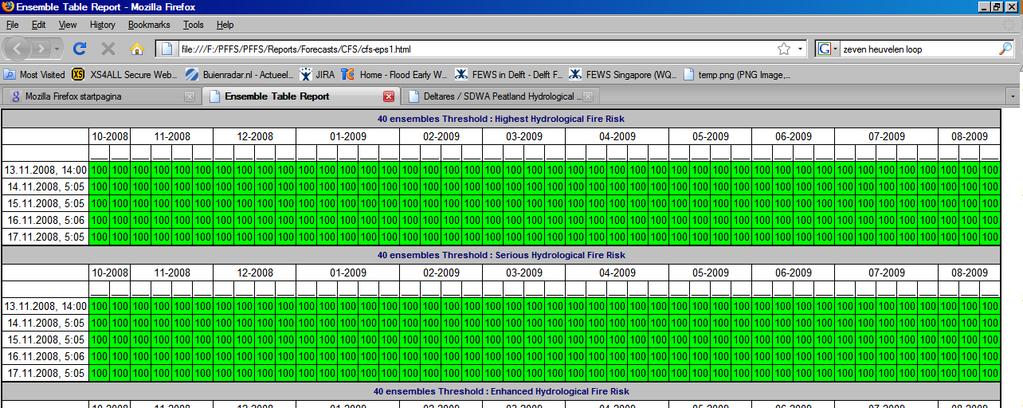
21 Making a system Setting up the Operational environment using Delft-Fews Reading TRMM, CFS, Climate data for bias correction Data processing Real time reports (web-based) CFS seasonal forecast grib files ftp pull Import directory for PFFS. Time lagged ensemble of 40 forecasts PFFS system Extract SE Asia from TRMM and CFS ftp pull Resample CFS and TRMM to daily TRMM data Merge TRMM and CFS to one continious series Run water budget model with forecast data (40 runs)


22 Forecasting System Delft-Fews Basic components of forecasting system Data Result Dissemination Model(s)
23 Delft FEWS: Open System (fewswiki.wldelft.nl) No implications when introducing new model concepts Maintain current models/investments Easily introduce new advances HD Model Model 1 Organisation Delft FEWS Model Current 2 University Model 3
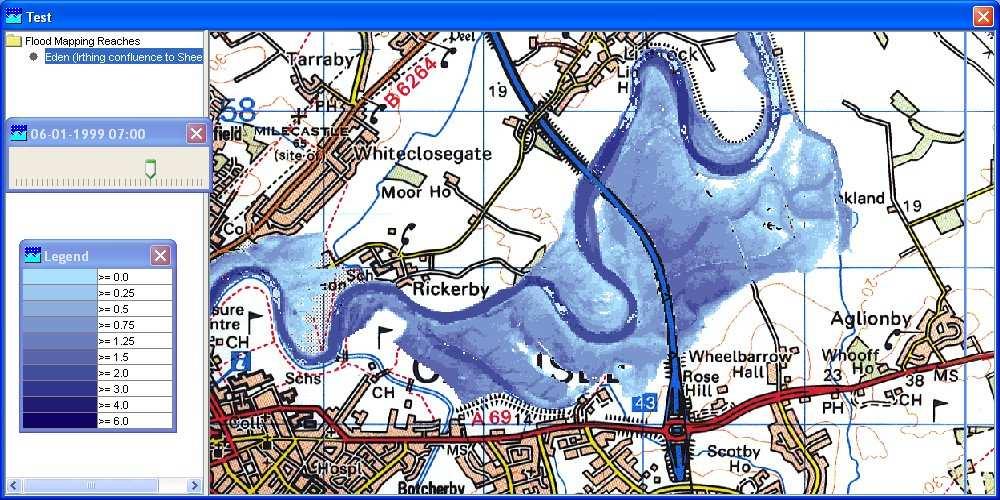
 in England & Wales Implementation")


 Replacing current RFS by CHPS (now")
24 Example National Flood Forecasting System (NFFS) in England & Wales Implementation Harmonisation of 8 regions with 8 different systems & procedures Complex methods and procedures Fluvial as well as coastal forecasting > 20 different model types > 2000 forecasting locations NWS (USA) Replacing current RFS by CHPS (now 2011)


25 WP4: RS input peatland fire forecasting

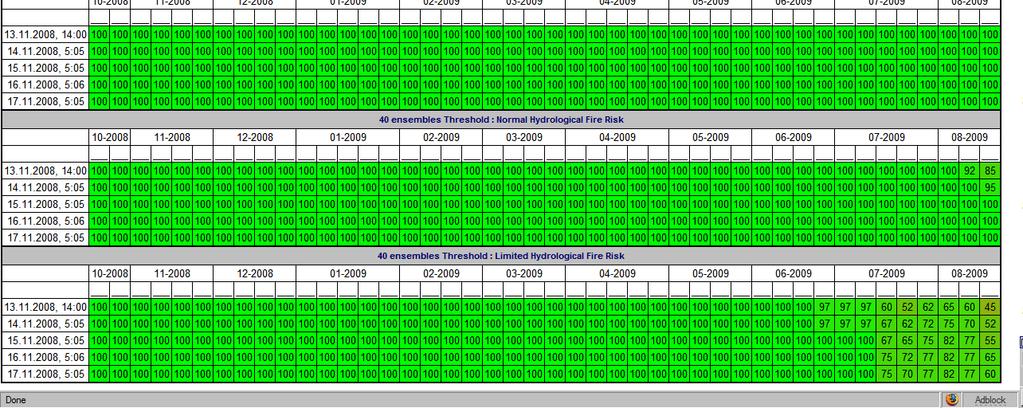
26 Reporting examples
27 Initial work done what now? Fully probabilistic determination of forecast performance Use other bias correction (climate), Bayesian statistics Use other and multi model forecast -> Contact with ECMWF Improve GW model (add ET?) Use remotely sensed soil moisture Improve relation Hydrological parameters to fire risk
APPLICATIONS OF DOWNSCALING: HYDROLOGY AND WATER RESOURCES EXAMPLES
 APPLICATIONS OF DOWNSCALING: HYDROLOGY AND WATER RESOURCES EXAMPLES Dennis P. Lettenmaier Department of Civil and Environmental Engineering For presentation at Workshop on Regional Climate Research NCAR
Seasonal Hydrometeorological Ensemble Prediction System: Forecast of Irrigation Potentials in Denmark
 Seasonal Hydrometeorological Ensemble Prediction System: Forecast of Irrigation Potentials in Denmark Diana Lucatero 1*, Henrik Madsen 2, Karsten H. Jensen 1, Jens C. Refsgaard 3, Jacob Kidmose 3 1 University
Climate Change and Arizona s Rangelands: Management Challenges and Opportunities
 Climate Change and Arizona s Rangelands: Management Challenges and Opportunities Mike Crimmins Climate Science Extension Specialist Dept. of Soil, Water, & Env. Science & Arizona Cooperative Extension
YACT (Yet Another Climate Tool)? The SPI Explorer
? The SPI Explorer") YACT (Yet Another Climate Tool)? The SPI Explorer Mike Crimmins Assoc. Professor/Extension Specialist Dept. of Soil, Water, & Environmental Science The University of Arizona Yes, another climate tool for
YACT (Yet Another Climate Tool)? The SPI Explorer Mike Crimmins Assoc. Professor/Extension Specialist Dept. of Soil, Water, & Environmental Science The University of Arizona Yes, another climate tool for
GAMINGRE 8/1/ of 7
 FYE 09/30/92 JULY 92 0.00 254,550.00 0.00 0 0 0 0 0 0 0 0 0 254,550.00 0.00 0.00 0.00 0.00 254,550.00 AUG 10,616,710.31 5,299.95 845,656.83 84,565.68 61,084.86 23,480.82 339,734.73 135,893.89 67,946.95
The 2010/11 drought in the Horn of Africa: Monitoring and forecasts using ECMWF products
 The 2010/11 drought in the Horn of Africa: Monitoring and forecasts using ECMWF products Emanuel Dutra Fredrik Wetterhall Florian Pappenberger Souhail Boussetta Gianpaolo Balsamo Linus Magnusson Slide
Recent peat fire trend in the Mega Rice Project (MRP) area in Central Kalimantan, Indonesia
 area in Central Kalimantan, Indonesia") Recent peat fire trend in the Mega Rice Project (MRP) area in Central Kalimantan, Indonesia Erianto Indra Putra Candidate for the Degree of Doctor of Philosophy Supervisor : Associate Prof. Hiroshi Hayasaka
Recent peat fire trend in the Mega Rice Project (MRP) area in Central Kalimantan, Indonesia Erianto Indra Putra Candidate for the Degree of Doctor of Philosophy Supervisor : Associate Prof. Hiroshi Hayasaka
Analyzing and Visualizing Precipitation and Soil Moisture in ArcGIS
 Analyzing and Visualizing Precipitation and Soil Moisture in ArcGIS Wenli Yang, Pham Long, Peisheng Zhao, Steve Kempler, and Jennifer Wei * NASA Goddard Earth Science Data and Information Services Center
Chiang Rai Province CC Threat overview AAS1109 Mekong ARCC
 Chiang Rai Province CC Threat overview AAS1109 Mekong ARCC This threat overview relies on projections of future climate change in the Mekong Basin for the period 2045-2069 compared to a baseline of 1980-2005.
S e a s o n a l F o r e c a s t i n g f o r t h e E u r o p e a n e n e r g y s e c t o r
 S e a s o n a l F o r e c a s t i n g f o r t h e E u r o p e a n e n e r g y s e c t o r C3S European Climatic Energy Mixes (ECEM) Webinar 18 th Oct 2017 Philip Bett, Met Office Hadley Centre S e a s
Stream Discharge and the Water Budget
 Regents Earth Science Unit 6: Water Cycle & Climate Name: Lab # Stream Discharge and the Water Budget Introduction: The United States Geological Survey (USGS) measures and publishes values for the daily
DROUGHT INDICES BEING USED FOR THE GREATER HORN OF AFRICA (GHA)
") DROUGHT INDICES BEING USED FOR THE GREATER HORN OF AFRICA (GHA) Christopher Oludhe IGAD Climate Prediction and Applications Centre (ICPAC) Inter-Regional Workshop on Indices and Early Warning Systems for
DROUGHT INDICES BEING USED FOR THE GREATER HORN OF AFRICA (GHA) Christopher Oludhe IGAD Climate Prediction and Applications Centre (ICPAC) Inter-Regional Workshop on Indices and Early Warning Systems for
Supplementary appendix
 Supplementary appendix This appendix formed part of the original submission and has been peer reviewed. We post it as supplied by the authors. Supplement to: Lowe R, Stewart-Ibarra AM, Petrova D, et al.
Missouri River Basin Water Management Monthly Update
 Missouri River Basin Water Management Monthly Update Participating Agencies 255 255 255 237 237 237 0 0 0 217 217 217 163 163 163 200 200 200 131 132 122 239 65 53 80 119 27 National Oceanic and Atmospheric
Impacts of climate change on flooding in the river Meuse
 Impacts of climate change on flooding in the river Meuse Martijn Booij University of Twente,, The Netherlands m.j.booij booij@utwente.nlnl 2003 in the Meuse basin Model appropriateness Appropriate model
Climate also has a large influence on how local ecosystems have evolved and how we interact with them.
 The Mississippi River in a Changing Climate By Paul Lehman, P.Eng., General Manager Mississippi Valley Conservation (This article originally appeared in the Mississippi Lakes Association s 212 Mississippi
Central Asia Regional Flash Flood Guidance System 4-6 October Hydrologic Research Center A Nonprofit, Public-Benefit Corporation
 http://www.hrcwater.org Central Asia Regional Flash Flood Guidance System 4-6 October 2016 Hydrologic Research Center A Nonprofit, Public-Benefit Corporation FFGS Snow Components Snow Accumulation and
Climate Variability in South Asia
 Climate Variability in South Asia V. Niranjan, M. Dinesh Kumar, and Nitin Bassi Institute for Resource Analysis and Policy Contents Introduction Rainfall variability in South Asia Temporal variability
Atmospheric circulation analysis for seasonal forecasting
 Training Seminar on Application of Seasonal Forecast GPV Data to Seasonal Forecast Products 18 21 January 2011 Tokyo, Japan Atmospheric circulation analysis for seasonal forecasting Shotaro Tanaka Climate
Climatography of the United States No
 Climate Division: AK 5 NWS Call Sign: ANC Month (1) Min (2) Month(1) Extremes Lowest (2) Temperature ( F) Lowest Month(1) Degree s (1) Base Temp 65 Heating Cooling 90 Number of s (3) Jan 22.2 9.3 15.8
Implications of Climate Change on Long Lead Forecasting and Global Agriculture. Ray Motha
 Implications of Climate Change on Long Lead Forecasting and Global Agriculture Ray Motha Source: http://www.coaps.fsu.edu/lib/climatoons/toon38.shtml ENSO Teleconnections 30 Observed Monthly Sea Surface
Introduction to TIGGE and GIFS. Richard Swinbank, with thanks to members of GIFS-TIGGE WG & THORPEX IPO
 Introduction to TIGGE and GIFS Richard Swinbank, with thanks to members of GIFS-TIGGE WG & THORPEX IPO GIFS-TIGGE/NCAR/NOAA Workshop on EPS developments, June 2012 TIGGE THORPEX Interactive Grand Global
Long-lead prediction of the 2015 fire and haze episode in Indonesia
 Long-lead prediction of the 2015 fire and haze episode in Indonesia Robert Field 1,2 Dilshad Shawki 3, Michael Tippett 2, Bambang Hero Saharjo 4, Israr Albar 5, Dwi Atmoko 6, Apostolos Voulgarakis 1 1.
Regional Drought and Crop Yield Information System to enhance drought monitoring and forecasting in Lower Mekong region
 Regional Drought and Crop Yield Information System to enhance drought monitoring and forecasting in Lower Mekong region Asian Disaster Preparedness Center/SERVIR-Mekong 2 Anticipated Results Improved capacity
statistical methods for tailoring seasonal climate forecasts Andrew W. Robertson, IRI
 statistical methods for tailoring seasonal climate forecasts Andrew W. Robertson, IRI tailored seasonal forecasts why do we make probabilistic forecasts? to reduce our uncertainty about the (unknown) future
BMKG Research on Air sea interaction modeling for YMC
 BMKG Research on Air sea interaction modeling for YMC Prof. Edvin Aldrian Director for Research and Development - BMKG First Scientific and Planning Workshop on Year of Maritime Continent, Singapore 27-3
Country Presentation-Nepal
 Country Presentation-Nepal Mt.Everest, Shiva Pd. Nepal, DHM South Asia Drought Monitor Workshop Dhaka Bangladesh 2 th April 215 Overview Brief Climatology Climate activities- DHM PPCR (Pilot Program for
Seasonal Hydrological Forecasting in the Berg Water Management Area of South Africa
 Seasonal Hydrological Forecasting in the Berg Water Management Area of South Africa Trevor LUMSDEN and Roland SCHULZE University of KwaZulu-Natal, South Africa OUTLINE Introduction Objectives Study Area
Climatic and Ecological Conditions in the Klamath Basin of Southern Oregon and Northern California: Projections for the Future
 Climatic and Ecological Conditions in the Klamath Basin of Southern Oregon and Northern California: Projections for the Future A Collaborative Effort by: CLIMATE LEADERSHIP INITIATIVE INSTITUTE FOR A SUSTAINABLE
Global Climates. Name Date
 Global Climates Name Date No investigation of the atmosphere is complete without examining the global distribution of the major atmospheric elements and the impact that humans have on weather and climate.
Description of Precipitation Retrieval Algorithm For ADEOS II AMSR
 Description of Precipitation Retrieval Algorithm For ADEOS II Guosheng Liu Florida State University 1. Basic Concepts of the Algorithm This algorithm is based on Liu and Curry (1992, 1996), in which the
Transboundary water management with Remote Sensing. Oluf Jessen DHI Head of Projects, Water Resources Technical overview
 Transboundary water management with Remote Sensing Oluf Jessen DHI Head of Projects, Water Resources Technical overview ozj@dhigroup.com Transboundary water management Water management across national
Missouri River Basin Water Management Monthly Update
 Missouri River Basin Water Management Monthly Update Participating Agencies 255 255 255 237 237 237 0 0 0 217 217 217 163 163 163 200 200 200 131 132 122 239 65 53 80 119 27 National Oceanic and Atmospheric
2015 Fall Conditions Report
 2015 Fall Conditions Report Prepared by: Hydrologic Forecast Centre Date: December 21 st, 2015 Table of Contents Table of Figures... ii EXECUTIVE SUMMARY... 1 BACKGROUND... 2 SUMMER AND FALL PRECIPITATION...
NATIONAL HYDROPOWER ASSOCIATION MEETING. December 3, 2008 Birmingham Alabama. Roger McNeil Service Hydrologist NWS Birmingham Alabama
 NATIONAL HYDROPOWER ASSOCIATION MEETING December 3, 2008 Birmingham Alabama Roger McNeil Service Hydrologist NWS Birmingham Alabama There are three commonly described types of Drought: Meteorological drought
Monitoring on Subsidence Claims. John Parvin Subsidence Claims Manager
 Monitoring on Subsidence Claims John Parvin Subsidence Claims Manager Key Milestones Subsidence cover 1972 Surge of claims1989/1990/1991 Project Management 1992 onwards Mitigation Surge 1995/2003 Delegated
Climate Change Impact Assessment on Indian Water Resources. Ashvin Gosain, Sandhya Rao, Debajit Basu Ray
 Climate Change Impact Assessment on Indian Water Resources Ashvin Gosain, Sandhya Rao, Debajit Basu Ray Objectives of the Study To quantify the impact of the climate change on the water resources of the
Global Flood Awareness System GloFAS
 Global Flood Awareness System GloFAS Ervin Zsoter with the help of the whole EFAS/GloFAS team Ervin.Zsoter@ecmwf.int 1 Reading, 8-9 May 2018 What is GloFAS? Global-scale ensemble-based flood forecasting
NOAA Soil Moisture Operational Product System (SMOPS): Version 2
: Version 2") CICS-MD Science Meeting (November 12-13, 2014) NOAA Soil Moisture Operational Product System (SMOPS): Version 2 Jicheng Liu 1, 2, Xiwu Zhan 2, Limin Zhao 3, Christopher R. Hain 1, 2, Li Fang 1,2, Jifu
CICS-MD Science Meeting (November 12-13, 2014) NOAA Soil Moisture Operational Product System (SMOPS): Version 2 Jicheng Liu 1, 2, Xiwu Zhan 2, Limin Zhao 3, Christopher R. Hain 1, 2, Li Fang 1,2, Jifu
REDWOOD VALLEY SUBAREA
 Independent Science Review Panel Conceptual Model of Watershed Hydrology, Surface Water and Groundwater Interactions and Stream Ecology for the Russian River Watershed Appendices A-1 APPENDIX A A-2 REDWOOD
Conditional weather resampling for ensemble streamflow forecasting
 Conditional weather resampling for ensemble streamflow forecasting Joost Beckers, Albrecht Weerts (Deltares Delft) Edwin Welles (Deltares USA) Ann McManamon (BPA) HEPEX 10 th anniversary workshop Washington
THE STATE OF SURFACE WATER GAUGING IN THE NAVAJO NATION
 THE STATE OF SURFACE WATER GAUGING IN THE NAVAJO NATION Aregai Tecle Professor of Hydrology Northern Arizona University Flagstaff, AZ Acknowledgement Many thanks to my research team mates and Elisabeth
OVERVIEW OF IMPROVED USE OF RS INDICATORS AT INAM. Domingos Mosquito Patricio
 OVERVIEW OF IMPROVED USE OF RS INDICATORS AT INAM Domingos Mosquito Patricio domingos.mosquito@gmail.com Introduction to Mozambique /INAM Introduction to AGRICAB/SPIRITS Objectives Material & Methods Results
Effects of climate change on landslide frequencies in landslide prone districts in Sri Lanka; Overview
 Effects of climate change on landslide frequencies in landslide prone districts in Sri Lanka; Overview T. D. Rathnaweera 1)., M. P. Palihawadana 2)., H. L. L. Rangana 3). and Dr. U. P. Nawagamuwa 4). Abstract
Aniekan Eyoh 1* Department of Geoinformatics & Surveying, Faculty of Environmental Studies, University of Uyo, Nigeria
 Available online at http://euroasiapub.org/journals.php, pp. 53~62 Thomson Reuters Researcher ID: L-5236-2015 TEMPORAL APPRAISAL OF LAND SURFACE TEMPERATURE DYNAMICS ACROSS THE NINE STATES OF NIGER DELTA
ECMWF: Weather and Climate Dynamical Forecasts
 ECMWF: Weather and Climate Dynamical Forecasts Medium-Range (0-day) Partial coupling Extended + Monthly Fully coupled Seasonal Forecasts Fully coupled Atmospheric model Atmospheric model Wave model Wave
Time Series Analysis
 Time Series Analysis A time series is a sequence of observations made: 1) over a continuous time interval, 2) of successive measurements across that interval, 3) using equal spacing between consecutive
Adaptation for global application of calibration and downscaling methods of medium range ensemble weather forecasts
 Adaptation for global application of calibration and downscaling methods of medium range ensemble weather forecasts Nathalie Voisin Hydrology Group Seminar UW 11/18/2009 Objective Develop a medium range
Toward a Fire and Haze Early Warning System for Southeast Asia
 FEATURED ARTICLES 13 Toward a Fire and Haze Early Warning System for Southeast Asia Jin Ho YOO a, Jaepil CHO a, Saji HAMEED b, Robert FIELD c, Kok Foo KWAN d, Israr ALBAR e APN Project Reference: / Received:
Seasonal Forecasting. Albrecht Weerts. 16 October 2014
 Seasonal Forecasting Albrecht Weerts ` Societal themes Mission: developing and applying top level expertise in the area of water, subsurface and infrastructure for people, planet and prosperity. Foundation
SPATIAL AND TEMPORAL PATTERN OF FOREST/PLANTATION FIRES IN RIAU, SUMATRA FROM 1998 TO 2000
 SPATIAL AND TEMPORAL PATTERN OF FOREST/PLANTATION FIRES IN RIAU, SUMATRA FROM 1998 TO 2000 SHEN Chaomin, LIEW Soo Chin, KWOH Leong Keong Centre for Remote Imaging, Sensing and Processing (CRISP) Faculty
Analysis of Radar-Rainfall Uncertainties and effects on Hydrologic Applications. Emad Habib, Ph.D., P.E. University of Louisiana at Lafayette
 Analysis of Radar-Rainfall Uncertainties and effects on Hydrologic Applications Emad Habib, Ph.D., P.E. University of Louisiana at Lafayette Motivation Rainfall is a process with significant variability
Geostatistical Analysis of Rainfall Temperature and Evaporation Data of Owerri for Ten Years
 Atmospheric and Climate Sciences, 2012, 2, 196-205 http://dx.doi.org/10.4236/acs.2012.22020 Published Online April 2012 (http://www.scirp.org/journal/acs) Geostatistical Analysis of Rainfall Temperature
BESPOKEWeather Services Monday Afternoon Update: SLIGHTLY BULLISH
 Monday Afternoon Update: SLIGHTLY BULLISH Report Summary: The September natural gas contract declined a bit less than a percent today, recovering through the afternoon after heavy selling this morning.
What is the difference between Weather and Climate?
 What is the difference between Weather and Climate? Objective Many people are confused about the difference between weather and climate. This makes understanding the difference between weather forecasts
Changing Hydrology under a Changing Climate for a Coastal Plain Watershed
 Changing Hydrology under a Changing Climate for a Coastal Plain Watershed David Bosch USDA-ARS, Tifton, GA Jeff Arnold ARS Temple, TX and Peter Allen Baylor University, TX SEWRU Objectives 1. Project changes
Missouri River Basin Water Management
 Missouri River Basin Water Management US Army Corps of Engineers Missouri River Navigator s Meeting February 12, 2014 Bill Doan, P.E. Missouri River Basin Water Management US Army Corps of Engineers BUILDING
Communicating Climate Change Consequences for Land Use
 Communicating Climate Change Consequences for Land Use Site: Prabost, Skye. Event: Kyle of Lochalsh, 28 th February 28 Further information: http://www.macaulay.ac.uk/ladss/comm_cc_consequences.html Who
Seasonal Climate Watch July to November 2018
 Seasonal Climate Watch July to November 2018 Date issued: Jun 25, 2018 1. Overview The El Niño-Southern Oscillation (ENSO) is now in a neutral phase and is expected to rise towards an El Niño phase through
Seasonal Climate Watch September 2018 to January 2019
 Seasonal Climate Watch September 2018 to January 2019 Date issued: Aug 31, 2018 1. Overview The El Niño-Southern Oscillation (ENSO) is still in a neutral phase and is still expected to rise towards an
Comparison of NASA AIRS and MODIS Land Surface Temperature and Infrared Emissivity Measurements from the EOS AQUA platform
 Comparison of NASA AIRS and MODIS Land Surface Temperature and Infrared Emissivity Measurements from the EOS AQUA platform Robert Knuteson, Steve Ackerman, Hank Revercomb, Dave Tobin University of Wisconsin-Madison
Presentation Overview. Southwestern Climate: Past, present and future. Global Energy Balance. What is climate?
 Southwestern Climate: Past, present and future Mike Crimmins Climate Science Extension Specialist Dept. of Soil, Water, & Env. Science & Arizona Cooperative Extension The University of Arizona Presentation
DROUGHT IN MAINLAND PORTUGAL
 DROUGHT IN MAINLAND Ministério da Ciência, Tecnologia e Ensino Superior Instituto de Meteorologia, I. P. Rua C Aeroporto de Lisboa Tel.: (351) 21 844 7000 e-mail:informacoes@meteo.pt 1749-077 Lisboa Portugal
AMPS Update June 2017
 AMPS Update June 2017 Kevin W. Manning Jordan G. Powers Mesoscale and Microscale Meteorology Laboratory National Center for Atmospheric Research Boulder, CO 12th Workshop on Antarctic Meteorology and Climate
Drought forecasting methods Blaz Kurnik DESERT Action JRC
 Ljubljana on 24 September 2009 1 st DMCSEE JRC Workshop on Drought Monitoring 1 Drought forecasting methods Blaz Kurnik DESERT Action JRC Motivations for drought forecasting Ljubljana on 24 September 2009
Climate Change Impact Assessment on Long Term Water Budget for Maitland Catchment in Southern Ontario
 215 SWAT CONFERENCE, PURDUE Climate Change Impact Assessment on Long Term Water Budget for Maitland Catchment in Southern Ontario By Vinod Chilkoti Aakash Bagchi Tirupati Bolisetti Ram Balachandar Contents
Minnesota s Climatic Conditions, Outlook, and Impacts on Agriculture. Today. 1. The weather and climate of 2017 to date
 Minnesota s Climatic Conditions, Outlook, and Impacts on Agriculture Kenny Blumenfeld, State Climatology Office Crop Insurance Conference, Sep 13, 2017 Today 1. The weather and climate of 2017 to date
Quenching the Valley s thirst: The connection between Sierra Nevada snowpack & regional water supply
 Quenching the Valley s thirst: The connection between Sierra Nevada snowpack & regional water supply Roger Bales, UC Merced Snow conditions Snow & climate change Research directions Sierra Nevada snow
Technical note on seasonal adjustment for M0
 Technical note on seasonal adjustment for M0 July 1, 2013 Contents 1 M0 2 2 Steps in the seasonal adjustment procedure 3 2.1 Pre-adjustment analysis............................... 3 2.2 Seasonal adjustment.................................
Lower Tuolumne River Accretion (La Grange to Modesto) Estimated daily flows ( ) for the Operations Model Don Pedro Project Relicensing
 Estimated daily flows ( ) for the Operations Model Don Pedro Project Relicensing") Lower Tuolumne River Accretion (La Grange to Modesto) Estimated daily flows (1970-2010) for the Operations Model Don Pedro Project Relicensing 1.0 Objective Using available data, develop a daily time series
Lower Tuolumne River Accretion (La Grange to Modesto) Estimated daily flows (1970-2010) for the Operations Model Don Pedro Project Relicensing 1.0 Objective Using available data, develop a daily time series
Funding provided by NOAA Sectoral Applications Research Project CLIMATE. Basic Climatology Colorado Climate Center
 Funding provided by NOAA Sectoral Applications Research Project CLIMATE Basic Climatology Colorado Climate Center Remember These? Factor 1: Our Energy Source Factor 2: Revolution & Tilt Factor 3: Rotation!
An Overview of Atmospheric Analyses and Reanalyses for Climate
 An Overview of Atmospheric Analyses and Reanalyses for Climate Kevin E. Trenberth NCAR Boulder CO Analysis Data Assimilation merges observations & model predictions to provide a superior state estimate.
Inter-linkage case study in Pakistan
 7 th GEOSS Asia Pacific Symposium GEOSS AWCI Parallel Session: 26-28 May, 2014, Tokyo, Japan Inter-linkage case study in Pakistan Snow and glaciermelt runoff modeling in Upper Indus Basin of Pakistan Maheswor
Will a warmer world change Queensland s rainfall?
 Will a warmer world change Queensland s rainfall? Nicholas P. Klingaman National Centre for Atmospheric Science-Climate Walker Institute for Climate System Research University of Reading The Walker-QCCCE
Missouri River Basin Water Management Monthly Update
 Missouri River Basin Water Management Monthly Update Participating Agencies 255 255 255 237 237 237 0 0 0 217 217 217 163 163 163 200 200 200 131 132 122 239 65 53 80 119 27 National Oceanic and Atmospheric
Climatography of the United States No
 Climate Division: CA 4 NWS Call Sign: Month (1) Min (2) Month(1) Extremes Lowest (2) Temperature ( F) Lowest Month(1) Degree s (1) Base Temp 65 Heating Cooling 100 Number of s (3) Jan 56.4 43.6 50.0 77
Seasonal Climate Watch June to October 2018
 Seasonal Climate Watch June to October 2018 Date issued: May 28, 2018 1. Overview The El Niño-Southern Oscillation (ENSO) has now moved into the neutral phase and is expected to rise towards an El Niño
Climatography of the United States No
 Climate Division: CA 5 NWS Call Sign: Month (1) Min (2) Month(1) Extremes Lowest (2) Temperature ( F) Lowest Month(1) Degree s (1) Base Temp 65 Heating Cooling 100 Number of s (3) Jan 56.6 36.5 46.6 81
Climatography of the United States No
 Climate Division: CA 4 NWS Call Sign: Month (1) Min (2) Month(1) Extremes Lowest (2) Temperature ( F) Lowest Month(1) Degree s (1) Base Temp 65 Heating Cooling 100 Number of s (3) Jan 55.6 39.3 47.5 77
Climatography of the United States No
 Climate Division: CA 1 NWS Call Sign: Month (1) Min (2) Month(1) Extremes Lowest (2) Temperature ( F) Lowest Month(1) Degree s (1) Base Temp 65 Heating Cooling 100 Number of s (3) Jan 57.9 38.9 48.4 85
Climatography of the United States No
 Climate Division: CA 5 NWS Call Sign: Month (1) Min (2) Month(1) Extremes Lowest (2) Temperature ( F) Lowest Month(1) Degree s (1) Base Temp 65 Heating Cooling 100 Number of s (3) Jan 44.8 25.4 35.1 72
Climatography of the United States No
 Climate Division: CA 4 NWS Call Sign: Month (1) Min (2) Month(1) Extremes Lowest (2) Temperature ( F) Lowest Month(1) Degree s (1) Base Temp 65 Heating Cooling 100 Number of s (3) Jan 49.4 37.5 43.5 73
Climatography of the United States No
 Climate Division: CA 6 NWS Call Sign: Month (1) Min (2) Month(1) Extremes Lowest (2) Temperature ( F) Lowest Month(1) Degree s (1) Base Temp 65 Heating Cooling 100 Number of s (3) Jan 69.4 46.6 58.0 92
Climatography of the United States No
 Climate Division: CA 1 NWS Call Sign: Month (1) Min (2) Month(1) Extremes Lowest (2) Temperature ( F) Lowest Month(1) Degree s (1) Base Temp 65 Heating Cooling 1 Number of s (3) Jan 57.8 39.5 48.7 85 1962
Climatography of the United States No
 Climate Division: CA 6 NWS Call Sign: Month (1) Min (2) Month(1) Extremes Lowest (2) Temperature ( F) Lowest Month(1) Degree s (1) Base Temp 65 Heating Cooling 1 Number of s (3) Jan 67.5 42. 54.8 92 1971
Climatography of the United States No
 Climate Division: CA 4 NWS Call Sign: Month (1) Min (2) Month(1) Extremes Lowest (2) Temperature ( F) Lowest Month(1) Degree s (1) Base Temp 65 Heating Cooling 1 Number of s (3) Jan 58.5 38.8 48.7 79 1962
Remote Sensing Applications for Drought Monitoring
 Remote Sensing Applications for Drought Monitoring Amir AghaKouchak Center for Hydrometeorology and Remote Sensing Department of Civil and Environmental Engineering University of California, Irvine Outline
Global climate predictions: forecast drift and bias adjustment issues
 www.bsc.es Ispra, 23 May 2017 Global climate predictions: forecast drift and bias adjustment issues Francisco J. Doblas-Reyes BSC Earth Sciences Department and ICREA Many of the ideas in this presentation
Jackson County 2013 Weather Data
 Jackson County 2013 Weather Data 61 Years of Weather Data Recorded at the UF/IFAS Marianna North Florida Research and Education Center Doug Mayo Jackson County Extension Director 1952-2008 Rainfall Data
Water Management for Environmental Restoration Flows In the Big Bend reach, Rio Grande Rio Bravo
 University of California, Davis Department of Land, Air and Water Resources Water Management for Environmental Restoration Flows In the Big Bend reach, Rio Grande Rio Bravo 46 th Annual Meeting 8 9 March,
Disaster Monitoring with Remote Sensing at CRISP, NUS
 Disaster Monitoring with Remote Sensing at CRISP, NUS KWOH, Leong Keong Director, CRISP The 3rd Sentinel Asia Joint Project Team Meeting (JPTM) Le Meridien Hotel, Singapore 13-15 March 2007 6 metre Antenna
Climatography of the United States No
 Climate Division: ND 8 NWS Call Sign: BIS Month (1) Min (2) Month(1) Extremes Lowest (2) Temperature ( F) Lowest Month(1) Degree s (1) Base Temp 65 Heating Cooling 100 Number of s (3) Jan 21.1 -.6 10.2
Climatography of the United States No
 Climate Division: TN 1 NWS Call Sign: Month (1) Min (2) Month(1) Extremes Lowest (2) Temperature ( F) Lowest Month(1) Degree s (1) Base Temp 65 Heating Cooling 100 Number of s (3) Jan 47.6 24.9 36.3 81
Climatography of the United States No
 Climate Division: CA 5 NWS Call Sign: FAT Month (1) Min (2) Month(1) Extremes Lowest (2) Temperature ( F) Lowest Month(1) Degree s (1) Base Temp 65 Heating Cooling 1 Number of s (3) Jan 53.6 38.4 46. 78
Climatography of the United States No
 Climate Division: CA 6 NWS Call Sign: 1L2 N Lon: 118 3W Month (1) Min (2) Month(1) Extremes Lowest (2) Temperature ( F) Lowest Month(1) Degree s (1) Base Temp 65 Heating Cooling 1 Number of s (3) Jan 63.7
US Drought Status. Droughts 1/17/2013. Percent land area affected by Drought across US ( ) Dev Niyogi Associate Professor Dept of Agronomy
 Dev Niyogi Associate Professor Dept of Agronomy") Droughts US Drought Status Dev Niyogi Associate Professor Dept of Agronomy Deptof Earth Atmospheric Planetary Sciences Indiana State Climatologist Purdue University LANDSURFACE.ORG iclimate.org climate@purdue.edu
Droughts US Drought Status Dev Niyogi Associate Professor Dept of Agronomy Deptof Earth Atmospheric Planetary Sciences Indiana State Climatologist Purdue University LANDSURFACE.ORG iclimate.org climate@purdue.edu
Prairie Climate Centre Prairie Climate Atlas. Visualizing Climate Change Projections for the Canadian Prairie Provinces
 Prairie Climate Centre Prairie Climate Atlas Visualizing Climate Change Projections for the Canadian Prairie Provinces Acknowledgements About Us Dr. Danny Blair Dr. Ian Mauro Ryan Smith, MSc Dr. Hank Venema
Seasonal Climate Watch April to August 2018
 Seasonal Climate Watch April to August 2018 Date issued: Mar 23, 2018 1. Overview The El Niño-Southern Oscillation (ENSO) is expected to weaken from a moderate La Niña phase to a neutral phase through
Climatography of the United States No
 Climate Division: CA 5 NWS Call Sign: BFL Month (1) Min (2) Month(1) Extremes Lowest (2) Temperature ( F) Lowest Month(1) Degree s (1) Base Temp 65 Heating Cooling 1 Number of s (3) Jan 56.3 39.3 47.8
2016 Meteorology Summary
 2016 Meteorology Summary New Jersey Department of Environmental Protection AIR POLLUTION AND METEOROLOGY Meteorology plays an important role in the distribution of pollution throughout the troposphere,