UNDERSTANDING GREAT LAKES WATER LEVEL FLUCTUATIONS AND CURRENT CONDITIONS APRIL 2013
|
|
|
- Darren White
- 5 years ago
- Views:
Transcription
 226-6442 Keith.W.Kompoltowicz@usace.army.mil Eric Tauriainen Chief, Hydraulic Engineering Branch (313) 226-4886 Eric.C.Tauriainen@usace.")
1 UNDERSTANDING GREAT LAKES WATER LEVEL FLUCTUATIONS AND CURRENT CONDITIONS IL 213 John Allis Chief, Great Lakes Hydraulics and Hydrology Office (313) Keith Kompoltowicz Chief, Watershed Hydrology Branch (313) Eric Tauriainen Chief, Hydraulic Engineering Branch (313)
2 Table of Contents Introduction...2 Understanding Great Lakes Water Level Fluctuations...2 Descriptions of the major components causing Great Lakes water levels to rise and fall Current Great Lakes Water Level Conditions.4 A lake by lake listing of current and forecasted water levels and the contributions of hydrologic parameters Appendix A: Figures Figure 1 The Great Lakes Basin.6 Map showing the outline of the Great Lakes drainage basin, noting that 1/3 of this area is the actual lake surface itself Figure 2 Great Lakes System Profile 7 Figure showing the step like profile of the system, falling about 6 feet from Lake Superior to the Atlantic Ocean Figure 3 Great Lakes Water Levels... 8 Hydrographs showing the monthly lake level fluctuations for all lakes over the period , from record lows to record highs Figure 4 Monthly Bulletin of Water Levels for the Great Lakes The official 6 month forecast for the Great Lakes Figure 5 Current Precipitation Values.1 Graphic for each lake showing the last 3 years of precipitation values compared to their long-term average Figure 6 Current Evaporation Values.11 Graphic for each lake showing the last 4 years of evaporation values, expressed as a positive or negative difference from their long-term average Figure 7 Hydrologic Components A graphical representation of the magnitude of the contribution of runoff, precipitation, outflow and evaporation to the water supply for each lake Figure 8 Current Lake Levels 13 Appendix B: Water Level Talking Points...14 Appendix C: Water Level Summary...16 Narrative describing recent water level conditions Appendix D: Useful Great Lakes Web Addresses..17 A listing of web sites containing a variety of Great Lakes information
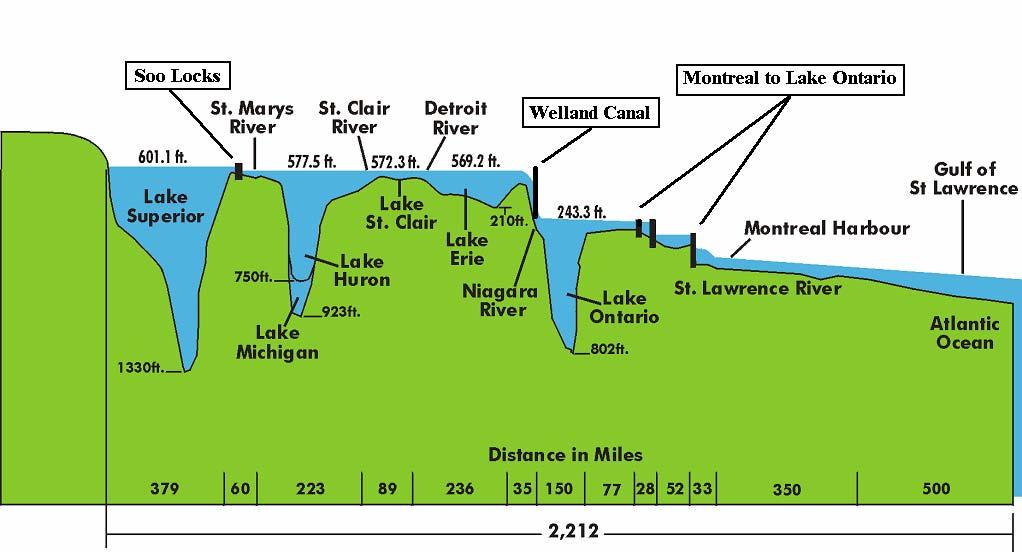
3 Introduction This document is provided as a means to help people become more informed on the science behind the fluctuations in Great Lakes water levels. Conditions have been drier than normal in recent years, leading to below average water levels on all of the Great Lakes. Lake Michigan- Huron set a new all-time record low water level in January 213. Water level fluctuations are primarily driven by the natural hydrologic cycle with only minor influences from humans. Information is presented on the Great Lakes basin in general, the driving forces behind why the levels rise and fall, and more detailed data on recent precipitation, evaporation and river flows that play a key role in current water level conditions. Understanding Great Lakes Water Level Fluctuations The Great Lakes and St. Lawrence River are a dynamic system. The Great Lakes basin covers more than 94, square miles of water and more than twice as much land. It includes part or all of eight U.S. states and two Canadian provinces as shown in Figure 1. The profile of the system is depicted in Figure 2 and shows a series of steps leading from Lake Superior at the headwaters down to the Atlantic Ocean. The St. Marys River flows from Lake Superior to Lake Huron. Lakes Michigan and Huron are connected by the broad and deep Straits of Mackinac and are considered to be one lake hydraulically, with levels rising and falling together. The St. Clair and Detroit rivers, with Lake St. Clair in between, connect Lake Huron with Lake Erie. The Niagara River then links Lake Erie with Lake Ontario, including the dramatic drop over Niagara Falls. The man-made Welland Canal also links Lakes Erie and Ontario, providing a detour around the Falls. From Lake Ontario, water flows into the St. Lawrence River, which converges with the Ottawa River and flows on to the Atlantic Ocean. Since the retreat of the glaciers, water levels have undergone dramatic fluctuations, as much as hundreds of feet. Figure 3 shows the water level ranges of the Great Lakes over the last 95 years, based on monthly lake-wide averages for each lake. The difference between the amount of water coming into a lake and the amount going out is the determining factor in whether the water level will rise, fall or remain stable. Moisture is carried into the Great Lakes basin by continental air masses originating in the northern Pacific Ocean, tropical systems originating in the Gulf of Mexico, or Arctic systems originating in the far north. As these weather systems move through, they deposit moisture in the form of rain, snow, hail or sleet. Water enters the lakes through precipitation on the lake, runoff from surrounding land, groundwater inflow and inflow from upstream lakes. Figure 5 shows the precipitation values for each lake, for the last few years compared to average. Water leaves the lakes through evaporation from the water surfaces, groundwater outflow, consumptive use, diversions and outflows to downstream lakes or rivers. Evaporation is a major factor when warm lake surfaces come in contact with cool, dry air. Figure 6 shows the evaporation values for each lake, for the last few years compared to average. Water levels fluctuate on a short-term basis, usually due to winds and changes in barometric pressure lasting from a couple of hours to several days. The lakes also fluctuate on a seasonal cycle each year. Levels decline to their lowest level in the winter months because more water leaves the lake through evaporation (greatest in the fall and early winter), and precipitation falling as snow can accumulate on the land during winter. As the snow melts in the spring, 2
4 runoff increases. Precipitation in the spring primarily falls as rain and can also contribute to higher runoff. Generally, evaporation is least during spring and early summer. These factors contribute to more water entering the lakes than leaving, so water levels rise to their summer peak. Long-term fluctuations occur over periods of consecutive years. Continuous wet and cold years will cause levels to rise, while warm and dry years will cause levels to decline. Figure 7 shows the hydrologic components that make up the water supply to each of the lakes and the percentage they contribute. Crustal movement, the rebounding of the earth s crust from the removed weight of the glaciers, does not change the amount of water in a lake, but rather the water depths along the shoreline of each lake. Rebound rates vary across the Great Lakes basin, with the crust rising at the highest rate in the northern portion of the basin, where the ice was thickest, heaviest and last to retreat. In the southern portion of the basin, rebound rates are much slower. As a result, the Great Lakes basin is gradually tipping. There are five diversions in the Great Lakes basin. The Long Lac and Ogoki diversions bring water into Lake Superior from the Hudson Bay watershed. The Lake Michigan Diversion at Chicago removes water from Lake Michigan for water supply, sewage disposal and commercial navigation. The Welland Canal provides a shipping route around Niagara Falls and moves water from Lake Erie to Ontario that would have naturally flowed down the Niagara River. The New York State Barge Canal diverts a small amount of water from the Niagara River and returns the water to Lake Ontario. In all, the net amount of water diverted into the Great Lakes basin exceeds that diverted out. Lake Superior outflows are controlled near the twin cities of Sault Ste. Marie, Ontario and Michigan. The current flow control facilities consist of three hydropower plants, five navigation locks and a 16-gated control structure, called the Compensating Works. Lake Superior outflows have been regulated since 1921 by the International Lake Superior Board of Control in accordance with conditions specified by the International Joint Commission (IJC). The IJC, a binational agency of the United States and Canada, is responsible for oversight of the terms of the 199 Boundary Waters Treaty between the two nations. Lake Superior s outflows are adjusted monthly, taking into consideration the water levels of lakes Superior and Michigan- Huron. The objective is to help maintain the lake levels on both lakes in relative balance compared to their long-term seasonal averages. Regulation of Lake Superior s outflow has an effect on water levels, but to a far lesser extent than natural factors. There have been numerous alterations made to the St. Clair River since the mid 18s, mainly for the support of commercial navigation. While much of the dredging has been performed by USACE, they have been internationally developed and approved projects to benefit the Great Lakes region. The last major deepening, for the 27 foot navigation project in the St. Clair River, was completed in Studies completed at that time determined that all the dredging in the St. Clair River since the mid-18s would lower Lake Michigan-Huron water levels 1 to 16 inches. These studies included preliminary investigations into types of structures that could be constructed to mitigate for the lower levels experienced due to the projects. Authorization from the 195s (for the 196s deepening project) to study and construct structures for compensation may remain and the Corps is currently verifying that authorization status. The recently completed International Upper Great Lakes Study (IUGLS), which was commissioned by the International Joint Commission (IJC), investigated changes in flows through the St. Clair River and possible drivers for changes in water level relationships between Lake Michigan-Huron and Erie. You can find this report at the IUGLS website at 3
5 Current Great Lakes Water Level Conditions Current Great Lakes water levels for 212 and 213, as well as forecasted levels to September 213 are shown in Figures 4 and 8. Note that currently all of the Great Lakes are below last year s levels and their long-term averages. In January 213, Lake Michigan-Huron s water level of ft was the lowest water level for any month for the entire period of record, which dates back to The previous all-time record low was set in March at ft. Lakes Superior, St. Clair, Erie, and Ontario are not forecasted to set record low water levels. Figure 5 shows the monthly precipitation values since January 21 as compared to their monthly averages, while Figure 6 shows the monthly evaporation since January 29, in terms of their difference above or below average. This information provides insight into the differing hydrologic conditions experienced across the Great Lakes basin in the last few years. Lake Superior s monthly average water level for March 213 (6.1 ft) was seven inches above the lowest recorded level of March ( ft) which was set in. The current forecast shows the water level of Lake Superior remaining well below its long-term average but above its record low water levels during the next six months. Since April 1998 Lake Superior has been below its long-term average ( ) and is currently in the longest period of below average water levels in recorded history. Natural factors contributing to recent low water levels on Lake Superior include: Evaporation in 212 was 14 inches greater than average Evaporation in 211 was 8 inches more than average Evaporation in 21 was 5 inches above average Precipitation in 212 was 3 inches less than average Precipitation in 211 was 3 inches less than average Precipitation in 21 was nearly 2 inches below average Lake Michigan-Huron has been below long-term average water levels since January 1999 and is currently in its longest period of below average water levels in recorded history. The January 213 level of ft broke the previous all time record low water level for any month. Since then, the water level has risen slightly and the March 213 water level was two inches above the lowest recorded level of March (576.5 ft) which was set in. The most probable forecast for the next six months shows Michigan-Huron remaining 2 to 4 inches ABOVE record lows through September. Natural factors contributing to recent low levels on Lake Michigan- Huron include: Evaporation in 212 was 12 inches greater than average Evaporation in 211 was near average Evaporation in 21 was 5 inches above average Precipitation in 212 was 4 inches below average Precipitation in 211 was 3 inches above average Precipitation in 21 was 1 inch below average 4
6 Lake St. Clair began 212 with above average water levels but has since fallen to below average levels. It is currently 1 inches below average and 14 inches below last year s levels. The most probable forecast for the next six months shows the lake remaining below average and last year s levels, but above its record lows. Significant natural factors include: Evaporation in 212 was 3 inches greater than average Evaporation in 211 was 6 inches below average Evaporation in 21 was 9 inches above average Precipitation in 212 was 2 inches less than average Precipitation in 211 was 1 inches greater than average Precipitation in 21 was near average Lake Erie was above, below and at average water levels in 212. It is currently 6 inches below average and 17 inches below last year s levels. Lake Erie had no seasonal rise during 212, which is the first such occurrence in the period of record. The most probable forecast for the next six months shows the lake will remain below average and last year s level, but well above its record low levels. Significant natural factors include: Evaporation in 212 was 13 inches greater than average Evaporation in 211 was 3 inches below average Evaporation in 21 was 6 inches above average Precipitation in 212 was 4 inches less than average Precipitation in 211 was 16 inches above average Precipitation in 21 was near average Lake Ontario was also above, below and at average water levels in 212. It is currently 4 inches below average and 15 inches below last year s levels. The most probable forecast for the next six months shows the lake will return to last year s levels in June and also return to its long-term average in July 213. Lake Ontario is forecasted to remain more than 2 feet above its record low levels. Significant natural factors include: Evaporation in 212 was 11 inches greater than average Evaporation in 211 was 1 inch more than average Evaporation in 21 was 5 inches above average Precipitation in 212 was 5 inches less than average Precipitation in 211 was 4 inches above average Precipitation in 21 was 1 inch below average Forecasted water levels are highly dependent on the supply of water the lakes are expected to receive over the coming months. The U.S. Army Corps of Engineers, in coordination with Environment Canada, will continue to monitor basin conditions and provide updated information on our website at Additional web links of interest are listed in Appendix D. 5
7 Minnesota Duluth Missi ssippi Wisconsin Illinois Albany R i ive r B a s n Riv er Chicago Sanitary & Ship Canal Illinois Waterway Bas in Lake Nipigon Thunder Bay Lake Green Bay Milwaukee Ogoki Project Nipigon River Chicago Ogoki River Superior Lake Keweenaw Peninsula Green Bay ig n Mich a Indiana Albany Diversion Dam Control Dam Diversion Dam Long Lake Great Long Lake Project Control Dam Aguasabon River Canada United States Sault Ste. Marie Straits Of Mackinac Lakes Kenogami River Michigan Bay City St. Clair River Lake St. Clair Detroit Detroit River Toledo Ohio River Ontario Sault Ste. Marie Lake Superior Control Structure St. Marys River Lake Drainage Cleveland Georgian Bay Great Lakes - St. Lawrence River System Huron Lake Erie Hudson Bay The Great Lakes Basin 14, miles of shoreline 95, square miles of water 2, square miles of land 8 States & 2 Provinces Basin Toronto Welland Canal Ottawa Lake Pennsylvania PENNSYLVANIA Ontario Quebec Oswego Rochester Niagara River Buffalo Niagara Falls River Ottawa Cornwall Massena St. Lawrence River Kingston Cape Vincent New York Montreal LAKE ST. LOUIS St. Lawrence River Control structure
8
9 meters meters meters meters Lake Superior Lake Michigan-Huron Great Lakes Water Levels ( ) Monthly Mean Level Long Term Annual Average Lake St. Clair meters Lake Erie Lake Ontario The monthly average levels are based on a network of water level gages located around the lakes. Elevations are referenced to the International Great Lakes Datum () feet feet feet feet feet
10 Ft. JUN OCT NOV DEC JAN FEB JUN OCT NOV DEC JAN FEB JUN US Army Corps -1 CHART DATUM 61.1 FEET (183.2 METERS) LAKE SUPERIOR of Engineers Detroit District MONTHLY BULLETIN OF LAKE LEVELS FOR THE Ft. JUN 211 OCT NOV DEC JAN FEB 212 JUN OCT NOV DEC JAN FEB 213 JUN GREAT LAKES IL Water levels for the previous year and the current year to date are shown as a solid line on the hydrographs. A projection for the next six months is given as a dashed line. This Ft Ft CHART DATUM FEET (176. METERS) LAKES MICHIGAN-HURON 211 JUN OCT NOV DEC JAN FEB CHART DATUM FEET (174.4 METERS) LAKE ST. CLAIR 211 JUN OCT NOV DEC JAN FEB JUN 212 JUN OCT OCT NOV NOV 212 DEC DEC 1965 JAN 1936 JAN 1987 FEB FEB JUN 213 JUN ELEVATIONS REFERENCED TO THE CHART DATUM OF EACH RESPECTIVE LAKE projection is based on the present condition of the lake basin and anticipated future weather. The shaded area shows a range of possible levels over the next six months dependent upon weather variations. Current and projected levels (solid and dashed lines) can be compared with the average levels (dotted line) and extreme levels (shown as bars with their year of occurrence). The legend below further identifies the information on the hydrographs. LEGEND LAKE LEVELS RECORDED PROJECTED AVERAGE ** MAXIMUM ** MINIMUM ** 1936 The levels on the hydrographs are shown in both feet and meters above (+) or below (-) Chart Datum. Chart Datum, also known as Low Water Datum, is a reference plane on each lake to which water depth and Federal navigation improvement depths on navigation charts are referred. All elevations and plots shown in this bulletin are referenced to International Great Lakes Datum (IGLD ). IGLD has its zero base at Rimouski, Quebec near the mouth of the St. Lawrence River (approximate sea level). CH MEAN LAKE LEVELS (IGLD ) Superior Mich- Huron St. Clair Erie Ontario -1 CHART DATUM FEET (173.5 METERS) LAKE ERIE * 213 Ft Ft Ft Ft. JUN OCT NOV DEC JAN FEB JUN OCT NOV DEC JAN FEB JUN ** MAX Yr. Ft ** MIN. Yr ** AVG. Ft * provisional ** Average, Maximum and Minimum for period CHART DATUM FEET (74.2 METERS) LAKE ONTARIO
11 Lake Superior Precipitation (21-213) Lake Michigan-Huron Precipitation (21-213) Precip (in) Jan-1 Jan-11 Jan-12 Jan-13 Precip (in) Jan-1 Jan-11 Jan-12 Jan-13 Lake St. Clair Precipitation (21-213) Lake Erie Precipitation (21-213) Precip (in) Jan-1 Jan-11 Jan-12 Jan-13 Precip (in) Jan-1 Jan-11 Jan-12 Jan-13 Lake Ontario Precipitation (21-213) U.S. Army Corps of Engineers Detroit District Precip (in) Jan-1 Jan-11 Jan-12 Jan-13 Actual Average 15-Apr-13
12 6 Evaporation on Lake Superior 6 Evaporation on Lake Michigan-Huron Difference from average, mm Differenc ference from average, mm Jan-9 Jan-1 Jan-11 Jan-12 Jan-13 Month Evaporation on Lake St. Clair Jan-9 Jan-1 Jan-11 Jan-12 Jan-13 Month 4 Difference from average, mm Difference from average, mm Jan-9 Jan-1 Jan-11 Jan-12 Jan-13 Month Evaporation on Lake Erie Jan-9 Jan-1 Jan-11 Jan-12 Jan-13 Month Evaporation on Lake Ontario U.S. Army Corps of Engineers Detroit District Difference from average, mm Jan-9 Jan-1 Jan-11 Jan-12 Jan-13 Month 15-Apr-13
13 U.S. Army Corps of Engineers Detroit District Hydrologic Components Flow from upstream lakes, evaporation and precipitation influence lake levels. This graph illustrates the relative influence of each of those factors on the Great Lakes system. Values are based on a monthly average and are represented as thousand cubic feet per second. Note that the net amount of water diverted into the Great Lakes is greater than the amount diverted out. The Welland and NY State Barge canals are intra-basin diversions, meaning the diverted water does not leave the Great Lakes basin. LONG LAKE, OGOKI DIVERSIONS 5 CONSTANT LEVEL 74 5 Superior 57% in is precipitation 39% in is runoff 4% in from diversions 4% out is evaporation 6% out is outflow RUNOFF FROM LAKE PRECIPITATION ON LAKE OUTFLOW LAKE SUPERIOR EVAPORATION FROM LAKE LAKE SUPERIOR OUTFLOW TO MICH-HURON Mich-Huron* 39% in is precipitation 32% in is runoff 29% in is inflow 31% out is evaporation 68% out is outflow 1% out thru Chi. Diversion *Lakes Michigan and Huron are considered to be one lake, as they rise and fall together due to their union at the Straits of Mackinac. CONSTANT LEVEL 78 LAKES MICH-HURON 87 CONSTANT LEVEL 25 LAKE MICH-HURON OUTFLOW TO ERIE CHICAGO DIVERSION LAKE ERIE WELLAND CANAL 7 Erie 79% in is inflow 11% in is precipitation 1% in is runoff 89% out is outflow 11% out is evaporation LAKE ERIE OUTFLOW TO ONTARIO NY STATE BARGE CANAL 1 Ontario 8% in is inflow 13% in is runoff 7% in is precipitation 95% out is outflow 5% out is evaporation CONSTANT LEVEL LAKE ONTARIO 14 LAKE ONTARIO OUTFLOW TO THE SEA 251
 Lake St. Clair 4 35. 3 25. 2 15. 1 5 5. Chart datum = 572.3 ft -5.")
14 Difference from Datum (inches) Lake Superior Chart Datum = 61.1 ft Jan Feb Mar Apr May Jun Jul Aug Sep Oct Nov Dec Difference from Datum (inches) Lake Michigan-Huron Chart datum = ft Jan Feb Mar Apr May Jun Jul Aug Sep Oct Nov Dec Difference e from Datum (inches) Lake St. Clair Chart datum = ft Jan Feb Mar Apr May Jun Jul Aug Sep Oct Nov Dec Difference e from Datum (inches) Lake Erie Chart datum = ft 5. Jan Feb Mar Apr May Jun Jul Aug Sep Oct Nov Dec Lake Ontario U.S. Army Corps of Engineers Detroit District Difference from Datum (inches) Chart datum = ft Jan Feb Mar Apr May Jun Jul Aug Sep Oct Nov Dec Forecast Long Term Average 4/11/213

15 Great Lakes low water levels 213 (AS OF: 3 April 213) CURRENT 1) Lake Michigan-Huron s January 213 monthly mean water level set an all-time record low at ft. This is lower than any other month in the entire period of record, which goes back to The previous all-time record low was set in March at ft. All elevations are referenced to the International Great Lakes Datum. 2) The most probable forecast from our most recent 6 month bulletin shows Lake Michigan-Huron remaining 2 to 4 inches ABOVE record lows through September. If dry conditions are experienced in the Michigan-Huron basin during the next few months, water levels could return to record lows. 3) Lakes Superior and Michigan-Huron have been below average for 14 straight years, the longest stretch in each of their recorded histories. 4) Current forecasts for Lakes Superior, St. Clair, Erie, and Ontario do not call for record low levels given any scenario. 5) All the Great Lakes are below their long term averages and below their levels of a year ago. Lakes Superior, Michigan-Huron, St. Clair and Erie are expected to remain below their long term averages (LTA) for at least the next 6 months. Lake Ontario is expected to remain below LTA through June, and then return to LTA by July. Even under very wet scenarios, Michigan-Huron will remain below its LTA for a much longer period of time. 6) Lake Superior and Lake Michigan-Huron are currently below chart datum. Lake Superior is forecasted to remain below chart datum through July, be at chart datum in August and rise 1 inch above chart datum in September. Lake Michigan-Huron is forecasted to remain 6 to 13 inches below chart datum over the next six months. 7) The lack of a solid snowpack during the winter of 211 to 212, coupled with the very hot and dry summer of 212, are the biggest factors leading to the lower water levels this year. Snowmelt runoff and spring precipitation are the largest contributors to the seasonal rises on all the Great Lakes. Evaporation, a major component of water loss from the system, was also well above average during the heat wave of 212 and continuing into the autumn and winter months. 8) In an average year, Lake Michigan-Huron s seasonal rise is close to 12 inches. Because of dry conditions throughout the basin, the lake s rise was only about 4 inches in 212. Lakes St. Clair and Erie have average seasonal rises of about 15 inches, but in 212 both lakes had no seasonal rise, but rather have been either steady or declining since January 212. This was the first time in its recorded history that Lake Erie did not have a seasonal rise. U.S. ARMY CORPS OF ENGINEERS Detroit District 477 Michigan Ave Detroit, MI 48226
16 9) Conditions needed for the lakes to make gains with respect to their long term averages include heavy precipitation over multiple months, abundant runoff and reduced evaporation. Snow water equivalent values across northern Ontario, the U.P. of Michigan, northern/eastern Wisconsin and the Arrowhead of Minnesota are higher than those of 212. The official spring outlook, issued by the National Weather Service shows the potential for above average precipitation in April, May and June. These conditions may lead to an average or above average seasonal rise for the Great Lakes. 1) There are no discernible long term cycles of water levels apparent over our period of record ( ) for Great Lakes water levels. While the historical record shows periods of high and low water, it is not possible to predict with any certainty when/if water levels would return to long term average levels. Lake levels could go higher or lower from their current levels in future years. U.S. ARMY CORPS OF ENGINEERS Detroit District 477 Michigan Ave Detroit, MI 48226
17 DETROIT DISTRICT U.S. ARMY CORPS OF ENGINEERS CELRE HH W 477 MICHIGAN AVENUE DETROIT, MICHIGAN CH 213 GREAT LAKES WATER LEVEL SUMY LAKE SUPERIOR The average water level of Lake Superior for the month of March was 6.1 feet, which was 2 inches lower than February s level. The March level was 12 inches below chart datum, 13 inches below long term average (LTA), and 1 inch below the level of one year ago. Lake Superior continues its 14 year stretch of below LTA water levels, the longest period of below average levels in its recorded history dating back to Precipitation on the Lake Superior basin was below average in March and has been below average over the past 12 months. The water level of Lake Superior is forecasted to be 8 to 1 inches above record low water levels over the next six months. Superior is expected to be 11 inches below chart datum in April and then gradually rise to 1 inch above chart datum by September. The water levels are forecasted to range 5 inches below to 2 inches above last year s levels and 11 to 14 inches below LTA through September. LAKE MICHIGAN HURON The March monthly mean water level for Lake Michigan Huron was feet, rising 1 inch from February s level. The March level was 15 inches below datum, 15 inches below its level of last year, and 26 inches below its LTA. Lake Michigan Huron also continues a 14 year stretch of below average levels, the longest in its period of record. Precipitation on the Lake Michigan Huron basin was below average in March and has been below average over the past 12 months. The water level of Lake Michigan Huron is forecasted to be 2 to 4 inches above record lows through September. Michigan Huron is projected to be 13 inches below chart datum in April and then gradually rise to 6 to 7 inches below chart datum in June through September. The water levels are forecasted to range 1 to 13 inches below last year s levels and expected to remain 26 to 27 inches below LTA through September. LAKE ST. CLAIR Lake St. Clair s monthly mean water level for March of feet was 4 inches above February s level. During March, Lake St. Clair was 14 inches below last year s level and 1 inches below LTA. Lake St. Clair is forecasted to be 12 inches below its levels of a year ago in April and then gradually rise to 2 inches below last year s level in September. The lake is expected to remain 14 to 15 inches below LTA over the next six months. LAKE ERIE Lake Erie s average water level was 57.6 feet in March, which was 2 inches above February s level. March s water level was 17 inches below last year s level and 6 inches below LTA. The Lake Erie basin received below average precipitation in March and has received below average precipitation over the last 12 months. Lake Erie is forecasted to be 13 inches below its levels of a year ago in April and then gradually rise to 2 inches below last year s level in September. The water levels are expected to be 9 to 11 inches below LTA over the next six months. LAKE ONTARIO The monthly mean water level of Lake Ontario for March was feet, which was 2 inches above February s level. The February water level was 15 inches below last year s level and 4 inches below LTA. Lake Ontario received below average precipitation in March and below average precipitation over the past 12 months. The lake is forecasted to be 7 inches below its level of a year ago in April and then gradually rise to 14 inches above last year s level in September. Lake Ontario s water level is projected to range from 6 inches below to 5 inches above LTA over the next six months.
18 Useful Great Lakes Web Addresses 213 International Lake Superior Board of Control: International Niagara River Board of Control International St. Lawrence River Board of Control: International Joint Commission: International Upper Great Lakes Study USACE Detroit District Web Page: USACE Buffalo District Web Page: Detroit District Water Level Bulletin: Canadian Water Level Bulletin: Great Lakes Information Network: Canadian Hydrographic Service (CHS): Great Lakes Nautical Charts (U.S.) CHS - Nautical Charts (Canadian): (Click on 'Forecasts' under "Water Levels") National Oceanic and Atmospheric Administration Water levels: CHS Hourly Water Levels: Environment Canada Weather Radar - Ontario: Environment Canada Marine Weather Forecasts: National Weather Service Environment Canada 5-Day Weather Outlooks - Ontario: NOAA Climatological Outlooks Environment Canada Climatological Outlooks: U.S. Real-Time Streamflows (U.S.G.S.) Canadian Real-Time Streamflows: Crustal Movement Report: Seaway:
Great Lakes Update. Great Lakes Winter and Spring Summary January June Vol. 187 Great Lakes Update August 2012
 Great Lakes Update Great Lakes Winter and Spring Summary January June 2012 The US Army Corps of Engineers (USACE) Detroit District monitors hydraulic and hydrologic conditions of the Great Lakes. This
Great Lakes Update. Volume 191: 2014 January through June Summary. Vol. 191 Great Lakes Update August 2014
 Great Lakes Update Volume 191: 2014 January through June Summary The U.S. Army Corps of Engineers (USACE) monitors the water levels of each of the Great Lakes. This report provides a summary of the Great
Great Lakes Update. Volume 188: 2012 Annual Summary
 Great Lakes Update Volume 188: 2012 Annual Summary Background The U.S. Army Corps of Engineers (USACE) tracks the water levels of each of the Great Lakes. This report highlights hydrologic conditions of
Great Lakes Update. Volume 199: 2017 Annual Summary. Background
 Great Lakes Update Volume 199: 2017 Annual Summary Background The U.S. Army Corps of Engineers (USACE) tracks and forecasts the water levels of each of the Great Lakes. This report is primarily focused
Great Lakes Update. Volume 193: 2015 January through June Summary. Vol. 193 Great Lakes Update August 2015
 Great Lakes Update Volume 193: 2015 January through June Summary The U.S. Army Corps of Engineers (USACE) monitors the water levels of each of the Great Lakes. This report provides a summary of the Great
Great Lakes Update. Background
 Great Lakes Update Background The U.S. Army Corps of Engineers, Detroit District, monitors and forecasts the water levels of the Great Lakes. This report summarizes the hydrologic conditions of the Great
Great Lakes Update. Volume 194: 2015 Annual Summary
 Great Lakes Update Volume 194: 2015 Annual Summary Background The U.S. Army Corps of Engineers (USACE) tracks and forecasts the water levels of each of the Great Lakes. This report summarizes the hydrologic
Great Lakes Update Annual Summary. Vol. No. 174 January 2009
 Vol. No. 174 January 2009 Great Lakes Update 2008 Annual Summary Lakes Superior remains in its longest period of continuous below average water levels since 1918. Lake Michigan-Huron continued its second
January 25, Summary
 January 25, 2013 Summary Precipitation since the December 17, 2012, Drought Update has been slightly below average in parts of central and northern Illinois and above average in southern Illinois. Soil
Great Lakes Update Annual Summary. Vol. No. 150 January 7, US Army Corps of Engineers Detroit District
 Vol. No. 150 January 7, 2003 US Army Corps of Engineers Detroit District Great Lakes Update 2002 Annual Summary At times during 2002, each of the Great Lakes experienced water levels that were higher than
Inter State Large Navigable Rivers of the United States
 Inter State Large Navigable Rivers of the United States REVIEW OF NORTH AMERICAN BASINS: GREAT LAKES AND MISSISSIPPI RIVER HELEN A. BROHL, EXECUTIVE DIRECTOR US COMMITTEE ON THE MARINE TRANSPORTATION SYSTEM
Prepared by the North American Ice Service. 4 December Seasonal Outlook Great Lakes Winter
 Prepared by the North American Ice Service A collaboration of the Canadian Ice Service and the National/Naval Ice Center 4 December 2008 Seasonal Outlook Great Lakes Winter 2008-2009 - 1 - Table of contents
A WATER CYCLE PREDICTION SYSTEM
 A WATER CYCLE PREDICTION SYSTEM FOR THE GREAT LAKES AND ST. LAWRENCE RIVER V. Fortin 1, D. Durnford 2, G. Smith 1, P. Matte 1, M. Mackay 1, N. Bernier 1... and many others 1 Meteorological Research Division,
Missouri River Basin Water Management Monthly Update
 Missouri River Basin Water Management Monthly Update Participating Agencies 255 255 255 237 237 237 0 0 0 217 217 217 163 163 163 200 200 200 131 132 122 239 65 53 80 119 27 National Oceanic and Atmospheric
Missouri River Basin Water Management
 Missouri River Basin Water Management US Army Corps of Engineers Missouri River Navigator s Meeting February 12, 2014 Bill Doan, P.E. Missouri River Basin Water Management US Army Corps of Engineers BUILDING
Missouri River Basin Water Management Monthly Update
 Missouri River Basin Water Management Monthly Update Participating Agencies 255 255 255 237 237 237 0 0 0 217 217 217 163 163 163 200 200 200 131 132 122 239 65 53 80 119 27 National Oceanic and Atmospheric
Missouri River Basin Water Management Monthly Update
 Missouri River Basin Water Management Monthly Update Participating Agencies 255 255 255 237 237 237 0 0 0 217 217 217 163 163 163 200 200 200 131 132 122 239 65 53 80 119 27 National Oceanic and Atmospheric
Chiang Rai Province CC Threat overview AAS1109 Mekong ARCC
 Chiang Rai Province CC Threat overview AAS1109 Mekong ARCC This threat overview relies on projections of future climate change in the Mekong Basin for the period 2045-2069 compared to a baseline of 1980-2005.
2015 Fall Conditions Report
 2015 Fall Conditions Report Prepared by: Hydrologic Forecast Centre Date: December 21 st, 2015 Table of Contents Table of Figures... ii EXECUTIVE SUMMARY... 1 BACKGROUND... 2 SUMMER AND FALL PRECIPITATION...
Local Ctimatotogical Data Summary White Hall, Illinois
 SWS Miscellaneous Publication 98-5 STATE OF ILLINOIS DEPARTMENT OF ENERGY AND NATURAL RESOURCES Local Ctimatotogical Data Summary White Hall, Illinois 1901-1990 by Audrey A. Bryan and Wayne Armstrong Illinois
PRELIMINARY DRAFT FOR DISCUSSION PURPOSES
 Memorandum To: David Thompson From: John Haapala CC: Dan McDonald Bob Montgomery Date: February 24, 2003 File #: 1003551 Re: Lake Wenatchee Historic Water Levels, Operation Model, and Flood Operation This
FORECAST-BASED OPERATIONS AT FOLSOM DAM AND LAKE
 FORECAST-BASED OPERATIONS AT FOLSOM DAM AND LAKE 255 237 237 237 217 217 217 200 200 200 0 163 131 Bridging the Gap163Conference 255 0 132 255 0 163 122 The Dana on Mission Bay San Diego, CA January 28,
Stream Discharge and the Water Budget
 Regents Earth Science Unit 6: Water Cycle & Climate Name: Lab # Stream Discharge and the Water Budget Introduction: The United States Geological Survey (USGS) measures and publishes values for the daily
Illinois Drought Update, December 1, 2005 DROUGHT RESPONSE TASK FORCE Illinois State Water Survey, Department of Natural Resources
 Illinois Drought Update, December 1, 2005 DROUGHT RESPONSE TASK FORCE Illinois State Water Survey, Department of Natural Resources For more drought information please go to http://www.sws.uiuc.edu/. SUMMARY.
Missouri River Basin Water Management Monthly Update
 Missouri River Basin Water Management Monthly Update Participating Agencies 255 255 255 237 237 237 0 0 0 217 217 217 163 163 163 200 200 200 131 132 122 239 65 53 80 119 27 National Oceanic and Atmospheric
Folsom Dam Water Control Manual Update Joint Federal Project, Folsom Dam
 Folsom Dam Water Control Manual Update Joint Federal Project, Folsom Dam Public Workshop May 25, 2016 Sacramento Library Galleria 828 I Street, Sacramento, CA US Army Corps of Engineers BUILDING STRONG
The Great Lakes. Beyond the Book. FOCUS Book
 Build a model to show how the Great s formed. Use soil and large pieces of ice to model the role of ice sheets as they carved out the Great s Basin and then filled it with water. How will you make the
Champaign-Urbana 2001 Annual Weather Summary
 Champaign-Urbana 2001 Annual Weather Summary ILLINOIS STATE WATER SURVEY 2204 Griffith Dr. Champaign, IL 61820 wxobsrvr@sws.uiuc.edu Maria Peters, Weather Observer January: After a cold and snowy December,
Water Level Analysis of Lower St. Marys River September 15, 2010
 Water Level Analysis of Lower St. Marys River September 15, 21 Purpose and Scope This report presents the results of the data analysis of the St. Marys River levels and flows in support of several study
Hydrologic Conditions in the Delaware River Basin
 2017 Hydrologic Conditions in the Delaware River Basin Prepared by Operations Staff June 2018 Hydrologic Highlights Hydrologic Conditions in the Delaware River Basin Annual Report 2017 At the start of
2012 USACE Drought Actions
 2012 USACE Drought Actions for Inland Waterway Users Board 68 Jim Walker Navigation Branch Chief 19 December 2012 US US Army Corps of of Engineers US Drought Monitor 1 2 3 4 6 5 Impacts: 1. The area in
Water Supply Conditions and Outlook June 4, 2018
 Water Supply Conditions and Outlook June 4, 2018 Flow Forecasting & Operations Planning Water Security Agency Overview Water supply conditions across Saskatchewan are generally good with most reservoir
Champaign-Urbana 1998 Annual Weather Summary
 Champaign-Urbana 1998 Annual Weather Summary ILLINOIS STATE WATER SURVEY Audrey Bryan, Weather Observer 2204 Griffith Dr. Champaign, IL 61820 wxobsrvr@sparc.sws.uiuc.edu The development of the El Nìno
Sierra Weather and Climate Update
 Sierra Weather and Climate Update 2014-15 Kelly Redmond Western Regional Climate Center Desert Research Institute Reno Nevada Yosemite Hydroclimate Workshop Yosemite Valley, 2015 October 8-9 Percent of
9. PROBABLE MAXIMUM PRECIPITATION AND PROBABLE MAXIMUM FLOOD
 9. PROBABLE MAXIMUM PRECIPITATION AND PROBABLE MAXIMUM FLOOD 9.1. Introduction Due to the size of Watana Dam and the economic importance of the Project to the Railbelt, the Probable Maximum Flood (PMF)
A Report on a Statistical Model to Forecast Seasonal Inflows to Cowichan Lake
 A Report on a Statistical Model to Forecast Seasonal Inflows to Cowichan Lake Prepared by: Allan Chapman, MSc, PGeo Hydrologist, Chapman Geoscience Ltd., and Former Head, BC River Forecast Centre Victoria
Upper Missouri River Basin February 2018 Calendar Year Runoff Forecast February 6, 2018
 Upper Missouri River Basin February 2018 Calendar Year Runoff Forecast February 6, 2018 Calendar Year Runoff Forecast Explanation and Purpose of Forecast U.S. Army Corps of Engineers, Northwestern Division
PH YSIC A L PROPERT IE S TERC.UCDAVIS.EDU
 PH YSIC A L PROPERT IE S 8 Lake surface level Daily since 1900 Lake surface level varies throughout the year. Lake level rises due to high stream inflow, groundwater inflow and precipitation directly onto
INTERNATIONAL LAKE ONTARIO- ST. LAWRENCE RIVER BOARD OBSERVED CONDITIONS REGULATED OUTFLOWS IN Report to the International Joint Commission
 INTERNATIONAL LAKE ONTARIO- ST. LAWRENCE RIVER BOARD OBSERVED CONDITIONS & REGULATED OUTFLOWS IN 2017 Report to the International Joint Commission 1 International Lake Ontario- St. Lawrence River Board
HyMet Company. Streamflow and Energy Generation Forecasting Model Columbia River Basin
 HyMet Company Streamflow and Energy Generation Forecasting Model Columbia River Basin HyMet Inc. Courthouse Square 19001 Vashon Hwy SW Suite 201 Vashon Island, WA 98070 Phone: 206-463-1610 Columbia River
Eric Snodgrass Co-Founder and Senior Atmospheric Scientist of Agrible, Inc Director of Undergraduate Studies Department of Atmospheric Sciences
 Eric Snodgrass Co-Founder and Senior Atmospheric Scientist of Agrible, Inc Director of Undergraduate Studies Department of Atmospheric Sciences University Of Illinois Urbana-Champaign snodgrss@illinois.edu
Hydrologic Forecast Centre Manitoba Infrastructure, Winnipeg, Manitoba. FEBRUARY OUTLOOK REPORT FOR MANITOBA February 23, 2018
 Page 1 of 17 Hydrologic Forecast Centre Manitoba Infrastructure, Winnipeg, Manitoba FEBRUARY OUTLOOK REPORT FOR MANITOBA February 23, 2018 Overview The February Outlook Report prepared by the Hydrologic
Minnesota s Climatic Conditions, Outlook, and Impacts on Agriculture. Today. 1. The weather and climate of 2017 to date
 Minnesota s Climatic Conditions, Outlook, and Impacts on Agriculture Kenny Blumenfeld, State Climatology Office Crop Insurance Conference, Sep 13, 2017 Today 1. The weather and climate of 2017 to date
Lake Winnebago Regulation Meeting
 Lake Winnebago Regulation Meeting USACE Detroit District October 9, 2014 US Army Corps of Engineers Agenda Basin Overview Major Stakeholders Maintenance a and Repair Work Weather Conditions 2013-20142014
Monthly Long Range Weather Commentary Issued: APRIL 1, 2015 Steven A. Root, CCM, President/CEO
 Monthly Long Range Weather Commentary Issued: APRIL 1, 2015 Steven A. Root, CCM, President/CEO sroot@weatherbank.com FEBRUARY 2015 Climate Highlights The Month in Review The February contiguous U.S. temperature
Definitions Weather and Climate Climates of NYS Weather Climate 2012 Characteristics of Climate Regions of NYS NYS s Climates 1.
 Definitions Climates of NYS Prof. Anthony Grande 2012 Weather and Climate Weather the state of the atmosphere at one point in time. The elements of weather are temperature, t air pressure, wind and moisture.
Mountain Snow Conditions and Water Supply Forecasts for Alberta
 Mountain Snow Conditions and Water Supply Forecasts for Alberta October 2001 Alberta Environment publishes the "Mountain Snow Conditions and Water Supply Forecasts for Alberta" monthly, usually from February
REDWOOD VALLEY SUBAREA
 Independent Science Review Panel Conceptual Model of Watershed Hydrology, Surface Water and Groundwater Interactions and Stream Ecology for the Russian River Watershed Appendices A-1 APPENDIX A A-2 REDWOOD
Midwest/Great Plains Climate-Drought Outlook September 20, 2018
 Midwest/Great Plains Climate-Drought Outlook September 20, 2018 Brian Fuchs National Drought Mitigation Center University of Nebraska-Lincoln School of Natural Resources September 20, 2018 General Information
U.S. Outlook For October and Winter Thursday, September 19, 2013
 About This report coincides with today s release of the monthly temperature and precipitation outlooks for the U.S. from the Climate Prediction Center (CPC). U.S. CPC October and Winter Outlook The CPC
Monthly Long Range Weather Commentary Issued: APRIL 18, 2017 Steven A. Root, CCM, Chief Analytics Officer, Sr. VP,
 Monthly Long Range Weather Commentary Issued: APRIL 18, 2017 Steven A. Root, CCM, Chief Analytics Officer, Sr. VP, sroot@weatherbank.com MARCH 2017 Climate Highlights The Month in Review The average contiguous
Monthly Long Range Weather Commentary Issued: SEPTEMBER 19, 2016 Steven A. Root, CCM, Chief Analytics Officer, Sr. VP,
 Monthly Long Range Weather Commentary Issued: SEPTEMBER 19, 2016 Steven A. Root, CCM, Chief Analytics Officer, Sr. VP, sroot@weatherbank.com SEPTEMBER 2016 Climate Highlights The Month in Review The contiguous
ONE HUNDRED AND TWENTY FIRST PROGRESS REPORT to the INTERNATIONAL JOINT COMMISSION by the INTERNATIONAL ST. LAWRENCE RIVER BOARD OF CONTROL Covering
 ONE HUNDRED AND TWENTY FIRST PROGRESS REPORT to the INTERNATIONAL JOINT COMMISSION by the INTERNATIONAL ST. LAWRENCE RIVER BOARD OF CONTROL Covering the Period SEPTEMBER 19, 2013 THROUGH MARCH 26, 2014
Seasonal Summary. Great Lakes Winter By the North American Ice Service
 Seasonal Summary Great Lakes Winter 2014-2015 By the North American Ice Service Summary for the Great Lakes The 2014-2015 winter in the Great Lakes region was a season that was punctuated by three distinct
INTERNATIONAL NIAGARA BOARD OF CONTROL. Minutes of the March 20, 2013 Meeting Chicago, IL
 INTERNATIONAL NIAGARA BOARD OF CONTROL Minutes of the March 20, 2013 Meeting Chicago, IL BG Burcham called the meeting to order at 8:05 am in a conference room of the US Army Corps of Engineers, Chicago
U.S. ARMY CORPS OF ENGINEERS
 CORPS FACTS Regulating Mississippi River Navigation Pools U.S. ARMY CORPS OF ENGINEERS BUILDING STRONG Historical Background Federal improvements in the interest of navigation on the Mississippi River
Preliminary Runoff Outlook February 2018
 Preliminary Runoff Outlook February 2018 Prepared by: Flow Forecasting & Operations Planning Water Security Agency General Overview The Water Security Agency (WSA) is preparing for 2018 spring runoff including
Champaign-Urbana 2000 Annual Weather Summary
 Champaign-Urbana 2000 Annual Weather Summary ILLINOIS STATE WATER SURVEY 2204 Griffith Dr. Champaign, IL 61820 wxobsrvr@sws.uiuc.edu Maria Peters, Weather Observer January: January started on a mild note,
Integrating Weather Forecasts into Folsom Reservoir Operations
 Integrating Weather Forecasts into Folsom Reservoir Operations California Extreme Precipitation Symposium September 6, 2016 Brad Moore, PE US Army Corps of Engineers Biography Brad Moore is a Lead Civil
February 10, Mr. Jeff Smith, Chairman Imperial Valley Water Authority E County Road 1000 N Easton, IL Dear Chairman Smith:
 February 1, 1 Mr. Jeff Smith, Chairman Imperial Valley Water Authority 8 E County Road 1 N Easton, IL Dear Chairman Smith: The Illinois State Water Survey (ISWS), under contract to the Imperial Valley
3.0 TECHNICAL FEASIBILITY
 3.0 TECHNICAL FEASIBILITY 3.1 INTRODUCTION To enable seasonal storage and release of water from Lake Wenatchee, an impoundment structure would need to be constructed on the lake outlet channel. The structure
Produced by Canadian Ice Service of. 2 December Seasonal Outlook Gulf of St Lawrence and East Newfoundland Waters Winter
 Environment Canada Environnement Canada Produced by Canadian Ice Service of Environment Canada 2 December 2010 Seasonal Outlook Gulf of St Lawrence and East Newfoundland Waters Winter 2010-2011 2010 Canadian
Changing Hydrology under a Changing Climate for a Coastal Plain Watershed
 Changing Hydrology under a Changing Climate for a Coastal Plain Watershed David Bosch USDA-ARS, Tifton, GA Jeff Arnold ARS Temple, TX and Peter Allen Baylor University, TX SEWRU Objectives 1. Project changes
Climates of NYS. Definitions. Climate Regions of NYS. Storm Tracks. Climate Controls 10/13/2011. Characteristics of NYS s Climates
 Definitions Climates of NYS Prof. Anthony Grande 2011 Weather and Climate Weather the state of the atmosphere at one point in time. The elements of weather are temperature, air pressure, wind and moisture.
Understanding Michigan snowfall. Jim Keysor - NWS Gaylord
 Understanding Michigan snowfall Jim Keysor - NWS Gaylord Presentation Outline Topics Background information on lake effect Radar and lake effect snow Wind direction and lake effect Lake Enhanced snow Elevation
National Integrated Drought Information System. Southeast US Pilot for Apalachicola- Flint-Chattahoochee River Basin 20-March-2012
 National Integrated Drought Information System Southeast US Pilot for Apalachicola- Flint-Chattahoochee River Basin 20-March-2012 Current drought status from Drought Monitor http://www.drought.unl.edu/dm/monitor.html
Climate also has a large influence on how local ecosystems have evolved and how we interact with them.
 The Mississippi River in a Changing Climate By Paul Lehman, P.Eng., General Manager Mississippi Valley Conservation (This article originally appeared in the Mississippi Lakes Association s 212 Mississippi
Kootenai Basin Water Supply Update and Sturgeon Flow Augmentation Kootenai Valley Resource Initiative
 Kootenai Basin Water Supply Update and Sturgeon Flow Augmentation Kootenai Valley Resource Initiative Greg Hoffman Fishery Biologist / Kootenai River Basin Flood Engineer Libby Dam 15 May 2017 US Army
2016 Fall Conditions Report
 2016 Fall Conditions Report Prepared by: Hydrologic Forecast Centre Date: December 13, 2016 Table of Contents TABLE OF FIGURES... ii EXECUTIVE SUMMARY... 1 BACKGROUND... 5 SUMMER AND FALL PRECIPITATION...
Climate Outlook through 2100 South Florida Ecological Services Office Vero Beach, FL September 9, 2014
 Climate Outlook through 2100 South Florida Ecological Services Office Vero Beach, FL September 9, 2014 Short Term Drought Map: Short-term (
Climate Variability. Eric Salathé. Climate Impacts Group & Department of Atmospheric Sciences University of Washington. Thanks to Nathan Mantua
 Climate Variability Eric Salathé Climate Impacts Group & Department of Atmospheric Sciences University of Washington Thanks to Nathan Mantua Northwest Climate: the mean Factors that influence local/regional
Presentation Overview. Southwestern Climate: Past, present and future. Global Energy Balance. What is climate?
 Southwestern Climate: Past, present and future Mike Crimmins Climate Science Extension Specialist Dept. of Soil, Water, & Env. Science & Arizona Cooperative Extension The University of Arizona Presentation
Great Lakes Update. A Geologic Perspective on Lake Michigan Water Levels By Todd A. Thompson, Ph. D. and Steve J. Baedke, Ph. D.
 Vol. No. 140 August 4, 2000 US Army Corps of Engineers Detroit District Great Lakes Update A Geologic Perspective on Lake Michigan Water Levels By Todd A. Thompson, Ph. D. and Steve J. Baedke, Ph. D. With
Upper Missouri River Basin December 2017 Calendar Year Runoff Forecast December 5, 2017
 Upper Missouri River Basin December 2017 Calendar Year Runoff Forecast December 5, 2017 Calendar Year Runoff Forecast Explanation and Purpose of Forecast U.S. Army Corps of Engineers, Northwestern Division
The Climate of Grady County
 The Climate of Grady County Grady County is part of the Central Great Plains, encompassing some of the best agricultural land in Oklahoma. Average annual precipitation ranges from about 33 inches in northern
Folsom Dam Water Control Manual Update Joint Federal Project, Folsom Dam
 Folsom Dam Water Control Manual Update Joint Federal Project, Folsom Dam Public Workshop May 28, 2015 Library Galleria 828 I Street, Sacramento, CA US Army Corps of Engineers BUILDING STRONG WELCOME &
CLIMATE OVERVIEW. Thunder Bay Climate Overview Page 1 of 5
 CLIMATE OVERVIEW The climate in the Thunder Bay area is typical of a mid-latitude inland location with a Great Lake Moderating influence. The moderating effect of Lake Superior results in cooler summer
Climate of Columbus. Aaron Wilson. Byrd Polar & Climate Research Center State Climate Office of Ohio.
 Climate of Columbus Aaron Wilson Byrd Polar & Climate Research Center http://bpcrc.osu.edu/greenteam Overview Historical Climatology Climate Change & Impacts Projected Changes Summary 2 Historical Climatology
Monthly Long Range Weather Commentary Issued: February 15, 2015 Steven A. Root, CCM, President/CEO
 Monthly Long Range Weather Commentary Issued: February 15, 2015 Steven A. Root, CCM, President/CEO sroot@weatherbank.com JANUARY 2015 Climate Highlights The Month in Review During January, the average
Regional Climate Change: Current Impacts and Perspectives Greater Lake Nipissing Stewardship Council Annual Meeting Wednesday April 16, 2014
 Regional Climate Change: Current Impacts and Perspectives Greater Lake Nipissing Stewardship Council Annual Meeting Wednesday April 16, 2014 Speaker: Peter Bullock, Stantec Consulting Information Source:
Drought and Future Water for Southern New Mexico
 Drought and Future Water for Southern New Mexico David S. Gutzler University of New Mexico gutzler@unm.edu * The big drought of 2018 * Longer term challenges for water supply * Forecasting streamflow Elephant
Hydrologic Conditions in the Delaware River Basin
 Hydrologic Conditions in the Delaware River Basin April : Flooding in Lambertville, New Jersey Aerial photo used with permission of www.elevated-images.com Annual Report Prepared by Operations Staff June
1. Which weather map symbol is associated with extremely low air pressure? A) B) C) D) 2. The diagram below represents a weather instrument.
 B) C) D) 2. The diagram below represents a weather instrument.") 1. Which weather map symbol is associated with extremely low air pressure? 2. The diagram below represents a weather instrument. Which weather variable was this instrument designed to measure? A) air pressure
1. Which weather map symbol is associated with extremely low air pressure? 2. The diagram below represents a weather instrument. Which weather variable was this instrument designed to measure? A) air pressure
Upper Missouri River Basin January 2018 Calendar Year Runoff Forecast January 3, 2018
 Calendar Year Runoff Forecast Upper Missouri River Basin January 2018 Calendar Year Runoff Forecast January 3, 2018 Explanation and Purpose of Forecast U.S. Army Corps of Engineers, Northwestern Division
EQ: Discuss main geographic landforms of the U.S. & Canada and examine varied landforms in relation to their lifestyles.
 EQ: Discuss main geographic landforms of the U.S. & Canada and examine varied landforms in relation to their lifestyles. Places & Terms for Discussion Appalachian Mountains Great Plains Canadian Shield
Summary of the 2017 Spring Flood
 Ottawa River Regulation Planning Board Commission de planification de la régularisation de la rivière des Outaouais The main cause of the exceptional 2017 spring flooding can be described easily in just
SEPTEMBER 2013 REVIEW
 Monthly Long Range Weather Commentary Issued: October 21, 2013 Steven A. Root, CCM, President/CEO sroot@weatherbank.com SEPTEMBER 2013 REVIEW Climate Highlights The Month in Review The average temperature
Monthly Long Range Weather Commentary Issued: July 18, 2014 Steven A. Root, CCM, President/CEO
 Monthly Long Range Weather Commentary Issued: July 18, 2014 Steven A. Root, CCM, President/CEO sroot@weatherbank.com JUNE 2014 REVIEW Climate Highlights The Month in Review The average temperature for
A Review of the 2007 Water Year in Colorado
 A Review of the 2007 Water Year in Colorado Nolan Doesken Colorado Climate Center, CSU Mike Gillespie Snow Survey Division, USDA, NRCS Presented at the 28 th Annual AGU Hydrology Days, March 26, 2008,
Hydrologic Forecast Centre Manitoba Infrastructure, Winnipeg, Manitoba. MARCH OUTLOOK REPORT FOR MANITOBA March 23, 2018
 Page 1 of 21 Hydrologic Forecast Centre Manitoba Infrastructure, Winnipeg, Manitoba MARCH OUTLOOK REPORT FOR MANITOBA March 23, 2018 Overview The March Outlook Report prepared by the Hydrologic Forecast
Webinar and Weekly Summary February 15th, 2011
 Webinar and Weekly Summary February 15th, 2011 -Assessment of current water conditions - Precipitation Forecast - Recommendations for Drought Monitor Upper Colorado Normal Precipitation Upper Colorado
Disentangling Impacts of Climate & Land Use Changes on the Quantity & Quality of River Flows in Southern Ontario
 Disentangling Impacts of Climate & Land Use Changes on the Quantity & Quality of River Flows in Southern Ontario by Trevor Dickinson & Ramesh Rudra, Water Resources Engineering University of Guelph Acknowledgements
The Colorado Drought of 2002 in Perspective
 The Colorado Drought of 2002 in Perspective Colorado Climate Center Nolan Doesken and Roger Pielke, Sr. Prepared by Tara Green and Odie Bliss http://climate.atmos.colostate.edu Known Characteristics of
Three main areas of work:
 Task 2: Climate Information 1 Task 2: Climate Information Three main areas of work: Collect historical and projected weather and climate data Conduct storm surge and wave modeling, sea-level rise (SLR)
2017 January Conditions Report Manitoba Hydrologic Forecasting and Coordination Branch Manitoba Infrastructure
 2017 January Conditions Report Manitoba Hydrologic Forecasting and Coordination Branch Manitoba Infrastructure 1/30/2017 Page 1 of 22 Hydrologic Forecast Centre Manitoba Infrastructure and Transportation
Building Marina Resilience to Storms Wisconsin Marine Association Conference November 2-3, 2016
 Julia Noordyk NOAA Great Lakes Coastal Storms Program Outreach Coordinator UW Sea Grant @NoordCoast Building Marina Resilience to Storms Wisconsin Marine Association Conference November 2-3, 2016 July
Climatic and Ecological Conditions in the Klamath Basin of Southern Oregon and Northern California: Projections for the Future
 Climatic and Ecological Conditions in the Klamath Basin of Southern Oregon and Northern California: Projections for the Future A Collaborative Effort by: CLIMATE LEADERSHIP INITIATIVE INSTITUTE FOR A SUSTAINABLE
2011 Flood: Technical Review of Lake Manitoba, Lake St. Martin and Assiniboine River Water Levels Summary
 2011 Flood: Technical Review of Lake Manitoba, Lake St. Martin and Assiniboine River Water Levels Summary October 2013 Introduction Manitoba experienced unprecedented flooding in 2011. While flooding was
Champaign-Urbana 1999 Annual Weather Summary
 Champaign-Urbana 1999 Annual Weather Summary ILLINOIS STATE WATER SURVEY 2204 Griffith Dr. Champaign, IL 61820 wxobsrvr@sws.uiuc.edu Maria Peters, Weather Observer A major snowstorm kicked off the new
Drought in Southeast Colorado
 Drought in Southeast Colorado Nolan Doesken and Roger Pielke, Sr. Colorado Climate Center Prepared by Tara Green and Odie Bliss http://climate.atmos.colostate.edu 1 Historical Perspective on Drought Tourism