What is Climate Change? How is it Manifested in the Western U.S.?
|
|
|
- Bertha Fowler
- 5 years ago
- Views:
Transcription


1 What is Climate Change? How is it Manifested in the Western U.S.? Kelly T. Redmond Western Regional Climate Center Desert Research Institute Reno Nevada Climate Change Science for Effective Resource Management and Public Policy in the Western United States EPSCoR Western Tri-State Consortium UNLV Las Vegas 2013 March 27-28
2 What s all the fuss about??? 316 ppmv % 395 January 2013
")
3 The Planetary Radiation Budget Net incoming = 235 W/m 2 Net outgoing = 235 W / m 2 IPCC AR4, Kiehl and Trenberth (1997)
 2 x CO 2 forcing increase is about 4 W / m 2 +/- 10 % 4 W / m 2 is about one bulb per 4x4 m Earth")
4 How much energy? 60 watt light bulb Mostly heat (infrared radiation) 2 x CO 2 forcing increase is about 4 W / m 2 +/- 10 % 4 W / m 2 is about one bulb per 4x4 m Earth surface covers about 510 trillion square meters Place 30 trillion 60-watt bulbs uniformly over the earth As of 2013, about 19 trillion in place
5 Not a climate issue (not too much). But it is (very much) a carbon issue. A major issue, by itself. Warming influences Cooling influences Greenhouse gases CO2 - carbon dioxide ** (about 2/3 of total effect) CH4 - methane N20 - nitrous oxide 03 - ozone CFC - chloroflourocarbons Pollution and most aerosols Direct reflection Make clouds brighter Occasional volcanoes Some land use changes (minor) Some kinds of soot Some land use changes (minor) Solar activity (minor) ** Side Note. Ocean Acidification.

6 MODIS

7 090327:1925 GMT Redoubt Eruption From Homer AK. Jonathan Dehn.

8 History of Atmospheric Forcings Warming Hansen et al, Earth's energy imbalance: Confirmation and implications. Science, 308, Cooling Radiative Factors that Control Global Climate
9 Gazing into the future...
10 Western Great Basin Temp and Precip Projections One style of presentation

11 Courtesy of Mike Dettinger, USGS / Scripps start Dettinger MD From climate change spaghetti to climate-change distributions for 21st Century California. San Francisco Estuary and Watershed Science. Vol. 3, Issue 1, (March 2005), Article 4.

12 Courtesy of Mike Dettinger, USGS / Scripps Dettinger MD From climate change spaghetti to climate-change distributions for 21st Century California. San Francisco Estuary and Watershed Science. Vol. 3, Issue 1, (March 2005), Article 4.

13 Central Great Basin Temp and Precip Projections Another style of presentation
14 Annual Winter Spring Summer Autumn East Central Nevada Projected Temperature Changes ( C ) Early 21 st Middle 21 st Late 21 st Figure: John Abatzoglou
15 East Central Nevada Projected Precipitation Changes ( % ) Early 21 st Middle 21 st Late 21 st Annual Winter Spring Summer Autumn Figure: John Abatzoglou

16 Temperature Change (~ 2055) minus Regional Climate Trends and Scenarios for the U.S. National Climate Assessment. NOAA Technical Report NESDIS 142. Draft January Part 9. Climate of the Contiguous United States

17 Average of 19 climate models years from 2013 Figure by Gabriel Vecchi. es/div/ocp/drought/scienc e.shtml R. Seager, M.F. Ting, I.M. Held, Y. Kushnir, J. Lu, G. Vecchi, H.-P. Huang, N. Harnik, A. Leetmaa, N.-C. Lau, C. Li, J. Velez, N. Naik, Model Projections of an Imminent Transition to a More Arid Climate in Southwestern North America. Science, DOI: /science

18 Precipitation change (~2055) percent change from Regional Climate Trends and Scenarios for the U.S. National Climate Assessment. NOAA Technical Report NESDIS 142. Draft January Part 9. Climate of the Contiguous United States

19
20 53 Western United States (11 states) Annual Jan-Dec Temperature Red: Individual Years. Blue: 11-year running mean. Units: Deg F. Data from NOAA Cooperative Network thru Dec Annual Mean Temperatuire ( F ) Year Western Regional Climate Center

21 Annual from NOAA NCDC
22 Nevada Climate Tracker (state average only for now) With thanks to John Abatzoglou
23 Nevada Statewide Temperature Annual Calendar Year
24 Nevada Statewide Maximum Temperature Annual Calendar Year

25 Nevada Statewide Minimum Temperature Annual Calendar Year
26 United States Annual Temperature Departure from Mean NOAA Divisional Data, Western Regional Climate Center, Plotted by ESRL PSD

27 thru Feb United States Annual Temperature Departure from Mean NOAA Divisional Data, Western Regional Climate Center, Plotted by ESRL PSD

28 Nevada Statewide Precipitation Water Year Oct - Sep 1895 / 1896 thru 2011 / 2012
29 Trends in North America Surface Temperature CRUTS3.1 (thanks to John Abatzoglou) Annual Winter Spring Summer Autumn Deg C / Decade Redmond and Abatzoglou, submitted 2013 Current Climate and Recent Trends. Ch 2. Climate Change in North America. George Ohring, ed. Springer.

30 March 10, / 1800 mm 55 / 1400 mm 12 / 300 mm 7.5 / 170 mm

31 North American Freezing Level Tracker

32 Annual mean freezing level over Ely Nevada NCEP Reanalysis


33 Winter Freezing Level over Ely Nevada Spring Summer Autumn

34 White Mountain Summit (14,245 ft) Summit Station Measured Daily Temp vs Temp Estimated from 600mb Global Reanalysis Correlation Coefficient 30-day running mean Frequency Distribution of errors Estimated minus Observed For NPS Southern Sierra Project Thanks to Matt Fearon

35 Reconstructed Annual Temperature of White Mountain Summit (14245 ft) based on NCAR/NCEP Global Reanalysis ~4 years of overlap Thanks to Matt Fearon
 Annual Winter Spring Summer Autumn 1950-2012 1975-2012 meters / Decade Redmond and Abatzoglou, submitted 2013 Current")
36 Trends in North America Freezing Level Elevation CRUTS3.1 (thanks to John Abatzoglou) Annual Winter Spring Summer Autumn meters / Decade Redmond and Abatzoglou, submitted 2013 Current Climate and Recent Trends. Ch 2. Climate Change in North America. George Ohring, ed. Springer.
37 Trends in North America 700 mb ( ~10,000 ft) Temperature CRUTS3.1 (thanks to John Abatzoglou) Annual Winter Spring Summer Autumn Deg C / Decade Redmond and Abatzoglou, submitted 2013 Current Climate and Recent Trends. Ch 2. Climate Change in North America. George Ohring, ed. Springer.
38 Water Year Precipitation ( inches ) Western United States (11 states) Water Year (Oct-Sep) Precipitation. Blue: Individual Years. Red: 11-Year Running Mean. Units: Inches. Data source NOAA cooperative network thru Feb End Year Western Regional Climate Center
39 15 Western United States (11 states) Winter (Oct-Mar) Precipitation. Blue: Individual Years. Red: 11-Year Running Mean. Units: Inches. Data source NOAA cooperative network thru Feb Oct - Mar Precipitation ( inches ) End Year Western Regional Climate Center
 Annual Winter Spring Summer Autumn 1901-2009 1950-2009 1975-2009 -10-8 -6-4 Percent / Decade +4 +6 +8 +10 Redmond and Abatzoglou,")
40 Trends in North America Station Precipitation CRUTS3.1 (thanks to John Abatzoglou) Annual Winter Spring Summer Autumn Percent / Decade Redmond and Abatzoglou, submitted 2013 Current Climate and Recent Trends. Ch 2. Climate Change in North America. George Ohring, ed. Springer.

41 Water Year Oct 2010 Thru 30 Sep 2011
42 Water Year Oct 2011 Thru 30 Sep 2012
")
43 Precipitation Water Year To Date (Mar 22, 2013) Temperature

44 Long Draw Fire 557,648 acres as of July 17 Oregon s largest fire ever MODIS 1 km 2012 July 11

45 Long Draw Fire SE Oregon 2012 July 24 Jamie Francis, Oregonian

46 Long Draw Fire SE Oregon 2012 July 24 Jamie Francis, Oregonian
47 Acres burned U.S. Fires through December 31, 2012 Values after 1990 adjusted by NIFC in Ave from = 6.08 M acres. Number of acres Year Western Regional Climate Center Source: National Interagency Fire Center


48 Sep 28, 1999 Sep 26, 2000 Sep 25, 2001 Sep 24, 2002 Sep 30, 2003 Sep 21, 2004

49 Sep 27, 2005 Sep 26, 2006 Sep 25, 2007 Sep 30, 2008 Sep 29, 2009 Sep 28, 2010

50 Sep 30, 2008 Sep 29, 2009 Sep 28, 2010 Sep 27, 2011 Sep 25, 2012 Mar 19, 2013

51 Jan - Dec 1934 A New Tool WRCC web pages Monthly 4 km PRISM data T, P, Palmer, SPI, SPEI 1-12 months current Maps and Time Series Updated monthly
 Drought Tracker Palmer Drought Severity Index August")
52 Idaho Nevada New Mexico WestWide Drought Tracker West-Wide (or Fine Scale) Drought Tracker Palmer Drought Severity Index August

53 Flow Projections Temperature increase is equivalent to Precipitation decrease Colorado River at Lees Ferry Decline of 2-9 % per degree C Decline of 1-5 % per degree F Or, for +3 C rise by 2060, Best estimate: % decline Vano, Das, Lettenmaier, Hydrologic Sensitivities of Colorado River Runoff to Changes in Precipitation and Temperature. J Hydrometeorology, 13, DOI: /JHM-D
54 Lake Powell Storage Through March 22, 2013 Currently 49 % full (capacity MAF) Minimum: 33 % full on April 8, 2005

55 Lake Powell Elevation Through March 22, 2013 Water level on Mar 3, 2011 was ft, ft below full. Minimum level on April 8, 2005 was 3555 ft, -145 ft below full. Source:

56 2013 Mar 1 Powell 49 % Mead 53% Powell WY2011 fcst inflow is 54 % of average (Apr-July 54 %)

57 Lake Mead, October 2007 Photo by Ken Dewey


58 Lake Powell Apr-Jul Inflow Revised normal drops by 11 % 7927 KAF 7158 KAF Idaho Example, Too. Snake River near Heise. drop by 9 %
59 Lessons from History. Colorado River Flow. Lees Ferry. Reconstructed 762 thru 2005 A.D. Red: Gauged record. Blue: Reconstructed record. 20-Year moving averages. Meko, D.M., C.A. Woodhouse, C.H. Baisan, T. Knight, J.J. Lukas, M.K. Hughes, and M.W. Salzer, Medieval drought in the upper Colorado River basin. Geophysical Research Letters 34m L10705, doi: /2007GL029988
60 The Climate We Remember Extremes

61

62
63 72 Las Vegas Airport. Mean annual temperature. Units: Deg F. Data from Red: Individual years. Blue: 9-yr running mean. 71 Mean Annual Temp ( F ) Year Western Regional Climate Center
64 83.0 Las Vegas Airport. Average Annual Maximum Temperature. Units: Deg F. Data from Red: Individual years. Blue: 9-yr running mean. Average Annual Tmax ( F ) Year Western Regional Climate Center
65 Annual Min Temp ( F ) Las Vegas Airport. Mean Annual Min Temperture. Units: Deg F. Data from Blue: Individual years. Red: 9-yr running mean Year Western Regional Climate Center
66 Las Vegas Airport. Annual extreme high max temperature. Units: Deg F. Data from Annual Extreme Max ( F ) Year Western Regional Climate Center
67 55 Las Vegas Airport. Annual extreme lowest max temperature. Units: Deg F. July thru June. Data from thru Annual lowest Tmax ( F ) Ending Year Western Regional Climate Center
68 35 Las Vegas Airport. Annual extreme low min temperature. Units: Deg F. July thru June. Data from thru Lowest Winter Temperature ( F ) Ending Year Western Regional Climate Center
69 Extreme high min ( F ) Las Vegas Airport. Annual extreme high min temperature. Units: Deg F. Data from Year Western Regional Climate Center
70 How much water can the atmosphere hold? Clausius-Clapeyron relation for plane (flat) water surface Saturation vapor pressure increases % per 5 C increase
 and Climate Change. Kunkel, Karl, Easterling, Redmond, Young, Yin, Hennon. 2013.")
71 Precipitable Water Maximum Values 7 CMIP5 Models Present mm Future / Percent increase Probable Maximum Precipitation (PMP) and Climate Change. Kunkel, Karl, Easterling, Redmond, Young, Yin, Hennon Geophysical Research Letters
72 3.00 Las Vegas Airport. Annual maximum 1-day precipitation. Units: Deg F. Data from Red: Individual years. Blue: 9-yr running mean. Wettest single day ( inches ) Year Western Regional Climate Center
73 3.00 Las Vegas Airport. Extreme max 2-day precipitation. Units: Inches. Data from Red: Individual years. Blue: 9-yr running mean. Wettest 2 cons. days ( in ) Year Western Regional Climate Center
74 3.00 Las Vegas Airport. Annual maximum 3-day precipitation. Units: Inches. Data from Red: Individual years. Blue: 9-yr running mean. Wettest 3 cons days ( in ) Year Western Regional Climate Center
75 3.00 Las Vegas Airport. Annual maximum 4-day precipitation. Units: Inches. Data from Red: Individual years. Blue: 9-yr running mean. Wettest 4 cons days ( in ) Year Western Regional Climate Center
76 3.00 Las Vegas Airport. Annual maximum 7-day precipitation. Units: Inches. Data from Red: Individual years. Blue: 9-yr running mean. Wettest 7 cons days ( in ) Year Western Regional Climate Center
77 3.50 Las Vegas Airport. Annual maximum 10-day precipitation. Units: Inches. Data from Red: Individual years. Blue: 9-yr running mean. Wettest 10 cons days ( in ) Year Western Regional Climate Center
78 4.00 Las Vegas Airport. Annual extreme 20-day precipitation. Units: Inches. Data from Red: Individual years. Blue: 9-yr running mean. Wettest 20 cons days ( in ) Year Western Regional Climate Center
79 5.00 Las Vegas Airport. Annual extreme 30-day precipitation. Units: Inches. Data from Red: Individual years. Blue: 9-yr running mean. Wettest cons 30 days ( in ) Year Western Regional Climate Center

80
81 1 - Year Return Value Trends in 1-Day Exceedance Values 2 - Year Return for Precipitation. 5 - Year Return Southwest USA Year Return 25 - Year Return 50 - Year Return Year Return Value Geoffrey M Bonnin, Kazungu Maitaria, Michael Yekta Trends in Rainfall Exceedances in the Observed Record in Selected Areas of the United States. Journal of the American Water Resources Association, 47(6),
82 Bonnin et al, Figure 6.


83 Observed difference in extreme event precipitable water: minus (Kunkel, AMS 2011)

84 The Global Average Temperature Can Change Fairly Rapidly Microwave Sounding Unit Daily Temperatures 2011, 2012, 2013 thru Mar 22 The likely suspect: Clouds. Half-Degree C variations in 1-2 weeks

85 Climate Complexity Our ability to predict aspect of this system is not as hopeless as it might seem! Stitched Image IR, 2013 Mar GMT
86 How would climate change actually be played out? 50 years = 18,262 days = 438,291 hours Fluctuations in climate will be experienced through weather

87 Elko Daily Temperatures Past ~387 days 2012 Jan Jan 21

88 Elko Daily Temperatures Past ~752 days 2011 Jan Jan 21

89 Elko Daily Temperatures Past ~3673 days 2003 Jan Jan 21

90 Elko Daily Temperatures Past ~18283 days 1963 Jan Jan 21
91 Elko Daily Precipitation Past ~387 days 2012 Jan Jun 21
92 Elko Daily Precipitation Past ~752 days 2011 Jan Jan 21
93 Elko Daily Precipitation Past ~3673 days 2003 Jan Jan 21
94 Elko Daily Precipitation Past ~18283 days About 3500 days with 0.01 or more 1963 Jan Jan 21
95 One of 36 ensembles (models/runs) 9 CMIP3, A2, Annual T, Tahoe City. Individual and 7-year running mean. Smooth rise not expected! 8 Mean Annual Temperature ( C ) Year Data Thanks to Justin Huntington
96 10 6 Models, CMIP-3, A2, Tahoe City. 7-year running means, annual Tave. Runs 5, 9, 11, 20, 28, 36. Annual Mean Temperature ( C ) Year Data Thanks to Justin Huntington


97 Climate Fluctuates on Different Time Scales for Different Reasons IRI Time Scales Map Room Exploratory Tool Slowly Changing Trend Decadal Scale Variability Year-to-Year Variability Graphs are averages of domain above 13 % 21 % 66 % Annual Mean Temperature
98 13 % 21 % 65 % Climate variability remains a very big deal! A.M. Green, L. Goddard, R. Cousin. Web Tool Deconstructs Variability in Twentieth-Century Climate. Nov EOS, AGU, 92(45),


99 Change is not new. Change in the pipeline. Cannot be called back.
100 Summary Points Climate Change and the West Provides one more source of variability. Old variability continues. Local and regional responses do not have to be the same as global scale. Temp Strongest consensus among the various climate elements Temp All show warming, amounts differ modestly among projections. Precip Sign, amounts, seasonality, frequency all matter. Precip Character of precipitation can be as important as amount. Precip More consensus for T than P, but some precip progress Precipitation change more winter, less spring, summer, autumn? Precipitation change Annual increase north / decrease south More floods (winter) & droughts (summer) possible Temperature is a hydrologic element has significant implications Temperature change is under way, began without our noticing. Western Mountains seem particularly vulnerable to climate change System still has unrealized warming; earth radiation not in balance Choice: Adaptation versus mitigation Managing the unavoidable and avoiding the unmanageable

101 Thank You!
102 Discards
103 Precip Days Per Year 0.01 Ave Hours Precip Per Year Ave Percent Hours Precip / yr Once per year wettest hour (in.) Ann wettest hr Pct of Ann Ave Intermountain Precipitation Stats Importance of a few opportunities Precip Days per Year (POR) Hourly (approx 1949 to 2009) How many hours per year? Wettest hour of typical year? Percent of hours with precip How important is wettest hour?
104 Oct-Mar Apr-May-June Fraction of Annual Total Precipitation, by Season July-Aug

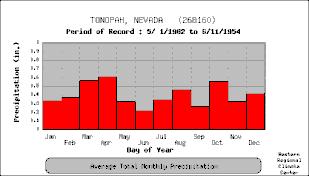
105 Nevada Annual Precipitation Cycle

106 Next to Long Draw Fire SE Oregon 2012 July 24 Jamie Francis, Oregonian

107 Lowest Arctic Ice Pack on record mid-sept 2012 Surrounding ocean absorbed much more solar radiation this summer.

108 Trends in North America 850 mb ( ~5000 ft) Temperature CRUTS3.1 (thanks to John Abatzoglou) Annual Winter Spring Summer Autumn Deg C / Decade Redmond and Abatzoglou, submitted 2013 Current Climate and Recent Trends. Ch 2. Climate Change in North America. George Ohring, ed. Springer.
 Annual Winter Spring Summer Autumn 1950-2012 1975-2012 -15-10 meters / Decade +10 +15 Redmond and Abatzoglou, submitted 2013 Current")
109 Trends in North America mb Thickness (Lower Atm Temperature CRUTS3.1 (thanks to John Abatzoglou) Annual Winter Spring Summer Autumn meters / Decade Redmond and Abatzoglou, submitted 2013 Current Climate and Recent Trends. Ch 2. Climate Change in North America. George Ohring, ed. Springer.
 Annual Winter Spring Summer Autumn 1950-2012 1975-2012 -6-4 Percent / Decade +4 +6 Redmond and Abatzoglou, submitted 2013 Current")
110 Trends in North America Estimated Rain vs Snow at 2000 m (~6600 ft) CRUTS3.1 (thanks to John Abatzoglou) Annual Winter Spring Summer Autumn Percent / Decade Redmond and Abatzoglou, submitted 2013 Current Climate and Recent Trends. Ch 2. Climate Change in North America. George Ohring, ed. Springer.
111 Trends in North America Estimated Rain vs Snow at 1000 m (~3300 ft) CRUTS3.1 (thanks to John Abatzoglou) Annual Winter Spring Summer Autumn Percent / Decade Redmond and Abatzoglou, submitted 2013 Current Climate and Recent Trends. Ch 2. Climate Change in North America. George Ohring, ed. Springer.

112 Summer vegetation anomaly. Navajo Nation ctsy Barry Middleton, USGS.

113 Years of drought out of 13 springs ctsy Barry Middleton, USGS

114 Years of drought out of 13 summers ctsy Barry Middleton, USGS


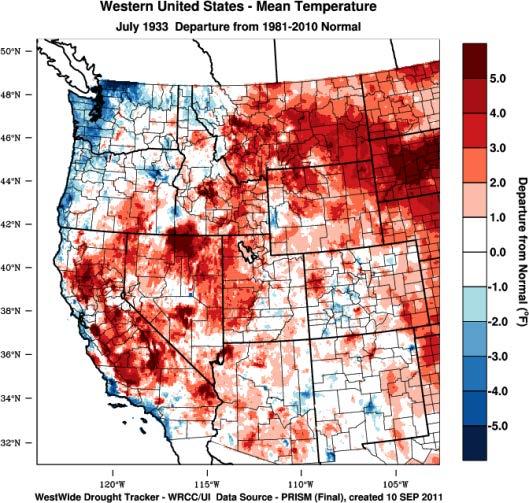
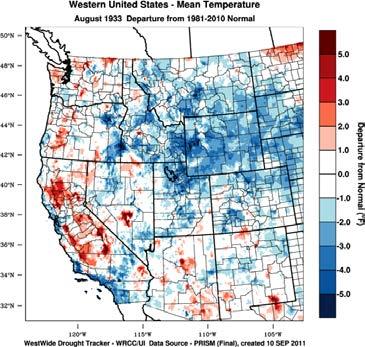


115 Jan Feb Mar Apr May Jun Jul Aug Sep Oct Nov Dec Jan thru Dec 1933


116 Jan Feb Mar Apr May Jun Jul Aug Sep Oct Nov Dec Jan thru Dec 1934


117 Oct - Apr Annual 1933 Annual 1934

118 Jan - Jun 1934 Temp Jan - Jun 2012 Temp
Hydroclimatic Variability and Change: Issues in the Intermountain West
 Hydroclimatic Variability and Change: Issues in the Intermountain West Kelly Redmond Western Regional Climate Center Desert Research Institute Reno NV Collaborative and Interdisciplinary Climate Change
Future Climate Conditions in the Great Basin: What Do We Know / Not Know?
 Future Climate Conditions in the Great Basin: What Do We Know / Not Know? Kelly T. Redmond Western Regional Climate Center Desert Research Institute Reno Nevada Alternative Futures for the Great Basin
Sierra Weather and Climate Update
 Sierra Weather and Climate Update 2014-15 Kelly Redmond Western Regional Climate Center Desert Research Institute Reno Nevada Yosemite Hydroclimate Workshop Yosemite Valley, 2015 October 8-9 Percent of
Climate Change and the Great Basin
 Climate Change and the Great Basin Kelly T. Redmond Western Regional Climate Center Desert Research Institute Reno Nevada Community Environmental Monitoring Workshop Bristlecone Convention Center Ely Nevada
A High Elevation Climate Monitoring Network
 A High Elevation Climate Monitoring Network Kelly T. Redmond Western Regional Climate Center Desert Research Institute Reno Nevada AGU San Francisco WRCC / OSU Nevada Precip-Elevation Distribution 100%
Presentation Overview. Southwestern Climate: Past, present and future. Global Energy Balance. What is climate?
 Southwestern Climate: Past, present and future Mike Crimmins Climate Science Extension Specialist Dept. of Soil, Water, & Env. Science & Arizona Cooperative Extension The University of Arizona Presentation
Westmap: The Western Climate Mapping Initiative An Update
 Westmap: The Western Climate Mapping Initiative An Update Andrew Comrie 1, Kelly Redmond 2, Mary Glueck 1, Hauss Reinbold 3, Chris Daly 4 1 University of Arizona, 2 DRI / Western Regional Climate Center
The MTNCLIM Year: Western Climate in Perspective
 The MTNCLIM Year: Western Climate 2009-10 in Perspective Kelly T. Redmond Western Regional Climate Center Desert Research Institute Reno Nevada HJ Andrews LTER, Blue River OR 7-10 June 2010 Spring 2009
Drought in Southeast Colorado
 Drought in Southeast Colorado Nolan Doesken and Roger Pielke, Sr. Colorado Climate Center Prepared by Tara Green and Odie Bliss http://climate.atmos.colostate.edu 1 Historical Perspective on Drought Tourism
Changing Hydrology under a Changing Climate for a Coastal Plain Watershed
 Changing Hydrology under a Changing Climate for a Coastal Plain Watershed David Bosch USDA-ARS, Tifton, GA Jeff Arnold ARS Temple, TX and Peter Allen Baylor University, TX SEWRU Objectives 1. Project changes
Colorado s 2003 Moisture Outlook
 Colorado s 2003 Moisture Outlook Nolan Doesken and Roger Pielke, Sr. Colorado Climate Center Prepared by Tara Green and Odie Bliss http://climate.atmos.colostate.edu How we got into this drought! Fort
Monthly Long Range Weather Commentary Issued: APRIL 18, 2017 Steven A. Root, CCM, Chief Analytics Officer, Sr. VP,
 Monthly Long Range Weather Commentary Issued: APRIL 18, 2017 Steven A. Root, CCM, Chief Analytics Officer, Sr. VP, sroot@weatherbank.com MARCH 2017 Climate Highlights The Month in Review The average contiguous
Climate Change in Colorado: Recent Trends, Future Projections and Impacts An Update to the Executive Summary of the 2014 Report
 Climate Change in Colorado: Recent Trends, Future Projections and Impacts An Update to the Executive Summary of the 2014 Report Jeff Lukas, Western Water Assessment, University of Colorado Boulder - Lukas@colorado.edu
What Does It Take to Get Out of Drought?
 What Does It Take to Get Out of Drought? Nolan J. Doesken Colorado Climate Center Colorado State University http://ccc.atmos.colostate.edu Presented at the Insects, Diseases and Drought Workshop, May 19,
Highlights of the 2006 Water Year in Colorado
 Highlights of the 2006 Water Year in Colorado Nolan Doesken, State Climatologist Atmospheric Science Department Colorado State University http://ccc.atmos.colostate.edu Presented to 61 st Annual Meeting
Monthly Long Range Weather Commentary Issued: February 15, 2015 Steven A. Root, CCM, President/CEO
 Monthly Long Range Weather Commentary Issued: February 15, 2015 Steven A. Root, CCM, President/CEO sroot@weatherbank.com JANUARY 2015 Climate Highlights The Month in Review During January, the average
CoCoRaHS Monitoring Colorado s s Water Resources through Community Collaborations
 CoCoRaHS Monitoring Colorado s s Water Resources through Community Collaborations Nolan Doesken Colorado Climate Center Atmospheric Science Department Colorado State University Presented at Sustaining
SEPTEMBER 2013 REVIEW
 Monthly Long Range Weather Commentary Issued: October 21, 2013 Steven A. Root, CCM, President/CEO sroot@weatherbank.com SEPTEMBER 2013 REVIEW Climate Highlights The Month in Review The average temperature
A Review of the 2007 Water Year in Colorado
 A Review of the 2007 Water Year in Colorado Nolan Doesken Colorado Climate Center, CSU Mike Gillespie Snow Survey Division, USDA, NRCS Presented at the 28 th Annual AGU Hydrology Days, March 26, 2008,
2003 Moisture Outlook
 2003 Moisture Outlook Nolan Doesken and Roger Pielke, Sr. Colorado Climate Center Prepared by Tara Green and Odie Bliss http://climate.atmos.colostate.edu Through 1999 Through 1999 Fort Collins Total Water
Climate Variability and Change, and Southern California Water San Gabriel Valley Water Forum, Pomona, CA, October 2, 2014
 Climate Variability and Change, and Southern California Water San Gabriel Valley Water Forum, Pomona, CA, October 2, 2014 Dan Cayan (with Mike Dettinger, David Pierce, Suraj Polade, Mary Tyree, Alexander
Arctic Climate Change. Glen Lesins Department of Physics and Atmospheric Science Dalhousie University Create Summer School, Alliston, July 2013
 Arctic Climate Change Glen Lesins Department of Physics and Atmospheric Science Dalhousie University Create Summer School, Alliston, July 2013 When was this published? Observational Evidence for Arctic
Champaign-Urbana 1998 Annual Weather Summary
 Champaign-Urbana 1998 Annual Weather Summary ILLINOIS STATE WATER SURVEY Audrey Bryan, Weather Observer 2204 Griffith Dr. Champaign, IL 61820 wxobsrvr@sparc.sws.uiuc.edu The development of the El Nìno
Climate Variability. Eric Salathé. Climate Impacts Group & Department of Atmospheric Sciences University of Washington. Thanks to Nathan Mantua
 Climate Variability Eric Salathé Climate Impacts Group & Department of Atmospheric Sciences University of Washington Thanks to Nathan Mantua Northwest Climate: the mean Factors that influence local/regional
Weather and Climate Summary and Forecast Winter
 Weather and Climate Summary and Forecast Winter 2016-17 Gregory V. Jones Southern Oregon University February 7, 2017 What a difference from last year at this time. Temperatures in January and February
Climate Change and Water Supply Research. Drought Response Workshop October 8, 2013
 Climate Change and Water Supply Research Drought Response Workshop October 8, 2013 DWR Photo Oroville Reservoir, 2009 Talk Overview Expectations History Atmospheric Rivers and Water Supply Current Research
Meteorology. Circle the letter that corresponds to the correct answer
 Chapter 3 Worksheet 1 Meteorology Name: Circle the letter that corresponds to the correct answer 1) If the maximum temperature for a particular day is 26 C and the minimum temperature is 14 C, the daily
Drought and Future Water for Southern New Mexico
 Drought and Future Water for Southern New Mexico David S. Gutzler University of New Mexico gutzler@unm.edu * The big drought of 2018 * Longer term challenges for water supply * Forecasting streamflow Elephant
Chiang Rai Province CC Threat overview AAS1109 Mekong ARCC
 Chiang Rai Province CC Threat overview AAS1109 Mekong ARCC This threat overview relies on projections of future climate change in the Mekong Basin for the period 2045-2069 compared to a baseline of 1980-2005.
El Niño, Climate Change and Water Supply Variability
 El Niño, Climate Change and Water Supply Variability Talk Overview El Niño and California California Climate Variability and Change Water Management in the Face of Change California s topography affects
Extreme Weather and Climate Change: the big picture Alan K. Betts Atmospheric Research Pittsford, VT NESC, Saratoga, NY
 Extreme Weather and Climate Change: the big picture Alan K. Betts Atmospheric Research Pittsford, VT http://alanbetts.com NESC, Saratoga, NY March 10, 2018 Increases in Extreme Weather Last decade: lack
Funding provided by NOAA Sectoral Applications Research Project CLIMATE. Basic Climatology Colorado Climate Center
 Funding provided by NOAA Sectoral Applications Research Project CLIMATE Basic Climatology Colorado Climate Center Remember These? Factor 1: Our Energy Source Factor 2: Revolution & Tilt Factor 3: Rotation!
Climate also has a large influence on how local ecosystems have evolved and how we interact with them.
 The Mississippi River in a Changing Climate By Paul Lehman, P.Eng., General Manager Mississippi Valley Conservation (This article originally appeared in the Mississippi Lakes Association s 212 Mississippi
Tracking the Climate Of Northern Colorado Nolan Doesken State Climatologist Colorado Climate Center Colorado State University
 Tracking the Climate Of Northern Colorado Nolan Doesken State Climatologist Colorado Climate Center Colorado State University Northern Colorado Business Innovations November 20, 2013 Loveland, Colorado
Champaign-Urbana 2000 Annual Weather Summary
 Champaign-Urbana 2000 Annual Weather Summary ILLINOIS STATE WATER SURVEY 2204 Griffith Dr. Champaign, IL 61820 wxobsrvr@sws.uiuc.edu Maria Peters, Weather Observer January: January started on a mild note,
Global Climate Change: Implications for South Florida
 Global Climate Change: Implications for South Florida Amy Clement Rosenstiel School of Marine and Atmospheric Science University of Miami IPCC 2007 + findings since the report + discussion of uncertainty
ZUMWALT WEATHER AND CLIMATE ANNUAL REPORT ( )
") ZUMWALT WEATHER AND CLIMATE ANNUAL REPORT (26-29) FINAL DRAFT (9 AUGUST 21) J.D. HANSEN 1, R.V. TAYLOR 2, AND V.S. JANSEN 3 INTRODUCTION The Zumwalt Prairie in northeastern Oregon is a unique grassland
ZUMWALT WEATHER AND CLIMATE ANNUAL REPORT (26-29) FINAL DRAFT (9 AUGUST 21) J.D. HANSEN 1, R.V. TAYLOR 2, AND V.S. JANSEN 3 INTRODUCTION The Zumwalt Prairie in northeastern Oregon is a unique grassland
Monthly Long Range Weather Commentary Issued: APRIL 25, 2016 Steven A. Root, CCM, Chief Analytics Officer, Sr. VP, sales
 Monthly Long Range Weather Commentary Issued: APRIL 25, 2016 Steven A. Root, CCM, Chief Analytics Officer, Sr. VP, sales sroot@weatherbank.com MARCH 2016 Climate Highlights The Month in Review The March
Weather and Climate of the Rogue Valley By Gregory V. Jones, Ph.D., Southern Oregon University
 Weather and Climate of the Rogue Valley By Gregory V. Jones, Ph.D., Southern Oregon University The Rogue Valley region is one of many intermountain valley areas along the west coast of the United States.
Climate Impacts to Southwest Water Sector. Dr. Dave DuBois New Mexico State Climatologist
 Climate Impacts to Southwest Water Sector Dr. Dave DuBois New Mexico State Climatologist Presented at EPA Extreme Events and Climate Adaptation Planning Workshop June 3, 2015 Water Year Precip. % of Average
Extreme Rainfall in the Southeast U.S.
 Extreme Rainfall in the Southeast U.S. David F. Zierden Florida State Climatologist Center for Ocean Atmospheric Prediction Studies The Florida State University March 7, 2016 Causes of Extreme Rainfall
January 25, Summary
 January 25, 2013 Summary Precipitation since the December 17, 2012, Drought Update has been slightly below average in parts of central and northern Illinois and above average in southern Illinois. Soil
2003 Water Year Wrap-Up and Look Ahead
 2003 Water Year Wrap-Up and Look Ahead Nolan Doesken Colorado Climate Center Prepared by Odie Bliss http://ccc.atmos.colostate.edu Colorado Average Annual Precipitation Map South Platte Average Precipitation
Weather History on the Bishop Paiute Reservation
 Weather History on the Bishop Paiute Reservation -211 For additional information contact Toni Richards, Air Quality Specialist 76 873 784 toni.richards@bishoppaiute.org Updated 2//214 3:14 PM Weather History
UPPLEMENT A COMPARISON OF THE EARLY TWENTY-FIRST CENTURY DROUGHT IN THE UNITED STATES TO THE 1930S AND 1950S DROUGHT EPISODES
 UPPLEMENT A COMPARISON OF THE EARLY TWENTY-FIRST CENTURY DROUGHT IN THE UNITED STATES TO THE 1930S AND 1950S DROUGHT EPISODES Richard R. Heim Jr. This document is a supplement to A Comparison of the Early
Agricultural Science Climatology Semester 2, Anne Green / Richard Thompson
 Agricultural Science Climatology Semester 2, 2006 Anne Green / Richard Thompson http://www.physics.usyd.edu.au/ag/agschome.htm Course Coordinator: Mike Wheatland Course Goals Evaluate & interpret information,
Climate Change and Water Supplies in the West. Michael Dettinger, USGS
 Climate Change and Water Supplies in the West Michael Dettinger, USGS During the past 30 years--and in the near-term future--natural climate variability has been augmented by warming trends associated
MONITORING THE EFFECTS OF CLIMATE CHANGE ON SPRINGS, SEEPS AND OTHER WATER NATIONAL PRESERVE
 MONITORING THE EFFECTS OF CLIMATE CHANGE ON SPRINGS, SEEPS AND OTHER WATER RESOURCES IN THE MOJAVE NATIONAL PRESERVE Boris Poff and Debra Hughson Mojave National Preserve, California CLIMATE CHANGE Predictions
The Colorado Drought of 2002 in Perspective
 The Colorado Drought of 2002 in Perspective Colorado Climate Center Nolan Doesken and Roger Pielke, Sr. Prepared by Tara Green and Odie Bliss http://climate.atmos.colostate.edu Known Characteristics of
March 1, 2003 Western Snowpack Conditions and Water Supply Forecasts
 Natural Resources Conservation Service National Water and Climate Center 101 SW Main Street, Suite 1600 Portland, OR 97204-3224 Date: March 17, 2003 Subject: March 1, 2003 Western Snowpack Conditions and
Regional Climate Change: Current Impacts and Perspectives Greater Lake Nipissing Stewardship Council Annual Meeting Wednesday April 16, 2014
 Regional Climate Change: Current Impacts and Perspectives Greater Lake Nipissing Stewardship Council Annual Meeting Wednesday April 16, 2014 Speaker: Peter Bullock, Stantec Consulting Information Source:
Monthly Long Range Weather Commentary Issued: APRIL 1, 2015 Steven A. Root, CCM, President/CEO
 Monthly Long Range Weather Commentary Issued: APRIL 1, 2015 Steven A. Root, CCM, President/CEO sroot@weatherbank.com FEBRUARY 2015 Climate Highlights The Month in Review The February contiguous U.S. temperature
Sensitivity of Water Supply in the Colorado River Basin to Warming
 Sensitivity of Water Supply in the Colorado River Basin to Warming Greg McCabe U.S. Geological Survey, Denver, Colorado Dave Wolock U.S. Geological Survey, Lawrence, Kansas The Colorado River Basin Streamgage
Three main areas of work:
 Task 2: Climate Information 1 Task 2: Climate Information Three main areas of work: Collect historical and projected weather and climate data Conduct storm surge and wave modeling, sea-level rise (SLR)
NIDIS Intermountain West Regional Drought Early Warning System February 7, 2017
 NIDIS Drought and Water Assessment NIDIS Intermountain West Regional Drought Early Warning System February 7, 2017 Precipitation The images above use daily precipitation statistics from NWS COOP, CoCoRaHS,
Missouri River Basin Water Management Monthly Update
 Missouri River Basin Water Management Monthly Update Participating Agencies 255 255 255 237 237 237 0 0 0 217 217 217 163 163 163 200 200 200 131 132 122 239 65 53 80 119 27 National Oceanic and Atmospheric
Typical Hydrologic Period Report (Final)
") (DELCORA) (Final) November 2015 (Updated April 2016) CSO Long-Term Control Plant Update REVISION CONTROL REV. NO. DATE ISSUED PREPARED BY DESCRIPTION OF CHANGES 1 4/26/16 Greeley and Hansen Pg. 1-3,
(DELCORA) (Final) November 2015 (Updated April 2016) CSO Long-Term Control Plant Update REVISION CONTROL REV. NO. DATE ISSUED PREPARED BY DESCRIPTION OF CHANGES 1 4/26/16 Greeley and Hansen Pg. 1-3,
San Francisco Public Utilities Commission Hydrological Conditions Report For April 2014
 San Francisco Public Utilities Commission Hydrological Conditions Report For April 2014 J. Chester, C. Graham, A. Mazurkiewicz, & M. Tsang, May 13, 2014 Snow in the High Country The view from Bond Pass
Minnesota s Climatic Conditions, Outlook, and Impacts on Agriculture. Today. 1. The weather and climate of 2017 to date
 Minnesota s Climatic Conditions, Outlook, and Impacts on Agriculture Kenny Blumenfeld, State Climatology Office Crop Insurance Conference, Sep 13, 2017 Today 1. The weather and climate of 2017 to date
The Climate of Oregon Climate Zone 3 Southwest Interior
 .k) 105 Unbound issue " " 1 4oes not circulate C4P. Special Report 915 May 1993 The Climate of Oregon Climate Zone 3 Southwest Interior Property of OREGON STATE UNIVERSITY Library Serials Corvallis, OR
Will a warmer world change Queensland s rainfall?
 Will a warmer world change Queensland s rainfall? Nicholas P. Klingaman National Centre for Atmospheric Science-Climate Walker Institute for Climate System Research University of Reading The Walker-QCCCE
Colorado weather and climate update: a bit more than halfway through the water year (Or: What s going on with the weather?? )
") Colorado weather and climate update: a bit more than halfway through the water year (Or: What s going on with the weather?? ) Russ S. Schumacher Colorado State Climatologist Director, Colorado Climate
Colorado weather and climate update: a bit more than halfway through the water year (Or: What s going on with the weather?? ) Russ S. Schumacher Colorado State Climatologist Director, Colorado Climate
Missouri River Basin Water Management Monthly Update
 Missouri River Basin Water Management Monthly Update Participating Agencies 255 255 255 237 237 237 0 0 0 217 217 217 163 163 163 200 200 200 131 132 122 239 65 53 80 119 27 National Oceanic and Atmospheric
A Recap of Colorado s Water Year 2018
 A Recap of Colorado s Water Year 2018 For further inquiries, please contact: Russ Schumacher, State Climatologist (970) 491-8084 Becky Bolinger, Assistant State Climatologist (970) 491-8506 Peter Goble,
Monthly Long Range Weather Commentary Issued: NOVEMBER 16, 2015 Steven A. Root, CCM, Chief Analytics Officer, Sr. VP, sales
 Monthly Long Range Weather Commentary Issued: NOVEMBER 16, 2015 Steven A. Root, CCM, Chief Analytics Officer, Sr. VP, sales sroot@weatherbank.com OCTOBER 2015 Climate Highlights The Month in Review The
PRELIMINARY DRAFT FOR DISCUSSION PURPOSES
 Memorandum To: David Thompson From: John Haapala CC: Dan McDonald Bob Montgomery Date: February 24, 2003 File #: 1003551 Re: Lake Wenatchee Historic Water Levels, Operation Model, and Flood Operation This
Upper Colorado River Basin Flows and Paleohydrology Jenny Ta
 Upper Colorado River Basin Flows and Paleohydrology Jenny Ta Introduction The Colorado River flows from its headwaters in the Rocky Mountains, through seven U.S. and two Mexican states into the Colorado
A Tutorial on Climate Change Science: The. 4 th National Climate Assessment CLIMATE SCIENCE. Don Wuebbles
 CLIMATE SCIENCE S P E C I A L R E P O R T A Tutorial on Climate Change Science: The Fourth National Climate Assessment Volume I 4 th National Climate Assessment Don Wuebbles Department of Atmospheric Sciences
2015 Fall Conditions Report
 2015 Fall Conditions Report Prepared by: Hydrologic Forecast Centre Date: December 21 st, 2015 Table of Contents Table of Figures... ii EXECUTIVE SUMMARY... 1 BACKGROUND... 2 SUMMER AND FALL PRECIPITATION...
Let s Talk Climate! Nolan Doesken Colorado Climate Center Colorado State University. Yampatika Seminar February 16, 2011 Steamboat Springs, Colorado
 Let s Talk Climate! Nolan Doesken Colorado Climate Center Colorado State University Yampatika Seminar February 16, 2011 Steamboat Springs, Colorado First -- A short background In 1973 the federal government
The scientific basis for climate change projections: History, Status, Unsolved problems
 The scientific basis for climate change projections: History, Status, Unsolved problems Isaac Held, Princeton, Feb 2008 Katrina-like storm spontaneously generated in atmospheric model Regions projected
Current Climate Trends and Implications
 Current Climate Trends and Implications Dr. Mark Seeley Professor emeritus Department of Soil, Water, and Climate University of Minnesota St Paul, MN 55108 Crop Insurance Conference September 12, 2018
Missouri River Basin Water Management
 Missouri River Basin Water Management US Army Corps of Engineers Missouri River Navigator s Meeting February 12, 2014 Bill Doan, P.E. Missouri River Basin Water Management US Army Corps of Engineers BUILDING
The Colorado Drought : 2003: A Growing Concern. Roger Pielke, Sr. Colorado Climate Center.
 The Colorado Drought 2001-2003: 2003: A Growing Concern Roger Pielke, Sr. Colorado Climate Center Prepared by Tara Green and Odie Bliss http://climate.atmos.colostate.edu 2 2002 Drought History in Colorado
National Integrated Drought Information System. Southeast US Pilot for Apalachicola- Flint-Chattahoochee River Basin 20-March-2012
 National Integrated Drought Information System Southeast US Pilot for Apalachicola- Flint-Chattahoochee River Basin 20-March-2012 Current drought status from Drought Monitor http://www.drought.unl.edu/dm/monitor.html
Climate Change RMJOC Study Summary
 Climate Change RMJOC Study Summary Erik Pytlak Weather and Streamflow Forecasting Bonneville Power Administration Portland, OR IPCC: International Panel on Climate Change Established by the United Nations
Upper Missouri River Basin February 2018 Calendar Year Runoff Forecast February 6, 2018
 Upper Missouri River Basin February 2018 Calendar Year Runoff Forecast February 6, 2018 Calendar Year Runoff Forecast Explanation and Purpose of Forecast U.S. Army Corps of Engineers, Northwestern Division
ACCUMULATED PRECIPITATION IN INCHES
 CUMULATIVE PRECIPITATION WATER YEAR COLUMBIA BASIN ABOVE GRAND COULEE 84% of Normal 1971- Average ACCUMULATED PRECIPITATION IN INCHES 8 6 82% of Normal 85% of Normal 82% of Normal SNAKE RIVER BASIN ABOVE
Local Ctimatotogical Data Summary White Hall, Illinois
 SWS Miscellaneous Publication 98-5 STATE OF ILLINOIS DEPARTMENT OF ENERGY AND NATURAL RESOURCES Local Ctimatotogical Data Summary White Hall, Illinois 1901-1990 by Audrey A. Bryan and Wayne Armstrong Illinois
The Climate of Texas County
 The Climate of Texas County Texas County is part of the Western High Plains in the north and west and the Southwestern Tablelands in the east. The Western High Plains are characterized by abundant cropland
Northern New England Climate: Past, Present, and Future. Basic Concepts
 Northern New England Climate: Past, Present, and Future Basic Concepts Weather instantaneous or synoptic measurements Climate time / space average Weather - the state of the air and atmosphere at a particular
Weather and Climate Summary and Forecast November 2017 Report
 Weather and Climate Summary and Forecast November 2017 Report Gregory V. Jones Linfield College November 7, 2017 Summary: October was relatively cool and wet north, while warm and very dry south. Dry conditions
The Arctic Energy Budget
 The Arctic Energy Budget The global heat engine [courtesy Kevin Trenberth, NCAR]. Differential solar heating between low and high latitudes gives rise to a circulation of the atmosphere and ocean that
The following information is provided for your use in describing climate and water supply conditions in the West as of April 1, 2003.
 Natural Resources Conservation Service National Water and Climate Center 101 SW Main Street, Suite 1600 Portland, OR 97204-3224 Date: April 8, 2003 Subject: April 1, 2003 Western Snowpack Conditions and
The Climate of Payne County
 The Climate of Payne County Payne County is part of the Central Great Plains in the west, encompassing some of the best agricultural land in Oklahoma. Payne County is also part of the Crosstimbers in the
Today s Lecture: Land, biosphere, cryosphere (All that stuff we don t have equations for... )
") Today s Lecture: Land, biosphere, cryosphere (All that stuff we don t have equations for... ) 4 Land, biosphere, cryosphere 1. Introduction 2. Atmosphere 3. Ocean 4. Land, biosphere, cryosphere 4.1 Land
Today s Lecture: Land, biosphere, cryosphere (All that stuff we don t have equations for... ) 4 Land, biosphere, cryosphere 1. Introduction 2. Atmosphere 3. Ocean 4. Land, biosphere, cryosphere 4.1 Land
Weather and Climate Summary and Forecast Summer 2017
 Weather and Climate Summary and Forecast Summer 2017 Gregory V. Jones Southern Oregon University August 4, 2017 July largely held true to forecast, although it ended with the start of one of the most extreme
Weather and Climate Summary and Forecast March 2018 Report
 Weather and Climate Summary and Forecast March 2018 Report Gregory V. Jones Linfield College March 7, 2018 Summary: The ridge pattern that brought drier and warmer conditions from December through most
NIDIS Intermountain West Drought Early Warning System April 18, 2017
 1 of 11 4/18/2017 3:42 PM Precipitation NIDIS Intermountain West Drought Early Warning System April 18, 2017 The images above use daily precipitation statistics from NWS COOP, CoCoRaHS, and CoAgMet stations.
Champaign-Urbana 1999 Annual Weather Summary
 Champaign-Urbana 1999 Annual Weather Summary ILLINOIS STATE WATER SURVEY 2204 Griffith Dr. Champaign, IL 61820 wxobsrvr@sws.uiuc.edu Maria Peters, Weather Observer A major snowstorm kicked off the new
WHEN IS IT EVER GOING TO RAIN? Table of Average Annual Rainfall and Rainfall For Selected Arizona Cities
 WHEN IS IT EVER GOING TO RAIN? Table of Average Annual Rainfall and 2001-2002 Rainfall For Selected Arizona Cities Phoenix Tucson Flagstaff Avg. 2001-2002 Avg. 2001-2002 Avg. 2001-2002 October 0.7 0.0
DEPARTMENT OF EARTH & CLIMATE SCIENCES Name SAN FRANCISCO STATE UNIVERSITY Nov 29, ERTH 360 Test #2 200 pts
 DEPARTMENT OF EARTH & CLIMATE SCIENCES Name SAN FRANCISCO STATE UNIVERSITY Nov 29, 2018 ERTH 360 Test #2 200 pts Each question is worth 4 points. Indicate your BEST CHOICE for each question on the Scantron
The 21 st Century Colorado River Hot Drought and Implications for the Future
 Coauthor: Jonathan Overpeck The 21 st Century Colorado River Hot Drought and Implications for the Future CRWCD State of the River May 4, 2017 Brad Udall Colorado State University Bradley.udall@colostate.edu
The Climate of Murray County
 The Climate of Murray County Murray County is part of the Crosstimbers. This region is a transition between prairies and the mountains of southeastern Oklahoma. Average annual precipitation ranges from
ALASKA REGION CLIMATE OUTLOOK BRIEFING. December 22, 2017 Rick Thoman National Weather Service Alaska Region
 ALASKA REGION CLIMATE OUTLOOK BRIEFING December 22, 2017 Rick Thoman National Weather Service Alaska Region Today s Outline Feature of the month: Autumn sea ice near Alaska Climate Forecast Basics Climate
Weather and Climate Summary and Forecast August 2018 Report
 Weather and Climate Summary and Forecast August 2018 Report Gregory V. Jones Linfield College August 5, 2018 Summary: July 2018 will likely go down as one of the top five warmest July s on record for many
Projected Impacts of Climate Change in Southern California and the Western U.S.
 Projected Impacts of Climate Change in Southern California and the Western U.S. Sam Iacobellis and Dan Cayan Scripps Institution of Oceanography University of California, San Diego Sponsors: NOAA RISA
A Report on a Statistical Model to Forecast Seasonal Inflows to Cowichan Lake
 A Report on a Statistical Model to Forecast Seasonal Inflows to Cowichan Lake Prepared by: Allan Chapman, MSc, PGeo Hydrologist, Chapman Geoscience Ltd., and Former Head, BC River Forecast Centre Victoria
US Drought Status. Droughts 1/17/2013. Percent land area affected by Drought across US ( ) Dev Niyogi Associate Professor Dept of Agronomy
 Dev Niyogi Associate Professor Dept of Agronomy") Droughts US Drought Status Dev Niyogi Associate Professor Dept of Agronomy Deptof Earth Atmospheric Planetary Sciences Indiana State Climatologist Purdue University LANDSURFACE.ORG iclimate.org climate@purdue.edu
Droughts US Drought Status Dev Niyogi Associate Professor Dept of Agronomy Deptof Earth Atmospheric Planetary Sciences Indiana State Climatologist Purdue University LANDSURFACE.ORG iclimate.org climate@purdue.edu
Global warming and Extremes of Weather. Prof. Richard Allan, Department of Meteorology University of Reading
 Global warming and Extremes of Weather Prof. Richard Allan, Department of Meteorology University of Reading Extreme weather climate change Recent extreme weather focusses debate on climate change Can we