BRIDGE SCOUR AND LEVEE OVERTOPPING
|
|
|
- Moses Briggs
- 5 years ago
- Views:
Transcription


1 BRIDGE SCOUR AND LEVEE OVERTOPPING Jean-Louis BRIAUD President of ISSMGE Professor at Texas A&M University ISSMGE 1 st WEBINAR 23 August Threshold of Optimum Simplicity Einstein said: Things should be made as simple as possible but not one bit simpler than that 2 1
2 Fundamentals Bridge Scour Scour depth predictions Observational method Case history Levee Overtopping Hurricanes Floods Case histories 3 3 Input to an erosion problem Soil (Erodibility Erodibility) Water (Velocity) Geometry (Dimensions) 4 Jean-Louis BRIAUD Texas A&M University 2
3 DEFINITION OF SOIL ERODIBILITY Relationship between the erosion rate and the velocity of the water near the soil-water interface. Relationship between the erosion rate and the shear stress at the soil-water interface. Z f ( ) Constitutive Law fo Soil Erosion Jean-Louis BRIAUD Texas A&M University 5. Constitutive Law for Soil Erosion. Z f ( ) m n p Z c u u u u Mean Net Shear Normal Shear Stress Stress Stress Turbulence Turbulence 6 Jean-Louis BRIAUD Texas A&M University 3


4 Erosion process
5 Erosion process 9 9 FLOW Erosion process FLOW SAND CLAY 5
6 Continuity equation RANS Equations m ( U ),m t Momentum (RANS) Equations g U t mn i U m U i,m R im,m 0 2g i m n m m i im mn i g p,m g U,n, m Energy Equation T C p U t U m, n T m, m U n, m il e lmn m mn u T, m g KT, n, m n mn i j u, nu, m gij g U, mu, n m U m u n Dp Dt i, m u j, n R t Reynolds Stresses Transport Equations ij U m R ij,m Production Diffusion by u m Diffusion by p Viscous Diffusion Pressure Strain Dissipation P P D D D ij ij u ij p ij v ij ij ij D 2e g ij u ( R lmn ( u g m jm mn 2g im U D j,m i u u j ij p ),m il R m ( g R i ( u p' /ρ ) R mn ij,mn ( p' / )( g u i,m u im j,n u jm,m D U jn j,m ij ij ij v i,m g g g ) jl im jm R in ( u u j i,m ) p' /ρ ) ),m

, ( 2 2 2 b W")

7 7 13 c b Z Z ), ( Scour Rate Equation 13 c b c b c b c b 0 c Z,, ), ( b W V U q n q ; 14 CONTRACTION RATIO = FLOW


8 CONTRACTION RATIO = FLOW 16 8


9


")


10 Testing for erodibility (EFA) EFA (Erosion Function Apparatus) Testing for erodibility (EFA) FINE SAND FLOW 10


11 LOW PI PREPARED CLAY FLOW FISSURED SILTY CLAY FROM ACTUAL BRIDGE SITE FLOW 11


12 FISSURED SILTY CLAY FROM ACTUAL BRIDGE SITE FLOW FISSURED SILTY CLAY FROM ACTUAL BRIDGE SITE FLOW 12


13 FISSURED SILTY CLAY FROM ACTUAL BRIDGE SITE FLOW Testing for erodibility (EFA) Erosion function for a fine sand 13
14 Testing for erodibility (EFA) Erosion function for a low PI clay EROSION FUNCTION APPARATUS TEST Erosion Rate (mm/hr) Very High Erodibility I Fine Sand -Non-plastic Silt High Erodibility II -Medium Sand -Low Plasticity Silt Medium Erodibility III -Jointed Rock (Spacing < 30 mm) -Fine Gravel Low Erodibility -Coarse Sand 1000 IV SP SM - Increase in Compaction (well graded soils) - Increase in Density - Increase in Water Salinity (clay) ML MH CL -High Plasticity Silt -Low Plasticity Clay -All fissured Clays CH Rock -Jointed Rock ( mm Spacing) -Cobbles -Coarse Gravel -High Plasticity Clay Very Low Erodibility V -Jointed Rock ( mm Spacing) -Riprap Velocity (m/s) Non-Erosive -Intact Rock VI -Jointed Rock (Spacing > 1500 mm) 14
15 Erosion Classification (Shear Stress) Erosion Rate (mm/hr) Very High Erodibility I Fine Sand -Non-plastic Silt High Erodibility II Medium Erodibility III -Medium Sand -Jointed Rock -Low Plasticity Silt (Spacing < 30 mm) -Fine Gravel Low Erodibility Coarse Sand IV High Plasticity Silt -Low Plasticity Clay -All fissured Clays - Increase in Compaction (well graded soils) - Increase in Density - Increase in Water Salinity (clay) SM SP ML MH CL CH -Jointed Rock ( mm Spacing) -Cobbles -Coarse Gravel -High Plasticity Clay Rock -Riprap Very Low Erodibility V -Jointed Rock ( mm Spacing) Non-Erosive -Intact Rock -Jointed Rock VI (Spacing > 1500 mm) Shear Stress (Pa) CRITICAL VELOCITY vs GRAIN SIZE INTACT ROCK CLAY SILT SAND GRAVEL RIP-RAP & JOINTED ROCK Critical Velocity, V c (m/s) V c = 0.03 (D 50 ) -1 US Army Corps of Engineers EM V c = 0.1 (D 50 ) -0.2 V c = 0.35 (D 50 ) E-06 1E Mean Grain Size, D 50 (mm) Joint Spacing for Jointed Rock 15

 -2 c = D 50 0.1 Curve proposed by c = 0.05 (D 50 ) -0.")


16 CRITICAL SHEAR STRESS vs GRAIN SIZE INTACT ROCK CLAY SILT SAND GRAVEL RIP-RAP & JOINTED ROCK Critical Shear Stress, c (N/m 2 ) US Army Corps of Engineers EM 1601 c = (D 50 ) -2 c = D Curve proposed by c = 0.05 (D 50 ) -0.4 Shields (1936) E-06 1E Mean Grain Size, D 50 (mm) Joint Spacing for Jointed Rock 31 POCKET ERODOMETER PET test result = Depth of hole in mm after 20 squirts at 8 m/s 32 $0.49 at WalMart Jean-Louis BRIAUD Texas A&M University 16


17 Velocity Calibration v 0x x 2H g 33 Jean-Louis BRIAUD Texas A&M University 34 Jean-Louis BRIAUD Texas A&M University 17
18 POCKET ERODOMETER TEST 35 Erodibility depends on soil properties 1. Soil water content 2. Soil unit weight 3. Soil plasticity index 4. Soil undrained shear str. 5. Soil void ratio 6. Soil swell 7. Soil mean grain size 8. Soil percent passding # Soil clay minerals 10. Soil dispersion i ratio 11. Soil cation exchange cap 12. Soil sodium absorption rat 13. Soil ph 14. Soil temperature 15. Water temperature 16. Water salinity 17. Water ph 36 Jean-Louis BRIAUD Texas A&M University 18
 0.00 0.00 20.00 40.00 60.00 80.00 100.00 120.00 140.00 Su(kPa) 37 Jean-Louis BRIAUD Texas A&M University EFA test on Creamy Peanut Butter S u = 1.8 kpa V c = 1.")
 38 Jean-Louis BRIAUD Texas A&M University")
19 NO SIMPLE CORRELATION! CSS vs.#200 CSS vs. Su CSS(Pa) R 2 = R 2 = #200(%) Su(kPa) 37 Jean-Louis BRIAUD Texas A&M University EFA test on Creamy Peanut Butter S u = 1.8 kpa V c = 1.4 m/s Erosion Rate 100 (mm/hr) 10 1 Very High Erodibility I High Erodibility II Medium Erodibility III Low Erodibility IV Very Low Erodibility V Velocity (m/s) Erosion 1000 Rate (mm/hr) Very High Erodibility I High Erodibility II Medium Erodibility III Low Erodibility IV Very Low Erodibility V Shear Stress (Pa) 38 Jean-Louis BRIAUD Texas A&M University 19

20 Shear Stress Applied by Water dz 39 Jean-Louis BRIAUD Texas A&M University 40 Jean-Louis BRIAUD Texas A&M University 20
21 41 Jean-Louis BRIAUD Texas A&M University Flow Hydrograph 42 Jean-Louis BRIAUD Texas A&M University 21


22 Velocity & Water Depth Hydrograph 43 Jean-Louis BRIAUD Texas A&M University Obtaining a design flood value 44 Jean-Louis BRIAUD Texas A&M University 22


23 NIAGARA FALLS m of lateral erosion from Lake Ontario towards Lake Erie in years or 0.1 mm/hr 45 Niagara Falls 1841 Lake Erie Lake Ontario Niagara River From Google Earth Jean-Louis BRIAUD Texas A&M University GRAND CANYON 1600 m of vertical erosion by the Colorado River in 10 Million years or mm/hr 46 Jean-Louis BRIAUD Texas A&M University 23


24 Fundamentals Bridge Scour Scour depth predictions Observational method Case history Levee Overtopping Hurricanes Floods Case histories 47 FOUNDATION DESIGN 48 J.-L. Briaud, Texas A&M University 24


25 1000 Mike Sullivan, NYDOT, 2005 lures from 502 Total) Number of Fail 1966 to 2005 ( % 50% 40% 30% 20% 10% 0% Construction Concrete Deterioration Earthquake Natural Steel Fire Misc. Percen nt Overload Collision Hydraulic Cause Jean-Louis Briaud 50 Jean-Louis BRIAUD Texas A&M University 25


26 51 Hatchie River Bridge, Tennessee Courtesy of the University of Kentucky at Louisville 52 26


27


28


29

30 Tie the two decks with cables Increase the support length Austin Scour Components Jean-Louis Briaud Texas A&M University 60 30
31 Scour Components Jean-Louis Briaud Texas A&M University 61 Scour types C L y s(abut) Applies Probable Flood Level y s(cont) Applies y s(abut) y s(pier) y s(cont) Normal Water Level Where, y s(abut) is Abutment Scour Depth y s(cont) is Contraction Scour Depth y s(pier) is Pier Scour Depth 31


32 Historic Meandering River Surveys 63 Mississippi River Meander Belt 64 32
33 Problem Constant flood velocity = 3m/s Flood duration = 48 hours Pier diameter = 2m Water depth = 5m What is the depth of scour after the flood? Solution HEC-18 CLAY Method z (mm/hr) Results of EFA tests t gave z vs Maximum hydraulic shear stress around pier: max 0.094V N / m log Re The initial rate of scour is z 30 mm/ hr critical velocity of soil is Vc 2.2 ( m/ s) The maximum depth of scour y s( Pier ) is: 0.7 y y 2.2 a 2.6 Fr Fr 5.2 m s ( Pier ) ( pier ) c ( pier ) 5. The equation for the () s( Pier) t curve is t 48( hrs) ys( Pier) ( t) 1127mm 1 t 1 48( hrs) z i ys( Pier) Maximum flood lasts 48 hours, therefore ys( Pier)( t) 1127mm or 21.7% of y s( Pier) z (mm/hr) y () 4000 s t (mm) 3000 z i 30 mm / hr max ( N / m ) 10 0 Vc 2.19( m/ sec) V ( m / sec) y 5191mm s( Pier) 2000 ys( Pier) 48hrs 1127mm T ( hrs) Problem: Solution: Constant flood velocity = 3m/s Flood duration = 48 hours Pier diameter = 2m Water depth = 5m What is the depth of scour after the flood? SRICOS Method 1. Results of EFA tests gave the z vs curve shown 2. Maximum hydraulic shear stress around the pier is: max 0.094V1 log Re N / m 3 2 log The initial rate of scour z is read on the EFA curve at max. z 30 mm / hr, and the critical velocity of soil is Vc 2.19( m/ s) 4. The maximum depth of scour y s( Pier) is: 0.7 y 2.2 a 2.6 Fr( Frc s( Pier pier ( pier ) ) ) m 5. The equation for the y () ( ) t curve is s( Pier) s Pier t 48( hrs) ys( Pier) ( t) 1127mm 1 t 1 48( hrs) z y i 6. Maximum flood lasts 48 hours, therefore y ( ) 1127 s( Pier) t mm or 21.7% of y s( Pier) z (mm/hr) z (mm/hr) y () 4000 s t (mm) z i 30 mm / hr Vc max 2.19( m/ sec) 2 ( N / m ) V ( m /sec) y 5191mm s( Pier) y 48hrs mm s( Pier) T ( hrs) 66 33
34 12000 W oodrow W ilson Bridge Hydrography Discharge (m 3 /sec) D Time (year) 7000 Scour D epth V s Tim e h (mm) Scour Depth T im e (y e a r ) 67 Jean-Louis Briaud-Texas A&M University Scour Depth versus Time 60 Scour Depth (mm) Z i Z max Measurement Hyperbola Hyperbola Model: zt () 1 z i t t z max Time(hr) 68 Jean-Louis Briaud-Texas A&M University 34
 600 z i 400 200 3.")
35 Y/B max( Pier) 0.25 max V 1 2 X/B 1 1 log Re 10 WEI (1997) 0.03 U 2 max max =f(re) U Re 69 Jean-Louis Briaud-Texas A&M University Time dependent predictions z (mm/hr) 600 z i Pa c max (Pa) 70 35
36 SRICOS - EFA Scour in constant flow V 60 ( m/ s) ys() t 60 (mm) Time ( hrs). Z i Max. scour Z max Constant flow. Z i is obtained from t max Scour development Hyperbolic shape Time ( hrs) Scour depth as a function of time (hyperbolic model) t ys () t 1 t z y i s Max. Scour depth Erosion function Max. shear stress 36

 s( Pier) t curve is t 48( hrs) ys( Pier) ( t) 1127mm 1 t 1 48( hrs) z i ys( Pier) 30 5191 6. Maximum flood lasts 48 hours, therefore ys( Pier)( t) 1127mm or 21.")
37 Problem Constant flood velocity = 3m/s Flood duration = 48 hours Pier diameter = 2m Water depth = 5m What is the depth of scour after the flood? 73 Solution HEC-18 CLAY Method z (mm/hr) Results of EFA tests t gave z vs Maximum hydraulic shear stress around pier: max 0.094V N / m log Re The initial rate of scour is z 30 mm/ hr critical velocity of soil is Vc 2.2 ( m/ s) The maximum depth of scour y s( Pier ) is: 0.7 y y 2.2 a 2.6 Fr Fr 5.2 m s ( Pier ) ( pier ) c ( pier ) 5. The equation for the () s( Pier) t curve is t 48( hrs) ys( Pier) ( t) 1127mm 1 t 1 48( hrs) z i ys( Pier) Maximum flood lasts 48 hours, therefore ys( Pier)( t) 1127mm or 21.7% of y s( Pier) z (mm/hr) y () 4000 s t (mm) z i 30 mm / hr max ( N / m ) 10 0 Vc 2.19( m/ sec) V ( m / sec) y 5191mm s( Pier) ys( Pier) 48hrs 1127mm T ( hrs) 74 J.-L. Briaud, Texas A&M University 37


38 75 J.-L. Briaud, Texas A&M University 76 J.-L. Briaud, Texas A&M University 38


39 77 J.-L. Briaud, Texas A&M University 78 J.-L. Briaud, Texas A&M University 39


40 79 J.-L. Briaud, Texas A&M University 80 J.-L. Briaud, Texas A&M University 40


41 81 J.-L. Briaud, Texas A&M University 82 J.-L. Briaud, Texas A&M University 41
42 60 Scour Depth (m mm) Z i Z max 10 Measurem ent Hyperbola Time(hr) 83 Jean-Louis Briaud-Texas A&M University y Maximum pier scour (Oh, 2009) s( Pier) a ' where, K K K K 2.6Fr Fr w 1 L sp ( pier) c( pier) 0.33 y1 y1 0.89, for 1.43 Kw a' a' 1.0, else 1.0, for 30 K1 Value in following Table, else KL 1.0, for whole range of L/ a 0.91 S S 2.9, for 3.42 K sp a' a' , else K 1 Shape of pier nose Shape of pier nose Square nose 1.1 Circular cylinder 1.0 Round nose 1.0 Sharp nose 0.9 K
43 Max. shear stress for pier scour (Nurtjahyo, 2003) Cylindrical pier in deep water 0094V max log Re 10 V1 a where, Re is the kinematic viscosity of water (10 6 m 2 /s at 20 o C) V1 a y Complex pier max ksh k kw ksp V1 log Re 10 where, k sh kw 116 L 4 a e 4 y a e k ksp S a e Maximum pier scour (Oh, 2009) 6 5 y s(pier) /a 4 3 y = x R² = (2.6Fr (pier) Fr c(pier) ) 0.7 y/a= 16 y/a = 6.4 y/a = 6.6 y/a=5.33 y/a = 3.4 y/a = 2.13 y/a = 2.0 y/a = 1.67 y/a =


44 Maximum and uniform contraction scour 87 Jean-Louis Briaud Texas A&M University 44


45 B 2 /B 1 = 0.75 Jean-Louis Briaud Texas A&M University B 2 /B 1 = 0.5 Jean-Louis Briaud Texas A&M University 45

 y m1 1.27 1.83Fr Fr m2 mc 2.")

46 B 2 /B 1 = 0.25 Jean-Louis Briaud Texas A&M University Maximum and uniform contraction scour (Oh, 2009) y s( Cont) y m Fr Fr m2 mc 2.5 y s(cont) /y m y = x R² = Li (Long contraction) (2002) WW in rect. 0 Best Fit Frm2 Frmc 92 46
47 Max. shear stress for contraction scour (Nurtjahyo, 2003) Max. shear stress without contraction (Munson et al., 1990) max( Cont ) 1 h gn V R Max. shear stress with contraction max( Cont) kk R Wakk wgnvr 1 h where, A k R A 1.75 kw k 1.5 wa 1.0 for all conditions 2 k Wa 1.0,for 0.35 L' left L' right 2 W a W a , otherwise L' left L' right L' left L' right Maximum abutment scour (Briaud et al. 2009) 94 47


48 Clay Installation Jean-Louis Briaud Texas A&M University 95 View of Test Section Jean-Louis Briaud Texas A&M University 96 48


 98")


49 97 Maximum abutment scour (Briaud et al. 2009) Maximum abutment scour (Briaud et al. 2009) 98 49


50 Flow Direction Jean-Louis Briaud Texas A&M University 99 Maximum abutment scour (Briaud et al. 2009)
 y y s(abut) / y f1 s( Abut) y f 1 5 4.5 4 3.5 3 2.")

51 Maximum abutment scour (Briaud et al. 2009) y y s(abut) / y f1 s( Abut) y f K K K K K Fr Fr 1 2 L G Re f 2 fc y = 1.000x R² = Frf 2 Frfc
 Cr sh Fr s sk L o 1 12.45k k k k k k k V Re Cr sh Fr s sk L o 2 0.")

 / y f 1 ' 1.0 for 1 ( Lf L) / yf 0.92 d1 / ddeck 1.0 for d1 / ddeck 1.0 2 ko 0.")
52 103 Max. Shear stress for abutment scour (Briaud et al. 2009) 5.93k k k k k k k 2.1V Re max( Abut) Cr sh Fr s sk L o k k k k k k k V Re Cr sh Fr s sk L o where, k k Cr Fr q q 1 k sh L' 0.85 W a 2.07Fr 0.8 for Fr > for Fr k s ksk vertical-wall abutment 0.65 wing-wall abutment 0.58 spill-through abutment 1.0 for L ' f L / yf 2 ' ' 0.6( Lf L) / yf 1.2 for 2 ( Lf L) / yf 0 kl ' ' 1.2( L f L) / y f 1.2 for 0 ( L f L) / y f 1 ' 1.0 for 1 ( Lf L) / yf 0.92 d1 / ddeck 1.0 for d1 / ddeck ko 0.21 d1 / ddeck 1.27 d1 / ddeck 2.97 for 1.0 d1 / ddeck for 3.0 d1 / ddeck
53 2 1 Max. Friction Coefficient C V f _ VW max / C f _ VW 21. Re 045. VW abutment results VW abutment Eq. 1.0E E E E+07 V1 Wa Re 8.0 Velocity influence in same geometry 2.1V Re where, V W is the kinematic viscosity of Water (10 6 m 2 /s at 20 o C) 1 a Re k Cr k q2 Cr Contraction influence (K Cr ) q 1 q q Unit discharge ratio, (q 2 /q 1 ) where, q1 V1 y1 q V y A / A W oodrow W ilson Bridge Hydrography Discharge (m 3 /sec) D Time (year) 7000 Scour D epth V s Tim e h (mm) Scour Depth T im e (y e a r ) 106 Jean-Louis Briaud-Texas A&M University 53
54 Scour due to a sequence of two flood events V ( / ) 60 m s50 2 V V 1 t t 1 2 Sequent flood 0 ys() t 60 (mm) Time ( hrs) t t 1 2 Scour development 10 0 * t Time ( hrs) Scour of a two-layer soil v ys() t 60 (mm) y Layer 1 (Hard) t Time ( hrs) v ys() t 60 (mm) y 1 Layer 2 (Soft) t * Time ( hrs) v Layer 1 (Hard) Layer 2 (Soft) y 1 ys() t 60 (mm) y t * t Time ( hrs) 54
55 1 ' ' ' 0.91 ' a ' a ' 2 ' ' f f f f ' ' f f f f ' ' f f f1 f1 s( Abut ) L G p f 2 f 2 fc f 1 f 2 1 f ' ' a ' f f q q L q a e q L W W W L L 2.07Fr 0.8 Fr>0.1 y 4 a 1.0 Fr e 1.0 for VW S 1.1 a 1 5e 0.65 for WW and ST 1.0 L L / y for rectangular nose 0.6( L L) / y ( L L) / y for round nose & cylinder 1.2( L L) / y ( L L) / y 1 y scont ( ) ( L L) / y y y Fr2( Cont ) Frmc 0.89, for < 1.43 y a a m d / h1, if d / h , for otherwise max( Cont ) kk R Wakk wnvr 1 h 1.83 d / h 3.76 d / h2.97, if 0.33 d / h1.0 S S 1.0, if 1.0 d / h 2.9, for < 3.2 a a 1.0, for otherwise 1.22 for VW 1.0 for WW 0.73 for ST ys ( Pier ) K1 Ksp KL Kw Fr( pier ) Frc ( pier ) a' max( pier ) kk w shkspk 0.094V log Re for otherwise L L L L <1.5 y y 1.0 otherwise y y Re K K K K K Fr Fr max( Abut ) 12.45kCrkshkFrksksk klkov1 Re Hydrograph (Add 500year flood) Streamflow(m 3 /s) Time (Year) Scour Depth Vs. Time (Add 500year flood) 12 Scour Dep epth (m) Time (Year) 110 Jean-Louis Briaud-Texas A&M University 55
56 What is the frequency of occurrence and probability of exceedance for Q 100 = 12,629 m 3 /s, Q 500 = 16,639 m 3 /s, and L t = 75 yrs? Frequency of Occurrence vs. Scour Depth Probability of exceedance vs. Scour Depth 112 J.-L. Briaud, Texas A&M University 56
57 Woodrow Wilson Bridge on I-495 in Washington D.C. 113 Probably of Exceedance PoE yr 53% PoE, v 100 = 28* 2.8 m/s 500 yr 13.9% PoE, v 500 = 3.25* m/s yr 0.75% PoE, v = 3.95* m/s * Example for Woodrow Wilson Bridge for 75 year design life. Structural Eng. operate at a Prob. of Exceedance of 0.1%? Geotechnical Eng. operate at a Prob. of Exceedance of 1%? Hydraulic Eng. operate at a Prob. of Exceedance of 10%? 57
58 VERIFICATION Pre edicted Scour Depth (cm m) SRICOS-EFA HEC M easured Scour Depth (cm) 115 Jean-Louis Briaud Texas A&M University Verification Predcition (m) Predcition (m) Measurement (m) Measurement (m) Prediction vs. Froehlich s pier scour database (1988) Prediction vs. Muller and Lander s pier scour database (1996)
59 Verification Uniform contraction scour Prediction (mm m) Komura (1966) Gill (1981) Webby (1984) Lim (1993) Measurement (mm) Prediction vs. Gill s uniform contraction scour database (1981), Komura (1966), Webby (1984), Lim (1993) 117 Verification Maximum abutment scour I Prediction (m) Measurement (m) W.W. (1982) Kwan W.W. (1988) Tey W.W. (1984) Wong Liu S.T. (1961) Tey S.T. (1984) Wong S.T. (1982) Tey V.W. (1984) Liu V.W. (1961) Gill V.W. (1972) Garde V.W. (1961) Kwan V.W. (1984) Prediction (m) Measurement (m) V.W. (Long) V.W. (Inter) V.W. (Short) S.T. (Inter) S.T. (Short) W.W. (Inter) Prediction vs. Froehlich s abutment scour database (1981) Prediction vs. Sturm s abutment scour database (2004)
60 Verification Maximum abutment scour II Prediction (m) ST WW Measurement (m) ) Prediction (m) Q100 Historic data Measurement (m) Prediction vs. Ettema et al. s abutment scour database (2008) Prediction vs. Benedict and Caldwell s abutment scour database (2006) 119 Fundamentals Bridge Scour Scour depth predictions Observational method Case history Levee Overtopping Hurricanes Floods Case histories
61 Scour Critical Bridge means Foundation is unstable for calculated and/or observed scour conditions / in the U.S. 600 / in Texas Jean-Louis BRIAUD 121 OBSERVATION METHOD FOR BRIDGE SCOUR Step 1: Observe maximum scour depth = Zmo Step 2: Find out the maximum flood the bridge has been subjected to = Vmo Step 3: Extrapolate field measurements to predict future scour depth Zfut / Zmo = F (Vfut / Vmo) Step 4: Compare future scour depth to foundation depth Zfut < Zfound / 2 Jean-Louis BRIAUD
62 Drawbacks Requires a good network of flow gages and rain gages Cannot be used for new bridges Estimate in filling (USGS has found that it was rare and measured from 2 to 5 ft) Jean-Louis BRIAUD 123 Advantages No need for erosion testing Actual soil Actual flow history Actual geometry Based on observed measurements Jean-Louis BRIAUD
63 Observation Method for Bridge Scour Step 1: Observe maximum scour depth = Zmo Step 2: Find out the maximum flood the bridge has been subjected to = Vmo Step 3: Extrapolates field measurements to predict future scour depth Zfut/Zmo = F (Vfut/Vmo) Step 4: Compare future scour depth to foundation depth Zfut < Zfound/2 Jean-Louis BRIAUD 125 Step 1: Observe maximum scour depth = Zmo Jean-Louis BRIAUD
 Step 4: Compare future scour depth to foundation depth Zfut < Zfound/2 Jean-Louis BRIAUD 127 Step 2: Find out the maximum flood the bridge has been")
64 Observation Method for Bridge Scour Step 1: Observe maximum scour depth = Zmo Step 2: Find out the maximum flood the bridge has been subjected to = Vmo Step 3: Extrapolates field measurements to predict future scour depth Zfut/Zmo = F (Vfut/Vmo) Step 4: Compare future scour depth to foundation depth Zfut < Zfound/2 Jean-Louis BRIAUD 127 Step 2: Find out the maximum flood the bridge has been subjected to = Vmo 930 Flow Gages in Texas Jean-Louis BRIAUD


")

65 Step 2: Find out the maximum flood the bridge has been subjected to = Vmo Maximum flood analysis Jean-Louis BRIAUD 129 Step 2: Find out the maximum flood the bridge has been subjected to = Vmo Maximum RI map between 1970 and 2005 Automated with TAMU- FLOOD software (free on internet) Jean-Louis BRIAUD

66 Step 2: Find out the maximum flood the bridge has been subjected to = Vmo Maximum RI map between 1920 and 2005 Automated with TAMU- FLOOD software (free on internet) Jean-Louis BRIAUD 131 Observation Method for Bridge Scour Step 1: Observe maximum scour depth = Zmo Step 2: Find out the maximum flood the bridge has been subjected to = Vmo Step 3: Extrapolates field measurements to predict future scour depth Zfut/Zmo = F (Vfut/Vmo) Step 4: Compare future scour depth to foundation depth Zfut < Zfound/2 Jean-Louis BRIAUD
67 Step 3: Extrapolates field measurements to predict future depth Zfut/Zmo = F (Vfut/Vmo) Known = Zmo and Vmo Choose Vfut Obtain Zfut from charts Zfut / Zmo = F (Vfut / Vmo) Jean-Louis BRIAUD 133 Step 3: Extrapolates field measurements to predict future depth Zfut/Zmo = F (Vfut/Vmo) The Z-Future Charts were developed by performing a large number (~350,000) of HEC-18 Clay simulations using Varying pier & contraction scour geometry Varying soil conditions Varying velocities Varying age of the bridge Jean-Louis BRIAUD
68 Erosion Rate (mm/hr) Very High Erodibility I Fine Sand -Non-plastic Silt High Erodibility II -Medium Sand -Low Plasticity Silt Medium Erodibility III -Jointed Rock (Spacing < 30 mm) -Fine Gravel Low Erodibility -Coarse Sand 1000 IV SP SM - Increase in Compaction (well graded soils) - Increase in Density - Increase in Water Salinity (clay) ML MH CL -High Plasticity Silt -Low Plasticity Clay -All fissured Clays CH Rock -Jointed Rock ( mm Spacing) -Cobbles -Coarse Gravel -High Plasticity Clay Very Low Erodibility V -Jointed Rock ( mm Spacing) -Riprap Velocity (m/s) Non-Erosive -Intact Rock VI -Jointed Rock (Spacing > 1500 mm) 135 Step 3: Extrapolates field measurements to predict future scour depth Zfut/Zmo = Vfut/Vmo 2.8 Z fut /Z mo Category III Materials Upstream Water Depth (H 1 1) ): 5 m to 20 m Contraction Ratio (R c ) : 0.5 to 0.9 Critical Velocity (V c ) : 0.5 m/s Pier Diameter (D) : 0.1m to 1.0 m t hyd = 25 years V fut /V mo 2.0 Jean-Louis BRIAUD
69 Step 3: Extrapolates field measurements to predict future scour depth Zfut/Zmo = Vfut/Vmo Jean-Louis BRIAUD 137 Observation Method for Bridge Scour Step 1: Observe maximum scour depth = Zmo Step 2: Find out the maximum flood the bridge has been subjected to = Vmo Step 3: Extrapolates field measurements to predict future scour depth Zfut/Zmo = F (Vfut/Vmo) Step 4: Compare future scour depth to foundation depth Zfut < Zfound / 2 Jean-Louis BRIAUD
 Z fut 15 10 5 0 5 0 5 10 15 20 25 30 Z fut Measured (ft) Jean-Louis BRIAUD 140 70")
70 Step 4: Compare future scour depth to foundation depth Zfut < Zfound / 2 Jean-Louis BRIAUD 139 VERIFICATION t Predicted (ft) Z fut Z fut Measured (ft) Jean-Louis BRIAUD
71 APPLICATION TO SCOUR CRITICAL BRIDGES 15 bridges selected (12 scour critical, 3 stable) 6 scour critical bridges out of the 12 found stable by the observation method 3 stable bridges found stable by the observation method 6 of 12 bridges originally classified scour critical were found stable by the observation method Jean-Louis BRIAUD 141 Fundamentals Bridge Scour Scour depth predictions Observational method Case history Levee Overtopping Hurricanes Floods Case histories


72 Woodrow Wilson Bridge and Pier Scour 143 Jean-Louis BRIAUD Texas A&M University 144 Jean-Louis BRIAUD Texas A&M University 72


73 New Woodrow Wilson Bridge 145 Jean-Louis BRIAUD Texas A&M University Jean-Louis Briaud-Texas A&M University
 148")
 EL.")
 58.1 m 5.9 m EL. -10.")

74 147 Jean-Louis BRIAUD Texas A&M University Bascule Pier Layout (M1) 148 Arch Rib Direction of Flow EL. 4 m (500 yr) EL. 3 m (100 yr) Pedestal EL. 0.6 m (Ave.) 58.1 m 5.9 m EL m (River Bottom) 1.8 m Dia. open ended steel pipe pile 39.2 m Estimated Tip EL m 26.5 m Jean-Louis BRIAUD Texas A&M University 74
75 Testing for erodibility (EFA) EFA (Erosion Function Apparatus) Flow vs. Time Stream flow (m 3 /s) Time (Year) Pier scour depth vs. Time (m) Scour Depth Time (Year) 75


76 Comparison of Scour Predictions Bascule Pier M1 (500yr Flood) Scour Depth (m HEC-18 Sand (Pile Width) HEC-18 Sand (Pile Cap) Salim- Jones HEC-18 Clay (Texas A&M) Erodibility Index Large Scale Flume Test Small Scale Flume Test Selected Scour Jean-Louis BRIAUD Texas A&M University TO SCALE152 NEW BRIDGE WITH STRATIGRAPHY NOT TO SCALE Jean-Louis BRIAUD Texas A&M University 76

 EL. 0.6m (Ave.")
 Glacial Sand 100 yr scour")

 Jean-Louis BRIAUD")
77 Pile for Bascule Pier (M1) 153 M1: Earthquake M2: Vessel Collision M3~M10: Wind Load 618 kn kn EL. 4 m (500 yr) EL. 3 m (100 yr) EL. 0.6m (Ave.) River Alluvial Soil 5.9 m 13.0 m EL m (River Bottom) Glacial Sand 100 yr scour depth 45.1 m Cretaceous Clay Open Ended Steel Pipe Pile (D = 1.8 m, L = 64 m) EL m (Estimated Pile Tip) Jean-Louis BRIAUD Texas A&M University Static Load Test 154 Jean-Louis BRIAUD Texas A&M University 77


78 155 Statnamic Load Test Jean-Louis BRIAUD Texas A&M University 156 Jean-Louis BRIAUD Texas A&M University 78
79 ITEM Total cost of the bridge project with approaches Cost of the bridge between abutments COST 2000 Million Dollars 625 Million Dollars Cost of foundation 125 Milllion Dollars Length of piles with 20 m scour hole Length of piles with 10 m scour hole Potential saving Instrumentation would have cost about 60 meters 50 meters 22 Million Dollars 0.5 Million Dollars 157 Conclusion The SRICOS-EFA method is a new method top predict bridge scour depth based on large flume tests, advanced anced numerical simulations, and verification at full scale and against several databases. This method is less conservative than the current method because it takes the soil erosion resistance and the time effect into account. The software is free on Briaud s web site (Google Briaud) including examples and user s guide


80 Fundamentals Bridge Scour Scour depth predictions Observational method Case history Levee Overtopping Hurricanes Floods Case histories Overtopping Erosion Levee Failure Modes (Martindale, 2009) 80

 162")

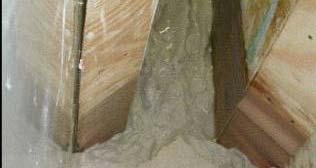
81 Overtopping Erosion 161 Floodwall Case 161 (Ellis Lucia/The Times Picayune) 162 Overtopping Erosion Dec1954 Maade Dike (Germany North Coast) 81


82 Dec1954 Maade Dike (Germany North Coast) Dec1954 Maade Dike (Germany North Coast) 82


83 Dec1954 Maade Dike (Germany North Coast) Dec1954 Maade Dike (Germany North Coast) 83


84 Dec1954 Maade Dike (Germany North Coast) Dec1954 Maade Dike (Germany North Coast) 84


85 Dec1954 Maade Dike (Germany North Coast) Dec1954 Maade Dike (Germany North Coast) 85
86 Erosion Classification (Shear Stress) Erosion Rate (mm/hr) Very High Erodibility I Fine Sand -Non-plastic Silt High Erodibility II Medium Erodibility III -Medium Sand -Jointed Rock -Low Plasticity Silt (Spacing < 30 mm) -Fine Gravel Low Erodibility Coarse Sand IV High Plasticity Silt -Low Plasticity Clay -All fissured Clays - Increase in Compaction (well graded soils) - Increase in Density - Increase in Water Salinity (clay) SM SP ML MH CL CH -Jointed Rock ( mm Spacing) -Cobbles -Coarse Gravel -High Plasticity Clay Rock -Riprap Very Low Erodibility V -Jointed Rock ( mm Spacing) Non-Erosive -Intact Rock -Jointed Rock VI (Spacing > 1500 mm) Shear Stress (Pa) Fundamentals Bridge Scour Scour depth predictions Observational method Case histories Levee Overtopping Hurricanes Floods Case histories


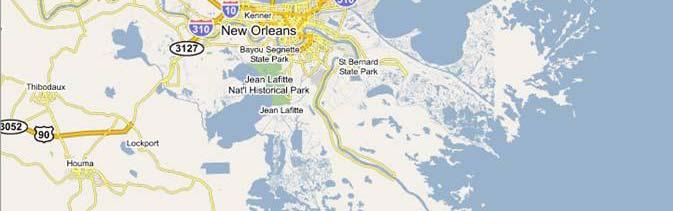
87 Overtopping Erosion Overtopping During Hurricane Events Hurricane Katrina New Orleans, Louisiana Overtopping Erosion The Event 250 miles in diameter 25 miles per hour 6000 wave cycles Storm surge 10 hours Duration over a bridge or levee = 10 hours


88 Overtopping Erosion Storm Surge 8.5 m 4.6 m 3.0 m Overtopping Erosion Storm Surge


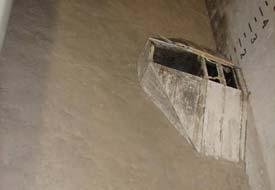
89 Overtopping Erosion Overtopping Erosion


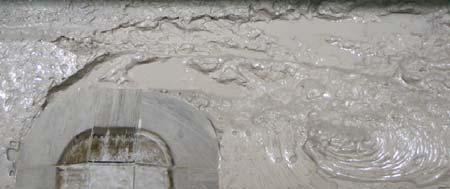
90 Overtopping Erosion Overtopping Erosion


91 Overtopping Erosion Overtopping Erosion


92 Overtopping Erosion Overtopping Erosion The Investigation
93 Overtopping Erosion EFA Test Results Erosion Rate vs. Water Velocity Erosion Rate (mm/hr) Very High Erodibility I High Erodibility II Medium Erodibility III Low Erodibility IV 10 Very Low Erodibility V 1 Non- Erosive 0.1 VI Velocity (m/s) S1-B1-(0-2ft)-TW S1-B1-(2-4ft)-SW S2-B1-(0-2ft)-TW S2-B1-(2-4ft)-SW S3-B1-(2-4ft)-SW S3-B2-(0-2ft)-SW S3-B3-(0-1ft)-SW S4-(0-0.5ft)-LC-SW S4-(0-0.5ft)-HC-SW S5-(0-0.5ft)-LT-SW S6-(0-0.5ft)-LC-SW S7-B1-(0-2ft)-TW S7-B1-(2-4ft)-SW S8-B1-(0-2ft)-TW S8-B1-(2-4ft)-L1-SW S8-B1-(2-4ft)-L2-SW S11-(0-0.5ft)-LC-TW S11-(0-0.5ft)-HC-TW S12-B1-(0-2ft)-TW S12-B1-(2-4ft)-SW S15-Canal Side-(0-0.5ft)-LC-SW S15-CanalSide-(0-0.5ft)-HC-SW S15-Levee Crown-(0-0.5ft)-LT-SW S15-Levee Crown-( ft)-LT-SW Overtopping Erosion Levees Failed and Not Failed Erosion Rate (mm/hr) Note: - Solid circles = levee breaches - Empty circles = no levee damage Very High Erodibility I High Erodibility II Medium Erodibility III 1000 Low 100 Erodibility IV 10 Very Low Erodibility V 1 Non-Erosive VI Velocity (m/s) S2-B1-(0-2ft)-TW S2-B1-(2-4ft)-SW S3-B1-(2-4ft)-SW S3-B2-(0-2ft)-SW S3-B3-(0-1ft)-SW S4-(0-0.5ft)-LC-SW S5-(0-0.5ft)-LT-SW S6-(0-0.5ft)-LC-SW S15-Canal Side-(0-0.5ft)-LC-SW S15-CanalSide-(0-0.5ft)-HC-SW S15-Levee Crown-(0-0.5ft)-LT-SW S15-Levee Crown-( ft)-LT-SW
94 Overtopping Erosion Levee Overtopping Chart
95 t = 0.80 sec t = 1.60 sec t = 2.39 sec 189 Jean-Louis BRIAUD Texas A&M University SHEAR STRESSES ON LEVEE SURFACE 190 Jean-Louis BRIAUD Texas A&M University 95


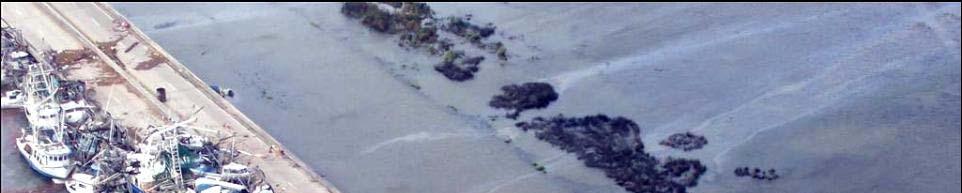
96 Fundamentals Bridge Scour Scour depth predictions Observational method Case history Levee Overtopping Hurricanes Floods Case histories Overtopping Erosion Overtopping During Floods Events Midwest Levees Summer


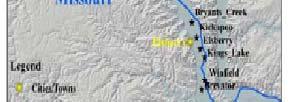
97 Overtopping Erosion 193 Flow Frequency Analysis 7 year flood year flood 13 year flood 6 year flood Overtopping Erosion 194 Winfield Pin Oak
")
")
98 Overtopping Erosion 195 Winfield Pin Oak (Failed) 195 Overtopping Erosion 196 Indian Graves (Failed)

 197")

 198 99")
99 Overtopping Erosion 197 Norton Woods (Failed) 197 Overtopping Erosion 198 Brevator (Did Not Fail)


100 Overtopping Erosion 199 THE INVESTIGATION Sample Collection In situ testing 199 Overtopping Erosion EFA test results Erosion rate versus water velocity


101 Overtopping Erosion LEVEES Failed and Not Failed Overtopping Erosion Levee Overtopping Chart


102 Overtopping Erosion Vegetative Armor Good grass type and coverage Poor grass type and coverage Levee failure: effect of vegetation 204 Here is an example of what tree damage or other items that have grown too close to the levee can do. (Zina Deretsky, NSF)
103 Overtopping Erosion 205 Recommendations: Vegetative Armor Mat like, sod forming root system Perennial grasses Dense consistent coverage Height ihabove m during flood season Trees limited to 15 m beyond levee toe 205 Overtopping Erosion ELEVATED HOUSES


104 Overtopping Erosion Elevated Houses Jean-Louis Briaud


105 Overtopping Erosion ESCAPE STRUCTURES Fundamentals Bridge Scour Scour depth predictions Observational method Case history Levee Overtopping Hurricanes Floods Case histories
106 tamu edu/briaud/ Briaud s Web Site 6 th International Conference on Scour and Erosion Paris August TH International Conference of Soil Mechanics and Geotechnical Engineering Paris 1 to 5 Sept p// g PANAM Conference Toronto 2 to 6 Oct cgc2011.ca
107 213 If your faucet drips on a pebble for 20 million years, will there be a hole in the pebble?
EROSION FUNCTION APPARATUS
 EROSION FUNCTION APPARATUS 51 EROSION FUNCTION APPARATUS Author: Faculty Sponsor: Department: Ryan Larsen Dr. Allen Jones, Dr. Francis Ting Civil and Environmental Engineering ABSTRACT The Erosion Function
SCOUR CHARACTERIZATION DUE TO WATER FREE FALL
 SCOUR CHARACTERIZATION DUE TO WATER FREE FALL Abdolreza Osouli, Corresponding Author, Ph.D., P.E. Assistant Professor of Civil Engineering, Southern Illinois University at Edwardsville, Engineering Building,
A STUDY OF LOCAL SCOUR AT BRIDGE PIERS OF EL-MINIA
 A STUDY OF LOCAL SCOUR AT BRIDGE PIERS OF EL-MINIA Dr. Gamal A. Sallam 1 and Dr. Medhat Aziz 2 ABSTRACT Bridges are critical structures that require a substantial investment to construct and serve an important
Proceedings of the 6 th International Conference on the Application of Physical Modelling in Coastal and Port Engineering and Science (Coastlab16)
") Proceedings of the 6 th International Conference on the Application of Physical Modelling in Coastal and Port Engineering and Science (Coastlab16) Ottawa, Canada, May 10-13, 2016 Copyright : Creative Commons
Proceedings of the 6 th International Conference on the Application of Physical Modelling in Coastal and Port Engineering and Science (Coastlab16) Ottawa, Canada, May 10-13, 2016 Copyright : Creative Commons
Erosion Function Apparatus
 The Journal of Undergraduate Research Volume 6 Journal of Undergraduate Research, Volume 6: 2008 Article 6 2008 Erosion Function Apparatus Ryan Larsen South Dakota State University Follow this and additional
US Army Corps of Engineers BUILDING STRONG
 Greater New Orleans Hurricane and Storm Damage Risk Reduction System Robert Rowlette Senior Senior Program Manager Task Force Hope U.S. Army Corps of Engineers April 19, 2012 US Army Corps of Engineers
Greater New Orleans Hurricane and Storm Damage Risk Reduction System 101
 Greater New Orleans Hurricane and Storm Damage Risk Reduction System 101 René Poché New Orleans District U.S. Army Corps of Engineers US Army Corps of Engineers BUILDING STRONG 1878 Gentilly Ridge Metairie
Countermeasure Calculations and Design
 Countermeasure Calculations and Design Summarized from Bridge Scour and Stream Instability Countermeasures, Experience, Selection, and Design Guidance, Second Edition, Publication No. FHWA NHI 01-003,
PART 4 HURRICANE KATRINA STRIKES NEW ORLEANS AUGUST 2005
 PART 4 HURRICANE KATRINA STRIKES NEW ORLEANS AUGUST 2005 Hurricane Katrina Hurricane Katrina swept across southern Florida and lost momentum, then gained speed and water, showing the second lowest barometric
Evaluation of Scour Depth around Bridge Piers with Various Geometrical Shapes
 Evaluation of Scour Depth around Bridge Piers with Various Geometrical Shapes Dr. P. D. Dahe * Department of Civil Engineering, SGGSIE&T, Vishnupuri, Nanded (Maharashtra) S. B. Kharode Department of Civil
A. V T = 1 B. Ms = 1 C. Vs = 1 D. Vv = 1
 Geology and Soil Mechanics 55401 /1A (2002-2003) Mark the best answer on the multiple choice answer sheet. 1. Soil mechanics is the application of hydraulics, geology and mechanics to problems relating
Geology and Soil Mechanics /1A ( ) Mark the best answer on the multiple choice answer sheet.
 Mark the best answer on the multiple choice answer sheet.") Geology and Soil Mechanics 55401 /1A (2003-2004) Mark the best answer on the multiple choice answer sheet. 1. Soil mechanics is the application of hydraulics, geology and mechanics to problems relating
Geology and Soil Mechanics 55401 /1A (2003-2004) Mark the best answer on the multiple choice answer sheet. 1. Soil mechanics is the application of hydraulics, geology and mechanics to problems relating
CONCEPTS Conservational Channel Evolution and Pollutant Transport System
 CONCEPTS Conservational Channel Evolution and Pollutant Transport System Eddy J. Langendoen Watershed Physical Processes Research Unit National Sedimentation Laboratory USDA Agricultural Research Service
Drilled Shaft Foundations in Limestone. Dan Brown, P.E., Ph.D. Dan Brown and Associates
 Drilled Shaft Foundations in Limestone Dan Brown, P.E., Ph.D. Dan Brown and Associates Foundation Engineering How we teach our students Fundamental understanding of soil and rock behavior (good!) Focus
CE 240 Soil Mechanics & Foundations Lecture 3.2. Engineering Classification of Soil (AASHTO and USCS) (Das, Ch. 4)
 (Das, Ch. 4)") CE 240 Soil Mechanics & Foundations Lecture 3.2 Engineering Classification of Soil (AASHTO and USCS) (Das, Ch. 4) Outline of this Lecture 1. Particle distribution and Atterberg Limits 2. Soil classification
CE 240 Soil Mechanics & Foundations Lecture 3.2 Engineering Classification of Soil (AASHTO and USCS) (Das, Ch. 4) Outline of this Lecture 1. Particle distribution and Atterberg Limits 2. Soil classification
INTRODUCTION TO STATIC ANALYSIS PDPI 2013
 INTRODUCTION TO STATIC ANALYSIS PDPI 2013 What is Pile Capacity? When we load a pile until IT Fails what is IT Strength Considerations Two Failure Modes 1. Pile structural failure controlled by allowable
EXAMPLES (SEDIMENT TRANSPORT) AUTUMN 2018
 AUTUMN 2018") EXAMPLES (SEDIMENT TRANSPORT) AUTUMN 2018 Q1. Using Cheng s formula estimate the settling velocity of a sand particle of diameter 1 mm in: (a) air; (b) water. Q2. Find the critical Shields parameter diameter
EXAMPLES (SEDIMENT TRANSPORT) AUTUMN 2018 Q1. Using Cheng s formula estimate the settling velocity of a sand particle of diameter 1 mm in: (a) air; (b) water. Q2. Find the critical Shields parameter diameter
Unlined Spillway Erosion Risk Assessment
 Unlined Spillway Erosion Risk Assessment Johannes Wibowo Don Yule Evelyn Villanueva U.S. Army COE ERDC Darrel Temple USDA Tuttle Creek, KS Introduction Canyon Dam Spillway, Texas Date: July 6, 2002 Flow:
Estimating Scour. CIVE 510 October 21 st, 2008
 Estimating Scour CIVE 510 October 21 st, 2008 1 Causes of Scour 2 Site Stability 3 Mass Failure Downward movement of large and intact masses of soil and rock Occurs when weight on slope exceeds the shear
Liquefaction and Foundations
 Liquefaction and Foundations Amit Prashant Indian Institute of Technology Gandhinagar Short Course on Seismic Design of Reinforced Concrete Buildings 26 30 November, 2012 What is Liquefaction? Liquefaction
Chapter 7 Permeability and Seepage
 Permeability and Seepage - N. Sivakugan (2005) 1 7.1 INTRODUCTION Chapter 7 Permeability and Seepage Permeability, as the name implies (ability to permeate), is a measure of how easily a fluid can flow
COMPARISON OF LABORATORY AND FIELD MEASUREMENTS OF BRIDGE PIER SCOUR
 COMPARISON OF LABORATORY AND FIELD MEASUREMENTS OF BRIDGE PIER SCOUR LEE, SEUNGOH, STURM, T. W., School of Civil and Environ. Engrg., Georgia Institute of Technology Atlanta, GA 30332-0512 USA GOTVALD,
Fluvial Processes in River Engineering
 Fluvial Processes in River Engineering Howard H. Chang San Diego State University... A WILEY-INTERSCIENCE PUBLTCATION John Wiley & Sons New York Chicbester Brisbane Toronto Singapore CONTENTS PARTI FLUVIAL
H.1 SUMMARY OF SUBSURFACE STRATIGRAPHY AND MATERIAL PROPERTIES (DATA PACKAGE)
") DRAFT ONONDAGA LAKE CAPPING AND DREDGE AREA AND DEPTH INITIAL DESIGN SUBMITTAL H.1 SUMMARY OF SUBSURFACE STRATIGRAPHY AND MATERIAL PROPERTIES (DATA PACKAGE) Parsons P:\Honeywell -SYR\444576 2008 Capping\09
DRAFT ONONDAGA LAKE CAPPING AND DREDGE AREA AND DEPTH INITIAL DESIGN SUBMITTAL H.1 SUMMARY OF SUBSURFACE STRATIGRAPHY AND MATERIAL PROPERTIES (DATA PACKAGE) Parsons P:\Honeywell -SYR\444576 2008 Capping\09
Scour assessment in complex marine soils an evaluation through case examples
 Scour assessment in complex marine soils an evaluation through case examples 1 (1)HR Wallingford, Howbery Park, Wallingford, Oxfordshire, OX10 8BA email j.harris@hrwallingford.co.uk, r.whitehouse@hrwallingford.co.uk,
Improvements to Southeast Louisiana s floodwalls and pump stations since Katrina: the Hurricane and Storm Damage Risk Reduction System (HSDRRS)
") Improvements to Southeast Louisiana s floodwalls and pump stations since Katrina: the Hurricane and Storm Damage Risk Reduction System (HSDRRS) Pat Fitzpatrick Mississippi State University Review of levee
Improvements to Southeast Louisiana s floodwalls and pump stations since Katrina: the Hurricane and Storm Damage Risk Reduction System (HSDRRS) Pat Fitzpatrick Mississippi State University Review of levee
Geotechnical Aspects of the Seismic Update to the ODOT Bridge Design Manual. Stuart Edwards, P.E Geotechnical Consultant Workshop
 Geotechnical Aspects of the Seismic Update to the ODOT Bridge Design Manual Stuart Edwards, P.E. 2017 Geotechnical Consultant Workshop Changes Role of Geotechnical Engineer Background Methodology Worked
Shear Stress Estimates for Combined Wave and Surge Overtopping at Earthen Levees
 Shear Stress Estimates for Combined Wave and Surge Overtopping at Earthen Levees by Norberto C. Nadal and Steven A. Hughes PURPOSE: The Coastal and Hydraulics Engineering Technical Note (CHETN) described
CE 240 Soil Mechanics & Foundations Lecture 5.2. Permeability III (Das, Ch. 6) Summary Soil Index Properties (Das, Ch. 2-6)
 Summary Soil Index Properties (Das, Ch. 2-6)") CE 40 Soil Mechanics & Foundations Lecture 5. Permeability III (Das, Ch. 6) Summary Soil Index Properties (Das, Ch. -6) Outline of this Lecture 1. Getting the in situ hydraulic conductivity 1.1 pumping
CE 40 Soil Mechanics & Foundations Lecture 5. Permeability III (Das, Ch. 6) Summary Soil Index Properties (Das, Ch. -6) Outline of this Lecture 1. Getting the in situ hydraulic conductivity 1.1 pumping
Hurricane KATRINA Lessons Learned for Managing Risk
 Hurricane KATRINA Lessons Learned for Managing Risk Steven L. Stockton, P.E. Deputy Director of Civil Works U.S. Army Corps of Engineers What Happened? Storm Path from August 23 to 31, 2005 Mon. August
Carmel River Bank Stabilization at Rancho San Carlos Road Project Description and Work Plan March 2018
 Carmel River Bank Stabilization at Rancho San Carlos Road Project Description and Work Plan March 2018 EXISTING CONDITION The proposed Carmel River Bank Stabilization at Rancho San Carlos Road Project
Evaluation of Geotechnical Hazards
 Evaluation of Geotechnical Hazards by Geoffrey R. Martin Appendix B: Evaluation of Geotechnical Hazards Describes Evaluation Procedures Soil Liquefaction Soil Settlement Surface Fault Rupture Flooding
Erosion Rate is a Function of Erodibility and Excess Shear Stress = k ( o - c ) From Relation between Shear Stress and Erosion We Calculate c and
 From Relation between Shear Stress and Erosion We Calculate c and") Equilibrium, Shear Stress, Stream Power and Trends of Vertical Adjustment Andrew Simon USDA-ARS, Oxford, MS asimon@msa-oxford.ars.usda.gov Non-Cohesive versus Cohesive Materials Non-cohesive: sands and
Equilibrium, Shear Stress, Stream Power and Trends of Vertical Adjustment Andrew Simon USDA-ARS, Oxford, MS asimon@msa-oxford.ars.usda.gov Non-Cohesive versus Cohesive Materials Non-cohesive: sands and
Soil Mechanics. Chapter # 1. Prepared By Mr. Ashok Kumar Lecturer in Civil Engineering Gpes Meham Rohtak INTRODUCTION TO SOIL MECHANICS AND ITS TYPES
 Soil Mechanics Chapter # 1 INTRODUCTION TO SOIL MECHANICS AND ITS TYPES Prepared By Mr. Ashok Kumar Lecturer in Civil Engineering Gpes Meham Rohtak Chapter Outlines Introduction to Soil Mechanics, Soil
LEVEE EROSION BY OVERTOPPING DURING THE KATRINA HURRICANE
 LEVEE EROSION BY OVERTOPPING DURING THE KATRINA HURRICANE Jean-Louis Briaud 1 and Hamn Ching Chen 1 Invited Lecture at the Third International Conference on Scour and Erosion Amsterdam, November 1-3, 2006
U.S. Army Corps of Engineers Detroit District. Sediment Trap Assessment Saginaw River, Michigan
 U.S. Army Corps of Engineers Detroit District December 2001 December 2001 This report has been prepared for USACE, Detroit District by: W.F. BAIRD & ASSOCIATES LTD. 2981 YARMOUTH GREENWAY MADISON, WISCONSIN
Theory of Shear Strength
 SKAA 1713 SOIL MECHANICS Theory of Shear Strength Prepared by, Dr. Hetty 1 SOIL STRENGTH DEFINITION Shear strength of a soil is the maximum internal resistance to applied shearing forces The maximum or
Vegetation effects on river hydraulics. Johannes J. (Joe) DeVries David Ford Consulting Engineers, Inc. Sacramento, CA
 DeVries David Ford Consulting Engineers, Inc. Sacramento, CA") Vegetation effects on river hydraulics Johannes J. (Joe) DeVries David Ford Consulting Engineers, Inc. Sacramento, CA jjdevries@ford-consulting.com SAC05 D2P31 RM 99.0L VIEW UPSTREAM AT UPSTREAM END DWR
Vegetation effects on river hydraulics Johannes J. (Joe) DeVries David Ford Consulting Engineers, Inc. Sacramento, CA jjdevries@ford-consulting.com SAC05 D2P31 RM 99.0L VIEW UPSTREAM AT UPSTREAM END DWR
CHAPTER NINE: EROSION TESTS ON NEW ORLEANS LEVEE SAMPLES
 CHAPTER NINE: EROSION TESTS ON NEW ORLEANS LEVEE SAMPLES 9.1 Erodibilty: A Definition is a term often used in scour and erosion studies. may be thought of as one number which characterizes the rate at
Geotechnical Aspects of the Ohio River Bridges Project
 Geotechnical Aspects of the Ohio River Bridges Project Mark A. Litkenhus, PE Sr. Geotechnical Engineer Stephen H. Bickel, PE Sr. Geotechnical Engineer STGEC Ohio River Bridges at Louisville Geotechnical
PREDICTING UNDERSEEPAGE OF MASONRY DAMS Published in Proceedings of 29 th ASDSO Conference, Hollywood, FL, Sept Oct. 1, 2009.
 PREDICTING UNDERSEEPAGE OF MASONRY DAMS Published in Proceedings of 29 th ASDSO Conference, Hollywood, FL, Sept. 27 - Oct. 1, 29. Joshua M. Hendrix, EIT, US Army Corps of Engineers, Rock Island, IL Timothy
Rock Scour: Past, Present and Future. George W. Annandale, D.Ing, P.E. Engineering and Hydrosystems Inc. Denver, Colorado
 Rock Scour: Past, Present and Future George W. Annandale, D.Ing, P.E. Engineering and Hydrosystems Inc. Denver, Colorado Outline Rock Scour Process Jet Hydraulics Scour Resistance of Rock Methods of Analysis
8.1. What is meant by the shear strength of soils? Solution 8.1 Shear strength of a soil is its internal resistance to shearing stresses.
 8.1. What is meant by the shear strength of soils? Solution 8.1 Shear strength of a soil is its internal resistance to shearing stresses. 8.2. Some soils show a peak shear strength. Why and what type(s)
SIMPLIFIED METHOD FOR ESTIMATING FUTURE SCOUR DEPTH AT EXISTING BRIDGES
 SIMPLIFIED METHOD FOR ESTIMATING FUTURE SCOUR DEPTH AT EXISTING BRIDGES A Dissertation by ANAND V GOVINDASAMY Submitted to the Office of Graduate Studies of Texas A&M University in partial fulfillment
Uniform Channel Flow Basic Concepts. Definition of Uniform Flow
 Uniform Channel Flow Basic Concepts Hydromechanics VVR090 Uniform occurs when: Definition of Uniform Flow 1. The depth, flow area, and velocity at every cross section is constant 2. The energy grade line,
Geotechnical Properties of Soil
 Geotechnical Properties of Soil 1 Soil Texture Particle size, shape and size distribution Coarse-textured (Gravel, Sand) Fine-textured (Silt, Clay) Visibility by the naked eye (0.05 mm is the approximate
CHAPTER FIVE: THE LOWER MISSISSIPPI REGION AND PLAQUEMINES PARISH
 CHAPTER FIVE: THE LOWER MISSISSIPPI REGION AND PLAQUEMINES PARISH 5.1 Overview Plaquemines Parish is the area where the last portion of the Mississippi River flows out into the Gulf of Mexico (see Figures
Prof. B V S Viswanadham, Department of Civil Engineering, IIT Bombay
 19 Module 5: Lecture -1 on Stability of Slopes Contents Stability analysis of a slope and finding critical slip surface; Sudden Draw down condition, effective stress and total stress analysis; Seismic
Analysis of Cost-Effective Rehabilitation: Principles and Tools for Reducing Uncertainty in Design
 Analysis of Cost-Effective Rehabilitation: Principles and Tools for Reducing Uncertainty in Design Natasha Bankhead and Andrew Simon Cardno ENTRIX, Oxford, MS natasha.bankhead@cardno.com Often the Questions
NEW DOWN-HOLE PENETROMETER (DHP-CIGMAT) FOR CONSTRUCTION APPLICATIONS
 FOR CONSTRUCTION APPLICATIONS") NEW DOWN-HOLE PENETROMETER (DHP-CIGMAT) FOR CONSTRUCTION APPLICATIONS 1 2 C. Vipulanandan 1, Ph.D., M. ASCE and Omer F. Usluogullari 2 Chairman, Professor, Director of Center for Innovative Grouting Materials
NEW DOWN-HOLE PENETROMETER (DHP-CIGMAT) FOR CONSTRUCTION APPLICATIONS 1 2 C. Vipulanandan 1, Ph.D., M. ASCE and Omer F. Usluogullari 2 Chairman, Professor, Director of Center for Innovative Grouting Materials
Instructor : Dr. Jehad Hamad. Chapter (7)
") Instructor : Dr. Jehad Hamad Chapter (7) 2017-2016 Soil Properties Physical Properties Mechanical Properties Gradation and Structure Compressibility Soil-Water Relationships Shear Strength Bearing Capacity
Instructor : Dr. Jehad Hamad Chapter (7) 2017-2016 Soil Properties Physical Properties Mechanical Properties Gradation and Structure Compressibility Soil-Water Relationships Shear Strength Bearing Capacity
Technical Memorandum No Sediment Model
 Pajaro River Watershed Study in association with Technical Memorandum No. 1.2.9 Sediment Model Task: Development of Sediment Model To: PRWFPA Staff Working Group Prepared by: Gregory Morris and Elsie Parrilla
Lesson 25. Static Pile Load Testing, O-cell, and Statnamic. Reference Manual Chapter 18
 Lesson 25 Static Pile Load Testing, O-cell, and Statnamic Reference Manual Chapter 18 STATIC LOAD TESTING Most accurate method to determine static pile capacity Perform at design or construction stage
 Project: ITHACA-TOMPKINS REGIONAL AIRPORT EXPANSION Project Location: ITHACA, NY Project Number: 218-34 Key to Soil Symbols and Terms TERMS DESCRIBING CONSISTENCY OR CONDITION COARSE-GRAINED SOILS (major
MODELING OF LOCAL SCOUR AROUND AL-KUFA BRIDGE PIERS Saleh I. Khassaf, Saja Sadeq Shakir
 ISSN 2320-9100 11 International Journal of Advance Research, IJOAR.org Volume 1, Issue 8,August 2013, Online: ISSN 2320-9100 MODELING OF LOCAL SCOUR AROUND AL-KUFA BRIDGE PIERS Saleh I. Khassaf, Saja Sadeq
GEOSYNTHETICS ENGINEERING: IN THEORY AND PRACTICE
 GEOSYNTHETICS ENGINEERING: IN THEORY AND PRACTICE Prof. J. N. Mandal Department of civil engineering, IIT Bombay, Powai, Mumbai 400076, India. Tel.022-25767328 email: cejnm@civil.iitb.ac.in Module - 4
APPENDIX F CORRELATION EQUATIONS. F 1 In-Situ Tests
 APPENDIX F 1 APPENDIX F CORRELATION EQUATIONS F 1 In-Situ Tests 1. SPT (1) Sand (Hatanaka and Uchida, 1996), = effective vertical stress = effective friction angle = atmosphere pressure (Shmertmann, 1975)
CPT Applications - Liquefaction 2
 CPT Applications - Liquefaction 2 Peter K. Robertson CPT in Geotechnical Practice Santiago, Chile July, 2014 Definitions of Liquefaction Cyclic (seismic) Liquefaction Zero effective stress (during cyclic
*** ***! " " ) * % )!( & ' % # $. 0 1 %./ +, - 7 : %8% 9 ) 7 / ( * 7 : %8% 9 < ;14. " > /' ;-,=. / ١
 * % )!( & ' % # $. 0 1 %./ +, - 7 : %8% 9 ) 7 / ( * 7 : %8% 9 < ;14. > /' ;-,=. / ١") ١ ******!" #$ % & '!( ) % * ") +,-./ % 01. 3 ( 4 56 7/4 ) 8%9 % : 7 ;14 < 8%9 % : *7./ = ;-, >/'." Soil Permeability & Seepage ٢ Soil Permeability- Definition ٣ What is Permeability? Permeability is the
١ ******!" #$ % & '!( ) % * ") +,-./ % 01. 3 ( 4 56 7/4 ) 8%9 % : 7 ;14 < 8%9 % : *7./ = ;-, >/'." Soil Permeability & Seepage ٢ Soil Permeability- Definition ٣ What is Permeability? Permeability is the
HEC-RAS Reservoir Transport Simulation of Three Reservoirs in the Lower Susquehanna River Basin. Mike Langland and Ed Koerkle
 HEC-RAS Reservoir Transport Simulation of Three Reservoirs in the Lower Susquehanna River Basin Mike Langland and Ed Koerkle Topics Background / Project Objectives Data Selection - Sediment and Geometric
LAR BPWG. DWR Erosion Screening Process Application to LAR. May 17, water resource specialists
 LAR BPWG DWR Erosion Screening Process Application to LAR May 17, 2016 Presentation Outline Review of Erosion Screening Process Modifications for LAR Application ESP LAR Results Recommendations ESP Background
PROBABILISTIC DESIGN METHOD OF LEVEE AND FLOODWALL HEIGHTS FOR THE HURRICANE PROTECTION SYSTEM IN THE NEW ORLEANS AREA
 PROBABILISTIC DESIGN METHOD OF LEVEE AND FLOODWALL HEIGHTS FOR THE HURRICANE PROTECTION SYSTEM IN THE NEW ORLEANS AREA Mathijs van Ledden Haskoning Inc., 1 Galleria Blvd., Metairie, LA70001, United States,
Limitation to qualitative stability indicators. the real world is a continuum, not a dichotomy ~ 100 % 30 % ~ 100 % ~ 40 %
 Stream Stability Assessment & BEHI Surveys Joe Rathbun MDEQ Water Resources Division rathbunj@michigan.gov 517--373 517 373--8868 Stability Stream can transport its water and sediment inputs without changing
Seepage Analysis for Shurijeh Reservoir Dam Using Finite Element Method. S. Soleymani 1, A. Akhtarpur 2
 Seepage Analysis for Shurijeh Reservoir Dam Using Finite Element Method S. Soleymani 1, A. Akhtarpur 2 1 Group of Dam Construction, Toossab Company, P.O. Box 917751569, Mashhad City, Iran, PH (+98) 511-7684091;
June 9, R. D. Cook, P.Eng. Soils Engineer Special Services Western Region PUBLIC WORKS CANADA WESTERN REGION REPORT ON
 PUBLIC WORKS CANADA WESTERN REGION REPORT ON GEOTECHNICAL INVESTIGATION PROPOSED MARTIN RIVER BRIDGE MILE 306.7 MACKENZIE HIGHWAY Submitted by : R. D. Cook, P.Eng. Soils Engineer Special Services Western
Technical Supplement 14Q. Abutment Design for Small Bridges. (210 VI NEH, August 2007)
") Technical Supplement 14Q (10 VI NEH, August 007) Issued August 007 Cover photo: Design of abutments for small bridges reuires geotechnical analysis. Advisory Note Techniues and approaches contained in
Technical Supplement 14Q (10 VI NEH, August 007) Issued August 007 Cover photo: Design of abutments for small bridges reuires geotechnical analysis. Advisory Note Techniues and approaches contained in
R.M.HARW & ASSOCIATES LTD. GEOTECHNICAL INVESTIGATION PROPOSED BRIDGE SITE. HELAVA CREEKl MILE MACKENZIE HIGHWAY E-2510 OCTOBER 16, 1973
 El R.M.HARW & ASSOCIATES LTD. GEOTECHNICAL INVESTIGATION PROPOSED BRIDGE SITE HELAVA CREEKl MILE 616.4 MACKENZIE HIGHWAY E-2510 OCTOBER 16, 1973 R,M,HARDV & ASSOCIATES LTD. CONSULTING ENGINEERING & TESTING
Geosynthetics Applications and Performance Reviews Select Case Histories
 Geosynthetics Applications and Performance Reviews Select Case Histories Debora J. Miller, Ph.D., P.E.; Dean B. Durkee,, Ph.D., P.E.; Michael A. Morrison, P.E., David B. Wilson, P.E., and Kevin Smith,
IN SITU SPECIFIC GRAVITY VS GRAIN SIZE: A BETTER METHOD TO ESTIMATE NEW WORK DREDGING PRODUCTION
 IN SITU SPECIFIC GRAVITY VS GRAIN SIZE: A BETTER METHOD TO ESTIMATE NEW WORK DREDGING PRODUCTION Nancy Case O Bourke, PE 1, Gregory L. Hartman, PE 2 and Paul Fuglevand, PE 3 ABSTRACT In-situ specific gravity
Field Observations and One-Dimensional Flow Modeling of Summit Creek in Mack Park, Smithfield, Utah
 Intermountain Center for River Rehabilitation and Restoration, Utah State University 31 July 2018 Field Observations and One-Dimensional Flow Modeling of Summit Creek in Mack Park, Smithfield, Utah I.
SHEAR STRENGTH OF SOIL
 Soil Failure Criteria SHEAR STRENGTH OF SOIL Knowledge about the shear strength of soil important for the analysis of: Bearing capacity of foundations, Slope stability, Lateral pressure on retaining structures,
Diego Burgos. Geology 394. Advisors: Dr. Prestegaard. Phillip Goodling
 Sediment Transport into an Urban Tributary Junction Diego Burgos Geology 394 Advisors: Dr. Prestegaard Phillip Goodling 1 Abstract Tributary junctions are an important component of stream morphology and
CPT Guide 5 th Edition. CPT Applications - Deep Foundations. Gregg Drilling & Testing, Inc. Dr. Peter K. Robertson Webinar # /2/2013
 Gregg Drilling & Testing, Inc. Site Investigation Experts CPT Applications - Deep Foundations Dr. Peter K. Robertson Webinar #6 2013 CPT Guide 5 th Edition Robertson & Cabal (Robertson) 5 th Edition 2012
A MODEL FOR THE EROSION RATE CURVE OF COHESIVE SOILS
 0 0 A MODEL FOR THE EROSION RATE CURVE OF COHESIVE SOILS Reza Rahimnejad and Phillip S.K. Ooi * Geotechnical Engineer, Ph.D. Geolabs, Inc. 00 Kalihi Street Honolulu, HI Professor, Department of Civil and
Hydraulics of bendway weirs
 River Basin Management IV 389 Hydraulics of bendway weirs C. Thornton 1, S. Abt 1, D. Baird 2 & R. Padilla 3 1 Colorado State University, Fort Collins, CO, USA 2 U.S. Bureau of Reclamation, Denver, CO,
To: Olivia Dorothy March 9, 2018 Associate Director Upper Mississippi River Basin American Rivers
 To: Olivia Dorothy March 9, 2018 Associate Director Upper Mississippi River Basin American Rivers From: Jonathan W.F. Remo Ph.D. Big Muddy Consulting Re: Assessment of flood surcharge related to differences
Three-Dimensional Seepage Effects at Three New Orleans Levee Breaches During Hurricane Katrina
 Three-Dimensional Seepage Effects at Three New Orleans Levee Breaches During Hurricane Katrina Diego Cobos-Roa Graduate Student Department of Civil & Environmental Engineering University of California
THE HYDRAULIC PERFORMANCE OF ORIENTED SPUR DIKE IMPLEMENTATION IN OPEN CHANNEL
 Tenth International Water Technology Conference, IWTC10 2006, Alexandria, Egypt 281 THE HYDRAULIC PERFORMANCE OF ORIENTED SPUR DIKE IMPLEMENTATION IN OPEN CHANNEL Karima Attia 1 and Gamal El Saied 2 1
Additional Pile Design Considerations
 Additional Pile Design Considerations PDCA 2015 Professor Driven Pile Institute Patrick Hannigan GRL Engineers, Inc. What Are Additional Pile Design Considerations? Time Dependent Soil Strength Changes
Chapter 1 - Soil Mechanics Review Part A
 Chapter 1 - Soil Mechanics Review Part A 1.1 Introduction Geotechnical Engineer is concerned with predicting / controlling Failure/Stability Deformations Influence of water (Seepage etc.) Soil behavour
Theory of Shear Strength
 MAJ 1013 ADVANCED SOIL MECHANICS Theory of Shear Strength Prepared by, Dr. Hetty 1 Strength of different materials Steel Concrete Soil Tensile strength Compressive strength Shear strength Complex behavior
Upper Mississippi River Basin Environmental Management Program Workshop
 Presentation to the Upper Mississippi River Basin Environmental Management Program Workshop by Michael Rodgers River Engineer US Army Corps of Engineers, St. Louis District August 17, 2007 Engineering
Evaluation of soil liquefaction using the CPT Part 2
 Evaluation of soil liquefaction using the CPT Part 2 P.K. Robertson 2013 Definitions of Liquefaction Cyclic (seismic) Liquefaction Zero effective stress (during cyclic loading) Flow (static) Liquefaction
APPENDIX A. Borehole Logs Explanation of Terms and Symbols
 APPENDIX A Borehole Logs Explanation of Terms and Symbols Page 153 of 168 EXPLANATION OF TERMS AND SYMBOLS The terms and symbols used on the borehole logs to summarize the results of field investigation
Introduction to Soil Mechanics Geotechnical Engineering-II
 Introduction to Soil Mechanics Geotechnical Engineering-II ground SIVA Dr. Attaullah Shah 1 Soil Formation Soil derives from Latin word Solum having same meanings as our modern world. From Geologist point
Fish Passage at Road Crossings
 Fish Passage at Road Crossings 1 Crossing Design Workshop Outline 1:00 to 2:00 Intro, Design Overview, Channel Width 2:00 to 2:15 Break 2:15 to 3:15 No-Slope, Stream Simulation Design 3:15 to 3:30 Break
B-1 BORE LOCATION PLAN. EXHIBIT Drawn By: 115G BROOKS VETERINARY CLINIC CITY BASE LANDING AND GOLIAD ROAD SAN ANTONIO, TEXAS.
 N B-1 SYMBOLS: Exploratory Boring Location Project Mngr: BORE LOCATION PLAN Project No. GK EXHIBIT Drawn By: 115G1063.02 GK Scale: Checked By: 1045 Central Parkway North, Suite 103 San Antonio, Texas 78232
Scour Potential of Cohesive Soils. Melvin Elmo Walker III
 Scour Potential of Cohesive Soils by Melvin Elmo Walker III A thesis submitted to the Graduate Faculty of Auburn University in partial fulfillment of the requirements for the Degree of Master of Science
Clay Robinson, PhD, CPSS, PG copyright 2009
 Engineering: What's soil got to do with it? Clay Robinson, PhD, CPSS, PG crobinson@wtamu.edu, http://www.wtamu.edu/~crobinson, copyright 2009 Merriam-Webster Online Dictionary soil, noun 1 : firm land
Sediment and Erosion Design Guide
 Sediment and Erosion Design Guide Sediment Transport & Bulking Factors Goals of this Session Review key principals Review basic relationships and available tools Review bulking factor relationships Purposes
The CPT in unsaturated soils
 The CPT in unsaturated soils Associate Professor Adrian Russell (UNSW) Mr David Reid (Golder Associates) Prof Nasser Khalili (UNSW) Dr Mohammad Pournaghiazar (UNSW) Dr Hongwei Yang (Uni of Hong Kong) Outline
Cyclic Triaxial Behavior of an Unsaturated Silty Soil Subjected to Suction Changes
 6 th International Conference on Earthquake Geotechnical Engineering 1-4 November 215 Christchurch, New Zealand Cyclic Triaxial Behavior of an Unsaturated Silty Soil Subjected to Suction Changes T. Nishimura
Fil Failure Analysis of fthe Breached Levee System at the 17th Street Canal, New Orleans
 Fil Failure Analysis of fthe Breached hd Levee System at the 17th Street Canal, New Orleans Jay Wang, Ph.D., P.E. Department of Civil Engineering and Construction Engineering Technology Louisiana Tech
GEOTECHNICAL SITE CHARACTERIZATION
 GEOTECHNICAL SITE CHARACTERIZATION Neil Anderson, Ph.D. Professor of Geology and Geophysics Richard W. Stephenson, P.E., Ph.D. Professor of Civil, Architectural and Environmental Engineering University
Report on the Damage Survey Caused by Hurricane Katrina (Tentative Report)
") Report on the Damage Survey Caused by Hurricane Katrina (Tentative Report) November 1, 2005 Coastal Disaster Prevention Technology Survey Team 1. Introduction Hurricane Katrina struck the United States
Report on the Damage Survey Caused by Hurricane Katrina (Tentative Report) November 1, 2005 Coastal Disaster Prevention Technology Survey Team 1. Introduction Hurricane Katrina struck the United States
Deep Foundations 2. Load Capacity of a Single Pile
 Deep Foundations 2 Load Capacity of a Single Pile All calculations of pile capacity are approximate because it is almost impossible to account for the variability of soil types and the differences in the
Island Design. UMRS EMP Regional Workshop. Presentation for the
 Island Design Presentation for the UMRS EMP Regional Workshop by Jon Hendrickson Hydraulic Engineer Regional Technical Specialist, Water Quality and Habitat Restoration August 17 19, 2005 Project Delivery
Solution:Example 1. Example 2. Solution: Example 2. clay. Textural Soil Classification System (USDA) CE353 Soil Mechanics Dr.
 CE353 Soil Mechanics Dr.") CE353 Soil Mechanics CE353 Lecture 5 Geotechnical Engineering Laboratory SOIL CLASSIFICATION Lecture 5 SOIL CLASSIFICATION Dr. Talat A Bader Dr. Talat Bader 2 Requirements of a soil Systems Why do we need
CE353 Soil Mechanics CE353 Lecture 5 Geotechnical Engineering Laboratory SOIL CLASSIFICATION Lecture 5 SOIL CLASSIFICATION Dr. Talat A Bader Dr. Talat Bader 2 Requirements of a soil Systems Why do we need
FRED BURR DAM FEASIBILITY STUDY
 FRED BURR DAM FEASIBILITY STUDY Fred Burr Dam Feasibility Study Purpose: Develop pre-feasibility risk reduction alternatives and recommendations for short-term operations and long-term rehabilitation.
Two-Dimensional Simulation of Truckee River Hydrodynamics
 Two-Dimensional Simulation of Truckee River Hydrodynamics by Stephen H. Scott PURPOSE: The purpose of this Coastal and Hydraulics Engineering Technical Note (CHETN) is to demonstrate the use of multidimensional