WP 5 Action 5.3 Final report Thermal and geomorphic permafrost response to present and future climate change in the European Alps
|
|
|
- Gavin Morgan
- 5 years ago
- Views:
Transcription


1 WP5 Action5.3 Finalreport Thermalandgeomorphicpermafrost responsetopresentandfutureclimate changeintheeuropeanalps Editors: AndreasKellererPirklbauer,GerhardKarlLieb, PhilippeSchoeneich,PhilipDelineandPaoloPogliotti Graz,2011
2 WP5 Action5.3 Finalreport Thermalandgeomorphicpermafrost responsetopresentandfutureclimate changeintheeuropeanalps Citationreference KellererPirklbauer A., Lieb G.K., Schoeneich P., Deline P., Pogliotti P. eds (2011). Thermal and geomorphic permafrost response to present and future climate change in the European Alps. PermaNETproject,finalreportofAction5.3.OnlinepublicationISBN ,177pp. Downladableon: Editors AndreasKellererPirklbauerandGerhardKarlLieb,InstituteofGeographyandRegionalScience, UniversityofGraz,Austria(IGRS) PhilippeSchoeneich,InstitutdeGéographieAlpine,UniversitédeGrenoble,France(IGAPACTE) PhilipDeline,EDYTEM,UniversitédeSavoie,France(EDYTEM) PaoloPogliotti,RegionalAgencyfortheEnvironmentalProtectionoftheAostaValley,Italy(ARPA VdA) Projectreference The PermaNET Permafrost long term monitoring network ( ) project is part of the EuropeanTerritorialCooperationandcofundedbytheEuropeanRegionalDevelopmentFund(ERDF) inthescopeofthealpinespaceprogrammewww.alpinespace.eu
3 PermaNET Permafrostresponsetoclimatechange Authors Baroni,Carlo UniversityofPisa(Italy) Bodin,Xavier UniversityJosephFourier,Grenoble(France) Cagnati,Anselmo RegionalAgencyfortheEnvironmentalProtectionofVeneto(Italy) Carollo,Federico E.P.C.EuropeanProjectConsultingS.r.l.(Italy) Coviello,Velio NationalCenterforScientificResearchEDYTEM,Grenoble(France) Cremonese,Edoardo RegionalAgencyfortheEnvironmentalProtectionoftheAostaValley(Italy) Crepaz,Andrea RegionalAgencyfortheEnvironmentalProtectionofVeneto(Italy) Dall Amico,Matteo Mountaineeringsrl(Italy) Defendi,Valentina RegioneVeneto,DirezioneGeologiaeGeorisorse,ServizioGeologico(Italy) Deline,Philip NationalCenterforScientificResearchEDYTEM,Grenoble(France) Drenkelfluss,Anja UniversityofBonn(Germany) Galuppo,Anna RegioneVeneto,DirezioneGeologiaeGeorisorse,ServizioGeologico(Italy) Gruber,Stephan UniversityofZurich(Switzerland) KellererPirklbauer, Andreas UniversityofGraz(Austria) Kemna,Andreas UniversityofBonn(Germany) Klee,Alexander CentralInstituteforMeteorologyandGeodynamics(Austria) Krainer,Karl UniversityofInnsbruck(Austria) Krautblatter,Michael UniversityofBonn(Germany) Kroisleinter,Christine CentralInstituteforMeteorologyandGeodynamics(Austria) Krysiecki,JeanMichel UniversityJosephFourier,Grenoble(France) LeRoux,Olivier Associationpourledéveloppementdelarecherchesurlesglissementsdeterrain (France) Lieb,GerhardKarl UniversityofGraz(Austria) Lorier,Lionel Associationpourledéveloppementdelarecherchesurlesglissementsdeterrain (France) Magnabosco,Laura RegioneVeneto,DirezioneGeologiaeGeorisorse,ServizioGeologico(Italy) Magnin,Florence NationalCenterforScientificResearchEDYTEM,Grenoble(France) Mair,Volkmar AutomousProvinceofBolzano(Italy) Malet,Emmanuel NationalCenterforScientificResearchEDYTEM,Grenoble(France) Marinoni,Francesco Freelancer(Italy) MorradiCella,Umberto RegionalAgencyfortheEnvironmentalProtectionoftheAostaValley(Italy) Noetzli,Jeanette UniversityofZurich(Switzerland) Pogliotti,Paolo RegionalAgencyfortheEnvironmentalProtectionoftheAostaValley(Italy) Ravanel,Ludovic NationalCenterforScientificResearchEDYTEM,Grenoble(France) Reisenhofer,Stefan CentralInstituteforMeteorologyandGeodynamics(Austria) Riedl,Claudia CentralInstituteforMeteorologyandGeodynamics(Austria) Rigon,Riccardo UniversityofTrento(Italy) Schoeneich,Philippe UniversityJosephFourier,Grenoble(France) Schöner,Wolfgang CentralInstituteforMeteorologyandGeodynamics(Austria) Seppi,Roberto UniversityofPavia(Italy) Vallon,Michel UniversityJosephFourier,Grenoble(France) Zampedri,Giorgio GeologicalSurvey,AutonomousProvinceofTrento(Italy) Zischg,Andreas AbenisAlpinexpertGmbH/srl(Italy) Zumiani,Matteo Geologist(Italy) ADRAAssociationpourladiffusiondelarecherchealpine 14bisav.MarieReynoard, F38100Grenoble ISBN
4 Contentsandlistforchapterpublications 1.PermafrostResponsetoClimateChange SchoeneichP.,LiebG.K.,KellererPirklbauerA.,DelineP.,PogliottiP.(2011).Chapter1:Permafrost Response to Climate Change. In KellererPirklbauer A. et al. (eds): Thermal and geomorphic permafrostresponsetopresentandfutureclimatechangeintheeuropeanalps.permanetproject, finalreportofaction5.3.onlinepublicationisbn ,p ClimateChangeintheEuropeanAlps KroisleitnerCh.,ReisenhoferS.,SchönerW.(2011).Chapter2:ClimateChangeintheEuropeanAlps. InKellererPirklbauerA.etal.(eds):Thermalandgeomorphicpermafrostresponsetopresentand futureclimatechangeintheeuropeanalps.permanetproject,finalreportofaction5.3.online publicationisbn ,p CasestudiesintheEuropeanAlps 3.1Overviewoncasestudies KellererPirklbauerA,LiebG.K.(2011).Chapter3.1:CasestudiesintheEuropeanAlps Overviewon casestudies.inkellererpirklbauera.etal.(eds):thermalandgeomorphicpermafrostresponseto presentandfutureclimatechangeintheeuropeanalps.permanetproject,finalreportofaction5.3. OnlinepublicationISBN ,p Hochreichart,EasternAustrianAlps KellererPirklbauerA(2011).Chapter3.2:CasestudiesintheEuropeanAlps Hochreichart,Eastern AustrianAlps.InKellererPirklbauerA.etal.(eds):Thermalandgeomorphicpermafrostresponseto presentandfutureclimatechangeintheeuropeanalps.permanetproject,finalreportofaction5.3. OnlinepublicationISBN ,p DösenValley,CentralAustrianAlps KellererPirklbauerA(2011).Chapter3.3:CasestudiesintheEuropeanAlps DösenValley,Central AustrianAlps.InKellererPirklbauerA.etal.(eds):Thermalandgeomorphicpermafrostresponseto presentandfutureclimatechangeintheeuropeanalps.permanetproject,finalreportofaction5.3. OnlinepublicationISBN ,p HoherSonnblick,CentralAustrianAlps KleeA,RiedlC.(2011).Chapter3.4:CasestudiesintheEuropeanAlps HoherSonnblick,Central AustrianAlps.InKellererPirklbauerA.etal.(eds):Thermalandgeomorphicpermafrostresponseto presentandfutureclimatechangeintheeuropeanalps.permanetproject,finalreportofaction5.3. OnlinepublicationISBN ,p
5 PermaNET Permafrostresponsetoclimatechange 3.5RockGlacierHochebenkar,WesternAustrianAlps KrainerK.(2011).Chapter3.5:CasestudiesintheEuropeanAlps RockGlacierHochebenkar, WesternAustrianAlps.InKellererPirklbauerA.etal.(eds):Thermalandgeomorphicpermafrost responsetopresentandfutureclimatechangeintheeuropeanalps.permanetproject,finalreport ofaction5.3.onlinepublicationisbn ,p RockGlacierLaurichard,NorthernFrenchAlps SchoeneichP.,BodinX.,KrysieckiJ.M.(2011).Chapter3.6:CasestudiesintheEuropeanAlps Rock Glacier Laurichard, Northern French Alps. In KellererPirklbauer A. et al. (eds): Thermal and geomorphic permafrost response to present and future climate change in the European Alps. PermaNETproject,finalreportofAction5.3.OnlinepublicationISBN ,p RockGlacierBellecombes,NorthernFrenchAlps SchoeneichP.,KrysieckiJ.M.,LeRouxO.,LorierL.,VallonM.(2011).Chapter3.7:Casestudiesinthe EuropeanAlps RockGlacierBellecombes,NorthernFrenchAlps.InKellererPirklbauerA.etal. (eds):thermalandgeomorphicpermafrostresponsetopresentandfutureclimatechangeinthe EuropeanAlps.PermaNETproject,finalreportofAction5.3.OnlinepublicationISBN ,p AiguilleduMidi,MontBlancmassif,FrenchAlps DelineP.,CremoneseE.,DrenkelflussA.,GruberS.,KemnaA.,KrautblatterM.,MagninF.,MaletE., MorradiCellaU.,NoetzliJ.,PogliottiP.,RavanelL.(2011).Chapter3.8:CasestudiesintheEuropean Alps AiguilleduMidi,MontBlancmassif,FrenchAlps.InKellererPirklbauerA.etal.(eds):Thermal andgeomorphicpermafrostresponsetopresentandfutureclimatechangeintheeuropeanalps. PermaNETproject,finalreportofAction5.3.OnlinepublicationISBN ,p RockfallsintheMontBlancmassif, DelineP.,RavanelL.(2011).Chapter3.9:CasestudiesintheEuropeanAlps RockfallsintheMont Blancmassif,FrenchItalianAlps.InKellererPirklbauerA.etal.(eds):Thermalandgeomorphic permafrostresponsetopresentandfutureclimatechangeintheeuropeanalps.permanetproject, finalreportofaction5.3.onlinepublicationisbn ,p CimeBianchePass,ItalianAlps PogliottiP,CremoneseE.,MorradiCellaU.(2011).Chapter3.10:CasestudiesintheEuropeanAlps Cime Bianche Pass, Italian Alps. In KellererPirklbauer A. et al. (eds): Thermal and geomorphic permafrostresponsetopresentandfutureclimatechangeintheeuropeanalps.permanetproject, finalreportofaction5.3.onlinepublicationisbn ,p Maroccarorockglacier,ValdiGenova,ItalianAlps SeppiR.,BaroniC.CartonA.,Dall AmicoM.,RigonR.,ZampedriG.,ZumianiM.(2011).Chapter3.11: CasestudiesintheEuropeanAlps Maroccarorockglacier,ValdiGenova,ItalianAlps.InKellerer PirklbauerA.etal.(eds):Thermalandgeomorphicpermafrostresponsetopresentandfutureclimate changeintheeuropeanalps.permanetproject,finalreportofaction5.3.onlinepublicationisbn ,p
6 3.12Amolarockglacier,Vald Amola,ItalianAlps SeppiR.,BaroniC.CartonA.,Dall AmicoM.,RigonR.,ZampedriG.,ZumianiM.(2011).Chapter3.12: Case studies in the European Alps Amola rock glacier, Val d Amola, Italian Alps. In Kellerer PirklbauerA.etal.(eds):Thermalandgeomorphicpermafrostresponsetopresentandfutureclimate changeintheeuropeanalps.permanetproject,finalreportofaction5.3.isbn , p PizBoèrockglacier,Dolomites,EasternItalianAlps A.CrepazA.,CagnatiA.,GaluppoA.,CarolloF.,MarinoniF.,MagnaboscoL.,DefendiV.(2011). Chapter3.13:CasestudiesintheEuropeanAlps PizBoèrockglacier,Dolomites,EasternItalian Alps.InKellererPirklbauerA.etal.(eds):Thermalandgeomorphicpermafrostresponsetopresent andfutureclimatechangeintheeuropeanalps.permanetproject,finalreportofaction5.3.online publicationisbn ,p UpperSuldenValley,OrtlerMountains,ItalianAlps ZischgA.,MairV.(2011).Chapter3.14:CasestudiesintheEuropeanAlps UpperSuldenValley, Ortler Mountains, Italian Alps. In KellererPirklbauer A. et al. (eds): Thermal and geomorphic permafrostresponsetopresentandfutureclimatechangeintheeuropeanalps.permanetproject, finalreportofaction5.3.onlinepublicationisbn ,p SynthesisofCaseStudies LiebG.K.,KellererPirklbauerA.(2011).Chapter4:Synthesisofcasestudies.InKellererPirklbauerA. etal.(eds):thermalandgeomorphicpermafrostresponsetopresentandfutureclimatechangein theeuropeanalps.permanetproject,finalreportofaction5.3.onlinepublicationisbn ,p
7 PermaNET Permafrostresponsetoclimatechange 1. PermafrostResponsetoClimateChange Citationreference SchoeneichP.,LiebG.K.,KellererPirklbauerA.,DelineP.,PogliottiP.(2011).Chapter1:Permafrost Response to Climate Change. In KellererPirklbauer A. et al. (eds): Thermal and geomorphic permafrostresponsetopresentandfutureclimatechangeintheeuropeanalps.permanetproject, finalreportofaction5.3.onlinepublicationisbn ,p.415. Authors Coordination:PhilippeSchoeneich Involvedprojectpartnersandcontributors: Institut de Géographie Alpine, Université de Grenoble, France (IGAPACTE) Philippe Schoeneich InstituteofGeographyandRegionalScience,UniversityofGraz,Austria(IGRS) Andreas KellererPirklbauer,GerhardKarlLieb EDYTEM,UniversitédeSavoie,France(EDYTEM) PhilipDeline RegionalAgencyfortheEnvironmentalProtectionoftheAostaValley,Italy(ARPAVdA) PaoloPogliotti Content Summary 1. Introduction 2. Thermalpermafrostresponse 3. Geomorphicpermafrostresponse 4. Finalremarks References 4
8 PermaNETPermafrostResponsetoClimateChange Summary Permafrostisdefinedassubsurfacematerialthatremainsbelow0 Calsoduringthesummer. Thuspermafrostisathermalphenomenonwhosecharacteristicslargelydependontheclimatic conditions. This means that a changing climate also affects the thermal regime of the underground. The interactions between the atmosphere and the surface as well as the subsurfacetemperaturesyetarehighlycomplexdependingonseveralenvironmentalfactorslike e.g.thesubstrateitself(coarsegrainedblockymaterial,finegrainedmaterial,bedrock),the characteroftherelief(e.g.depressionvs.ridge),theexposurerelativetothesunorthesnow covercharacteristics(onsetanddisappearancedate,lengthofsnowcoverperiod,thickness, dynamics). Inthischaptertheoccurrencetypesoffrostandtheiraltitudinaldistributionisdescribedfirst. Thenpermafrostreactionstoclimatechangearediscussedundertwoaspects thethermaland thegeomorphiconeaccordingtothealreadyexistingknowledge. Mainthermalreactionsare:(a)increasinggroundtemperatureandhencepermafrostwarming, (b)thawingofpermafrostleadingtoreductioninitsspatialextent,activelayerthickeningand changing groundwater circulation, (c) changes in the number of freezethaw cycles and magnitudeoffreezingandthawingperiods. Maingeomorphicreactionsare:(a)changesintherateofrockglacierdisplacement,(b)changes in the displacement mode of rock glaciers, (c) changes in solifluction rates, (d) changes in cryogenicweathering,(e)changesinthevolumeandextentofunstablematerials,(f)changesin frequencyandmagnitudeofmassmovementevents,and(g)surfaceinstabilitiescausedby thermokarstprocesses/meltingofpermafrostice.someofthesegeomorphicreactionsarealso truefornonpermafrostperiglacialareas,meaningalpineandsubalpineenvironmentsatlower elevations. Summingupitisshownherequitewellthatongoingclimatechangehasanumberofcomplex influencesonthegroundtemperaturebutalsogroundstabilityonthemountainpermafrostof theeuropeanalps. 5
9 PermaNET Permafrostresponsetoclimatechange 1. Introduction Permafrostisaneffectoffrostandnegativetemperaturesandresultsfromanegativeenergy balanceatthegroundsurface.theenergybalancemainlydependsonthedirectincomingsolar radiationandonthesensibleheatflux.thusitisencounteredinthealpsathighelevations,where airtemperature(controllingthesensibleheatflux)islow.permafrostismoreextensiveandoccursat loweraltitudesonnorthfacingthanonsouthfacingslopes,becauseofareducedincomingsolar radiationduetoslopeangleandshadowingeffects. 1.1Theoccurrencetypesoffrost Permafrostisnottheonlyeffectoffrost.FrostoccursatallaltitudinallevelsintheAlps,withvarious intensityandduration.oneusuallydistinguishesthefollowingoccurrencesoffrost: Diurnalfreezethawcyclesconsistofthefreezingandsubsequentthawingofmaterialduring anightdaycycleorseveralconsecutivedaysorweeks.theyaredrivenbyairtemperature cycles.climatologistsdefinefrostdays(fd)asdayswheretheminimumtemperatureis negative,andicedays(id)asdayswherethemaximumtemperatureremainsbelowzero, henceinducingfreezeconditionsoveratatleastoneday.freezethawdays(ftd)aredefined asdayswithnegativeminimumandpositivemaximumtemperature.insoilandrock,freeze thawcycleshavetobedistinguishedaccordingtotheirduration,intensityandpenetration depth.diurnalfrostisusuallyofmoderateintensityandhasalimitedpenetrationdepth, whereasperiodsofconsecutiveverycoldicedayshavethehighestpenetrationdepthand intensity.freezethawcyclesinducefrostshatteringofrocksandarethemaincontrolling factorofdebrisproduction.tobeefficient,thefrostmusthaveaminimalintensityand duration.diurnalfrostcycleshaveonlyalimitedimpact.cyclesofseveraldaysreaching temperaturesof5 Candlessareconsideredtobemostefficient. Seasonalfrostdefinesmaterialthatexperiencesoneannualfreezethawcycle,ofaduration ofatleastseveralweeksuptoseveralmonths,butwithatotalthawingduringthewarm season.frostdurationanddepthdependmoreonthemeantemperaturethanonindividual cycles.seasonalfrostinducesgeomorphicprocesseslikesolifluctionandsimilarshallowsoil creepingphenomena. Permafrostisdefinedformallyasasubsurfacematerial(rock,debrisorsoil)thatremainsata temperaturebelowzeroduringthewholeyear.itconsistsoftwoparts:thesurfacelayer, calledactivelayerthatthawsseasonallyandrefreezesduringthecoldseason,andthe permafrostsensustrictuthatremainsconstantlybelowzero.fromtheclimaticpointofview, permafrostoccurswheretheannualheatbalanceisnegative.duetosomecharacteristicsof thesurfacelayers(knownasthethermaloffset),thisdoesnotoccuratthe0 Cisotherm,but at a mean annual air temperature of 1 to 2 C. Permafrost is usually subdivided into continuous,discontinuous,sporadicandisolatedpermafrost,accordingtothepercentageof theareacoveredbypermafrost.theusualthresholdsarethefollowingonesbutpartlyvary betweenauthors(cf.french2007): o isolated:lessthan10%ofthesurfaceaffectedbypermafrost o sporadic:between10and50%ofthesurfaceaffectedbypermafrost o discontinuous:between50and90%ofthesurfaceaffectedbypermafrost o continuous:morethan90%ofthesurfaceaffectedbypermafrost. Furthermore,someauthorsdistinguish: o coldpermafrost,withameangroundtemperaturebelow1 C o temperateorwarmpermafrost,withagroundtemperaturecloseto0 C(typically 0.1to0.2 C). 6
10 PermaNETPermafrostResponsetoClimateChange Thispointraisesthequestionofthemeltingpointtemperatureinpermafrost,especiallyin anicedebrismixture. 1.2Altitudinaldistribution The various occurrences of frost show an altitudinal distribution, controlled by the altitudinal gradientsofthecontrollingclimatefactors. Diurnalfreezethawcyclesoccurinwinteratlowaltitudes,inspringandautumnatmiddle altitudesandinsummerathighaltitudes.theirmaximalfrequencyisobservedatmiddle altitudes.intensityanddurationofthefreezethawcyclesincreasewithaltitude. Seasonalfrostoccursatmiddlealtitudesanditsdurationandpenetrationdepthincrease withaltitude.itpassestopermafrostathighaltitudes. Permafrost occurs sporadically at middle altitudes. At high altitudes discontinuous permafrostoccurs,withaprogressivetransitiontomorecontinuouscoveragewithincreasing altitude. Thisaltitudinaldistributionoffrostoccurrencesisassociatedwithanaltitudinaldistributionoffrost relatedprocessesandlandforms: Frostshatteringandtalusproductionarerelatedtofreezethawcycles. Shallowsolifluctionprocessesarerelatedtoseasonalfrost. Deepcreepprocesses(rockglaciers)arerelatedtopermafrost. This altitudinal morphoclimatic distribution has been described by several authors, especially Chardon(1984,1989)whodistinguishesthefollowingbelts: The infraperiglacial belt is concerned by freezethaw cycles and seasonal frost, and processesaredominatedbytalusproductionandsolifluction. Theperiglacialbeltsensustrictoisconcernedbydiscontinuouspermafrost,andprocesses aredominatedbysolifluctionandrockglaciers. Thesupraperiglacialbeltisconcernedbycontinuouspermafrost.IntheAlpsitcoversmainly rockfacesandprocessesaredominatedbyepisodicrockfallsandglaciers. 2. Thermalpermafrostresponse Climatewarminginducesanincreaseofairtemperature,henceanincreaseofthesensibleheatflux. Thustheenergybalanceshouldbecomelessnegative.Ageneralwarmingofgroundtemperatures canthereforebeexpected. However,climatewarmingwillwillmostprobablyneitherchangesolarradiationnoraltitudinal gradients,sothattheoverallaltitudinaldistributionoffrosttypesandeffectswillremain,butis expectedtoshifttowardshigheraltitudes. Heattransfersfrombothsolarradiationandheatfluxtothegroundareinfluencedbythesnow cover.thustheevolutionofthegroundtemperaturewillnotonlydependontheevolutionofthe temperature,butalsoontheamountandtypeofwinterprecipitationandsubsequentlyofthe distribution,durationandthicknessofthewintersnowcover. 7
11 PermaNET Permafrostresponsetoclimatechange 2.1Migrationofpermafrostbelts Temperaturechangeswillaffectallphenomenarelatedtofrost:diurnalfreezethawcycles,seasonal frostaswellaspermafrost.ingeneral,aclimatewarmingshouldinduceamigrationofallclimate relatedlimitsandbeltstowardshigheraltitudes.thefollowingmainchangescanbeexpected: Concerningfreezethawcycles: o Lowerfrequencyandintensityatmiddlealtitudes o Migrationofmaximalfrequencyandintensitytowardshigheraltitudes o Seasonalshiftofcyclefrequencytowardsearlier/laterseason o Increaseoffrequencyathighaltitudes Concerningseasonalfrost: o Decreaseoffrequencyanddepthatmiddlealtitudes o Decreaseofdepthanddurationathigheraltitudes o Replacementofpermafrostbyseasonalfrostatthelowerpermafrostlimit Concerningpermafrost: o Disappearanceofsporadicpermafrostatmiddlealtitudes o Migrationofthelowerpermafrostlimittowardshigheraltitudes o Replacementofcontinuousbydiscontinuouspermafrost Fig.1 Processeswhichmayoccurwithinpermafrostshownasaprocessofdegradation(from Dobinski2011). 8
12 PermaNETPermafrostResponsetoClimateChange 2.2Changesinthermalprofilesoftheground TemperaturechangeswillaffectpermafrostmainlybythefollowingprocessesvisualisedalsoinFig. 1:(a)thickeningoftheactivelayer,(b)warmingofthepermafrosttemperature,(c)reductionofthe permafrostthickness,and(d)decreaseoftheicecontent. Increaseofactivelayerthickness Thefirsteffectofclimatewarmingwillbetheincreaseoftheactivelayerthickness.Thisresponds directly to interannual variations. It depends both on the thermal state acquired during the precedingwinterandonthesummertemperature. Onrockglaciersthereisoftenastrongcontrastbetweenthecoarseblockyactivelayerandthe underlyingicerichandfinergrainedpermafrost.insuchcases,anincreaseoftheactivelayerwill inducealossoficeatthepermafrosttableandageneralloweringofthesurface. Ifthethawingofpermafrostgetsdeeperthantheseasonalfrostdepth,thisseasonalfreezingwillnot beabletorefreezetheentirethawedlayer,andatalik(=unfrozenlayer)willremainduringwinter betweentheseasonallyfrozensurfacelayerandtheresidualdeeperpermafrost.thissituation occurs when the permafrost warms up, and stops to be cooled from the surface. It can be transitional (after a particularly warm year) or permanent (inactivation of permafrost). Such situationsarelikelytooccurinthefutureatthelowerlimitsofdiscontinuouspermafrost. Warmingofthepermafrost Duetoalowthermalconductivityoftheground,theheattransfertowardsdepthisveryslow, especiallyinicerichpermafrost.itthereforecantakeyearstopropagatethroughtheprofile.the permafrosttemperatureisthereforeexpectedtoreactrathertodecadaltrendsthantointerannual variations. Thedownprofilepropagationofheatwavescanalreadybeinterpretedfromsomeboreholeprofiles, where the minimal temperature is registered at a greater depth than the ZAA (zero annual amplitude).withtime,areductionofthecoolingfromthesurfacewillalsoallowawarmingfromthe bottomupwards,duetothegeothermalheatflux. Theroleofthesnowcover All above mentioned evolutions postulate a linear response of ground temperature to air temperature.however,groundsurfacetemperaturemonitoringseriesshowthatthelinkisnot straightforward.thesnowcoverplaysanimportantrolethroughitsinsulationcapacity,andcan inducesignificantdeviationsfromtheairtemperaturetrends. Theonsetandthicknessofthesnowcoverinearlywinterplaysthemajorrole:inNovemberto January,thedaysaretheshortestandthedirectradiationataminimum,whereasairtemperatures reachalreadyverylowvalues.ifthereisnosnowcover,thesoilwilldrasticallycooldown.ashallow snowcovermayevenincreasetheheatloss.onthecontrary,anearlyandthicksnowcoverwill preventthesoilfromcoolingand keep theaccumulatedheatoftheprevioussummerandautumn. The snow cover history in early winter will thus largely determine the winter ground surface temperature, and the winter equilibrium temperature (WEqT), i.e. the mean ground surface temperatureinfebruaryandmarch.onareasofseasonalfrost,itwilldeterminethefreezingorno freezingofthesoil,aswellasthefrostdepth. 9
13 PermaNET Permafrostresponsetoclimatechange Thethicknessofthesnowcoverduringthewinterhasofcoursealsoagreatimportance.Athick cover(atleastca.0.81m)insulatesthegroundfromairtemperaturevariations,andkeepsthe thermalstateacquiredduringautumnandearlywinter.ashallowordiscontinuous(throughwind deflation)snowcoverallowsacontinuedcoolingofthegroundduringthewholewinter. Thedurationofthesnowcoverinspringhasaninverseeffectthaninearlywinter.Alatesnowmelt preventsthesoilfromthedirectsolarradiation,inaperiodwhereitisatamaximum,andprotectsit fromthesensibleheatflux.onthecontrary,anearlysnowmeltwillallowanearlierwarmingofthe soil.thus,thewintercoolingeffectofashallowsnowcovercanbecompensatedbyanearliersnow melt. Theeffectofthesnowcoveriswellvisibleontheinterannualtemperaturevariability.Itcaninduce significant departures from the atmospheric temperature variations, e.g. cooling during rather moderatewinters,orwarmingdespiteofcoolwinters.itsrealinfluenceonmiddletolongterm temperaturetrendsremainsanopenquestion.temperaturerecordsinboreholesatca10mdepth showadistinctwarmingtrendfrom1987to1994,andthenastabilisation(permos2009),butno realcooling,unlikethesurfacetemperatures. Thethermalevolutionofpermafrost,andmoregenerallyofgroundtemperatures,willthusdepend on both air temperature and snow cover. Most climate models predict an increase of winter precipitations.ifthisoccursassnowfall,itcanhavevariouseffects,dependingonitsseasonality: Earlysnowfallswouldincreasewarming Athickhighwintersnowcoverwillratherincreasewarming Alatesnowmeltwouldpreventgroundfromwarming. Thesnowcoveronlyimpactsareasofmoderateslopeswhereathicksnowcovercandevelopand stayduringwinter.onsteeprockfacesthesnowcoverhasnoinfluence. 2.3Ratesofchange Asmentionedabove,theheattransfertowardsdepthisveryslow,especiallyinicerichpermafrost. It therefore can take years to propagate through the profile. The permafrost temperature is therefore rather expected to react to decadal trends than to interannual variations. Model calculationsshowthatittakesdecadestoreachanewequilibriumatdepthsof20to30m.in bedrock,theheatpropagationcanbemuchfaster. Theroleoficecontent Thepropagationoftemperaturechangesintothesoilisstronglydependentfromtheicecontent. Duetothehighamountoflatentheatneededtomeltice,highicecontentstronglyreducesthe thermalconductivityoftheground.onedimensionalheattransfermodelsshowthatanicecontent of60%almosttotallyblocksthepropagationofseasonaltemperaturevariations,andthatthe meltingoftheicebodymayneedseveraldecades. Fromthethermalpointofview,icerichpermafrostisthereforelesssensitivetoclimatechangethan dry permafrost.ontheotherhand,thehighicecontentcanleadtosubsidenceandthermokarst phenomena,duetovolumeloss.inflatterrainthethawingoficerichpermafrostthereforeleadsto greaterdisturbanceanddamagethanthethawingof dry permafrost. 10
14 PermaNETPermafrostResponsetoClimateChange 3. Geomorphicpermafrostresponse Climate change will affect both spatial distribution and intensity of frost related processes. As mentionedabove,thermaleffectsoffrostshowaclearaltitudinaldistribution.thus,thefrostrelated geomorphicprocessesandlandformsshouldmigratetohigheraltitudes,togetherwiththeirdriving climateparameters.thishoweverwillmainlyhappenthroughchangesinmagnitude(intensity, duration,frequency)oftheseprocesses.inadditiontothealtitudinalshift,someparticularoreven sofarunknownphenomenamayoccur,duetotransientstatesofgroundconditionsthatarenot usuallyobservedunderclimaticallystableconditions. 3.1Frostshatteringanddebrisproduction Frostshatteringanddebrisproductionarecontrolledbyfreezethawcycles,anditisusuallyadmitted thatthemaximaldebrisproductionoccursataltitudesofmaximalcyclefrequency,correspondingto springandautumncycles.thisaltitudinalrangehasbeendefinedasthetaluswindow(hales& Roering2005). Thetaluswindowisthusexpectedtomovetowardshigheraltitudes.Somestudiesalreadyshowa decreaseoftalusproductionintheuppersubalpinebelt(arquès2005,corona2007),aswellasa decreaseofthetorrentialactivityontalussuppliedtorrents(garitte2006).thisevolutioncouldlead toanoveralldecreaseofgeomorphicactivityinmiddlealtitudes,andfavourtherevegetationof screeslopes. Ontheupperend,thenormalstateofhighaltitudinalrockwallsinthecontinuouspermafrostbeltis ahighstabilityofrockfaces,withonlylimitedsporadicdebrissupplyfromoccasionalrockfalls.these slopes where freezethaw cycles were yet limited to the summer season could experience an increaseoftalusproduction.departurezonesofrockfallsarefrequentlyconcentratedinthelower partsofthecontinuouspermafrostbelt.bothrockfallsanddebrisproductionareclearlyrelatedto warmperiodsduringsummermonths,inducingadeepeningoftheheatpenetrationinrockfaces (Deline&Ravanel2011). Regardingdebrisproductionfromcliffsandrockfaces,climatewarmingwillinducesignificanteffects ontwodifferentaltitudinallevels: Thetaluswindowcanbeexpectedtoshifttowardshigheraltitudes.Asaconsequence,talus productionshoulddecreaseinthelowerparts,andincreaseintheupperpartsofthebelt. Thisbeltischaracterizedbyaregularproductionofsmalldebris. Anewbeltofincreaseddebrisproductionisdevelopingatthelowerlimitofthecontinuous permafrostbelt.thisbeltischaracterizedbyasporadicproductionofcoarsedebris,upto largeorevenverylargerockfalls.duetooftenhighandsteepslopes,theseprocessescan impactzonessituatedfarlowerdownslope. Indirecteffectsonotherprocessescanbeexpected: Rockglaciersareusuallysituatedintheupperpartofthetaluswindow.Anincreaseofthe talusproductionatthislevelcouldthereforeinduceanincreaseofthedebrissupplytorock glaciers.onamuchlongertimescale,theincreaseinvolumeofsometalusbodiescould induce the formation of new rock glaciers. However, fast climate warming and hence permafrostdegradationwillmaketheformationofnewrockglaciersmoredifficult. Accumulationzonesofglaciersareoftensituatedatthefootofhighaltituderockwalls.An increaseofsporadicdebrissupplyfromtheserockwallswillinduceanincreaseofdebris coveranddebriscontentoftheglaciers,andconsequentlyanincreaseoftheextentofdebris coveronglaciers.thisimpactthedynamicoftheseglaciersasforinstancethemiageglacier 11
15 PermaNET Permafrostresponsetoclimatechange initaly(deline&orombelli2005)orthepasterzeglacierinaustria(kellererpirklbaueretal. 2008). 3.2Solifluctionandseasonalfrost Solifluctionphenomenaarerelatedtoseasonalfrostandneedasufficientfrostdepthinorderto allowawatersaturatedthawedlayertoforminspringoverastillfrozenimpermeablesoil.after completethawing,thesoildrainsandsolifluctionprocessesstop.adecreaseoftheseasonalfrost depthwillthereforeinduceashorteningoftheactivityperiodandhenceadecreaseofmovement rates.foramoredetailedclassificationofsolifluctiontypesrefertomatsuoka(2001). Inaddition,someprocesseslikeboundedsolifluctionareconnectedwithfinegrainedsoilsandwith thepresenceofavegetationcover.theupwardsmigrationofsuchphenomenawilldependonthe presenceoffinegrainedmaterialandonthedevelopmentofalpinemeadows.solifluctionprocesses areverydifficulttostudyandonlyfewlongtermmonitoringsitesareknowninthealps(e.g.stingl etal.2010).ingeneral,thereisalackofdataonseasonalfrostandonrelatedprocesses. 3.3Rockglaciers ThemostprominentfeaturesofAlpinepermafrostarerockglaciers.Theyarealsothemostmobile ones.thepossibleevolutionscenariosofrockglacierdynamicsarethereforeacentralconcernfor Alpinemountainregions.Displacementtimeseriesandreconstructionsofadozenofrockglaciers throughoutthealps,indicatedifferenttypesofbehaviouratvarioustimescales. Attheinterannualtimescale(Delaloyeetal.2008,Bodinetal.2009,KellererPirklbauer&Lieb2011): Mostrockglaciersshowinterannualvelocityvariations,andthusreacttoclimatevariability. Thesevelocityvariationsarebestcorrelatedwitha12monthrunningmeanoftheground surfacetemperature. Thevelocityvariationsshowatimelagofca1yeartowardsairandgroundtemperature. Thesevariationsarereversiblewithwarmingleadingtoavelocityincreaseandcoolingtoa velocitydecrease.thevelocityratesremainintherangeof0.1toafewm/y 1 ). Somerockglaciershaveshownadistinctchangeindynamicbehaviourduringthelastdecadesor years,withastrongincreaseofvelocitiesonpartsorthewholeoftherockglacier(e.g.avianetal. 2005).Severaltypesofbehaviourscanbedistinguished(seePermaNETreport6.2forstudycases andmoredetail): Strong acceleration with opening of crevasses. The velocities increase by an order of magnitude,uptoseveralm.y 1.Crevassesshowthatthedeformationratesexceedtheflow capacityoftheice. Ruptureanddislocationofthelowerpartoftherockglacier.Inthesecases,adistinctrupture withascarpappearsintherockglacierandseparatesthelower,fastpart,fromtheupper, normal movingpart. Totalcollapseofthelowerpart.Onlyonecaseisknownyet,wherethelowerparttotally collapsedintoamudflow(krysieckietal.2008). Extremeaccelerationoftherockglacier.Onecaseisknown,withvelocitiesofseveraltensof m.y 1 (Delaloyeetal.2010). Alltheseevolutionsareapparentlynotreversible,butobservationtimesarenotyetsufficientto knowtheendofthestory.theacceleratedlowerpartstendtodislocate,whereastheupperparts possiblyformanewrockglacierfront.severalquestionsarise: 12
16 PermaNETPermafrostResponsetoClimateChange Interannual variations are hard to explain. One possible explanation could be a higher plasticityoficewithhighertemperature.however,themaindeformationratesoccurinthe basallayerofrockglaciers,asshownbythefewexistinginclinometerprofiles.thethermal conductivityoficerockmixturesisverylow,anditisunlikelythatinterannualtemperature variationsreachthebottomoftheicerichbody.anotherexplanationcouldbeanincreased presenceofinterstitialwater,facilitatinginternalmovementsbetweenicegrains. Theveryhighvelocityincreaseobservedonacceleratingrockglaciers(someauthorseven talkabout surging rockglaciers)impliesachangeofdisplacementmode.rockglaciersare usuallyconsideredtomoveatthesamewayascoldbasedglaciers,bydeformationoficeand shearofthebasalicelayer.velocitiesofseveralm/y 1 andevenmoreseemtoindicatethe onsetofabasalsliding.thiswouldmeanthattheserockglaciershavechangedfroma cold glacier toa temperateglacier displacementmode.thelatterpointiscrucialforfuture development,andhastoberelatedtothequestionofthemeltingpointtemperature. Theconditionsthatleadarockglaciertoaccelerateornotareunknownyet.Thepresenceof aconvexslopeseemstobenecessaryfortheonsetofstrongaccelerationsofthelowerpart (e.g.avianetal.2005).thetotalcollapseoccurredonarockglaciermadeoffinematerial, andispossiblyunlikelytohappenonacoarseblockyrockglacier. Fromtheseconsiderations,thefollowingmostprobableevolutionscenarioscanbeproposed: Interannualvariationswillcontinue.Velocityincreasesareexpectedtohappenmainlyafter very hot summers associated with snow rich winters. Such episodes may occur more frequentlyandonanincreasingnumberofrockglaciers. Strongaccelerationsarelikelytooccuronanincreasingnumberofrockglaciers. Accelerationepisodesareatransientstate,andwilllastonlyaslongastheicecontentis sufficienttoallowcreeping.aftericelossissufficientandthepermafrostisnolonger supersaturatedwithice,movementsshouldslowdownandstop. Totalcollapseorextremeaccelerationswillpossiblyremainexceptionalcases,butabetter knowledgeisrequestedinordertobeabletoevaluatetheirprobability. 3.4Thermokarstphenomena Ifpermafrostissupersaturatedinice,themeltingoficeduetopermafrostdegradationinduceda volume loss of the substrate affected which leads to instabilities at the surface and finally to settlementofthesurface.theseprocessescanespeciallybeobservedinareaswithlowinclinations wheretheycreateamoreruggedtopographythanithasexistedbefore.ifthereisanimpermeable layerbeneath(e.g.thepermafrosttableitself)thermokarstlakesmaygetformed. Settlementprocessesdonotonlylowerthesurfaceandchangeitstopographybutarealsoofspecial significance for buildings and other infrastructures because they create the need to adapt the constructionsinordertoavoiddamage. 4. Finalremarks Table1givesanoverviewofthethermalandgeomorphicreactionsofpermafrosttoclimatechange astheycanbeexpectedaccordingtoconsiderationsgiveninthepreviousparagraphs.thechanges listedinthetableservedasguidelinesforcarryingoutthecasestudiesinchapter3andinterpreting theresultswhicharesummarizedinchapter4. 13
17 PermaNET Permafrostresponsetoclimatechange Table1PossiblethermalandgeomorphicpermafrostreactionsrelevantforPermaNET. Possiblethermalpermafrostreactions Increasinggroundtemperature(inbedrock,fineandcoarsesediments)andhencepermafrostwarming Thawingofpermafrostwiththreeeffects:(1)reductioninthespatialextentofpermafrost,(2)activelayerthickening,and (3)increasinggroundwatercirculationandpressure Changesinthenumberoffreezethawcyclesandmagnitude(durationandintensity)offreezingandthawingperiods Possiblegeomorphicpermafrostreactions Changesintherateofrockglacierdisplacement(verticallyandhorizontally) Changesindisplacementmodeofrockglaciers(initiationofbasalsliding,collapse) Changesinsolifluctionrates* Changesincryogenicweathering(freezethawcycles,icesegregation)* Changesinthevolumeandextentofunstable/unconsolidatedmaterials Changesinfrequencyandmagnitudeofmassmovementevents(e.g.rockfall,rockslide,debrisflow)* Surfaceinstabilitiescausedbythermokarstprocesses/meltingofpermafrostice* *notstrictlyrelatedtoonlypermafrostbuttoperiglacialenvironmentsingeneral Monitoringofpermafrosttemperatureisperformedonthreedifferentkindsofpermafrostsites primarilyusingminiaturetemperaturedataloggers(mtd)orthermistorchainslocatedinboreholes (fromveryshallowtodeep): Permafrostandactivelayerinbedrock(fromnearverticalrockwallstoflatmorphologies) Permafrostandactivelayerinfinegrainedmaterial(ratherflatmorphology) Permafrostandactivelayerincoarsegrainedandblockymaterial(screeslopes,rockglaciers; fromsteepslopestoratherflatmorphologies) Climateconditionsatpermafrostsitesaremonitoredbymeteorologicalstations.Monitoringof dynamic conditions in permafrost environments is carried out by geodetic, photogrammetric, terrestrial laserscanning (LiDAR or TLS), differential SAR interferometry (DINSAR) and DGPS techniquesaswellasvisualobservationsandcalculations.thismonitoringfocuseson: Massmovement(e.g.rockfall)frequencyandmagnitude Rateofrockglacierdisplacement(verticallyandhorizontally) Physicalweathering(freezethawcycles) TosumupAction5.3usesawiderangeofmethodsintheassessmentofthethermalanddynamic reactionscenariosofdifferentpermafrosttypologies.researchinthisactioniscarriedoutintwo steps:(i)establishmentoftherelationshipbetweenmeasuredclimatedataandobservedthermal andgeomorphicpermafrostreactions(table1)usingavailabledatasetscollectedduringthelast yearsanddecades(cf.chapter3).(ii)combiningtheestablishedrelationshipswithdatafromthe climatescenariofortheyear2050presentedinchapter2formsthebasisforestimationsoffuture changesinpermafrostdistribution(verticallyandhorizontally),intheactivelayerthicknessorinthe ratesofrockglacierdisplacement. References: ArquèsS.,2005:GéodynamiqueetbiodiversitédesversantsasylvatiquesdumassifdelaGrandeChartreuse. Evolutionliéeauréchauffementclimatiqueetproblèmedegestion.ThèseUniversitéJosephFourier, Grenoble. AvianM.,KaufmannV.&LiebG.K.,2005:RecentandHolocenedynamicsofarockglaciersystem:Theexample ofhintereslangtalkar(centralalps,austria).norwegianjournalofgeography,59,
18 PermaNETPermafrostResponsetoClimateChange BodinX.,ThibertE.,FabreD.,RiboliniA,SchoeneichP.,FrancouB.,Reynaudl.&FortM.,2009:Twodecadesof responses ( ) to climate by the Laurichard rock glacier, French Alps. Permafrost and PeriglacialProcesses,20, ChardonM.,1984:Montagneethautemontagnealpine,critèresetlimitesmorphologiquesremarquablesen hautemontagne.revuedegéographiealpine72(24): ChardonM.,1989:Essaid'approchedelaspécificitédesmilieuxdelamontagnealpine.RevuedeGéographie Alpine77(13):1518. Corona C., 2007: Evolution biostasique du paysage, géodynamique nivéopériglaciaire et fluctuations climatiquesrécentesdanslahautevalléedelaromanche(alpesdunord,france).thèseuniversité JosephFourier,Grenoble. DelineP.&OrombelliG.,2005:GlacierfluctuationsinthewesternAlpsduringtheNeoglacial,asindicatedby themiagemorainicamphitheatre(montblancmassif,italy).boreas,34: DelineP.&RavanelL.(2011).Chapter3.9:CasestudiesintheEuropeanAlps RockfallsintheMontBlanc massif,frenchitalianalps.inkellererpirklbauera.etal.(eds):thermalandgeomorphicpermafrost responsetopresentandfutureclimatechangeintheeuropeanalps.permanetproject,finalreportof Action5.3.OnlinepublicationISBN DelaloyeR.,PerruchoudE.,AvianM.,KaufmannV.,BodinX.,HausmannH.,IkedaA.,KääbA.,Kellerer PirklbauerA.,KrainerK.LambielC.,MihajlovicD.,StaubB.,RoerI.,ThibertE,.2008:Recentinterannual variationsofrockglaciercreepintheeuropeanalps.9thinternationalconferenceonpermafrost, Fairbanks,UniversityofAlaska: DelaloyeR.,MORARDS.,AbbetD.,HilbichC.,2010.TheSlumpoftheGrabenguferRockGlacier(SwissAlps). 3rdEuropeanConferenceonPermafrost(EUCOPIII),Svalbard,Norway:157. DobinskiW.,2011:Permafrost.EarthScienceReviews108: FrenchHM.,2007:ThePeriglacialEnvironment.3rdedition.WestSussex:JohnWileyandSons,458pp. Garitte G., 2006: Les torrents de la vallée de la Clarée (Htes Alpes, France). Approche géographique et contribution à la gestion du risque torrentiel dans une vallée de montagne. Thèse Université scientifiqueettechniquedelille. HalesTC,RoeringJJ.,2005:Climatecontrolledvariationsinscreeproduction,SouthernAlps,NewZealand. Geology33: KellererPirklbauerA.&LiebG.K.,2011:Recentrockglaciervelocitybehaviourandrelatednaturalhazardsin thehohetauernrange,centralaustria.permanetprojectreport ContributionofIGRStoAction 6.2/Group1 Rockglacier. KellererPirklbauerA.,LiebG.K.,AvianM.&GspurningJ.2008:Theresponseofpartiallydebriscoveredvalley glacierstoclimatechange:theexampleofthepasterzeglacier(austria)intheperiod1964to2006. GeografiskaAnnaler,90A(4): Krysiecki,J.M.,Bodin,X.,Schoeneich,P.,2008.CollapseoftheBérardRockGlacier(SouthernFrenchAlps).9th InternationalConferenceonPermafrost,Fairbanks,UniversityofAlaska: MatsuokaN.,2001:Solifluctionrates,processesandlandforms:aglobalreview.EarthScienceReviews,55, PERMOS2009:PermafrostinSwitzerland2004/2005and2005/2006.NötzliJ.,NaegeliB.,VonderMühllD. (eds).glaciologicalreportpermafrostn 6/7,CryosphericCommissionoftheSwissAcademyof Sciences. Stingl,H.,Garleff,K.,Höfner,T.,Huwe,B.,Jaesche,P.,John,B.andVeit,H.,2010:Grundfragendesalpinen Periglazials Ergebnisse,ProblemeundPerspektivenperiglazialmorphologischerUntersuchungenim Langzeitprojekt GlorerHütte indersüdlichenglockner/nördlichenschobergruppe(südlichehohe Tauern,Osttirol).SalzburgerGeographischeArbeiten,
19 2. TemperatureChangeintheEuropeanAlps Citationreference KroisleitnerCh.,ReisenhoferS.,SchönerW.(2011).Chapter2:ClimateChangeintheEuropeanAlps. InKellererPirklbauerA.etal.(eds):Thermalandgeomorphicpermafrostresponsetopresentand futureclimatechangeintheeuropeanalps.permanetproject,finalreportofaction5.3.online publicationisbn ,p Authors Coordination:ChristineKroisleitner Involvedprojectpartnersandcontributors: CentralInstituteforMeteorologyandGeodynamics(ZAMG) ChristineKroisleinter,Stefan Reisenhofer,WolfgangSchöner Content Summaryfordecisionmakers 1. Temperaturechangeintherecentpast 2. Projectedtemperaturechangeuntil2050 References 16
20 PermaNET ClimateChangeintheEuropeanAlps Summary TheairtemperatureintheEuropeanAlpshasincreasedbyabout2 Csincethelate19 th century. Thewarmingwasparticularlypronouncedsincethebeginningofthe1980s.Thetemperature increasewasassociatedwithdegradationofthealpinepermafrost.thispapersummarizesthe observedchangesofairtemperatureandusesresultsfromclimatemodelsimulationstoderive futurescenariosofairtemperatureinthealpsfortheperiod inordertoprovide morerelevantinformationonthermalresponseofpermafrostthepaperusesanempiricalmodel torelateairtemperaturedatatonumberoffrostdays,numberoficedaysandnumberoffreeze thawdaysforthealpsataltitudesabove1800ma.s.l.forboththepresentclimate(reference period ) and for a future climate The model results show that highest numbersoffreezethawdaysaresimulatedforaltitudesof1800ma.s.l.(evenhighervaluesare modeledforlowerelevations)withabout100daysperyearanddecreasingnumberoffreeze thawdayswithincreasingelevation.moreover,themodelshowsthatthenumberoffreezethaw dayswillgenerallyincreaseforaltitudesabove1800ma.s.l.byvaluesupto4daysayearuntil ,thusincreasingtheweatheringatallelevationsabove1800ma.s.l. 17
21 PermaNET Permafrostresponsetoclimatechange 1. Temperaturechangeintherecentpast TheAlpsasoneofthemajortopographicformsinEuropeinfluencestheatmosphericcirculation overawiderangeofscales.theconsequencesofthisfactareavarietyofdifferentclimates,from maritimetocontinentalandfromlowlandtomountainous.inaclimateanalysisofthegreateralpine Region(GAR)Brunettietal.(2009)highlightedanaverageGARwarmingtrendofabout1.3 Cover thecommonperiodcoveredbyalltheclimatevariables( ),1.4 CforthereferenceIPCC period( )whichisawarmingabouttwiceaslargeastheglobaltrendreferredtobyipcc (2007).Furthermore,Brunettietal.(2009)foundout,thatfortheGARregionthemajorityofthe warmestyearsintheperiod weremeasuredinthepast15to20years.themostextreme summerwasfoundfor2003,whereasthemostextremesummercoldeventhappenedin1816after thevolcaniceruptionsoftambora.itisworthnoticingthatthe2003summertemperaturewas4.2 standarddeviationsabovethecorresponding2003summernormalvalue,butthe1816coldextreme wasonly2.6standarddeviationslowerthanthesummernormalvaluecorrespondingtosummer The20 th centuryclimateineuropevariednotonlyintime,butalsofromlocationtolocation.1900to 1940,themeanannualairtemperature(MAAT)increasedinwesternandnorthernEurope,while mostoftheremainingpartofthecontinentexperiencedonlysmallchanges.from1940to1975was aperiodofcoolinginthearctic,butincontinentaleuropejustthenorthernpartwasaffectedbythis trend.theeasternpartofeuropeexperiencedaslightwarmingduringthattimeandthesouthern partkeptnearlyconstant.intheperiod widespreadclimatewarmingineuropewas recorded.generallythesouthwestofeuropeandscandinaviaweremostaffected,butseasonally therewerelargeregionaldeviationsfromthisannualtrend.inwinterthetemperatureinnorthern andwesterneuropewasincreasing,whereasinspringthetemperatureroseespeciallyinthecentral andsouthwesternparts.summertemperatureswerecharacterizedbyanincreaseallovereurope, mostpronouncedinthesouthernpart.autumn stemperaturewasmainlycharacterizedbyitsspatial variability(harrisetal.,2009). Climatechangeinthepast250yearsintheAlpshasbeenextensivelystudiedintheprojectHISTALP (Aueretal.,2007).TheHISTALPdatabasecoverstheGreaterAlpineRegion(GAR)withmonthly homogenisedrecordsoftemperature,pressure,precipitation,sunshineandcloudinessfortimes datingbackto1760fortemperatureand1800forprecipitation.thelongtermwarmingtrendvisible intheseasonalandannualmeantemperaturetimeseriesofgarcouldnotbeconfirmedforother climateparameters,likeprecipitation,forwhichaueretal.(2005)detectedtwoantagonistictrends, awettingtrendinthenorthwestofthealps(sincethe1860s)andadryingtrendinthesoutheast (since 1800). Remarkably, even the highest mountain observatories within the Alps such as Sonnblick,JungfraujochandZugspitzeshowthesametemperaturetrendsasMunich,Vienna,Milano orsarajevo.theglobalmeantemperatureseriesshowonlyhalfofthelongtermwarmingofthealps sincethemid19 th century. 2. Projectedtemperaturechangesuntil Introduction Asinthepast,theAlpswillalsoinfuturebeexposedtoastrongerwarmingthantheearthingeneral. AccordingtotheIPCC(2007)scenarios,thetemperatureforwholeEuropewillrisefor3.3,whereas thealpswillhavetofaceatemperatureriseof3.9 Cuntiltheendofthe21 st century(figure1).in thehighmountainareasabove1500ma.s.l.thewarmingfromclimatemodelprojectionscouldbe evenhigher(4.2 C;EEAReportNo.8,2009). 18
relativetotheWMO normalperiod19611990derivedfromtheipccar4aogcmmultimodelensemble(anthropogenic")
22 PermaNET ClimateChangeintheEuropeanAlps Fig.1 Temperatureanomaly1860to2100fortheGreaterAlpineRegion(GAR)relativetotheWMO normalperiod derivedfromtheipccar4aogcmmultimodelensemble(anthropogenic andnaturalforcingpriorto2001,anthropogenicforcingonlyfrom ).thegreenlineshows measuredtemperatureanomaliesfromthehistalpproject.(source:schöneretal.,2011). 2.2 Experimentaldesign Althoughpermafrostinthehighmountainareasisnotverywellknownyet,itisobviousthatthereis arelationshiptoclimaticelements.however,ifthisrelationshipwouldbeeasytodescribe,itwould havebeendonedecadesago.therelationshipofnearsurfacepermafrosttemperaturesandair temperatureisstronglyaffectedbysnowthicknessandduration,whicharethemselvesdrivenby atmosphericconditions(harrisetal.,2009).thisinvestigationdoesnotfocusonchangeinthe permafrostdistribution,butonthechangeinatmosphericfrostbehaviour.thepresenceoffrost above the earth s surface is crucial for the existence of permafrost, but furthermore for the developmentandconservationofasnowcover. Thecoreofthisinvestigationisthecomparisonoffrost,ice,andfreezethawdaysbetweenthe climateperiods196190and adaybecomesclassifiedasfrostday(fd),whenthedaily minimumtemperatureisbelowzero.ifalsothedailymaximumtemperatureisbelowthefreezing point,thedayisclassifiedasiceday(id).thedifferencebetweenicedaysandfrostdays,which meansalldayswithadailyminimumtemperaturebelow0 Candadailymaximumabovethislimit, get classifiedasfreezethawdays(ftd).itisobviousfromfutureclimate scenarios,thatfrost frequencywillgetless. Accordingtotheclimatictrend,severalAlpineregionsexperiencedadecreaseinfrostfrequency(FF) andanextensionofthefrostfreeseason(aueretal.2005).inaustriaobservationsindicate,that duringthe20 th centuryareductionofthefrostseasonby17daysintheflateasternregion(vienna) andby22daysinthehighalpineregionaroundthemountainpeakstationofsonnblick(3100m a.s.l.)hashappened. 19
23 PermaNET Permafrostresponsetoclimatechange 20 Incanbeassumed,thatinawarmerclimatetheintensityoffrostweatheringchanges,causedbythe spreadingofthefreezethawcycleszonetohigheraltitudes.howthischangecouldhappeninan A1BclimatescenariowasinvestigatedforthehighmountainouszoneoftheentireAlpsabove 1800ma.s.l. 2.3 Empiricalapproachtoestimatefrostdays,icedaysandfreezethawdays Aueretal.(2005)foundanempiricalrelationshipofatangenshyperbolicusfunctiontoestimate frostfrequency(ff)frommonthlymeanairtemperature.ffisdefinedbythenumberoffrostdays dividedbythenumberofdayswithintheconsideredmonth.thetanhfunctionwascalculatedusing temperaturedatafrom363climatestationsinaustriaincludingthehighalpinestationsonnblick (3105ma.s.l.).Aueretal.(2005)calculatedatleast66%FF(20.5FD)forJanuaryinAustriaforall stations.inapriltheffcoveredawidespectrum,from100%(30fd)atthemountainpeakstation Sonnblicktonearlynofrostinthelowlands.InJulyonlyatthemountainstationSonnblickfrostdays wereregistered.hence,withouttakingintoaccounthighelevationmountainstationsitwouldbe impossibletoreceiverobustcoefficientsforthemodel.overall,thetanhmodelwasabletoexplain abound55%ofthethevarianceofffdatafromairtemperaturedata.validationofthemodelwith datafromtheentiregarshowedthatthereisalmostnodifferenceintheperformanceifthemodels arecalibratedonaustriandataorondatafortheentiregar(seeaueretal.,2005,fordetails). IncontrarytoAueretal.(2005)inourstudyweused30yearsclimatenormals(196190)torelate annualfrostdaystoannualairtemperaturemeans,whichsignificantlyincreasedtheperformanceof statisticalrelationships.thisapproachismotivatedfromtheaimofthisstudytocomparepresent meanclimatewithafutureclimatemeanscenarioforbothfrostdaysandicedays.consequently, thefrequencyoficedays(asthenumberoficedaysdividedbythenumberofdayswithinthe consideredmonth)wererelatedinasamemannertomeanannualairtemperatureusingatanhfit forthereferenceperiod thestatisticsofthederivedtanhmodelsareshownintables1and 2.Inafinalstepthefreezethawdayswerecalculatedfromthedifferencebetweenicedaysandfrost days. Table1 Statisticalmodel(generalmodel,coefficientsandgoodnessoffit)inordertocomputeannualfrostday frequency(f(x))fromannualairtemperature(x)forthereferenceperiod Generalmodel Coefficients (with95%confidencebounds) Goodnessoffit f(x)=50+(50*tanh(a*x+b)) a= (0.0947, ) b=0.3437(0.3328,0.3546) SSE:3530 Rsquare: AdjustedRsquare: RMSE:2.77
24 PermaNET ClimateChangeintheEuropeanAlps MeanAnnualAiremperature( C) Fig.2 RatiofrostdaystototaldaysversusmeanannualairtemperatureinAustriausingdatafrom 363climatestationsinAustriafortheperiod Theredlineisatanhfit.Statisticalmeasures ofthefitareshownintable1. MeanAnnualAiremperature( C) Fig.3 RatioicedaystototaldaysversusmeanannualairtemperatureinAustriausingdatafrom 363climatestationsinAustriafortheperiod Theredlineisatanhfit.Statisticalmeasures ofthefitareshownintable2. 21
25 PermaNET Permafrostresponsetoclimatechange 22 Table2 Statisticalmodel(generalmodel,coefficientsandgoodnessoffit)inordertocomputeannualiceday frequency(f(x))fromannualairtemperature(x)forthereferenceperiod Generalmodel Coefficients (with95%confidencebounds) Goodnessoffit f(x)=50+(50*tanh(a*x+b)) a=0.1248(0.1259,0.1236) b=0.3573(0.3638,0.3507) SSE:1323 Rsquare: AdjustedRsquare:0.995 RMSE: Empiricalapproachtoestimatefrostdays,icedaysandfreezethawdaysfortheentireAlps WeusedthespatiallyhighresolutiontemperatureclimatologyofHiebletal.(2009)tocomputethe numberoffrostdays,thenumberoficedaysandthenumberoffreezethawdaysforthealpine regionforboththepresentclimateandthefutureclimate however,ourstudywas restrictedtothealpineareaabove1800ma.s.l.asthezonemostrelevantforpermafrost.inafirst stepthe~1kmresolutiongarmonthlytemperatureclimatology(196190)wasdownscaledusingthe ~30mresolutionASTERGDEMforthehighmountainareaoftheAlps.Thetemperaturegridwas recalculatedaccordingtotheapproachofhiebletal.(2009),whichheusedforthedevelopmentof the~1kmspatialresolutiongarclimatologybasedon climatenormals.theworkofhiebl etal.(2009)isbasedonastationnetworkof1,726climatestationsforthegreateralpineregion, whichwerecarefullyqualitycheckedandhomogenized. AccordingtoHiebletal.(2009)weusedseveralgeographicalvariablestocomputeairtemperature bymeansofamultilinearregressionapproach: Thelongitudinalgradientstakeintoaccounttheunderlyingoceanictocontinentaltransition, whichoccursfromthewesterntotheeasternedgeofthegar.however,thevarianceof temperatureexplainedfromlongitudeislimitedto1%oftheannualvariance. Onthecontrarytothissmallamount,latitudeexplained19%ofthevarianceofannualair temperaturebymainlycapturingtheeffectofthesouthnorthsolarradiationgradienton temperature. Asexpected,thelargestpartoftemperaturevariancecouldbeexplainedbyelevation.The verticalregressionmodelexplainsasmuchas69%ofthetemperaturevariancefortheyearly averages,althoughduringwinterduetostableatmosphericlayeringthevaluedecreasesto around45%. Forconsideringdifferenttemperaturebehavioursatlowaltitudeareasandhighaltitude areashiebletal.(2009)introduceda3verticallayersmodel.thelowestlayerrangesfrom 600minthesouthernpartsupto800minthewesternpartsoftheGAR.Thehighelevation layersverticalextentbeginsat1800ma.s.l.betweenthetwolayersthetemperatureswere simplyinterpolated.inourstudyweusedonlythehighest(above1800ma.s.l.)layer. SlopesgotimplementedinthemodelbyusingananalysisofAuer&Böhm(2003)which systematicallyanalyseddatafrom85austriansiteswithdetailedsitedescription.theyfound
26 PermaNET ClimateChangeintheEuropeanAlps 23 monthlydeviationsfromthemeanfornorthandsouthfacingslopesrangingfrom0.2to 1.0 C. Maritimeinfluencewastakenintoaccountbyestablishingatopographicallyweightedfield ofdistancesfromthecoast.hiebletal.(2009)foundasurprisinglystrongdependencyof temperatureondistancefromthecoast.atayearlyaveragethedistancetothecoast variableexplained41%ofthetemperaturevariance. The30yearhighalpinemonthlymeantemperatureswerecalculatedfromthefollowingregression equation: t01= *[lon_1] *[lat_1] *[dem] *[coast] [lon_1]longitude [lat_1]latitude [DEM]digitalelevationmodel [coast]coastdistancegrid AsshownbyHiebletal.(2009),consideringlongitude,latitudeandthedistancefromthecoasts besideselevationreducedtheaveragemonthlystandarderrorto0.79 Cpermonth.Furthermore Hiebletal.(2009)usedtheGTOPO30DEMwithaspatialresolutionof30arcseconds,which correspondstoabout1km.gtopo30hasarootmeansquareerrorofabout18m.appliedon monthlylapseratemodels,thedeminaccuracyleadstoatemperatureerrorof0.09 Conaverage. InthisstudyweusedtheempiricaltemperaturemodelofHiebletal.(2009)butreplacedthe GTOPO30DEMbytheASTERGDEM,thusrefiningthespatialresolutionoftemperaturegridto1arc second(~30m).comparedtogtopo,withanerrorofsurfaceelevationofabout18m,theaster GDEMhasanoverallrootmeansquareerrorof10.87m.Theerrorofsurfaceelevationcanbe assumedtobeapproximately20mataconfidencelevelof95%. Basedontherefined climatology(climatenormal196190)ofannualairtemperature andthe empiricalmodelsforfrostdays(tab.1andfig.2)andforicedays(tab.2andfig.3)30mrasterdata ofclimatenormals(referenceperiod196190)offrostdaysandicedaysforthealpineregionwere computed. 2.5 Estimationoffuturefrost,iceandfreezethawcyclesdaysscenariosfortheperiod ForprojectingthetemperatureoftheAlpsforthefutureperiod weusedtheregional climatemodelexperimentofhollwegetal.(2008)whichdynamicallydownscaledtheecham5 MPIOMA1Bscenario(Röckneretal.,2003)bymeansoftheregionalclimatemodelCLM.The performanceofthisclmmodelrunforthegarwasextensivelytestedinschöneretal.(2011). Particularly,itwasshownbySchöneretal.(2011)thatcomparedtoanensemblessimulationforthe Alpineregion(usedfromthePRUDENCEensembles;seeFreietal.,2006)theusedCLMsimulation showsatemperaturechangewhichliesclosetotheensemblesmedian.thespatialpatternofthe temperaturechangefor relativeto derivedfromtheclmsimulationisshown infigure4.thespatialresolutionoftheclmgridis18x18km.
.")

27 PermaNET Permafrostresponsetoclimatechange Fig.4 Changeofseasonalmeantemperature(left:winterseason,right:summerseason)forthe GreaterAlpineRegionfor relativeto (fromSchöneretal.,2011,sourceforCLM data:hollwegetal.,2008). Thespatialdistributionsofthenumberoffrostdays,thenumberoficedaysandthenumberof freezethawdaysfortheclimatereferenceperiod196190fortheregionoftheeuropeanalpswith elevationshigher1800ma.s.l.areshowninfigures5,6and7.thehighestnumberoffreezethaw dayswerecomputedforlowestelevationscloseto1800ma.s.l.withhigherelevationsthenumber offreezethawdaysdecreasesfromabout100daysat1800ma.s.l.tolessthan15daysathighest elevationsofthealps.changesinthenumberoffrostdays,thenumberoficedaysandthenumber offreezethawdaysaredisplayedinfigures8,9and10fortheperiod relativeto basedonthetemperaturechangefromtheclmsimulations.temperatureincreasewillgenerally increasethenumberoffreezethawdaysbynumbersupto4daysperyear,thusincreasingalsothe frostweathering. Acknowledgements. ThedigitalelevationmodelwascontributedbyMETIandNASAtotheGlobal EarthObservationSytemofSystems(GEOSS)andwasdownloadedfromtheEarthRemoteSensing DataAnalysisCenter(ERDSAC)ofJapanandNASA`sLandProcessDistributedActiveArchiveCenter (LPDAAC) model were provided by Deutsches Klimarechenzentrum within the frame of the project AnpassungsstrategienandenKlimawandelfürÖsterreichsWasserwirtschaft. 24
intheAlpsforthesubregionwithelevationsabove1800ma.s.l. 25")
28 PermaNET ClimateChangeintheEuropeanAlps Fig.5 Frostdays(196190)intheAlpsforthesubregionwithelevationabove1800ma.s.l. Fig.6 Icedays(196190)intheAlpsforthesubregionwithelevationabove1800ma.s.l. Fig.7 Freezethawdays(196190)intheAlpsforthesubregionwithelevationsabove1800ma.s.l. 25

29 PermaNET Permafrostresponsetoclimatechange Fig.8 Estimateddifferenceinfrostdaysbetween196190and forthesubregionwith elevationsabove1800ma.s.l. Fig.9 Estimateddifferenceinicedaysbetween196190and forthesubregionwith elevationsabove1800ma.s.l. Fig.10 Estimateddifferenceinfreezethawdaysbetween196190and forthesubregion withelevationsabove1800ma.s.l. 26
30 PermaNET ClimateChangeintheEuropeanAlps References: ASTER GDEM Validation Team, 2009: METI/ERSDAC, NASA/LPDAAC, USGS/EROS, (2009): ASTER GlobalDEMValidationSummaryReport,June2009 Auer I. & Böhm R., 2003: Jahresmittel der Lufttemperatur. Hydrologischer Atlas Österreichs. ÖsterreichischerKunstundKulturverlag,Vienna,MapSheet1.6. AuerI.,MatullaC.,BöhmR.,UngersböckM.,MaugeriM.,NanniR.,PastorelliR.,2005:Sensitivityof frostoccurrencetotemperaturevariabilityintheeuropeanalps.int.journalofclimatology, 25, AuerI.,BöhmR.,JurkovicA.,LipaW.,OrlikA.,PotzmannR.,SchönerW.,UngersböckM.,MatullaCh., BriffaK.,JonesP.,EfthymiadisD.,BrunettiM.,NanniT.,MaugeriM.,MercalliL.,MestreO., MoisselinJ.M.,BegertM.,MüllerWestermeierG.,KvetonV.,BochnicekO.,StastnyP.,Lapin M.,SzalaiS.,SzentimreyT.,CegnarT.,DolinarM.,GajicCapkaM.,ZaninovicK.,MajstorovicZ. &NieplovaE.2007:HISTALP Historicalinstrumentalclimatologicalsurfacetimeseriesof thegreateralpineregion internationaljournalofclimatology,27,1746. BrunettiM.,LentiniG.,MaugeriM.,NanniR.,AuerI.,BöhmR.,SchönerW.,2009:Climatevariability andchangeinthegreateralpineregionoverthelasttwocenturiesbasedonmultivariable analysis.int.journalofclimatology,vol.29,issue15, doi: /joc.1857 EEAReportNo.8,2009:Regionalclimatechangeandadaptation.TheAlpsfacingthechallengeof changingwaterresources.europeanenvironmentagency,copenhagen,143pp. FreiC.,SchöllR.,FukutomeS.,SchmidliJ.,VidaleP.L.,2006:Futurechangeofprecipitationextremes ineurope:intercomparisonofscenariosfromregionalclimatemodels.journalofgeophysical Research,111:D06105 HarrisC.,ArensonL.U.,ChristiansenH.H.,EtzelmüllerB.,FrauenfelderR.,GruberS.,HaeberliW., Hauck C., Hölzle M., Humlum O., Isaksen K., Kääb A., KernLütschg A.M., Lehning M., MatsoukaN.,MuronJ.B.,MötzliJ.,PhilipsM.,RossN.,SeppäläM.,SpringmanS.M.,Vonder Mühll D., 2009: Permafrost and climate in Europe: Monitoring and modelling thermal, geomorphologicalandgeotechnicalresponses.earthsciencereviews,92, HieblJ.,AuerI.,BöhmR.,SchönerW.,MaugeriM.,LentiniG.,SpinoniJ.,BrunettiM.,NanniT.,Tadi PerecM.,BihariZ.,DolinarM.,MüllerWestermeierG.,2009:Ahighresolution monthlytemperatureclimatologyforthegreateralpineregion.meteorologischezeitschrift, 18, HollwegH.D.,BöhmU.,FastI.,HennemuthB.,KeulerK.,KeupThielE.,LautenschlagerM.,Legutke S., Radtke K., Rockel B., Schubert M., Will A., Woldt M., Wunram C., 2008: Ensemble simulationsovereuropewiththeregionalclimatemodelclmforcedwithipccar4global Scenarios.M&DTechnicalReport,3,2008. IPCC,2007:ClimateChange2007:ThePhysicalScienceBasis.ContributionfromtheWorkingGroupI to the Fourth Assessment Report of the Intergovernmental Panel on Climate Change. CambridgeUniversityPress:Cambridge,UnitedKingdomandNewYork,NY,USA,996pp. RöcknerE.,BäumlG.,BonaventuraL.,BrokopfR.,EschM.,GiorgettaM.,HagemannS.,KirchnerI., KornbluehL.,ManziniE.,RhodinA.,SchleseU.,SchulzweidaU.,TompkinsA.,2003:The atmosphericgeneralcirculationmodelecham5,parti:modeldescription.maxplanck InstitutfürMeteorologie,Report349. SchönerW.,BöhmR.,HaslingerK.,2011:KlimaänderunginÖsterreich hydrologischrelevante Klimaelemente.Österr.WasserundAbfallwirtschaft12/2011,
31 Citationreference 3. CasestudiesintheEuropeanAlps 3.1 Overviewoncasestudies KellererPirklbauerA,LiebG.K.(2011).Chapter3.1:CasestudiesintheEuropeanAlps Overviewon casestudies.inkellererpirklbauera.etal.(eds):thermalandgeomorphicpermafrostresponseto presentandfutureclimatechangeintheeuropeanalps.permanetproject,finalreportofaction5.3. OnlinepublicationISBN ,p Authors Coordination:AndreasKellererPirklbauer Involvedprojectpartnersandcontributors: InstituteofGeographyandRegionalScience,UniversityofGraz,Austria(IGRS) Andreas KellererPirklbauer,GerhardKarlLieb Content Summary 1. Theregionaldistributionofthecasestudies 2. Projectpartnersandresearchactivities 3. Structureofthecasestudies References 28
32 PermafrostResponsetoClimateChange Summary Thecasestudiesprovideinformationrelevantofthereactionsofpermafrosttoclimatechange fromstudysiteswhicharedistributedbetween47 22 and44 59 Nandbetween06 10 and E,respectively,coveringagreatpartoftheAlpineArc.Fromaspatialpointofview,the resultsthuscanbeconsideredsufficientlyrepresentativefortheentirealps.themethodology usedcoversabroadspectrumoftechniquesmakingtheresultswellreliable. Alltheactivitieswerecarriedoutbyscientificinstitutionswhicharewellprovidedwithbestlocal fieldexperienceandinmanycaseswithregionalactornetworks.allthecasestudieshavea similarconceptualstructurebeginningwithashortpresentationofthesite,thengivingconcise informationonthemethodsusedandtheresultselaborated. Eachcasestudyfinallyprovidessomeassumptionsonthefuturedevelopmentofpermafrostin therespectiveareatakingintoaccounttheclimatescenariopresentedinchapter2. 29

 being the northernmost and easternmost and")
.")
33 PermaNET Permafrostresponsetoclimatechange 1. Theregionaldistributionofthecasestudies Theassessmentofthermalanddynamicreactionscenariosofdifferentpermafrostsitesiscarriedout at13siteswithintheeuropeanalps.figures1and2depictthelocationofthestudysiteswithinthe AlpineArcaswellasvisualimpressionsofthestudysites.Table1givesanoverviewforeachofthese studysites.thestudysitesaredistributedbetween47 22 and44 59 Nandbetween6 10 and E, respectively, with Hochreichart (A) being the northernmost and easternmost and Bellecombes(F)thewesternmostandsouthernmostsite.Thusthesitescoveragreatpartofthe AlpineArcwiththeexceptionoftheSwissAlps(whicharemissingduethecompositionoftheproject staff).thesitesalsocoverthemostimportantgeologicalunitsofthealps(e.g.metamorphicrocksof thecentralzoneoftheeasternalpsandlimestonesofthesouthernalpsaswellasgranitesofthe CentralMassivesoftheWesternAlps).Thus,intermsofthegeographicaldistribution,theresultscan beconsideredsufficientlyrepresentativefortheentirealps. Fig.1 Locationofthe13PermaNETstudysitesrelevantfortheassessmentofthermalanddynamic reactionscenariosofdifferentpermafrostsitesintheeuropeanalps. 2. Projectpartnersandresearchactivities Table1givesanoverviewonthestudysitescontainingforeachoneitsname,country,location, elevation,studiedlandformandprocesses,researchinitiation,typeofpermafrostmonitoringsite andtheinstitutionwhichhasresponsiblycoordinatedthedocumentationoftherespectivecase study.allpersonsinvolvedinelaboratingthecasestudiesarekindlyacknowledgedandlistedin Table2.Informationontherelevanceofthecharacterofthedifferentpermafrostmonitoringsitesas wellaslandformsandprocessesisgiveninchapter4. 30


34 PermafrostResponsetoClimateChange Fig.2 Visualimpressionsof9ofthe13PermaNETstudysitesrelevantfortheassessmentofthermal anddynamicreactionscenarios.thenumbersinbracketsrefertothenumbersinfig.1.thestudy sitesrangefromjustbelow2000ma.s.l.(studysitehochreichart)toabout4000ma.s.l.(studysites intheaiguilledumidì).allphotographsprovidedbytheauthors. 31
35 PermaNET Permafrostresponsetoclimatechange Table1 Overviewofthestudysitesinvestigatedinordertoassessthethermalanddynamicreactionof permafrosttoclimatechangeinthealpswithinaction5.3oftheprojectpermanet.thedifferenttypesof permafrost monitoring sites are: PFbedrock=Permafrost in bedrock (from nearvertical rockwalls to flat morphologies);pffine=permafrostinfinegrainedmaterial(flatmorphology);pfcoarse=permafrostincoarse grainedandblockymaterial(screeslopes,rockglaciers;fromslopestoratherflatmorphologies).project partnersandcollaborators:arpavda=regionalagencyfortheenvironmentalprotectionofvalled'aosta, Aosta,Italy;ARPAV=EnvironmentProtectionRegionalAgencyofVeneto;UIBK=InstituteofGeology,University ofinnsbruck,innsbruck,austria;igrs=instituteofgeographyandregionalscience,universityofgraz,graz, Austria;ZAMG=CentralInstituteforMeteorologyandGeodynamics,Vienna,andRegionalOfficeforSalzburg andupperaustria,salzburg,austria;igapacte=institutdegéographiealpine,universityofgrenoble,france; EDYTEM=EDYTEMLab,UniversitédeSavoie;UniPavia=EarthScienceDepartment,UniversityofPavia,Pavia, Italy;Abenis=AbenisAlpinexpertGmbh/srl,Bozen/Bolzano,Italy. Nameofstudysite (codeseefig.1) Con. Latitude Longitude Elevation range/ max. (ma.s.l.) Hochreichart(1) A N E DösenValley(2) A N E HoherSonnblick(3) A N E 3105 Main studied landform or process rock glacier, rock wall, detritus rock glacier, rockwall bedrock, detritus Re search initia tion Permafrost monitoring site PFbedrock PFcoarse PFbedrock PFfine PFcoarse PFbedrock PFcoarse Coordinator sinstitution IGRS IGRS ZAMG OuterHocheben Cirque(4) A rockglacier 1938 PFcoarse UIBK Combe du Laurichard(5) F N E rockglacier 1979 PFcoarse IGAPACTE Bellecombes(6) F N E rockglacier 2007 PFcoarse IGAPACTE Aiguille du Midì* nearvertical (MontBlancMassif) F N E 3840 rockwalls (7) 2005 PFbedrock EDYTEM MontBlancMassif nearvertical F N E (othersitesas*)(8) rockwalls 2006 PFbedrock EDYTEM Cime Bianche Pass bedrock, PFbedrock I N E (9) detritus PFcoarse ARPAVdA ValdiGenova(10) I N E rockglacier 2001 PFcoarse UniPavia Vald Amola(11) I N E rockglacier 2001 PFcoarse UniPavia PizBoè(12) I N E rockglacier 2005 PFcoarse PFbedrock ARPAV UpperSuldenValley (13) I N E detritus 1992 PFcoarse PFfine Abenis Alpinexpert 32
36 PermafrostResponsetoClimateChange Table2 PersonsinvolvedinelaboratingthecasestudiesofAction5.3andtheiraffiliations. Name Institution Casestudy (Chapter) Baroni,Carlo UniversityofPisa(Italy) 3.11.,3.12. Bodin,Xavier UniversityJosephFourier,Grenoble(France) 3.6. Cagnati,Anselmo RegionalAgencyfortheEnvironmentalProtectionofVeneto(Italy) Carollo,Federico E.P.C.EuropeanProjectConsultingS.r.l.(Italy) Coviello,Velio NationalCenterforScientificResearchEDYTEM,Grenoble(France) 3.8. Cremonese, RegionalAgencyfortheEnvironmentalProtectionoftheAostaValley(Italy) 3.8.,3.10. Edoardo Crepaz,Andrea RegionalAgencyfortheEnvironmentalProtectionofVeneto(Italy) Dall Amico,Matteo Mountaineeringsrl(Italy) 3.11.,3.12. Defendi,Valentina RegioneVeneto,DirezioneGeologiaeGeorisorse,ServizioGeologico(Italy) Deline,Philip NationalCenterforScientificResearchEDYTEM,Grenoble(France) editor, 3.8., 3.9. Drenkelfluss,Anja UniversityofBonn(Germany) 3.8. Galuppo,Anna RegioneVeneto,DirezioneGeologiaeGeorisorse,ServizioGeologico(Italy) Gruber,Stephan UniversityofZurich(Switzerland) 3.8. KellererPirklbauer, Andreas UniversityofGraz(Austria) editor,3.2,3.3 Kemna,Andreas UniversityofBonn(Germany) 3.8. Klee,Alexander CentralInstituteforMeteorologyandGeodynamics(Austria) 3.4. Krainer,Karl UniversityofInnsbruck(Austria) 3.5. Krautblatter, UniversityofBonn(Germany) 3.8. Michael Krysiecki,Jean UniversityJosephFourier,Grenoble(France) 3.6. Michel LeRoux,Olivier Associationpourledéveloppementdelarecherchesurlesglissementsde terrain(france) 3.7. Lieb,GerhardKarl UniversityofGraz(Austria) editor,3.2,3.3 Lorier,Lionel Associationpourledéveloppementdelarecherchesurlesglissementsde 3.7. terrain(france) Magnabosco,Laura RegioneVeneto,DirezioneGeologiaeGeorisorse,ServizioGeologico(Italy) Magnin,Florence NationalCenterforScientificResearchEDYTEM,Grenoble(France) 3.8. Mair,Volkmar AutomousProvinceofBolzano(Italy) Malet,Emmanuel NationalCenterforScientificResearchEDYTEM,Grenoble(France) 3.8. Marinoni, Freelancer(Italy) Francesco MorradiCella, RegionalAgencyfortheEnvironmentalProtectionoftheAostaValley(Italy) 3.8.,3.10. Umberto Noetzli,Jeanette UniversityofZurich(Switzerland) 3.8. Pogliotti,Paolo RegionalAgencyfortheEnvironmentalProtectionoftheAostaValley(Italy) editor, 3.8., Ravanel,Ludovic NationalCenterforScientificResearchEDYTEM,Grenoble(France) 3.8.,3.9. Riedl,Claudia CentralInstituteforMeteorologyandGeodynamics(Austria) 3.4. Rigon,Riccardo UniversityofTrento(Italy) 3.11.,3.12. Schöner,Wolfgang CentralInstituteforMeteorologyandGeodynamics(Austria) editor, 3.6., 3.7. Seppi,Roberto UniversityofPavia(Italy) Vallon,Michel UniversityJosephFourier,Grenoble(France) 3.7. Zampedri,Giorgio GeologicalSurvey,AutonomousProvinceofTrento(Italy) 3.11.,3.12. Zischg,Andreas AbenisAlpinexpertGmbH/srl(Italy) Zumiani,Matteo Geologist(Italy) 3.11.,
37 PermaNET Permafrostresponsetoclimatechange 3. Structureofthecasestudies Inordertofacilitatethecomparisonbetweenthedifferentcasestudiesallofthemusemoreorless thesamestructureasfollows: Summary Shortintroductionintothecasestudysiteandtherelevantlandform(inmostcaseswith detailedmapsandphotographs) Methodology(inmostcasesasetofdifferentmethodshasbeenused,seediscussionin Chapter4) Recentthermaland/orgeomorphicevolutionoftherelevantlandform(s)(inmostcaseswith graphs,forthecoveredtimespansseediscussioninchapter4) Assumptionsonpossiblefuturethermal/geomorphicresponseofthislandformtopredicted climatechange(takingintoaccounttheclimatescenariopresentedinchapter2) Referencelist. 34
38 Citationreference 3. CasestudiesintheEuropeanAlps 3.2 Hochreichart,EasternAustrianAlps KellererPirklbauerA(2011).Chapter3.2:CasestudiesintheEuropeanAlps Hochreichart,Eastern AustrianAlps.InKellererPirklbauerA.etal.(eds):Thermalandgeomorphicpermafrostresponseto presentandfutureclimatechangeintheeuropeanalps.permanetproject,finalreportofaction5.3. OnlinepublicationISBN ,p Authors Coordination:AndreasKellererPirklbauer Involvedprojectpartnersandcontributors: InstituteofGeographyandRegionalScience,UniversityofGraz,Austria(IGRS) Andreas KellererPirklbauer Content Summary 1. Introductionandstudyarea 2. Permafrostindicatorsandrecentthermalevolution 3. Possiblefuturethermalresponsetopredictedclimatechange References 35
39 PermaNET CasestudiesintheEuropeanAlps Summary Knowledge regarding marginal permafrost zones in the European Alps is fairly limited. A permafrost research project in the Seckauer Tauern, focusing particularly on the Mt. HochreichartReichart Cirque area (47 22 N, E), Austria, was initiated in 2004 by the author.since2006,theresearchactivitieswerecarriedoutwithintheprojectsalpchangeand PermaNET. Based on geomorphic mapping, numerical permafrost modelling, multiannual measurementsofthebottomtemperatureofthesnowcover(bts),continuousmeasurementsof groundsurface,neargroundsurfaceandairtemperaturesbyminiaturetemperaturedataloggers (MTD),geoelectricsandopticalsnowcovermonitoringbyaremotedigitalcamera(RDC)the existenceofpermafrostwasproven.patchesofpermafrostarestronglyrelatedtoelevation, aspect,grainsizeofthesediments,andcharacteristicsofwintersnowcover.therefore,thestudy siteisthemosteasterlyevidenceofexistingpermafrostfoundintheentireeuropeanalpsat Einelevationsaslowas1900masl.Predictingclimatewarmingwillsubstantiallyinfluence thepermafrostdistributionandgeomorphicdynamicsinthestudyareahochreichartreichart Cirque.By2050,permafrostwillbealmostcompletelythawedapartfromfewhighelevatedsites wherethesubstratematerial(coarseblockymaterial)andtopoclimaticconditions(radiation, snowcover)stillallowsmallpatchesofpermafrost. 36
40 PermafrostResponsetoClimateChange 1. Introductionandstudyarea MountainpermafrostisawidespreadphenomenoninalpineregionsintheEuropeanAlps.For instance,some2000km²or4%oftheaustrianalpsareunderlainbypermafrost(lieb1998).upto recenttimesmostresearchonpermafrostissuesinaustriafocusedonthecentralandhighest sectionoftheaustrianalps.bycontrast,knowledgeconcerningmarginalpermafrostzonesisfairly limitedsofar. ToincreaseknowledgeabouttheeasternmostlimitofpermafrostintheEuropeanAlps,aresearch projectfocusingontheseckauertauernmountains(14 30 Eto15 00 E)andparticularlyontheMt. Hochreichartarea(47 22 N,14 41 E)wasinitiatedin2004bytheauthor(Fig.1).Firstpermafrost resultswerepublishedinkellererpirklbauer(2005).theresearchactivitieswerecontinuedbetween 2006and2010withintheprojectALPCHANGEandsince2008withinPermaNET. Fig.1 LocationofthestudyregionSeckauerTauernMountainsandthestudyareaMt.Hochreichart TheSeckauerTauernMountainsaretheeasternmostmountainsoftheTauernRangewhichcovers almost9,500km²inaustriaanditaly.theseckauertauerhaveaspatialextentof626km²andits highestpeakismt.geierhauptreaching2417masl(kellererpirklbauer2008).researchinthe SeckauerTauernMountainsfocusesspatiallyonthesummitareaofMt.Hochreichart(2416masl) andthenortheastfacingreichartcirque. Thestudyareacoversabout1km²intotal,ranginginelevationfromabout1800to2416masl. Bedrockispredominantlyquartziteandgneiss.TheReichartCirqueiscoveredbyalargerelict polymorphicrockglacierwithaverticalextentofc.450mrangingfromabout1500maslto1950m aslattheuppermostpartoftherootingzone(fig.2a). Thehigherelevationsofthestudyareawereexposedtointensiveperiglacialweatheringduringthe coldperiodsinthepleistocenecausingtheformationofcoarsegrainedautochthonousblockfields (mountaintopdetritus)andrectilinearslopeswithsolifluctionlandforms,partlywithmaterialsorting byfrostaction(fig2b).accordingtoownairtemperaturemeasurementsbetweensept.2008and August2009,themeanannualairtemperature(MAAT)atthesummitat2416masl(AT1)is1.4 C,in thecirqueat1920masl(at2)isabout+2.2 C,revealingameanlapserateof C/m. 37
 and Reichart Cirque with the uppermost part of a polymorphicquasirelict(i.e.containssmallpatchesofpermafrost)rockglacier.")
aremeasuredandtheprofilewheregeoelectricalmeasurementswere")
summitofhochreichartwithcoarse")
22.09.2007and(b)22.08.2007. Fig.")
41 PermaNET CasestudiesintheEuropeanAlps Fig. 2 (A) Mt. Hochreichart (2416 m asl) and Reichart Cirque with the uppermost part of a polymorphicquasirelict(i.e.containssmallpatchesofpermafrost)rockglacier.locationsofthe miniaturetemperaturedataloggers/mtdwheregroundsurfacetemperature(gst,blackdots)andair temperature(at,greydots)aremeasuredandtheprofilewheregeoelectricalmeasurementswere carriedoutin2008(blueandwhiteline)areindicated.(b)summitofhochreichartwithcoarse grainedautochthonousblockfieldswithmaterialsortingbyfrostaction(notethevegetationpatchin frontoftheperson).photographsbya.kellererpirklbauer(a) and(b) Fig.3 ThestudyareaHochreichartReichartCirque:Thedistributionofthemodelledpotential discontinuouspermafrost,areasofrockglacierdepositis,locationofair(at)andgroundsurface temperature(gst)measurementsites,andthelocationofthegeoelectricprofileareindicated. 38
42 PermafrostResponsetoClimateChange 2. Permafrostindicatorsandrecentthermalevolution 2.1Methods Since2004asuiteofmethodshasbeenappliedsuchasgeomorphicmapping,numericalpermafrost modelling, multiannual measurements of the bottom temperature of the snow cover (BTS), continuousmeasurementsofgroundsurface,neargroundsurfaceandairtemperaturesbyminiature temperaturedataloggers(mtd),geoelectricsandopticalsnowcovermonitoringbyaremotedigital camera(rdc). Thespatialdistributionofpotentialdiscontinuouspermafrostinthestudyareawasmodelledbyan adaptationoftheprogrampermakart(keller1992),usinggisarcviewandarcinfo.detailsand resultsofthismodellingapproachwerepublishedinkellererpirklbauer(2005). MTDswereusedatninelocationsduringdifferentperiods.Theresultsfromthreesites(Fig.1)with groundsurfacetemperature(gst)measurementsloggedat1hintervalarepresentedhere.theused loggersareproducedbygeoprecision,modelmlog1withpt1000temperaturesensors(accuracy +/0.05 C,range 40to+100 C,calibrationdrift<0.01 C/yr).Dataofcontinuousmeasurementsof groundsurfacetemperatureatthethreesitesgst1togst3wereavailableforthe47monthperiod to At site GST3 malfunction of the logger caused a data gap between and Inordertoallowcomparisonbetweenthesitesaswellasallowingfull yeardataanalysis,thethreefullyearperiods , and ,wereanalysed.AtGST3,onlythesecondandthirdyearwasconsidered.The dataanalysisfocusedonfrostday(fd),iceday(id),freezethawday(ftd)andfrostfreeday(ffd).a daygotclassifiedasfd,whenthedailyminimumtemperatureisbelowzero.ifalsothedaily maximum temperature is among the freezing point, the day got classified as ice day ID. The differencebetweenicedaysandfrostdays,whichmeansalldayswithadailyminimumtemperature below0 Candadailymaximumabovethislimit,gotclassifiedasFTD.Finally,adaywithpositive minimumtemperaturegotclassifiedasffd. BTSwasmeasuredatReichartCirqueannuallybetweenwinter2004and2009usingathermocouple probept100(1/3dinclassb)fixedtothebottomofa3mlongsteelrod(systemkroneis,vienna). BTSisknowntobeagoodindicatoroftheoccurrenceorabsenceofpermafrost.ThemeasuredBTS valuesindicate:bts>2 C:permafrostunlikely;BTS2to3 C:permafrostpossible;BTS<3 C: permafrostprobable(haeberli1973).however,theinterpretationofmeasuredbtsvaluesshouldbe madeverycarefullyandinterannualvariationatagivensitemightvarysubstantialfromoneyearto thenext. Inordertoverifythetemperaturedataandtoextendthespatialknowledgeaboutpermafrost distributionbeyondpointinformation,ageoelectricalsurveywascarriedoutattheendofaugust 2008byapplyingtheelectricalresistivitytomography(ERT)methodalonga120mlongprofile coveringtheupperpartoftherootingzoneofa(moreorless)relictrockglacierandthetalusslope above.forthissurveythetwodimensional(2d)electricalsurveyswasperformedusingthewenner Alfaconfigurationwith2.5mspacingandanLGMLippmann4Punktlighthpresistivitymeter.The ERTmeasurementswerecarriedoutbyB.Kühnast(KNGeoelektrik)jointlywithE.Niesner(University ofleoben)(kellererpirklbauer&kühnast2009). Finally,aRDCsystemwassetupatanearbymountain(Feistererhorn2081masl.)tomonitorthe snowcoverdynamicsinthecirqueandsummitareofmt.hochreichart.thecorepartsoftherdc systemareastandardhandhelddigitalcamera(nikoncoolpix),aremotecontrol,awaterproof casingwithatransparentopening,a12v/25ahbatteryandsolarpanelswithachargecontroller. 2.2Resultsoncurrentpermafrostdistribution 39
43 PermaNET CasestudiesintheEuropeanAlps Permafrostmodelling Permafrostdistributionaccordingtothisthechosenmodellingapproachrevealedthatpermafrostis verylikelyatnorthfacingaspectsathighestelevations,butnotoccurringataltitudesbelow2270m asl.accordingtothismodelresult,theentirereichartcirqueispermafrostfree(fig.3). Thermalregimebasedonminiaturetemperaturedatalogger ResultsofthecontinuousmeasurementsofgroundsurfacetemperatureatthethreesitesGST1to GST3areshowninFig.4.Themeanvaluesforthethreeyearperiodatthehighestsite(GST1,FD 235)forFDis15dayshighercomparedtothesite116mlowerinelevation(GST2,FD220).ForID, thedifferenceismoresubstantialwith19days,whereasthenumberofftdisslightlyhigheratthe lowerofthetwosites.thelowestofthethreesites(gst3)experiencessubstantiallylessfdbutonly slightlylessftdcomparedtogst2.regardinginterannualvariations,thenumberoffdatallthree sitesisrelativelystable,whereasthenumberofidaswellasofftdvariesabitmore. Fig.4 ThermalregimeatthethreesitesGST1toGST3betweenNov.2006andOctober2009.Numberoffrost days(includingicedays),icedays,freezethawdaysandfrostfree.resultsofsingleyearsandthemeanforthe entireperiodareshown. Fig.5showsthemeanannualgroundsurfacetemperature(MAGST)aswellastheelevationofthe computedzerodegreeisothermbasedonalapserateof C/m.Thisgraphclearlydepictsthat themagstvaluesatsitegst1andgst2areallnegativeindicatingpermafrost,whereasatthelow elevationsitegst3thetemperatureatthegroundsurfaceisataround+2 C.However,GST3is locatedoncoarsegrainedblockymaterialintherootingzoneofarockglacier.duetothethermal behaviourofsoilmaterial(inparticularcoarsegrainedblockymaterialwithopenvoidsinbetween), thetemperatureatthegroundsurface(i.e.magst)iswarmercomparedtothetemperatureatthe topofpermafrost(ttop),possiblyuptoseveraldegrees( thermaloffset ;SmithandRiseborough 2002).Therefore,despitethefactthatpositiveMAGSTaremeasuredatthesurface,permafrost mightstillexistintheground. The diagram showing the computedzero degree isotherm for the three sites indicates that in general,thelowestcomputedzerodegreeisothermwascalculatedforsitegst3,whereasthe highestcomputedzerodegreeisothermwascalculatedforthehighestsitegst1.explanationforthis isthedifferentbufferingeffectofthewintersnowcover.atsitegst1,snowcoverisofsubstantially lessimportance(summitsite,smalllocaldepression)comparedtositegst3(footslopeposition, rootingzoneofrockglacierwithmoreefficientsnowaccumulationandlonglyingsnowcover).this clearlyhighlightstheimportanceofsnowinfluencingthethermalregimeoftheground(cf. nival offset ;SmithandRiseborough2002) 40
44 PermafrostResponsetoClimateChange Fig.5 Meanannualgroundsurfacetemperature(MAGST)andcomputedzerodegreeisotherm(usingalapse rateof C/m)atthethreesites.Resultsofsingleyearsandtheentireperiodareshown. Figure6showstheresultsoftwoBTScampaignsintheReichartcirque.Themapsshowthatthe generalpatternisthesame,butbtsvaluesin2008werecooler.in2008moremeasurement locations were within the possible (2 to 3 C) and probable (< 3 C) permafrost classes. BTS measurementsindicatethatpatchypermafrostprobablyexistsinthecirqueattwodifferenttypesof topographicalpositions:(i)anorthtonortheastfacingfootslope,and(ii)atthefootofasteepnorth tonorthwestfacingrockfaceatelevationsaslowas1850masl.accordingtothismethod,the uppermostpartoftherockglacierincludingtherootzonearepresumablyunderlainbypatchesof permafrost. Fig.6 BTSmeasurementsinlatewinter2007and2008intheReichartCirque.Themeasurementsin2008 indicatesubstantialcoolergroundtemperatures.notethepronouncedmorphologyoftherelictrockglacier (Orthophotographkindlyprovidedby GISSteiermark). Geoelectricalmeasurements TheERTresults(Fig.7)indicateanactivelayerof2to4munderlainbyapermafrostbodyalong3/4 oftheentireprofilewithresistivityvaluesbetween50to100kohm.mandextendingtoadepthof 10to15m.Thepermafrostbodyissubstantiallythickeratthelowerpartoftheprofile(rockglacier; first50mofprofile)comparedtomostoftheupperpart(talusslope).focusingonthetalusslope, thepermafrostbodyisthickestonthecentralsectionoftheprofile(~56mthickness).incontrast,at 41
45 PermaNET CasestudiesintheEuropeanAlps thelowerpartofthetalusslopethepermafrostbodyismostlikelyverythin(lessthan1m)whereas attheuppermostpartpermafrostisabsent. Fig.7 Electricalresistivitytomography(ERT)ofthe120mlongprofilemeasuredintheReichartCirque(see Fig.2forlocation).MeasurementscarriedoutbyKNGeoelektrik 2.3Summaryofcurrentpermafrostdistribution Based on the permafrost research carried out so far, one can conclude that the existence of permafrostisproveninthestudyareamt.hochreichart.themountainpermafrostoccursaspatches inthelowerpartsasforinstanceintherootingzoneoftheofapseudorelictrockglacierwherethe substrat consists of coarsegrained sediments. This cooling effect of coarse blocks has been recognised since decades (cf. Gruber & Hoelzle 2008).In higher elevations, permafrost is more widespreadaffectingtheentiresummitarea.magstnear0 Catelevationshigherca.2300masl indicatethatpermafrostisthinandingeneralwarm.theredistributionofsnowandcharacteristics ofthewintersnowcoveraswellasthetypeofsubstrat(bedrock,finematerial,coarsegrained blockymaterial)arethedominantlocalfactorforpresenceorabsenceofpermafrost. Fig.8depictsthesnowcoversituationinthestudyareaMt.HochreichartinNovember2006,2007, 2008and2009basedontheownRDCsystem.Thesefourimagesexemplarilyshowthatsnowcover variessubstantiallyfromyeartoyearduringsimilarperiods.earlysnowfallinautumnproducinga protectingsnowcoverinhibitsgroundcooling.incontrast,longlyingsnow(e.g.footslopepositionin cirque)inhibitsgroundwarminginspring.regardingsubstrat,siteswithratherthicklayers(several meters)ofcoarsegrainedblockymaterialintheuppermostpartofthereichartcirque(talusand rootingzoneoftherockglacier)aremorelikelyunderlainbypermafrostasshownbytheert measurements.summarising,thissiteisthemosteasterlyevidenceofexistingpermafrostfoundin theentireeuropeanalpsat14 41 Eatelevationsaslowas1900masl. 42

byusingtherelativelyoptimisticclma1b scenarioindicatesatemperatureincreaseofaround2 Cby2050(seeChapter2.")
46 PermafrostResponsetoClimateChange Fig.8 SnowcoverdistributioninthecirqueandinthesummitareaofMt.HochreichartinNovember2006, 2007,2008and2009.cf.Fig Possiblefuturethermalresponsetopredictedclimatechange Aspresentedabove,permafrostinthestudyareaHochreichartReichartCirqueisrestrictedtothe highestelevationsandtolocations,wherethesnowcoverregimeand/orthecharacteristicsofthe substrat material is favourable for permafrost existence. Climate change with the predicted temperatureincreaseforthegreateralpineregion(gar)byusingtherelativelyoptimisticclma1b scenarioindicatesatemperatureincreaseofaround2 Cby2050(seeChapter2.) Theestimatesforfrostday(FD),iceday(ID)and(FTD)fortheperiods and basedonairtemperaturedatarevealforthestudyareahochreichartreichartcirquethefollowing results:thenumberoffdwilldecreaseby13to14daysperyear.forthesummitarea,thiswould mean207227fdinsteadof221240fdhenceareductionoffdbyupto6.3%.thenumberofidwill decreasealsobysome13to14daysperyear,whichmeans127147idinsteadof in relativenumber,thisisalmost10%.incontrast,thenumberofftdwillpresumablyremainmoreor lessatthesamelevelwithasmallincreaseby0.1to2daysperyear. ThepredictedwarmingbasedontheCLMA1BscenariocausingthemodelledchangesinFD,IDand FTDwillseverelyinfluencethepermafrostdistributionandgeomorphicdynamicsinthestudyarea HochreichartReichartCirque.By2050,permafrostinthestudyareawillberestrictedtofewhigh elevatedlocationsinthesummitareawherethesubstratandthesnowcoverconditionswillstill allowtheexistenceofpermafrost.incontrast,permafrostinthecirquewillbecompletelythawed despitethefactoflargeareasofcoarsegrainedsediments. 43
47 PermaNET CasestudiesintheEuropeanAlps Acknowledgements. This study was partly carried out within the framework of the projects ALPCHANGE,financedbytheAustrianScienceFund(FWF)throughprojectno.FWFP18304N10,and PermaNET.ThePermaNETprojectispartoftheEuropeanTerritorialCooperationandcofundedby theeuropeanregionaldevelopmentfund(erdf)inthescopeofthealpinespaceprogramme References: GruberS.&HoelzleM.,2008:Thecoolingeffectofcoarseblocksrevisited:amodelingstudyofa purely conductive mechanism. Proceedings of the Ninth International Conference on Permafrost(NICOP),UniversityofAlaska,Fairbanks,June29 July3,2008, HaeberliW.,1973:DieBasisTemperaturderwinterlichenSchneedeckealsmöglicherIndikatorfür die Verbreitung von Permafrost in den Alpen. Zeitschrift für Gletscherkunde und Glazialgeologie,9, KellerF.,1992:AutomatedmappingofmountainpermafrostusingtheprogramPERMAKARTwithin thegeographicalinformationsystemarc/info.permafrostandperiglacialprocesses,3, KellererPirklbauerA.,2005:Alpinepermafrostoccurrenceatitsspatiallimits:Firstresultsfromthe easternmarginoftheeuropeanalps,austria.norskgeografisktidsskriftnorwegianjournal ofgeography,59, KellererPirklbauerA.,2008:Aspectsofglacial,paraglacialandperiglacialprocessesandlandformsof thetauernrange,austria.unpublishedphdthesis,universityofgraz,200p. KellererPirklbauerA.&KühnastB.,2009:Permafrostatitslimits:Themosteasterlyevidenceof existing permafrost in the European Alps as indicated by ground temperature and geoelectricalmeasurements.geophysicalresearchabstracts11:egu LiebG.K.,1998:HighmountainpermafrostintheAustrianAlps(Europe).Proceedingsofthe7th InternationalPermafrostConference(Yellowknife,23 27June1998),CollectionNordicana 57, Centred étudesnordiques,universitélaval,québec. SmithM.W.&RiseboroughD.W.,2002:Climateandthelimitsofpermafrost:azonalanalysis. PermafrostandPeriglacialProcesses,13,
48 Citationreference 3. CasestudiesintheEuropeanAlps 3.3 DösenValley,CentralAustrianAlps KellererPirklbauerA(2011).Chapter3.3:CasestudiesintheEuropeanAlps DösenValley,Central AustrianAlps.InKellererPirklbauerA.etal.(eds):Thermalandgeomorphicpermafrostresponseto presentandfutureclimatechangeintheeuropeanalps.permanetproject,finalreportofaction5.3. OnlinepublicationISBN ,p Authors Coordination:AndreasKellererPirklbauer Involvedprojectpartnersandcontributors: InstituteofGeographyandRegionalScience,UniversityofGraz,Austria(IGRS) Andreas KellererPirklbauer Content Summary 1. Introductionandstudyarea 2. Permafrostindicatorsandrecentthermalevolution 3. Possiblefuturethermalresponsetopredictedclimatechange References 45
49 PermaNET CasestudiesintheEuropeanAlps Summary PermafrostresearchintheDösenValley(46 59 Nand13 17 E),HoheTauernRange,Central Austriawasinitiatedinthe1990s.Sincethen,anumberofdifferentmethodshavebeenapplied tounderstandpermafrostdistributionandrockglacierdynamics.resultsshowthatatpresent permafrostexistsatpermafrostfavourablesites(northexposed,wellsheltered,coarseblocky material)atelevationsdownto2200masl.incontrast,onsouthexposedslopescoveredby coarseblockymaterialthelowerlimitisataround2600masl.localconditionssuchassubstrate material(i.e.fine/coarsesediments,thick/thinsediments,bedrock)andtopoclimaticconditions (radiation sheltered, timing and characteristics of snow cover) alter the general pattern of decreasinggroundsurfacetemperaturewithincreasingelevationsubstantiallyandmakesthe permafrostdistributionpatterninthestudyareacomplex.rockglaciervelocitiesseemtoreact quickerafteracoolperiodwithdeceleration.incontrast,rockglaciersseemtoneedmoretime toreactafterwarmerperiodswithmovementaccelerationindicatingtheinertiaoftherock glaciersystemtowardsgroundwarmingandvelocitychanges.by2050,southfacingslopesnot coveredbycoarseblockymaterialwillbepermafrostfree.onlythehighestnorthfacingslopes willstillbeinfluencedbywidespreadpermafrost.theroleofsubstratematerialandsnowcover dynamicswillbeevenmoreimportantfortheremainingpermafrostthantoday.temperature increasewilleventuallyleadtoinactivationofallpresentlyactiverockglaciersinthestudyarea. 46
50 PermafrostResponsetoClimateChange 1. Introductionandstudyarea PermafrostresearchintheHoheTauernRangeinCentralAustriawasinitiatedinthe1990s.Oneof themainstudyareasforpermafrostresearchisthedösenvalleynearmallnitz(fig.1a).sincethen, differentmethodshavebeenappliedinordertounderstandpermafrostdistributionandrockglacier dynamicsinthisvalley(table1).presentpermafrostresearchinthisstudyareaiscarriedoutwithin theframeworkoftheprojectsalpchange( ),permanet( )andpermafrost ( )byresearchersfromtheUniversityofGraz,theGrazUniversityofTechnologyaswellas theuniversityofleoben. Table1 AppliedmethodsandpublicationsatthestudyareaDösenValley Method initiated/carriedout Publications Geodeticsurveys 1995 Photogrammetricsurveys 1954 Buck&Kaufmann2008 Geophysicalcampaigns(seismics,geomagnetics Delaloyeetal andgeoradar/gpr) Kaufmann&Ladstädter2007Kaufmann Geomorphologicalmappingandobservations 1994 etal.2007 Meteorologicalmonitoring 2006 KellererPirklbauer2008 Monitoring of snow cover dynamics in the 2006 KellererPirklbaueretal.2008a,2008b rootingzonebyautomaticdigitalcameras 1995 Kenyi&Kaufmann2003 Groundtemperaturemonitoring (continuoussince2006) Kienast&Kaufmann2004 Nearsurfacegroundtemperaturemonitoring 1995 Lieb1991,1996,1998 (continuoussince2006) Schmöller&Fruhwirth1996 Relativedatingofrockglaciersurface 2007 ThestudyareaissituatedintheAnkogelMountainsattheinnerpartoftheglaciallyshaped,EW trendingdösenvalleyataboutn46 59 ande13 17.Theelevationofthestudyarearangesbetween 2270maslatthecirquethresholdneartheArthurvonSchmidHuttoslightlymorethan3000masl atthenearbysäuleckpeak.thispartofthevalleyischaracterisedbyanumberofrockglaciersand distinctterminalmorainesinrelativelyflatparts,acirquefloorwithatarnlake,slopescoveredby coarse debris and steep rock faces partly acting as debris supply areas for the rock glaciers. Geologically,thestudyareaislocatedwithinthecentralgneisscomplexoftheHochalm/Ankogel area with predominantly westdipping biotite gneiss (Lieb 1996). (Fig. 1B). The moraines were presumablyformedduringtheegesenmaximumadvanceandarethusofearlyyoungerdryas(yd) age(lieb1996).inaustria,theearlyydis10bedatedtoaround ka(Kerschner&IvyOchs 2007).Atpresent,onlysomeperennialsnowpatchesarefoundinthestudyarea. TheninerockglaciersintheDösenValleydepictedinFig.1Bpredominantlyconsistofgraniticgneiss (Kaufmannetal.2007)andwereformedafterdeglaciationintheLateglacialandHoloceneperiod. Accordingtothe RockGlacierInventoryofCentralandEasternAustria (Liebetal.2010,Kellerer Pirklbaueretal.2010),threeoftheserockglaciers(mo236,mo239.1,mo239.2)areconsideredtobe relictandsixareregardedasintactstillcontainingpermafrost(mo237,mo237.1,mo238,mo238.1, mo238.2, mo239). Previous permafrost research including velocity measurements focused particularlyontherockglaciermo238(fordetailsseelieb1996orkaufmannetal.2007).thisrock glacierischaracterisedbyanaltitudinalrangeof masl,alengthof950m,awidthof250 mandanareaof0.19km².therockglacierisanactivemonomorphictongueshapedrockglacier situatedattheendoftheinnerdoesenvalleywithpresentmeansurfacevelocityratesofaround15 25cmperyear(Fig.2). 47
51 PermaNET CasestudiesintheEuropeanAlps According to air temperature measurements by the own meteorological station located at the surfaceofrockglaciermo238(forlocationseefig.1)inthe4yearsperiodseptember2006to August2010,themeanannualairtemperature(MAAT)atthe2603maslis 1.7 C.Thecoldest monthisjanuarywithamonthlyvalueofupto11.8 CwhereasthewarmestmonthisAugustwitha monthlymeanvalueofupto7.8 C. Fig.1 StudyareaDösenValleyanditslocationwithinAustria.Thedistributionofrockglaciers,terminal morainesoflateglacialage(youngerdryas),modelledpotentialdiscontinuouspermafrost,locationofthe meteorologicalstation(ms)aswellasthelocationofsixminiaturetemperaturedatalogger(mtd)usedfor groundsurfacetemperature(gst)measurementsareindicated.codeoftherockglacierisaccordingtothe RockGlacierInventoryofCentralandEasternAustria (Liebetal.2010,KellererPirklbaueretal.2010). Fig.2 ThestudyareaDösenValleywithfourintactrockglaciers:(A)viewtowardsE,(B)viewtowardsSE. Notethewidespreadsteeprockfacesactingasdebrissupplyareas,theperennialsnowfields,theflowing structureoftherockglaciersandwidespreadvegetation(indicatorforabsenceofalpinepermafrost).locations ofthesixminiaturetemperaturedataloggers/mtdwheregroundsurfacetemperature(gst)ismeasuredand thesiteofthemeteorologicalstation(ms)areindicated.codeoftherockglacierisaccordingtothe Rock GlacierInventoryofCentralandEasternAustria (Liebetal.2010,KellererPirklbaueretal.2010).Photographs bya.kellererpirklbauer. 48
52 PermafrostResponsetoClimateChange Inthispaper,thepresentsituationandtheevolutionofthegroundsurfacetemperatureinthe recentpast( )anditssignificanceforpermafrostdistributionarehighlighted.furthermore, theresultsoftherockglaciermonitoringprogramfortheperiod1954to2010anditsrelationshipto climaticconditionsandclimatechangearediscussed. 2. Permafrostindicatorsandrecentthermalevolution 2.1Methods Since1994asuiteofmethodshasbeenappliedaslistedaboveinTable1.Inthispaper,resultsbased onnumericalpermafrostmodelling,climatemonitoringbyusingameteorologicalstationaswellas continuous measurements of ground surface temperature by using miniature temperature dataloggers(mtd)andphotogrammetricandgeodeticrockglacierdisplacementmeasurementsare presented. Thespatialdistributionofpotentialdiscontinuouspermafrostinthestudyareawasmodelledbyan adaptationoftheprogrampermakart(keller1992)usinggisarcviewandarcinfo.forthissimple modellingapproach,theempiricalvaluesofthelowerlimitofdiscontinuouspermafrostforcentral Austriawereused(Lieb1998). Themeteorologicalstationhasbeeninstalledin2006atonelargeblockonthesurfaceoftherock glaciermo238withinthealpchangeproject.atthisstation,climatedataincludingairtemperature, airhumidity,windspeed,winddirectionandglobalradiationarecontinuouslyloggedanddataare availablefortheperiod to MTDswereusedatatotalof11locationsduringdifferentperiods.Theresultsfromsixsiteswith groundsurfacetemperature(gst)measurementsloggedat1hintervalarepresentedhere(figs.1& 2).TheusedloggersareproducedbyGeoPrecision,ModelMLog1withPT1000temperaturesensors (accuracy+/0.05 C,range40to+100 C,calibrationdrift<0.01 C/yr).Ateachofthesixsites,the temperaturesensorisshelteredfromdirectsolarradiationbyaplatyrock.sitesgst1andgst2are locatedoncoarseblockyslopes.gst2islocatedbetweenalargeboulderandbedrock. Allthreesitesformaverticalprofileonsouthfacingslopes.Incontrast,sitesGST4toGST6are locatedonthesurfaceofthemainactiverockglacierinthevalley(mo238)andfromaverticalprofile onnorthfacingslopes.dataofcontinuousmeasurementsofgroundsurfacetemperatureatthe threesitesgst1gst4andgst6wereavailableforthec.48monthperiod to AtsiteGST5thetimeseriesendson Toallowcomparisonbetweenthesixsitesaswellas to allow fullyear data analysis, the four fullyear periods , , and wereanalysed.Furthermore,the zerodegree isotherm was computed for each site using a vertical temperature gradient of C/m.Table2summariseskeyparametersofthesixGSTsites. Temperaturedata(airandground)analysesfocusedonfrostday(FD),iceday(ID),freezethawday (FTD)andfrostfreeday(FFD).AdaygotclassifiedasFD,whenthedailyminimumtemperatureis belowzero.ifalsothedailymaximumtemperatureisamongthefreezingpoint,thedaygotclassified asicedayid.thedifferencebetweenicedaysandfrostdays,whichmeansalldayswithadaily minimumtemperaturebelow0 Candadailymaximumabovethislimit,gotclassifiedasFTD.Finally, adaywithpositiveminimumtemperaturegotclassifiedasffd. 49
53 PermaNET CasestudiesintheEuropeanAlps Table2 Summaryofthesiteswheregroundsurfacetemperature(GST)ismonitoredbyusingminiature temperaturedataloggers(mtd).locationofthegstsitesinindicatedinfigs.1and2.theelevationofthe computed zerodegree isotherm was computed by using a vertical temperature gradient of C/m. MAGST=meanannualgroundsurfacetemperature. GSTsite Exposition Elevation (masl) Dataperiod MAGST( C) Computed zerodegree isotherm (masl) GST1 South years: to GST2 South years: to GST3 South years: to GST4 North years: to GST5 North years: to GST6 North years: to Surfacedisplacementmeasurementsoftherockglaciermo238iscarriedoutsince1954byusing aerialphotogrammetryandsince1995byusingterrestrialgeodeticsurvey(kaufmann&ladstädter 2007,Kaufmannetal.2007).Thegeodeticmeasurementsusingatotalstationareannuallycarried out in the middle of August following a proven scheme. Since 1995, the measurements were repeatedapartfrom2003duetolackoffunding.theannualcampaignsareledbyv.kaufmann,tu Graz. In addition to the geodetic measurements satellite based radar interferometry (Kenyi & Kaufmann2003)andphotogrammetricdisplacementmeasurementsbasedonaerialphotographs (1954,1969,1975,1983,1993,1997and1998)werecarriedout(Kaufmannetal.2007,Kaufmann& Ladstädter2007)previously. Finally,aRDCsystemwassetupinSeptember2006inordertomonitorthesnowcoverdynamicsat therootingzoneoftherockglaciermo238.thecorepartsoftherdcsystemareastandardhand helddigitalcamera(nikoncoolpix),aremotecontrol,awaterproofcasingwithatransparent opening,a12v/25ahbatteryandsolarpanelswithachargecontroller. 2.2Resultsoncurrentpermafrostdistribution Permafrostmodelling Thelowerlimitofpotentialdiscontinuouspermafrostaccordingtothechosenregionalpermafrost modellingapproachindicatespermafrostonslopesbetween2500masl(northfacing)and2900m asl.(southfacing)andonfootslopepositionsbetween2410masl(northfacing)and2690m(south facing).themodellingresultsshowthatonlythelargeintactrockglaciermo238aswellasthetwo smalleronesslightlytothewest(mo238.1andmo238.1)aswellasthesouthfacingrockglacier mo237.1arepredominantlyinpermafrostareaswhichisinaccordancetothefreshappearanceof thefourrockglaciers(fig.2). Airtemperatureregimebasedonthemeteorologicalstation Themeteorologicalstationislocatedat2603maslintheupperpartoftherockglacier(Figs.1&2). Resultsfromthisstationshow,thatthenumberoffrostdays(FD),icedays(ID),freezethawdays (FTD)andfrostfreedays(FFD)wasrelativelystableinthe4yearperiod2006to2010(Fig.3).The meanvalueoffdis246meaningthatduring2/3oftheyearfrostoccursat2600masl.inthestudy area.incontrast,themeanannualairtemperaturevaluesindicateasubstantiallywarmeryear 50
54 PermafrostResponsetoClimateChange 2006/07,twocomparableyears2007/08and2008/09andasubstantiallycooleryear2009/10(Fig.3) yieldingameanvalueof1.7 C.Theelevationofthezerodegreeisothermis2340masl.ifusinga verticallapserateof C/m. Fig.3 Airtemperatureregimeatthemeteorologicalstationattherockglaciermo238.(A)Numberoffrost days(includingicedays),icedays,freezethawdaysandfrostfree;(b)meanannualairtemperature(maat); bothforthesingleyearsandthemeanoftheentire4yearsperiod. Groundthermalregimebasedonminiaturetemperaturedatalogger ResultsofthecontinuousmeasurementsofgroundsurfacetemperatureatthesixsitesGST1toGST6 areshowninfigs.4and5.fig.4showsthenumberoffrostdays(includingicedays),icedays,freeze thawdaysandfrostfreedays.ingeneral,thelowestvaluesinfdandidweremeasuredinwinter 2006/07.Incontrast,thehighestvaluesofFTDweremeasuredgenerallyinwinter2006/07apart fromthesnowrichsitegst5.atallsixsites,thenumberofffdwasagainhighestinwinter2006/07, atsitegst1theffdvaluewasevenhigherthanthefdvalue. ThemeanvalueofFDislowestatthesouthexposedsiteGST1withonly198days,followedbyGST2 with208days.incontrast,atsitegst3at3000masl,themeanvalueoffddaysisalmost270.the FDvalueforthenorthexposedsitesGST4toGST6isquitesimilaratallthreesiteswith237to245. Regardinginterannualvariation,thenumberofFDduringthefouryearperiodvariedonlyby15days betweenthehighestandcoldestsitegst3.incontrast,atsouthexposedandwarmersitegst1the numberoffdvariedduringthesameperiodby60days(168fdin2006/07vs.228fdin2007/08). Consideringthefactthatthewinter2006/07wasexceptionallywarmandthewinter2007/08was relatively normal,theseresultssupposethatpermafrostsitesatlowerlocationinthestudyarea DösenValleyaremoresusceptibletoclimatewarming. Regardingicedays,thelowestIDvaluesareagainfoundatthesouthfacingsitesGST1andGST2with about170days.thecoldestsitewiththehighestnumberofidissitegst5with234days.this maximuminidatthissiteisattributedtolocaltopoclimaticconditions(smalldepressiononnorth facingslopefavouringgroundcooling)andlongsnowcoverduration(delayingroundwarmingin springtomidsummer).similaridvaluesarefoundatthehighestsitegst3andthetwonorthfacing sites GST4 and GST6. The interannual variation of the number of ID during the four year measurementperiodvariedsubstantiallyby36(gst4)to73days(gst1). Themeanvalueofthefreezethawdaysisgenerallylowrangingfrombetween11atthesnowrich sitegst5to37atthewarmsitegst2,but50atthehighestsitegst3.atsitegst5,theftdvalue wasevenonlyfiveinthewinter2007/08relatedtothelonglastingsnowcoveratthissite.in contrast,atsitegst3thenumberofftdvaluereached70inthewarmwinter2006/07.the differencesinthenumberofftdatthesitesalsoindicatethatfrostweatheringcausedbyfreeze 51
55 PermaNET CasestudiesintheEuropeanAlps thawactionisimportantatthesouthexposedsitesgst1,gst2andinparticulargst3.incontrast,at thecoolerandsnowrichersitesthisweatheringprocessislessactiveatpresentclimateconditions. Finally,frostfreedaysishighestatthewarmsitesGST1andGST2,comparableatthethreenorth exposedsitesgst4togst6andsubstantiallylowestatsitegst3. Fig.4 GroundthermalRegimeatthesixsitesGST1toGST6betweenSeptember2006andAugust2010with numberoffrostdays(includingicedays),icedays,freezethawdaysandfrostfreedays.resultsofsingleyears andthemeanfortheentireperiodareshown. Fig.5showsthemeanannualgroundsurfacetemperature(MAGST)aswellastheelevationofthe computedzerodegreeisothermbasedonalapserateof C/mforallsixsites.Resultsare shownforthesinglemeasurementyearsbetween2006and2010aswellasthemeanoftheentire period. Results show that the northfacing slopes are cooler than the southfacing slopes at comparableelevation.onthesouthexposedslopes,theverticaltemperaturegradientforthefour yearperiodis C/m(betweenGST1undGST2)und C/m(betweenGST2undGST3).In contrast,onthenorthexposedslopesthesituationismorecomplexduetolocaltopoclimatic conditionsalsoinfluencingthecharacteristicsofthewintersnowcover(duration,thickness).a negativegradientof C/mwascalculatedbetweenthesitesGST4andGST5,whereasaslight positivegradientof C/mwascalculatedbetweenthesitesGST5andGST6 Fig.5clearlydepictsthattheMAGSTatsitesGST1andGST2arepositivewithmeanvaluesof+1.2 C (GST2)to+2.0 C(GST1)indicatingabsenceofpermafrost.However,siteGST1islocatedonblocky material.duetothethermalbehaviourofsoilmaterial(inparticularcoarsegrainedblockymaterial withopenvoidsinbetween;gruber&hoelzle2008),thetemperatureatthegroundsurface(i.e. MAGST)iswarmercomparedtothetemperatureatthetopofpermafrost(TTOP),possiblyupto severaldegrees( thermaloffset ;SmithandRiseborough2002).Therefore,despitethefactthat positivemagstaremeasuredatthesurface,permafrostmightstillexistinthegroundatoraround thesitegst1.incontrast,themagstvaluesattheotherfoursitesgst3togst6areclearlynegative 52
56 PermafrostResponsetoClimateChange (apartfrom2006/07atsitegst6)withmeanvaluesof0.9 CatsiteGST4to2.6 Catthe3000m sitegst3indicatingatthesefoursitespresenceofpermafrost. Fig.5 Meanannualgroundsurfacetemperature(MAGST)andcomputedzerodegreeisotherm(usingalapse rateof C/m)atthesixsitesGST1toGST6.Resultsofsingleyearsandthemeanfortheentireperiodare shown.theelevationrangeofthecomputedzerodegreeisothermduringthefouryearsisindicated. Thediagramshowingthecomputedzerodegreeisothermforthesixsitesindicatesthatthelowest computedzerodegreeisothermwascalculatedforthenorthfacingandlowelevatedsitegst6with a mean value of 2207 m asl. In contrast, the highest computed zerodegree isotherms were calculatedforthetwosouthfacingsitesgst1(2797masl)andgst2(2771masl).explanationfor thisisthelocaltopoclimaticconditionandthebufferingeffectofthewintersnowcoveratagiven site.atsitesgst1,gst2,gst3andgst6)snowcoverisofminorimportance(windexposedsites withlittle/minorsnowcover)comparedtositesgst4andgst5(footslopepositionwithmore efficientsnowaccumulationandlonglyingsnowcover).thisalsohighlightstheimportanceofsnow influencingthethermalregimeoftheground( nivaloffset ;SmithandRiseborough2002).Basedon thecalculations,thezerodegreeisothermatthegroundsurfaceonnorthexposedslopesislocated betweenabout2200and2500masl,onsouthfacingslopesbetween2600and2800masl.the computedzerodegreeisothermvariedduringthefouryearsbetween177m(gst4)and472m (GST6)indicatingsubstantialinterannualchanges.Singleyearssuchasthewarmwinter2006/07 causeasubstantiallyincreaseofthisisothermby80to260m. Summarising,onemightexpectpermafrostinthestudyareaonnorthexposedslopescoveredby coarseblockymaterialatelevationsof masl,onsouthexposedslopesat m asl. Rockglacierkinematic Active rock glaciers are creeping phenomena of continuous or discontinuous permafrost. Their movement mode is strongly related to climatic conditions and as a consequence to ground temperatures(kääbetal.2007).fig.6depictstheevolutionofthemeanannualhorizontalsurface velocity at the Dösen rock glacier mo238 between 1954 and 2010 based on geodetic and photogrammetricmeasurements.notethatthemeanannualvaluesintheperiodbefore1995are generallylowercomparedtotheyearsafter1995indicatinggenerallylowerdisplacementratesin theperiod1954to1995.however,singleyearswithdisplacementratescomparabletothevaluesof 53
57 PermaNET CasestudiesintheEuropeanAlps thepost1995periodareconceivable.furthermore,notethemaximuminthemovementrates between 2002 and 2004, the following deceleration until 2008 followed by a remarkable new acceleration during the last two measurement yeas. This movement pattern over the last 1.5 decadescorrelateswithothermonitoredrockglaciersinthehohetauernrange(kellererpirklbauer &Lieb2011)andintheentireAlpineArc(Delaloyeetal.2008).Thiscircumstanceconfirmsthe assumptionthatclimaticconditionsandchangesintheeuropeanalpsarethedominantsteering factorsforrockglaciermovement. Fig.6 Changeofmeanannualhorizontalsurfacevelocity(cma1)attheDösenrockglaciermo238between 1954and2010basedongeodeticandphotogrammetricmeasurements.Meanof11measurementpoints(Pt. 1017,2123).DatasourceKaufmannetal.(2007)andunpublisheddata. Relationshipbetweenrockglacierkinematicandclimate Theownmeteorologicalstationattherockglaciermo238wasusedtocollectairtemperaturedata fortheperiodoctober2006toaugust2010.meanmonthlyairtemperaturedatawerecalculatedfor theperiodjanuary1990toseptember2006forthedösensitebyapplyingcorrelationanalysiswith theairtemperaturedatafromthemeteorologicalobservatorysonnblick,about24kmwnwofthe DösenValley.Fig.7depictstherelationshipbetweenthegeodeticmeasurementsatmo238andthe meanannualairtemperature/maat(running12montmean).thisgraphshowsthatthewarm MAATvaluesattheendof1994/beginningof1995causedanincreaseinsurfacedisplacementinthe years1997to1999.incontrast,thecoolermaatvaluesbetweenendof1996andmid1997caused lowervelocitiesin themaatvaluesintheperiod1999to2004weregenerallyhigh causingasteadyincreaseofthevelocityratespeakingin thiswaspreviouslyexplained byconstantwarmingandanincreaseofliquidwaterinthepermafrostbodyoftherockglacier(buck &Kaufmann2008).Accordingtotheseauthors,therockglaciervelocityexperiencedinthisperioda selfreinforcingdynamicleadingtoafurtherincreaseinvelocity.themaatvaluesdecreasedafter 2004causingrockglacierdecelerationuntil TheextremeincreaseoftheMAATbetween early2007tomidof2008causedanewaccelerationintheperiod2008to
 andunpublisheddata.data 2.")
58 PermafrostResponsetoClimateChange Fig.7 Meanannualairtemperature/MAAT(running12monthmean)andhorizontalsurfacevelocitiesatthe Dösenrockglaciermo238duringtheperiod1990to2010.DatasourceofvelocityvaluesKaufmannetal.(2007) andunpublisheddata.data 2.3Summaryofcurrentpermafrostdistributionanddynamics Basedonthepermafrostresearchcarriedoutsofar,wecanconcludethatpermafrostinthestudy areadösenvalleyexistsatextremesites(northexposedslopes,wellshelteredfromsolarradiation, andcoarseblockymaterial)atelevationsdownto2200masl.incontrast,onsouthexposedslopes coveredbycoarseblockymaterialthelowerlimitisataround2600masl.animportantroleplays thewintersnowcoverinthelocalpermafrostdistributionparticularlyatsuchcoarseblockysites.on theonehand,snowpoorsitesinradiationshelteredlocations(suchasgst6)allowefficientground coolinginautumnaccompaniedbymoderatewarminginspring.ontheotherhand,snowrichsites atfootslopepositionsinradiationshelteredlocations(suchasgst5)reduceefficientgroundcooling butshelterthegroundfromwarminginspringandevensummer. Onslopesnotcoveredbycoarseblockymaterial,thelowerlimitofpermafrostissubstantiallyhigher atelevationsofbetween2500masl.(northfacing)to2900masl.(southfacing).atfootslope positionsinfluencedbylonglastingsnow,thepermafrostlimitseemstobeataround2400masl (northfacing) to 2700 m asl (southfacing). These results clearly show that local conditions influencingsolarradiation,degreeofgroundcooling,thermalregimeofthegroundsurfaceandnear groundsurfaceaswellaswintersnowcoverconditionshaveamajorimpactonthedistributionof permafrostinthestudyarea.thisimpactaltersthegeneralpatternofdecreasinggroundsurface temperaturewithincreasingelevationsubstantiallyandmakesthepermafrostdistributionpatternin thestudyarea(andatcomparablesitesintheneighbouringarea)complexatelevationsbetween 2200mand2900masl. Thebehaviourofthemonitoredrockglaciermo238intheinnerDösenValleyisinaccordanceto othermonitoredrockglaciersinthehohetauernrangeandtheentirealpinearc.duringthelast1.5 decades,twopeaksofhighsurfacedisplacementratesweredetectedat and withratesexceeding30cmperyear.therockglaciervelocitypatternindicatesthattherockglacier mo238reactsquickerafteracoolperiodwithdeceleration.incontrast,therockglacierneedsmore timetoreacttowarmerperiodswithaccelerationofthemovementindicatingtheinertiaoftherock glaciersystemtowardsgroundwarmingandvelocitychanges. 55
59 PermaNET CasestudiesintheEuropeanAlps 3. Possiblefuturethermalresponsetopredictedclimatechange Aspresentedabove,permafrostinthestudyareaDösenValleyplaysanimportantroleandcovers presumablyabout1/3oftheareaabove2270masl.besidesthesoleexistenceofpermafrostin bedrock and in slope deposits, permafrost in the study area is also important for geomorphic periglacialprocessessuchascreepingoftheactiverockglaciers(inparticularrockglaciermo238)or rockfallscausedbyfrostweatheringobservedfrequentlyduringeachfieldcampaign. ClimatechangewiththepredictedtemperatureincreasefortheGreaterAlpineRegion(GAR)by usingtherelativelyoptimisticclma1bscenarioindicatesatemperatureincreaseofaround2 Cby 2050(seeChapter3).TheairtemperatureatthemeteorologicalstationinthestudyareaDösen Valleywouldbeslightlypositivewitharound+0.3 C.Ifusingalapserateof C/mandtheair temperatureincreaseof+2 C,theelevationofthezerodegreeisothermwouldshiftbyabout310m frompresently2340maslto2650maslcausingsubstantialpermafrostdegradationinthebedrock (fasterreaction)andintheintactrockglaciers(slowerreactionwithalongertimelag). Theestimatesforfrostday(FD),iceday(ID)and(FTD)fortheperiods and basedonairtemperaturedatarevealforthestudyareadösenvalleythefollowingresults:the numberoffdwilldecreaseby14to15daysperyear.forthesummitarea,thiswouldmean FDinsteadof261280FD.Fortheelevationaroundtheactiverockglaciermo238( ,this wouldyield226246fdinsteadof241260fd,henceareductionoffdbyupto5.7%.thenumberof IDwilldecreasealsobysome15to16daysperyear,henceareductionfrom201220to185205ID inthesummitareasand,respectively,from161180to145165atelevationsataround2350to2650 masl,henceareductionofidbyupto10%.incontrast,thenumberofftdwillpresumablyincrease slightlyby0.1to2daysperyear.intheperiod ,thenumberofftdinthesummitareasis about7080,atelevationsataround2350to2650maslabout8090.basedonthe ownair temperaturemeasurementsatthemeteorologicalstationat2603maslatthesurfaceofmo238,the mean number of FD during the four year period September 2006 to August 2010 was 246. Furthermore,165IDand82FTDweremeasured.Thissuggeststhatthemodellingresultsforthe standardperiod appliedforthegarareinaccordancewiththemeasurementsof attheDösenValley.However,onehastokeepinmindthatMAATatthenearbymeteorological observatorysonnblickwasabout1.3 Ccoolerduringthenormalperiod comparedtothe periodseptember2006toaugust2010.thisdifferenceinthemaatvaluesduringthetwoperiods certainlyinfluencesthenumberoffd,idandftd.therefore,thiscircumstanceclearlyshowsthat comparinglocaldatawithregionalmodellingresultsisnottrivial. RegardingrockglaciervelocityandclimaticconditionsintheDösenValley,onecanexpectthatan increaseofgroundtemperaturesintheactiverockglacierswillcausepermafrostwarmingand eventuallypartialthawingofthepermafrost.thiswillleadtoanincreaseofliquidwaterintherock glacierwhichitselfmightincreasethemobilityandhencesurfacevelocityoftherockglacier.further permafrostwarmingandthawingwillleadtoincreasingfrictionwithintherockglacierduetoice loss,tocompletepermafrostdegradationandfinallytotheformationofaninactiveorevenrelict rockglacierwithlittletonopermafrostice. Thepredictedclimatechangeuntil2050willsubstantiallydecreasethearealextentofpermafrostin thestudyareadösenvalleyaccompainedbydestabilisationofbedrockandslopedepositsaswellas changesinfrostweatheringconditionsandconsequentlyrockfallactivity.southfacingslopesnot coveredbycoarseblockymaterialwillbepermafrostfreeintheentirestudyareaandonlythe highestnorthfacingslopeswillstillbeinfluencedbywidespreadpermafrost.theroleofsubstrate material(coarse,fine,bedrock)andsnowcoverdynamicswillbeevenmoreimportantforthe remainingpermafrostthantoday.furthermore,temperatureincreasewillpresumablycausefirstan increaseofthecreepvelocitiesofcurrentlymovingrockglacier.inalaterstage,however,thiswill leadtoinactivationofallpresentlyactiverockglaciersinthestudyareadösenvalley. 56
60 PermafrostResponsetoClimateChange Acknowledgements. Thisstudywasmainlycarriedoutwithintheframeworkoftheprojects ALPCHANGE,financedbytheAustrianScienceFund(FWF)throughprojectno.FWFP18304N10,and PermaNET.ThePermaNETprojectispartoftheEuropeanTerritorialCooperationandcofundedby theeuropeanregionaldevelopmentfund(erdf)inthescopeofthealpinespaceprogramme velocities.thecentralinstituteformeteorologyandgeodynamics(zamg)isthankedforproviding temperaturedatafromthemeteorologicalobservatorysonnblick. References: BuckS.&KaufmannV.,2008:Theinfluenceofairtemperatureonthecreepbehaviourofthreerockglaciersin thehohetauern.grazerschriftendergeographieundraumforschung,45, DelaloyeR.,PerruchoudE.,AvianM.,KaufmannV.,BodinX.,HausmannH.,IkedaA.,KääbA.,Kellerer PirklbauerA.,KrainerK.,LambielCh.,MihajlovicD.,StaubB.,RoerI.&ThibertE.(2008):Recent interannual variations of rock glacier creep in the European Alps. Proceedings of the Ninth InternationalConferenceonPermafrost(NICOP),UniversityofAlaska,Fairbanks,June29 July3, 2008, GruberS.&HoelzleM.,2008:TheCoolingeffectofcoarseblocksrevisited:amodelingstudyofapurely conductivemechanism.proceedingsoftheninthinternationalconferenceonpermafrost(nicop), UniversityofAlaska,Fairbanks,June29 July3,2008, KääbA.,FrauenfelderR.&RoerI.,2007:Ontheresponseofrockglaciercreeptosurfacetemperatureincrease. GlobalandPlanetaryChange,56,12: KaufmannV.&LadstädterR.,2007:Mappingofthe3DsurfacemotionfieldofDoesenrockglacier(Ankogel group,austria)anditsspatiotemporalchange( )bymeansofdigitalphotogrammetry. GrazerSchriftenderGeographieundRaumforschung,43, KaufmannV.,LadstädterR.&KienastG.,2007:10yearsofmonitoringoftheDoesenrockglacier(Ankogel group,austria) Areviewoftheresearchactivitiesforthetimeperiod Proceedings,5th MountainCartographyWorkshop,29March1April2006,Bohinj,Slovenia, KellerF.,1992:AutomatedmappingofmountainpermafrostusingtheprogramPERMAKARTwithinthe GeographicalInformationSystemARC/INFO.PermafrostandPeriglacialProcesses,3, KellererPirklbauerA.,2008:TheSchmidthammerasaRelativeAgeDatingToolforRockGlacierSurfaces: ExamplesfromNorthernandCentralEurope.ProceedingsoftheNinthInternationalConferenceon Permafrost(NICOP),UniversityofAlaska,Fairbanks,June29 July3,2008, KellererPirklbauerA.&LiebG.K.,2011:Recentrockglaciervelocitybehaviourandrelatednaturalhazardsin thehohetauernrange,centralaustria.permanetprojectreport ContributionofIGRStoAction 6.2/Group1 Rockglacier. KellererPirklbauerA.,AvianM.,LiebG.K.&RieckhM.,2008a:TemperaturesinAlpineRockwallsduringthe Warm Winter 2006/2007 in Austria and their Significance for Mountain Permafrost: Preliminary Results.ExtendedAbstracts,NinthInternationalConferenceonPermafrost(NICOP),Universityof Alaska,Fairbanks,June29 July3,2008, KellererPirklbauerA.,AvianM.,LiebG.K.&PilzA.,2008b:AutomaticDigitalPhotographyforMonitoringSnow CoverDistribution,RedistributionandDurationinalpineAreas(HinteresLangtalCirque,Austria). GeophysicalResearchAbstracts10:EGU2008A KellererPirklbauerA.,LiebG.K.&KleinferchnerH.,2010:Anewrockglacierinventoryattheeasternmarginof theeuropeanalps.geophysicalresearchabstracts12:egu Kenyi L.M. & KaufmannV., 2003:Measuring rockglacier surface deformation using SAR interferometry. Proceedingsofthe8thInternationalConferenceonPermafrost,Zurich,Switzerland,
61 PermaNET CasestudiesintheEuropeanAlps KerschnerH.&IvyOchsS.,2007:Palaeoclimatefromglaciers:ExamplesfromtheEasternAlpsduringthe AlpineLateglacialandearlyHolocene.GlobalandPlanetaryChange,60,5871. KienastG.&KaufmannV.,2004:GeodeticmeasurementsonglaciersandrockglaciersintheHoheTauern NationalPark(Austria).Proceedings,4thICAMountainCartographyWorkshop,30September 2 October 2004, Vall de Núria, Catalonia, Spain, Monografies tècniques 8, Institut Cartogràfic de Catalunya,Barcelona, LiebG.K.,1991:DiehorizontaleundvertikaleVerteilungderBlockgletscherindenHohenTauern(Österreich). ZeitschriftfürGeomorphologieN.F.,35, LiebG.K.,1996:PermafrostundBlockgletscherindenöstlichenösterreichischenAlpen.Arbeitenausdem InstitutfürGeographiederKarlFranzensUniversitätGraz,33,9125. LiebG.K.,1998:HighmountainpermafrostintheAustrianAlps(Europe).Proceedingsofthe7thInternational ConferenceonPermafrost,Yellowknife, LiebG.K.,KellererPirklbauerA.&KleinferchnerH.,2010:BlockgletscherinventarvonZentralundOstösterreich erstelltimrahmendesprojektespermanet.institutsfürgeographieundraumforschung,graz SchmöllerR.&FruhwirthR.K.,1996:KomplexgeophysikalischeUntersuchungaufdemDösenerBlockgletscher (HoheTauern,Österreich).ArbeitenausdemInstitutfürGeographiederKarlFranzensUniversität Graz,33, SmithM.W.&RiseboroughD.W.,2002:Climateandthelimitsofpermafrost:azonalanalysis.Permafrostand PeriglacialProcesses,13,
62 Citationreference 3. CasestudiesintheEuropeanAlps 3.4 HoherSonnblick,CentralAustria KleeA,RiedlC.(2011).Chapter3.4:CasestudiesintheEuropeanAlps HoherSonnblick,Central AustrianAlps.InKellererPirklbauerA.etal.(eds):Thermalandgeomorphicpermafrostresponseto presentandfutureclimatechangeintheeuropeanalps.permanetproject,finalreportofaction5.3. OnlinepublicationISBN ,p Authors Coordination:AlexanderKlee Involvedprojectpartnersandcontributors: CentralInstituteforMeteorologyandGeodynamics(ZAMG) AlexanderKlee,ClaudiaRiedl Content Summary 1. Introductionandstudyarea 2. Measurementsandresults 3. Possiblefuturethermalresponsetopredictedclimatechange References 59
63 PermaNET CasestudiesintheEuropeanAlps Summary ClimatechangeintheAlpsisnotonlyrelatedtotheretreatofglaciers,butrathertothe permafrostdistribution.indicesforthepermafrostretreatinthehighermountainarea,e.g. erosion,frostshatteringorinstabilitiesoftheinfrastructureareobservable.therelevanceof permafrostlongtermmonitoringiswidelyspread.theknowledgeaboutpermafrostinteraction, influencesonpermafrostandthetemporalbehaviourofpermafrostisveryimportantforseveral kindsofinfrastructure,e.g.cablelifts,liftstationsormountainhuts.furthermorethisknowledge isthebasisformeasuringthedrinkingwaterreservoirsofpermafrostinthehighermountain areas,itsqualityanditsusageforthefuture.detaileddataabouttheglacierretreatisavailable. But the permafrost distribution including its thickness and spatial dimension is largely unknown.onthetopofhohersonnblick(3.105masl)inthehohetauern(austria)three boreholeshavebeeninstalledtomeasurerocktemperaturesdownto20munderthesurface. Thisdataabouttemperature,geophysicalandgeodeticalmeasurements(availablesince2007)is afirstapproachforthedocumentationofpermafrostbehaviourinthealps.furthermorethe summitregionofhohersonnblickwillbemodelledwiththeaimtocomputethebehaviourof permafrostinthefuturewithdifferentscenariosinclimatechange. 60

64 PermafrostResponsetoClimateChange 1. Introductionandstudyarea ThetopofHoherSonnblick(3.105ma.s.l.)islocatedintherangeoftheEasternAlpsintheregionof HoheTauern(Austria).NeighbouringmountainsofHoherSonnblickreachsimilarelevationsofabout 3.000ma.s.l..ThenorthslopeofHoherSonnblickischaracterizedbyaverydeepandsteepnorth face.tothesouththeslopeismoderatewithabout30 downtotheuppermarginoftheglacier Goldbergkees.Fig.1showsthesummitareaofHoherSonnblick. InthevicinityofHoherSonnblickarethreeglaciers.Thelargestglacierisofthethreeistheglacier Goldbergkees.ThetwosmalleronesareKleinfleißkeesandPilatuskeesbothwithoutatypicalglacier tongue.glaciericeoccurrencedowntoabout2.500ma.s.l..therockintheregionconsistsmainlyof biotitgneiss(exner,1964).thethicknessofthedebrislayermantlingthebedrockinthesummitarea (wherethethreeboreholesweredrilled;fig.1)isupto2m. Fig.1 ThesummitofHoherSonnblick(3105ma.s.l.)withthelocationofthethreeboreholes.Totheright Zittelhausandtothelefttheobservatorium.ThesummitinthebackgroundisMt.Hocharn(3254ma.s.l.) Theobservatorywasbuiltattheendof19thcenturyandamountainhut,theZittelhaus,isalso locatedontopofthesummit.in2001astudyobservedthatfissuringofthecrestdemandsforthe necessityofageologicalstabilizationofthesteepnorthfacetoprotecttheobservatory.thisre developmentwasdonefrom2003to2007.themainreasonforthefissuringisthechangein meteorologicalconditionsinthe20thcentury.highertemperaturesandmoreliquidprecipitation advancethephysicalweatheringprocessoftherock.highertemperaturecontrastscausesfrost shattering,whichismoreactivethaninpasttimes. 61
65 PermaNET CasestudiesintheEuropeanAlps Climatologicalmeasurements,especiallyoftemperature,startedin1886.Actually,eachyearcounts 310freezingdays(dailyminimumbelow0 C)and239icedays(dailymaximumbelow0 C).All valuesrefertotheperiodbetween1971and2000.uptonowanunbrokentemperaturerowexists. Nexttotemperaturemeasurementsandmeasurementsofothermeteorologicalparameters,the Sonnblickobservatoryisacentreofseveralscientificactivities.E.g.measurementsinatmospheric chemistry,snowchemicalmeasurements,massbalancemeasurementsofthesurroundingglaciers, avalanche reports, of course the permafrost longterm monitoring since 2007 and many more researchactivitiesactuallytakeplaceathohersonnblick. 2. Measurementsandresults Tomeasurethebehaviourofpermafrostandtheinfluencesofclimatechangeforpermafrostontop ofhohersonnblick,three20mdeepboreholesweredrilledon14thand15thseptember2005.at theendofaugust2006theboreholeswereequippedwithtemperaturesensorsindifferentdepths (Fig.2).Additionally,a10mdeepboreholenexttoborehole2wasdrilledandequippedwith extensometers.dailyactualizedmeasurementsoftemperaturedataandextensometerdataare availableonlineatwww.sonnblick.net.allboreholesarelocatedonthesouthernslope(seefig.1). Themeanslopebetweenborehole1and3is27 andthetotalelevationdifferenceis34m.borehole 1isdirectlylocatedtotheSonnblickobservatory,borehole3isadjacenttoacontinuoussnowfield andborehole2islocatedinbetween. Notonlymeasurementsintheboreholesareavailable.InOctober200635miniaturetemperature datalogger/mtd(20ofthetypeutl1andutl2and15ofthetypehobotidbit)wereinstalledto measure the basic temperature of the snow cover in wintertime and the ground surface temperaturesduringsummer.the20loggeroftypeutl1andutl2wereinstalledonmoderate slopeonthesouthernsideofthesummit.inthesteepnorthface,the15hobotidbitswere installed.furthermore,theairtemperaturechangeinthepastsince1886isalsoavailable.fig.3 shows an example of temporal variability of the temperature with increasing depth for the hydrologicalyearin2008.measurementsoftheboreholesshowthatthesummerlytemperature amplitudeisobservabledownto15mwithadelayofabout6to7months. Thecoolingfromthewinterseasoniseffectiveto5mwithadelayofabout4months.Thethickness oftheactivelayerinsummertimewasaboutinborehole1in20081mand70cmin2009.inthe boreholes2and3theactivelayerislessthan1m.there,theactivelayerwasabout60cmin2008. In2009therearenodataavailableforborehole2and3.Naturally,intheupperlayersofthe boreholesthedifferencesbetweensummerandwinterseasonsarelargerthanindeeperlevels.itis alsointerestingtocompareyearlyaveragetemperaturesasitisdoneinfig.4.onthexaxisthe temperature is assigned and on the yaxis the depth of the borehole. The figure shows the temperature of borehole 1 in 2008 (blue line) and in 2009 (red line). Down to about9mthetemperatureprofilein2008ismuchwarmerthanin2009.in3mthereisadifference of0.7 C.Inautumn2009thesummitregionwassnowlessorwithonlyathinsnowcoverforalong timewhichcausedthesedifferences. 62

66 PermafrostResponsetoClimateChange Fig.2 Constructionofmeasurementchainintheboreholeswithdepthsofthetemperaturesensorsand geophones.additionally,theentranceofoneboreholeisshown. 63

67 PermaNET CasestudiesintheEuropeanAlps Fig3 Temporaltemperaturevariabilitywithincreasingdepthforborehole1duringthehydrologicalyear 2007/2008. Fig.4 Meantemperaturesofborehole1in2008(blueline)and2009(redline). 64
68 PermafrostResponsetoClimateChange Inwinter2008/09anearlyandthicksnowcoverexistedsothecoldnesscouldnotpenetrateintothe ground.thisfactcausesthehighermeantemperatureintheupperlayersin2009.anotherfactis illustratedinfig.4.below10mthetemperatureoftheyears2008and2009aresimilar.one explanationcouldbethatthepenetrationdepthofseasonallytemperatureonlyreachesadepthof 15m.ThisbehaviourisalsoillustratedinFig.3.Below15mtherearenearlynotemporalfluctuations andbetween10and15mthefluctuationsareverysmall. Asitwasmentionedabove,nexttoborehole2isanothermoreshallowborehole,whichwasdrilled down to 10 m and is equipped with extensometers. Measurements show that in autumn the extensometersmeasurenegativevalues,whichcanbeidentifiedwithcompression.notenoughdata areavailableyetforlatespringandsummer,butafirstguesswouldbestretchingwithpositive values.thishypothesiswillbetestedinsummer2011,whenwinterseasonisgone. 3. Possiblefuturethermalresponsetopredictedclimatechange Becausemeasurementsexistonlysince2007itisnotpossibletomakestatementsconcerning permafrostretreatinthepastclimatewarmingatsonnblickuntilnow.butwiththehelpofclimate models which are able to compute temperature development in the future with different assumptions,itisachievabletoproducepossiblefuturescenarios.asitisdescribedinsection3.1, above1.800ma.s.l.iceandfrostdayswillbereducedbyabout14daysperyearbetween2021and 2050andalsofreezethawdayswillincreaseabout3to5daysperyearinthistimeperiod(the referenceintervalis1961to1990).actuallyonhohersonnblick310freezingdayswillbereducedto 296and239icedayswillbereducedtoabout225dayswithdailymaximumbelow0 C.Underthese scenariospermafrostinhighermountainareaswillretreat.especiallyupperrocklayerswillreactfast tothewarmingoftheair.indeeplayers,wherethetemperaturechangeduringoneyearisnot observable,warmingwillbeslower.theincreaseoffreezethawdayswillbenefitweathering,frost shatteringandfissuring.inregionswithpermafrostexistencehigheractivityinrockfallwillaffect humaninfrastructure,mountainclimbersandchangeofthelandscape. Acknowledgement.ThisworkwaspartlygrantedbytheprojectPermafrostinAustriabytheAustrian AcademyofScience. References: ExnerCh.,1964.ErläuterungenzurgeologischenKartederSonnblickgruppe1: Geol.B.A.168 S.,Vienna. 65
69 PermaNET Permafrostresponsetoclimatechange Citationreference 3. CasestudiesintheEuropeanAlps 3.5 RockGlacierHochebenkar,WesternAustria KrainerK.(2011).Chapter3.5:CasestudiesintheEuropeanAlps RockGlacierHochebenkar, WesternAustrianAlps.InKellererPirklbauerA.etal.(eds):Thermalandgeomorphicpermafrost responsetopresentandfutureclimatechangeintheeuropeanalps.permanetproject,finalreport ofaction5.3.onlinepublicationisbn ,p Authors Coordination:KarlKrainer Involvedprojectpartnersandcontributors: InstituteofGeologyandPaleontology,UniversityofInnsbruck(UIBK) KarlKrainer Content Summary 1. Introductionandstudyarea 2. Permafrostindicatorsandrecentgeomorphicevolution 3. Possiblefuturethermalresponsetopredictedclimatechange References 66
70 PermafrostResponsetoClimateChange Summary RockglacierHochebenkarisatongueshapedactiverockglacierlocatedinasmallNorthwest facingcirqueintheötztalalps(austria; N, E).Morphologyandhighsurface flowvelocitiesindicatethattherockglaciercontainsamassiveicecoreandthuspointtoaglacial origin.duringwinter,thetemperatureatthebaseofthesnowcover(bts)issignificantlylower ontherockglacierthanonpermafrostfreegroundadjacenttotherockglacier.dischargeofthe rockglacierischaracterizedbystrongseasonalanddiurnalvariationsandisstronglycontrolled bythelocalweatherconditions,particularlytheamountofsnowandrainfallevents.water temperatureoftherockglacierspringsremainsconstantlylow,mostlybelow1 Cduringthe entiremeltseason.duringthelastdecadeschangesinthevelocityoftherockglaciershowa closecorrelationwithchangesinthemeanannualairtemperatureofnearbyweatherstations. Thestrongdecreaseinthicknessinthelowermost,steeppartoftherockglacieriscausedby increasedmeltingoficeandindicatesthepresenceofamassiveicecore.ifincreasedmeltingwill continueduringthenextdecadesflowvelocitywilldecreaseandtheactiverockglacierwillpass intoaninactiveone. 67
71 PermaNET Permafrostresponsetoclimatechange 1. Introductionandstudyarea PermafrostiswidespreadintheAlpswhichisdocumentedbythelargenumberofrockglaciersthat havebeenmappedintheeasternpartofthealps,particularlyinthecentralmountainranges(e.g. ÖtztalandStubaiAlps).AspermafrosttemperaturesintheAlpsarejustslightlybelow0 Candthe frozencoreofrockglaciersisthin,rarelyexceeding25m,permafrostinthealps,particularlyactive and inactive rock glaciers, are very sensitive to climate change. Studies on Alpine permafrost, particularlyonactiverockglaciers,advancedrapidlyduringthelasttwodecades(seesummaryby Haeberlietal.2006).IntheAustrianAlpsseveralrockglaciershavebeenstudiedindetailinrecent years(e.g.lieb,1986,1987,1991,1996;lieb&slupetzky1993;kaufmann,1996a,b,kaufmann& Ladstädter2002,2003,KellererPirklbauer2007,2008,Bergeretal.2004,Krainer&Mostler,2000, 2001,2002,2004,2006,Kraineretal.2002,2007,Hausmannetal.,2007). HochebenkarrockglacierislocatedinÄußeresHochebenkar,aNorthwestorientedcirqueinthe southernötztalalps,about4.3kmsswofobergurgl,ötztal(tyrol,austria).althoughhochebenkar rockglacierhasbeenstudiedconcerningflowvelocitiesformorethan70years(seebelow),only littleinformationisavailableaboutcomposition,thickness,hydrologyandthermalconditions. Fig.1 RockglacierHochebenkarwithlocationofsprings,gaugingstationsandtemperatureloggers (fromabermannetal.2011). 68


72 PermafrostResponsetoClimateChange Hochebenkarrockglacieristongueshapedandextendsfromanaltitudeof2840m(rootingzone)to 2360m(front).Themaximumlengthofthisactive,NWfacingrockglacieris1550m.Thewidth rangesfrom160mnearthefrontto335minthemiddleandupto470mintheupperpart.therock glaciercoversanareaof0.4km²,thedrainageareacomprises1km². Thesurfacelayeriscoarsegrainedwithvaryinggrainsizeandlocallywelldevelopedtransverseand longitudinalfurrowsandridges.adepressionisdevelopedinthewesternpartoftherootingzone. Thefrontissteepand bareofvegetation.the highest peakssurroundingtherockglacierare Hangerer(3021m)ontheeasternsideandtheHochebenkammwithitshighestpointat3149mon thesouthernside,separatedbythehochebenscharte(2895m).thedebrisoftherockglacieris derivedfromthesteeprockwallsofthehochebenkamm. Bedrockinthedrainageareaoftherockglacieriscomposedofparagneissandmicaschistsofthe ÖtztalStubaicomplex.AtHochebenkammthebedrockiscutbynumeroussteepfaultsalongwhich highamountsofdebrisareproducedbyfrostweathering,particularlyduringbreakupinspringand earlysummer. TheaimofthiscasestudycontributionistopresentsomepreliminarydataonthedynamicsofRock GlacierHochebenkar,oneofthelargestandmostactiverockglaciersoftheAustrianAlps. Fig.2:Viewtothesteep,activefrontofHochebenkarrockglacier(viewtowardsSW) 69
73 PermaNET Permafrostresponsetoclimatechange 2. Permafrostindicatorsandrecentgeomorphicevolution 2.1Previousstudies HochebenkarrockglacierisoneofthelargestandmostactiverockglaciersintheAustrianAlps, whichalsoshowstheworldwidelongestrecordofflowvelocities.pillewizerstartedtomeasureflow velocitiesonhochebenkarrockglacierin1938.sincethattime,i.e.overaperiodofmorethan70 years,flowvelocitiesonthisrockglacierhavebeenmeasuredbyterrestrialphotogrammetry,since 1951byterrestrialgeodeticmethods(Theodolite)andsince2008bydifferentialGPS(Pillewizer 1938,1957;Vietoris1958,1972;Haeberli&Patzelt1982;Kaufmann1996;Schneider&Schneider 2001;Kaufmann&Ladstädter2002,2003;Ladstädter&Kaufmann2005).Haeberli&Patzelt(1982) measuredthebasaltemperaturesofthewintersnowcoverinfebruary1975,1976and1977,and thewatertemperatureofrockglacierspringsduringsummer.theyalsocarriedoutrefraction seismicmeasurementsalong11transectsonfrozenandunfrozenground. 2.2Rockglacierdynamicsandthermalregime DuringthelastyearsintensiveinvestigationshavebeencarriedoutonHochebenkarrockglacierto studythedynamics.theseinvestigationsincludefieldmappingofthebedrockandsedimentsand geomorphologic features, grainsize analysis of the debris layer, BTS measurements, hydrology, georadarandflowvelocitymeasurements(detailsinabermannetal.2011). Fig.3:GrainsizedistributionofthreesitesonHochebenkarrockglacier.Greenbars:coarsegrained, bluebars:mediumgrained,redbars:finegrined. 70
74 PermafrostResponsetoClimateChange Grainsizeofrockglacier ThesurfacedebrislayerofHochebenkarrockglacieriscoarsegrainedwithanaveragegrainsize(a axis)measuring35cmonfinergrainedareasand58cmoncoarsergrainedareasinthemiddlepart (Fig.3).Locallyblocksuptoafewmindiameteroccuronthesurface.Similarvaluesarerecorded fromotherrockglacierscomposedofdebrisderivedfromgneissesandschists(bergeretal.2004, KrainerandMostler2001,2004). The coarsegrained debris layer has a maximum thickness of 1.5m and is underlain by debris containinghigheramountsofsandandsilt(fig.4)displayingpoortoverypoorsortingwithvaluesof Phi(inclusivegraphicstandarddeviationafterFolk&Ward,1957).Similarvalueshave beenreportedfromotherrockglaciers(barschetal.1979,giardino&vick1987,haeberli1985, Krainer&Mostler2000,2004,Bergeretal.2004)andtills. Fig.4:CumulativecurvesoftwosamplestakenatthesteepfrontofHochebenkarrockglacier.Both samplesshowasimilartrendindicatingpoorsorting. Thermalregimeofground BTSmeasurementsperformedbyHaeberli&Patzelt(1982)inFebruary1975,1976and1977yielded meanvaluesrangingbetween4.8and7 C.SimilartemperatureswererecordedinMarch2010. Duringwinter2006/2007eighttemperatureloggerswereinstalledwhichrecordedthetemperature atthebaseofthesnowcoveratanintervaloftwohours.resultsshowthatthetemperatureatthe baseofthesnowcoveronpermafrostfreegroundnearthegaugingstationremainedconstantly between0and 1 CfromNovemberuntilMay.FromDecemberuntilApriltemperaturesvaried between3and4 Catthewesternmarginandbetween2and4 Cattheeasternmarginofthe rockglacier.btstemperaturesweresignificantlydeeperinthecentralpartoftherockglacierranging between5and9.3 Cwithonlyminorvariations.Thedeepesttemperature(9.9 C)wasobservedin earlyjanuary.snowmeltstartedduringthefirsthalfofmay. 71
andSchoberMountains(Krainer&Mostler2001).")

ofmeltwaterisreleasedfromtwospringsontheeasternsideoftherock glacieratanaltitudeof2575m(fig.1).")
75 PermaNET Permafrostresponsetoclimatechange SimilarBTStemperaturepatternswererecordedonotheractiverockglaciersintheÖtztalandStubai Alps(Ölgruberockglacier Bergeretal.2004,Reichenkarrockglacier Krainer&Mostler2000, Sulzkarrockglacier Krainer&Mostler2004)andSchoberMountains(Krainer&Mostler2001). Thermalregime,dischargeandelectricalconductivityofwatersprings Watertemperatureoftherockglacierspringsremainedalmostcontinuously<1 Cduringsummer. Evenafterheavythunderstormsinsummerwithrather warm rainfallcausingpeakfloodsin dischargeoftherockglacierthewatertemperaturedidnotchange. AtHochebenkarrockglaciermostofthemeltwaterisreleasedfromspringsatthefront(Fig.1).A minoramount(ca.30%)ofmeltwaterisreleasedfromtwospringsontheeasternsideoftherock glacieratanaltitudeof2575m(fig.1).about95mdownstreamagaugingstationwasinstalledin spring2007atanaltitudeof2555minordertorecordthewaterdepthversustimeduringthemelt season.waterdepthofthemeltwaterstreamiscontinuouslyrecordedbyapressuretransducerat intervalsof1hour. Thedischargeoftherockglacierismainlycontrolledbywaterderivedfromsnowmelt,summer thunderstormsand/orsnowfallduringsummerandthusdisplayspronouncedseasonalanddiurnal variationsindischarge.runoffin2009startedduringaprildisplayingfloodswithmaximumflowpeak duringmayandjunecausedbyfairweatherperiodswithintensemeltingofsnowandice(fig.5).a rapiddeclineindischargewasrecordedafewhoursafterinfluxofcoldairwhichsometimeswas accompanied by snowfall. Shortterm floods with peakflows >100l/s are triggered by summer thunderstorms with heavy rainfall. From July until September discharge decreased and was interruptedbysinglepeakflowscausedbyrainfallevents. Fig.5 Hydrograph(waterheights,blueline)ofthemeltwaterstreamreleasedfromHochebenkar rockglacier(springsattheeasternsideoftherockglacier)fortheperiodapriltoseptember2009. Redlineindicateswatertemperatureatthegaugingstation(locationseeFig.1). Thevaluesforelectricalconductivityofthewaterdischargedfromtherockglaciervarysignificantly overtheseason.athochebenkarrockglaciersignificantlyhighervaluesofelectricalconductivityare recordedatthetwospringsontheeasternsidethanatthemainspringatthefront. 72
76 PermafrostResponsetoClimateChange AtspringswhichoccuratthebaseofthesteepfrontelectricalconductivityisextremelylowinMay andjune(2030µs/cm)andincreasesslightlyreachingvaluesof40µs/cmbytheendofaugustand 60µS/cmatthebeginningofOctober.Thewatertemperatureatthesespringsrangesfrom0.6to 1.4 C. Atthetwospringsontheeasternsideoftherockglacierthevaluesofelectricalconductivityare significantly higher with µS/cm in June, increasing to 400µS/cm during August and to 570µS/cmduringSeptember.Watertemperatureisverylowwith C.Theseasonalvariation inelectricalconductivityresultsfromthedifferentmixingratiooflowmineralizedprecipitationand highermineralizedgroundwater(krainer&mostler2001,2002,kraineretal.2007). Rockglacierdynamics Fortheperiod Pillewizer(1957)documentedamaximumflowvelocityintheupperpart (profileb)of75cm/a,and85cm/afortheperiod profile2yieldedflowvelocitiesof 1.61mfortheperiod ,1.84mfortheperiod and1.53mfortheperiod (Pillewizer1957,Vietoris1958). Significantlyhigherflowvelocities(average3.9m/a,maximum6.6m/a)wererecordedbetween 1954and1972,whereasbetween1973and1995flowvelocitieswerelower(average1.15m/a, maximum2m/a).flowvelocitiesagainincreasedsince1995reachingthehighestvaluesin2003,and thendecreasedagain(seeabermannetal.2011). Recentmorphologicalchanges From1936to1997thefrontoftherockglacieradvancedfor165m(Schneider&Schneider2001). AccordingtoKaufmann(1996)thefrontofHochebenkarrockglacieradvancedfor148mduring50 years,indicatingameanflowvelocityof3m/aforthatperiod.thelowermostprofile1yieldedthe highestflowvelocitiesof3.57m/a( )whichincreasedto5m/a(vietoris1972).since1995 asignificantdecreaseinthicknesswasobservedinthelowermost,steeppartoftherockglacier. 2.3DiscussionandConclusion Morphologyanddebrispropertiesoftheactivelayerareverysimilartootherrockglacierscomposed ofdebrisderivedfrommetamorphicrocks,particularlygneissandschist(bergeretal.2004;krainer &Mostler2000,2001,2004).BasedongrainsizeofthesurfacelayerHochebenkarrockglacierisa typicalboulderrockglacieraccordingtoikedaandmatsuoka(2006).temperaturesatthebaseofthe wintersnowcover(bts)aretypicalforactiverockglaciersandsimilartothoserecordedfromother activerockglaciersintheaustrianalps(bergeretal.2004;krainer&mostler2000,2001,2004).the pronouncedseasonalanddiurnalvariationsindischargearestronglycontrolledbytheweather conditions.waterreleasedattherockglacierspringsismainlyderivedfromsnowmeltandsummer rainfall,subordinatelyfrommeltingofpermafrosticeandgroundwater.floodpeaksarecausedby intensivesnowmeltonwarm,sunnydaysduringlatespringandearlysummerandbyrainfallevents. Thewatertemperatureoftherockglacierspringswhichremainspermanentlybelow1.5 C,mostly below1 C,indicatesthatthewaterflowsthroughtherockglacierindirectcontactwithpermafrost ice(krainer&mostler2002,kraineretal.2007).extremelyhighvaluesoftheelectricalconductivity atthespringontheeasternsideoftherockglacierindicateamuchlongerresidencetimeofthe watercomparedtothewaterreleasedatthespringsatthesteepfrontwhichischaracterizedbyvery lowvaluesindicatingthattheresidencetimeisshortandthatthewaterisderivedfrommeltingof iceandsnowandrainfall. 73
77 PermaNET Permafrostresponsetoclimatechange Thedepressionintherootingzoneandthepronounceddecreaseinthicknessinthelowermostpart duringthelastyearsindicatemeltingofmassiveiceandwesuggestthathochebenkarrockglacier hasaglacialoriginsimilartoreichenkarrockglacier(krainer&mostler2000,kraineretal.2002, Hausmann et al. 2007). High icecontent is also indicated by annual flow velocities which are significantlyhigherthanthoseofmostotheractiverockglacierswithtypicalvaluesof0.11m. Schneider&Schneider(2001)showedthatthevariationsinflowvelocitycorrelatewiththemean annualairtemperaturevalues.higherflowratesduringwarmerperiodsareprobablycausedby higheramountsofmeltwaterwithintherockglacierandnearthebase,probablyalsotoslightly highericetemperatures. Hochebenkarrockglaciermostlikelydevelopedfromadebriscoveredcirqueglacierduetothe inefficiencyofsedimenttransferfromglaciericetomeltwater,amodelproposedbyshroderetal. (2000)basedonstudiesintheNangaParbatHimalaya. 3. Possiblefuturethermalresponsetopredictedclimatechange Inhighalpinemountainenvironmentspermafrostiswarm(2to0 C)andthushighlysensitiveto temperaturechanges.whereaswarmingofpermafrostwasobservedinthenorthernpartsofeurope of0.51 Cduringtheperiod ,noclearwarmingtrendwasrecordedintheAlpsforthis periodduetohighannualvariationsresultingparticularlyfromvaryingthicknessesofthesnowcover (GärtnerRoeretal.2011).However,fieldobservationsshowthatmanyrockglaciersintheAlps alreadyreactedonthewarmingtrendduringthelastdecade.asmostrockglaciersinthealpsare locatednearthelowerboundaryofdiscontinuouspermafrost,whichisthinandrather warm, theserockglaciersareexpectedtoreactmorerapidlytoevenslighttemperaturechangescompared torockglaciersofcolderregions. AtHochebenkarrockglacierasignificantdecreaseinthicknesswasobservedduringthelast15years inthesteeplowerpartindicatingincreasedmeltingofpermafrostice.thisalreadyresultedina decreaseofflowrates.ifthetrendofglobalwarmingwillcontinue,meltingofpermafrosticewill continue,particularlyinthelowerpartoftherockglacierwhichisclosetothelowerlimitof permafrost,resultinginadecreaseinflowvelocity. Butevenintheupperpartoftherockglacierincreasedmeltingofpermafrosticeisexpected.Thus Hochebenkarrockglacierwilltransformfromahighlyactiverockglacierintoaninactiverockglacier duringthenextdecades.asaconsequence,vegetationwillstarttogrowonthefinegrained,steep frontalpartoftherockglacier,whichisstillbareofvegetation. Changesoftotalrockglacierdischargewilldependonchangesofannualprecipitation.Increased meltingofpermafrosticewillslightlyincreasetheamountofmeltwaterderivedfromice,which constitutesonlyasmallpart(<10%)ofthetotaldischarge.warmingwillchangethedischarge patternofrockglaciers:themeltingseasonwillstartearlier(inaprilinsteadofearlymay),andsnow isexpectedtomeltmorerapidlywithinashorterperiodduringmayandjunecausinghighpeak flows.thesepeakflowsmaybeoverprintedbysinglerainfalleventsresultinginextremepeakflows. Heightofpeakflowandlengthofthepeakflowperiodwilldependonthesnowheightswhichalso maychange.suchadischargepatternwithonsetofthemeltperiodinaprilandextremepeakflows duetointensivesnowmeltduringmayandearlyjunewasalreadyrecordedintheextremewarm summerof2003.lowdischargeisexpectedforjulyuntiltheendofthemeltperiod,interruptedby singlepeakflowscausedbyrainfallevents. Acknowledgements:MonitoringofHochebenkarrockglacierisfundedbytheAustrianAcademyof Sciences(project ImpactofClimateChangeonAlpinePermafrost ). 74
78 PermafrostResponsetoClimateChange References: Abermann,J.,Fischer,A.,Krainer,K.,Nickus,U.,Schneider,H.,&Span,N.,2011:Resultsofrecentresearchon RockGlacierÄußeresHochebenkar.ZeitschriftfürGletscherkundeundGlazialgeologie(submitted). BarschD.,FierzH.&HaeberliW.,1979:Shallowcoredrillingandboreholemeasurementsinpermafrostofan activerockglaciernearthegrubengletscher,wallis,swissalps.arcticandalpineresearch,11, BergerJ.,KrainerK.&MostlerW.,2004:Dynamicsofanactiverockglacier(ÖtztalAlps,Austria).Quaternary Research,62, FolkR.L.&WardW.C.,1957:BrazosRiverBar:Astudyinthesignificanceofgrainsoilparameters.Journalof SedimentaryPetrology,27,326. GärtnerRoerI.,ChristiansenH.H.,EtzelmüllerB.,FarbotH.,GruberS.,IsaksenK.,KellererPirklbauerA.,Krainer K.&NoetzliJ.,2011:Permafrost.In:T.Voigt&H.M.Füssel(eds),Impactsofclimatechangeonsnow, ice,andpermafrostineurope:observedtrends,futureprojections,andsocioeconomicrelevance: GiardinoJ.R.&VickS.G.,1987:Geologicengeneeringaspectsofrockglaciers.RockGlaciers,Allen&Unwin, London, Haeberli W., 1985: Creep of mountain permafrost: Internal structures and flow of alpine rock glaciers. MitteilungenderVersuchsanstaltfürWasserbau,HydrologieundGlaziologieETHZürich,77,1142. HaeberliW.&PatzeltG.,1982:PermafrostkartierungimGebietderHochebenkarBlockgletscher,Obergurgl, ÖtztalerAlpen,ZeitschriftfürGletscherkundeundGlazialgeologie,18, HaeberliW.,HalletB.,ArensonL.,ElconinR.,HumlumO.,KääbA.,KaufmannV.,LadanyiB.,MatsuokaN., SpringmanS.&VonderMühllD.,2006:PermafrostCreepandRockGlacierDynamics.Permafrostand PeriglacialProcesses,17, HausmannH.,KrainerK.,BrücklE.&MostlerW.,2007:InternalStructureandIceContentofReichenkarRock Glacier (Stubai Alps, Austria) Assessed by Geophysical Investigations. Permafrost and Periglacial Processes,18, IkedaA.&MatsuokaN.,2006:Pebblyversusboulderrockglaciers:Morphology,structureandprocesses. Geomorphology,73, KaufmannV.,1996a:DerDösenerBlockgletscher StudienkartenundBewegungsmessungen.Arb.Inst.Geogr. Univ.Graz,33, KaufmannV.,1996b:GeomorphometricmonitoringofactiverockglaciersintheAustrianAlps.4 th International SymposiumonHighMountainRemoteSensingCartography.Karlstad,Kiruna,Tromso,August1929, 1996, KaufmannV.&LadstädterR.,2002:SpatiotemporalanalysisofthedynamicbehaviouroftheHochebenkar rockglaciers(oetztalalps,austria)bymeansofdigitalphotogrammetricmethods.grazerschriftender GeographieundRaumforschung,37, Kaufmann V. & Ladstädter R., 2003: Quantitative analysis of rock glacier creep by means of digital photogrammetryusingmultitemporalaerialphotographs:twocasestudiesintheaustrianalps. Proceedingsofthe8 th InternationalConferenceonPermafrost,2125July2003,Zurich,Switzerland,1, KellererPirklbauerA.2007:Lithologyandthedistributionofrockglaciers:NiedereTauernRange,Styria, Austria.Z.Gemorph.N.F.,51/2,1738. KellererPirklbauerA.,2008:TheSchmidthammerasaRelativeAgeDatingToolforRockGlacierSurfaces: ExamplesfromNorthernandCentralEurope.ProceedingsoftheNinthInternationalConferenceon Permafrost(NICOP),UniversityofAlaska,Fairbanks,June29 July3,2008,
79 PermaNET Permafrostresponsetoclimatechange KrainerK.&MostlerW.,2000:ReichenkarRockGlacier:aGlacierDerivedDebrisIceSystemintheWestern StubaiAlps,Austria.PermafrostandPeriglacialProcesses,11, KrainerK.&MostlerW.,2001:DeraktiveBlockgletscherimHinterenLangtalKar,Gößnitztal(Schobergruppe, NationalparkHoheTauern,Österreich).Wiss.Mitt.NationalparkHoheTauern,6, KrainerK.&MostlerW.,2002:HydrologyofActiveRockGlaciers:ExamplesfromtheAustrianAlps.Arctic, Antarctic,andAlpineResearch,34, KrainerK.&MostlerW.,2004:AufbauundEntstehungdesaktivenBlockgletschersimSulzkar,westliche StubaierAlpen.Geo.Alp,1,3755. KrainerK.&MostlerW.,2006:FlowVelocitiesofActiveRockGlaciersintheAustrianAlps.GeografiskaAnnaler, 88A, KrainerK.,MostlerW.&SpanN.,2002:Aglacierderived,icecoredrockglacierintheWesternStubaiAlps (Austria):Evidencefromiceexposuresandgroundpenetratingradarinvestigation.Zeitschriftfür GletscherkundeundGlazialgeologie,38,2134. KrainerK.,MostlerW.&SpötlC.,2007:Dischargefromactiverockglaciers,AustrianAlps:astableisotope approach.austrianjournalofearthsciences,100, LadstädterR.&KaufmannV.,2005:StudyingthemovementoftheOuterHochebenkarrockglacier:Aerialvs. groundbased photogrammetric methods. Second European Conference on Permafrost, Potsdam, Germany,TerraNostra2005(2),97. LiebG.K.,1986:DieBlockgletscherderöstlichenSchobergruppe(HoheTauern,Kärnten).Arb.Inst.Geogr.Univ. Graz,27, LiebG.K.,1987:ZurspätglazialenGletscherundBlockgletscehrgeschichteimVergleichzwischendenHohen undniederentauern.mitt.österr.geogr.ges.,129,527. LiebG.K.,1991:DiehorizontaleundvertikaleVerteilungderBlockgletscherindenHohenTauern(Österreich). Z.Geomorph.N.F.,35, LiebG.K.,1996:PermafrostundBlockgletscherindenöstlichenösterreichischenAlpen.Arb.Inst.Geogr.Univ. Graz,33,9125. LiebG.K.&SlupetzkyH.,1993:DerTauernfelckBlockgletscherimHollersbachtal(Venedigergruppe,Salzburg, Österreich).Wiss.Mitt.NationalparkHoheTauern,1, Pillewizer W., 1938: Photogrammetrische Gletscheruntersuchungen im Sommer Zeitschrift der GesellschaftfürErdkunde,1938(9/19), PillewizerW.,1957:UntersuchungenanBlockströmenderÖtztalerAlpen.GeomorphologischeAbhandlungen desgeographischeninstitutesderfuberlin(ottomaullfestschrift),5,3750. SchneiderB.&SchneiderH.,2001:Zur60jährigenMessreihederkurzfristigenGeschwindigkeitsschwankungen amblockgletscherimäusserenhochebenkar,ötztaleralpen,tirol.zeitschriftfürgletscherkundeund Glazialgeologie,37(1),133. ShroderJ.F.,BishopM.P.,CoplandL.&SloanV.F.,2000.DebriscoveredglaciersandrockglaciersintheNanga ParbatHimalaya,Pakistan.GeografiskaAnnaler,82:1731. VietorisL.,1958:DerBlockgletscherdesäußerenHochebenkares.GurglerBerichte,1,4145. Vietoris L., 1972: Über dieblockgletscher des Äußeren Hochebenkars. Zeitschrift für Gletscherkunde und Glazialgeologie,8,
80 PermafrostResponsetoClimateChange Citationreference 3. CasestudiesintheEuropeanAlps 3.6 RockGlacierLaurichard,NorthernFrenchAlps SchoeneichP.,BodinX.,KrysieckiJ.M.(2011).Chapter3.6:CasestudiesintheEuropeanAlps Rock Glacier Laurichard, Northern French Alps. In KellererPirklbauer A. et al. (eds): Thermal and geomorphic permafrost response to present and future climate change in the European Alps. PermaNETproject,finalreportofAction5.3.OnlinepublicationISBN ,p Authors Coordination:PhilippeSchoeneich Involvedprojectpartnersandcontributors: Institut de Géographie Alpine, Université de Grenoble, France (IGAPACTE) Philippe Schoeneich,XavierBodin,JeanMichelKrysiecki Content Summary 1. Introductionandstudyarea 2. Permafrostindicatorsandrecentgeomorphicandthermalevolution 3. Possiblefuturethermalanddynamicresponsetopredictedclimatechange References 77
81 PermaNET CasestudiesintheEuropeanAlps Summary The Laurichard rock glacier in the French Alps is monitored for surface displacements and repeated geoelectrical soundings and tomographies since the 1980 s. The 25 years velocity record,togetherwiththerepeatedgeoelectricalsurveysandgroundsurfacetemperaturerecord, allowstodrawsomeessentialconclusionsontheinfluenceofclimateonthebehaviourand evolutionofrockglaciers.rockglaciersreacttoclimateandshowinterannualvelocityvariations. Theirreactiontimeisthusmuchshorterthanpreviouslyassumed.Velocityvariationsarelinked totemperaturevariations anincreaseintemperatureinducesanincreaseinvelocity.theair temperature only partly explains the observed ground surface temperature and velocity variations.thegroundsurfacetemperatureshowsthebestlinkwithvelocityvariations,witha timelagofaroundoneyear.thesnowcoverexplainsmostofthedifferencebetweenair temperatureandgroundsurfacetemperature,andthusappearsasthemaindrivingfactorboth for ground surface temperatures and for velocity variations. Thus, the evolution of the permafrostwillnotonlydependontheairtemperature,butwillbestronglyinfluencedbythe evolutionofthesnowcover,especiallyitsearlyorlateonsetinautumn.alateonsetofthesnow covercanatleastpartiallycompensateariseinairtemperature. 78
.thergl1extendsfromtherootingzone(2650ma.s.l.)atthecontactwiththe rockfaceto2450ma.s.l.atitsfrontandisadvancingontoholoceneglacialandperiglacialdeposits.")

82 PermafrostResponsetoClimateChange 1. Introductionandstudyarea TheLaurichardrockglacierRGL1issituatedinthegraniticCombeynotmassifonaNorthfacingslope. Itisawelldevelopedboulderyrockglacierwithdistinctcompressionridgesandasteepfrontaland lateralslope(fig.1).thergl1extendsfromtherootingzone(2650ma.s.l.)atthecontactwiththe rockfaceto2450ma.s.l.atitsfrontandisadvancingontoholoceneglacialandperiglacialdeposits. Itis490mlong,between80and200mwide,andhasanapparentthickness(basedonthevertical heightofthesidesandfront)of2030m.therockglacierhasathreesteppedlongitudinalprofile, withmoderateslopesintheupperpart,asteepmedianpart,andagainamoderateslopeinthe frontalpart.itdisplaysmorphologicalfeaturestypicalofanactivelandform:longitudinalridgesinthe centralsteeppartandasuccessionoftransverseridgesandfurrowsinthecompressivepartofthe tongue(table1). Fig.1 TheLaurichardrockglacier.PhotographbyX.Bodin. Table1 CharacteristicsoftheLaurichardrockglacier Method Latitude Longitude Elevation[ma.s.l.] Slope Aspect Typeofrockglacier Evidenceofpermafrost Evidenceofmovement Typologyofmovement Meanvelocityrange Changeinvelocity Yearoffirstdata initiated/carriedout N E m Variable:moderateontopandtoe,steep(50%)inmiddlepart North talus;lobatetotongueshaped;active Observationofgroundice,groundsurfacetemperature,geoelectric Aerialphotograph,geodetic,Lidar Velocitiychanges From0.3to1.6m/yr 20%increase ,decrease (1979)

83 PermaNET CasestudiesintheEuropeanAlps 2. Permafrostindicatorsandrecentgeomorphicandthermalevolution 2.1Methods Movementshavebeenmeasuredsince1979andregularlyrepeatedsince1985.Thusitrepresents oneofthelongestdisplacementmeasurementrecordonarockglacierinthealps.classicalgeodetic measurementsaremadeundersupervisionoftheparcnationaldesecrinsonatransverseandona longitudinallineofpoints,withaclassicaltotalstation.thesurveywascarriedouteverytwotothree yearsfrom1979to1999andsubsequentlyeveryyear.fourmarkedblockswereaddedattheupper endpartofthelongitudinalprofilein1999.annualvelocity(downslope,verticalandhorizontal), actualverticalchangeafterremovingtotaldisplacementoftheblockdownslopeandvariationin interblockdistancecanbecalculatedfromthesedata(bodinetal.2009).measuredvelocitiesrange from0.2to1.6m/a.thehighestvelocitiesaremeasuredinthesteepmedianpart(fig.2).compared toothersurveyedrockglaciers,itcanbeconsideredasaratherfastmovingrockglacier. Fig.2 DownslopemeanannualsurfacevelocitiesoftheLaurichardrockglacieralonglongitudinal profile line L ( or ). Grey band represents one standard deviation for each measurementlocation(frombodinetal.2009). Geophysicalinvestigationshavebeenrepeatedregularlysince1986.Intotal12verticalelectrical soundings(ves)andsixelectricalresistivitytomography(ert)profileshavebeenundertakenonthe rockglaciertoinvestigateitsinternalstructure:twovesin1986(francou&reynaud,1992),fiveves in1998(v.jomelli&d.fabre,unpublishedwork),fourvesandtwoertin2004,andonevesin 2006.AlloftheVESwerecarriedoutusingtheSchlumbergerconfigurationandtheresultswere interpretedwithtwoorthreelayeredresistivitymodels,whereasapoledipoleconfigurationproved tobethebestforert.thetwoertprofilesweremeasuredagainin2007and2009.theserepeated measurementsallowsomeinterpretationsontheevolutionoftheicecontent. Groundsurfacetemperature(GST)measurementshavebeenperformedontheLaurichardrock glaciersince2003,withsevenutlminidataloggersburiedjustbelowtheblockysurfacetoprotect themfromdirectsolarradiation.oneloggerisplacedoutsidetherockglacierinanonpermafrost area,whereasthesixothersaredistributedoverthesurfaceofthelandform.anautomatedweather stationhasbeeninstalledin2004besidetherockglacier.meteorologicaldatafromnearbystations canbeusedinaddition 80

84 PermafrostResponsetoClimateChange 2.2Rockglaciervelocityvariation OneofthetypicalcaractristicsoftheLaurichardrockglacierRGL1aresignificantvelocityvariations all over the 25 years observation period. The rock glacier showed an increasing trend in flow velocitiesfrom1985to1999,oscillationsaroundahighvelocityratefrom2000to2004,adecrease from2004to2006,andagainamoderateincreasesince2007.previousto2000,thevelocitychanges aremoredifficulttointerpret,duetothenonannualmeasurements.meanvelocitiesonperiodsof2 to3yearsdonotshowsignificantchanges,butthemeasurementintervalinducesasmoothingofthe valuesthatpossiblyhidesmoresignificantinterannualvariations. Thevelocitychangescanbecomparedtothemeanannualairtemperature(MAAT)usingthenearby stationofmonêtierlesbains(meteofrance),usinga12monthrunningmean(fig.3).theoverall pictureshowsacorrespondence between theincreasingtemperature trendand theincreasing velocitytrendfrom1985to1999,thehighlevelofbothtemperatureandvelocitybetween2000and 2004,andthedecreaseinbothtemperatureandvelocitysince2004.Thisshowsatleastthata generaldependenceofvelocityontemperatureseemstoexist.whenlookingondetails,however, thecorrespondenceappearstobelessevident.before2000strongtemperaturevariationsarenot expressedinthevelocitychanges,butasmentionnedabove,thiscouldbepartlyduetoasmoothing ofthevelocitycurvebythemeasurementinterval.between2000and2004,somevelocityvariations appeartobeinvertedcomparedtotemperaturevariations.thiscouldindicateeitheratimelagor theinfluenceofotherparameters. Fig.3 MeansurfacevelocityoftheLaurichardrockglacier(RGL1)and1range(greyband)from (basedonpointsL1L3,L5L8,L10L12),and12monthsrunningmeanairtemperature anomaly(relativetothe196091average)atthemonêtierstation(meteofrancedata)(frombodin etal.2009). Since2000velocityvariationscanbecomparedonanannualbasiswithgroundsurfacetemperature records(usingadatasetfromvalaisfortheperiodbefore2004).thevelocitychangesshowagood correspondencewiththemagst(meanannualgroundsurfacetemperature),averagedoverthe previous 12 months. This shows that creep rates are strongly dependent on ground surface temperatures,whichappearasthemaincontrollingfactorwithatimelagintheorderof1year(fig. 4). 81
ofthelaurichardrockglacier(rgl1),andgroundsurfacetemperaturesonrgl1(200306,")
85 PermaNET CasestudiesintheEuropeanAlps Fig.4 Groundsurfacetemperaturesandrockglaciermovement,200006:meansurfacevelocity (profilel)ofthelaurichardrockglacier(rgl1),andgroundsurfacetemperaturesonrgl1(200306, 12monthsrunningmean,averageoffourdataloggers)andintheValaisregion(200006,12months runningmean;westernswissalps;about2500ma.s.l.,datafromdelaloyeetal.,2008)(frombodinet al.2009). 2.3Evolutionofgroundsurfacetemperature Groundsurfacetemperatures(GST)showsomedeviationsfromtheairtemperature.Themain controllingfactorforgroundsurfacetemperatureappearstobethesnowcoverthickness,especially inautumnandearlywinter.thisiswelldemonstratedbythegstmeasurementseriesperformedat Laurichardsince2003(fig.5,Schoeneichetal.2010). Anearlyandsufficientlythicksnowcoverprotectsthegroundsurfacefromcoolingduringthecold andshortdaysofnovemberdecember,whereasalateorshallowsnowcoverallowsastrongcooling oftheground.whenthesubsequentsnowcoveristhickenough,itsinsulationeffectpreservesthe thermalmemory duringthewholewinter,asisshownbythewinterequilibriumtemperatures (WeqT)measuredinMarch. Thusthegroundsurfacecanexperienceanaveragecoolingeveninwarmyears,ifthesnowcover onsetislate,and/orifthesnowcoverremainsthin.ontheotherhand,thecumulativeeffectofan earlysnowrichwinterprecededorfollowedbyahotsummerismostefficientforinducinga warmingofthegroundsurface. 2.4Evolutionoficecontentandstate Repeatedverticalelectricsoundings(VES)andelectricalresistivitytomography(ERT)profilesshow anevolutionofapparentresistivitiesmeasuredontherockglacierbody.alldatashowthetypical profileexpectedonrockglaciers,withamoderatelyresistantsurfacelayercorrespondingtothe blockyactivelayer,ahighresistivemainlayercorrespondingtothepermafrostbody,andabasalless resistivelayer.thediscussionwillthusfocusondifferenceswithtime. FoursuccessiveVESwereperformedonthetongue(1986,1998,2004,2006)andthreeattheroot (1986,1998,2004).Theaccuracyofrelocationofthe1986sitesisjudgedtobeabout5mforthe loweroneand10mfortheupperone.therewasageneraldecreaseinthemaximumapparent resistivity(ramax)atthevessoundingsiteslocatedattherootandonthetonguefrom1986to (Fig.6).Attheroot(foraninterelectrodespacingAB/2=50m),ramaxdecreasedby3550% from min1986to m18yearslater.Atthetongue,ramaxdecreasedby2050%cent from min1986(AB/2=30m)to min2004(AB/2=20m). 82
86 PermafrostResponsetoClimateChange Figure5 Groundsurfacetemperaturesmeasuredon5locationsontheLaurichardrockglacier ( ,runningmeanofthe12previousmonths).LA1isoutsideoftherockglacier,theothers areonit.theeffectofthesnowpoorwinters2004/05and2005/06isclearlyvisible,aswellasthe cumulativeeffectofthehotsummer2006andthesnowrichwinter2006/07. Fig.6 (a)measuredandmodelledresistivityattheroot(blackcurvesanddots)andtongue(grey curvesanddots)ofthelaurichardrockglacierin1986and2004;(b)invertedmodelsfortheroot (top)andtongue(bottom)in1986and2004(frombodinetal.2009). 83
87 PermaNET CasestudiesintheEuropeanAlps Therelativelylargevariationsinresistivityovertheperiod suggestthatitmaybedifficult todistinguishresistivitychangesduetolongtermmodificationofthepermafrost(e.g.athickening oftheactivelayer,anincreaseingroundtemperature,adecreaseinicecontent)fromthoserelating to seasonal changes in ground properties (e.g. differing water contents during the sounding campaignsintheactivelayerand/orwithintheicylayer),and/orlocalisedchangesintheinternal structure related to permafrost deformation. Despite these limitations, the diachronic VES measurementscanbeinterpretedusinginversionmodelstodepicthypotheticalverticalchangesin structurescomposedofhomogeneoushorizontallayers(figure6b).takingintoaccounttheinfinity ofsolutionsandthewellestablishedelectricalpropertiesofsimilargroundmaterials(fabre&evin 1990,Hauck2001,Delaloye2004),changesattherootcanbeinterpretedasbeingduetothickening oftheactivelayerfrom12mto23mwithnonoticeablemodificationoftheicylayer.incontrast, thoseatthetonguecouldrepresentathickeningoftheactivelayerandalowericecontent,and/ora thinningoftheicylayer.theseresultsarelessreliable,however,duetostronglateralvariationsof theinternalstructurewhicharenotidealforlayeredmodelling. 2.5LessonsfromtheLaurichardcase The25yearsvelocityrecord,togetherwiththerepeatedgeoelectricalsurveysandgroundsurface temperaturerecordallowstodrawsomeessentialconclusionsontheinfluenceofclimateonthe behaviourandevolutionofrockglaciers. Rockglaciersreacttoclimateandshowinterannualvelocityvariations.Theirreactiontimeis thusmuchshorterthanpreviouslyassumed. Velocityvariationsarelinkedtotemperaturevariations anincreaseintemperatureinduces anincreaseinvelocity. Theairtemperatureonlypartlyexplainstheobservedgroundsurfacetemperatureand velocityvariations. Thegroundsurfacetemperatureshowsthebestlinkwithvelocityvariations,withatimelag ofaround1year. Thesnowcoverexplainsmostofthedifferencebetweenairtemperatureandgroundsurface temperature, and thus appears as the main driving factor both for ground surface temperatureandforvelocityvariations. Thus,theevolutionofthepermafrostwillnotonlydependontheairtemperature,butwillbe stronglyinfluencedbytheevolutionofthesnowcover,especiallyitsearlyorlateonsetinautumn.a lateonsetofthesnowcovercanatleastpartiallycompensateariseinairtemperature. Severalopenquestionsremain,however.Themainquestionmaybehowtoexplaintheveryrapid responseofvelocitytogroundsurfacetemperature.therockglaciermovementtakesplaceinthe permafrostbodyandmainlyatitsbase.thethermalconductivityofthepermafrostislowandthe surfacetemperaturevariationsneedtimetodiffusethroughtheprofileandarestronglyattenuated withdepth.itseemsunlikelythatthetemperaturevariationsalonearesufficienttoinducestrong velocityvariations.anotherfactorcouldbethepresenceofliquidwaterpercolatingthroughthe permafrostbodyoratitsbase.thiswouldmeanthatthevelocityvariationsarecontrolledbythe amountofavailableliquidwater.thiswouldimplyapermafrosttemperatureclosetothemelting point. Asimilarquestionarisesconcerningtheresistivitymeasurementsontherockglaciertongue.Thelow resistivitymeasuredinthevesareconsideredastypicalforicepoorpermafrost,andertprofiles suggest a discontinuous and ice poor permafrost body. Such interpretations however are 84
88 PermafrostResponsetoClimateChange inconsistentwiththehighvelocityratesmeasuredonthetongue,whichimplyanicesupersaturated permafrostbody.theexplanationcouldbethepresenceofliquidwaterin temperate permafrost. This means that the evolution of rock glacier permafrost with rising temperature could be characterizedbyanincreaseofthepermafrosttemperaturetovaluesclosetothemeltingpoint,and anincreaseofinterstitialliquidwaterduringthemeltingseason. 3. Possiblefuturethermalanddynamicresponsetopredictedclimatechange TheresultsfromtheLaurichardrockglacierandformothersimilarcasesshowthat(i)thedynamic responseofrockglacierswillstronglydependonthethermalevolutionofthepermafrostand(ii) thatthethermalresponsewilldependonthetemperatureevolutionaswellasontheevolutionof winterprecipitationandsnowcoveronsetandduration. Forgroundsurfacetemperature,thedirectinfluenceofthesnowcoveronsetdateandthicknessis welldocumentedatlaurichard,andshowsastronginterannualvariability.notemperatureprofileis availableatlaurichard,butotherexistinglongtimeseriesshowanoverallwarmingtrendatca10m depth(permosreports).sothemostprobablescenarioofthermalresponsecouldbethefollowing: Warmingtemperatureswillinduceageneralwarmingtrendofthepermafrost. Astronginterannualvariabilitywillcontinuetoexist,andcoolingperiodsofonetoseveral yearswillcontinuetohappen. The interannual variability depends mainly on the snow cover. Increased winter precipitationscouldinduceastrongerwarmingofgroundsurfacetemperature,especiallyif increasedprecipitationmeansearlieronsetofthesnowcover. Anearliersnowmeltduetowarmerspringtemperatureswouldinduceawarmingofground surfacetemperatures. The thermal effect of increased amounts of melting water due to increased winter precipitationisunknown. Thedynamicresponseoftherockglacierdependsontheicecontent,temperatureandstate.The followingresponsescanbededucedfromtheobservations: Thedecreaseobservedinelectricalresistivitywillpossiblycontinue,reflectingthepresence ofincreasingamountsofwaterwithintheicerockmixture.theamountoficeintherock glacierbodyisstillhigh,however,andshouldremainsoforalongtime. Interannual velocity variations will continue to occur, in relation to ground surface temperaturevariations.velocityincreasesareexpectedespeciallyafterverywarmsummers associatedwithsnowrichwinters. ThegeomorphologicalsettingsoftheLaurichardrockglacierarenotfavourabletoastrong acceleration,andadestabilizationoftherockglacierisnotexpected.duetoitsalready relativelyhighmeanvelocity,thispointhoweverneedstobemonitored. Acknowledgements. ThestudyoftheLaurichardrockglacierwassupportedbytheFondation MAIF.TheannualdisplacementmeasurementsareperformedbytheParcNationaldesEcrins.We thankdenisfabreandadrianoriboliniforallowingtheuseofgeophysicialdata. 85
89 PermaNET CasestudiesintheEuropeanAlps References: BodinX.,2007:Géodynamiquedupergélisoldemontagne:fonctionnement,distributionetévolution récente.l exempledumassifducombeynot(hautesalpes).phdthesis,universityofparis DiderotParis7.272pp. BodinX.,ThibertE.,FabreD.,RiboliniA,SchoeneichP.,FrancouB.,Reynaudl.&FortM.,2009:Two decadesofresponses( )toclimatebytheLaurichardrockglacier,FrenchAlps. PermafrostandPeriglacialProcesses,20, DelaloyeR.,2004:Contributionàl étudedupergélisoldemontagneenzonemarginale.phdthesis, UniversitédeFribourg.260pp. Delaloye,R.,Perruchoud,E.,Avian,M.,Kaufmann,V.,Bodin,X.,Ikeda,A.,Hausmann,H.,Kääb,A., KellererPirklbauer,A.,Krainer,K.,Lambiel,C.,Mihajlovic,D.,Staub,B.,Roer,I.andThibert, E.,2008:RecentInterannualVariationsofRockglaciersCreepintheEuropeanAlps.In:Kane, D.L. and Hinkel, K.M. (eds), Proceedings, Ninth International Conference on Permafrost (NICOP),UniversityofAlaska,Fairbanks, FabreD.&EvinM.,1990:Prospectionélectriquedesmilieuxàtrèsforterésistivité:lecasdu pergélisolalpin.6èmecongrèsinternationaldeaigi,rotterdam. FrancouB.&ReynaudL.,1992:Tenyearsofsurficialvelocitiesonarockglacier(Laurichard,French Alps).PermafrostandPeriglacialProcesses3: HauckC.,2001:Geophysicalmethodsfordetectingpermafrostinhighmountains.PhDthesis,VAW, Zürich.204pp. SchoeneichP.,BodinX.,KrysieckiJ.M.,DelineP.&RavanelL.,2010:PermafrostinFrance.Report N 1.PermaFrancenetwork,Grenoble,InstitutdeGéographieAlpine. 86
90 PermafrostResponsetoClimateChange 3. CasestudiesintheEuropeanAlps 3.6 RockGlacierBellecombes,NorthernFrenchAlps Citationreference SchoeneichP.,KrysieckiJ.M.,LeRouxO.,LorierL.,VallonM.(2011).Chapter3.7:Casestudiesinthe EuropeanAlps RockGlacierBellecombes,NorthernFrenchAlps.InKellererPirklbauerA.etal. (eds):thermalandgeomorphicpermafrostresponsetopresentandfutureclimatechangeinthe EuropeanAlps.PermaNETproject,finalreportofAction5.3.OnlinepublicationISBN ,p Authors Coordination:PhilippeSchoeneich Involvedprojectpartnersandcontributors: Institut de Géographie Alpine, Université de Grenoble, France (IGAPACTE) Philippe Schoeneich,JeanMichelKrysiecki Associationpourledéveloppementdelarecherchesurlesglissementsdeterrain,France (ADRGT) LionelLorier,OlivierLeRoux LaboratoiredeGlaciologieetdeGéophysiquedel'Environnement,UniversitédeGrenoble, France(LGGE) MichelVallon Content Summary 1. Introductionandstudyarea 2. Permafrostindicatorsandrecentgeomorphicandthermalevolution 3. Possiblefuturethermalanddynamicresponsetopredictedclimatechange References 87
91 PermaNET CasestudiesintheEuropeanAlps Summary TherockglacierBellecombesisashallowslowmovingrockglacier.However,surfacemovements associatedwithsettlementduetoicemeltingaresufficienttoinducestrongdisturbancetoa chairliftstationbuiltonitssurface.twoboreholesweredrilledthroughtherockglacier,revealing atotalthicknessofca9.50m,butwithaveryicerichlayer,67mthick,lyingdirectlyonbedrock. Thetemperatureprofilesshowaverystableandconstanttemperatureoftheicerichlayer around0.2 C,withalmostnoseasonalvariation.Thegroundsurfacetemperatureshowscold winterequilibriumtemperatures(downto4 C)andstrongseasonalvariationslimitedtotheice poorblockysurfacelayer.thetemperatureprofilearisesthequestionofthestatusoftheice:the icetemperature,verycloseto0 C,couldindicatethattheiceisatthemeltingpointtemperature. Ontheotherhand,veryhighelectricalresistivityvaluesindicatelowliquidwatercontent,and velocitiesshowthatnobasalslidingisoccurringsofar.thequestionofthemeltingpoint temperatureofanicerockmixturecouldbecrucialforthefuturedynamicbehaviorofrock glacierslikebellecombes.moreknowledgeisneededonthephysicsoficerockmixtures.one dimensionalmodellingwasrunwithdifferentscenarios.resultsshowthattheveryicerich permafrostbodyseemstobeverystableunderpresentdayconditions,andastrongwarming wouldbenecessarytoinducesignificantchangesinicecontentandtemperature. 88
92 PermafrostResponsetoClimateChange 1. Introductionandstudyarea TheBellecombesrockglacierissituatedontheskiresortLesDeuxAlpes,intheEcrinsmassif,French Alps(Table1).Itisashallow,topographicallysmoothrockglacier.ItdevelopsonaNorthoriented slopefromca2800to2600ma.s.l.thetwolastpylonsandtheupperstationofachairliftarebuilt ontherockglacier.duringconstructionwork,anicelayerof24mthicknesswasremovedunderthe future chair lift station. Despite this, the chairlift station is subjected to settling movements, indicatingthatthereisstillicebelowit. Thesitehasthereforebeenmonitoredsince2007forgroundsurfacetemperatureandsurface displacements.ithasbecomeareferencetestsiteforvariousgeophysicalmethods(geoelectrical soundingandtomography,refractionandreflexionseismics,surfacewaves,seismicgroundnoise, georadar).twoboreholesweredrilledinautumn2009throughtherockglacierdowntothebedrock andequippedwithsensorchainsfortemperatureprofilemonitoring. Fig.1 TheBellecombesrockglacier.PhotographbyPhilippeSchoeneich. Table1 CharacteristicsoftheBellecombesrockglacier Method Latitude Longitude Elevation[ma.s.l.] Slope Aspect Typeofrockglacier Evidenceofpermafrost Evidenceofmovement Typologyofmovement Meanvelocityrange Changeinvelocity Yearoffirstdata initiated/carriedout N44.99 E m moderate North talus;lobatetotongueshaped;active Observationofgroundice,groundsurfacetemperature,borehole profile Aerialphotograph,DGPS Veryslowmovement From0.03to0.10m/yr Nosignificantchange Permafrostindicatorsandrecentgeomorphicandthermalevolution 2.1Groundsurfacetemperatures Groundsurfacetemperaturesaremonitoredsince2007with4UTL1minidataloggers(3onthe rockglaciersurface,1outsideoftherockglacierinnonpermafrostterrain).inaddition,severalbts mappingcampaignswereperformedinlatewinter,inordertomapthegroundsurfacetemperature distributionduringwinterequilibriumconditions. 89

93 PermaNET CasestudiesintheEuropeanAlps Fig.2 OrthophotooftheBellcombesrockglacier,andpositionofmonitoringdevices. Theresultsshow: Agenerallylowwinterequilibriumtemperatureontherockglaciersurface,withvaluesas lowas4to5 C. Astrongtemperaturecontrastwiththenonpermafrostareasurroundingtherockglacier, whereonlyslightlynegativetemperaturesarerecorded.thiscontrastappearsontheloggers aswellasonthebtsmaps. TheBTSmappingshowsanalmostperfectmatchbetweenlowgroundsurfacetemperature andgeomorphologicalextentoftherockglacier(fig.3). Theseresultsclearlyindicatethepresenceofpermafrostontheentireareaoftherockglacier. 90
94 PermafrostResponsetoClimateChange Fig.3 Groundsurfacetemperaturedistributionatwinterequilibrium,fromBTSmappinginMarch 2009(left)andsnowcoverthickness(right).Theleftmapshowsdistinctlimitsofthepermafrostzone, consistentwiththegeomorphologicallimitsoftherockglacier. 2.2Rockglaciervelocity ThesurfacedisplacementsaremeasuredwithDGPSon32pointsdistributedoverthesurfaceofthe rockglacier.theannualdisplacementvaluesareverylowonmostofthepoints,intheorderofafew cm/a,attheaccuracylimitofthemeasurementmethod.inadditiontohorizontaldisplacements, verticalsettlementsareobservedatthechairliftstationandonthepylons.thesemovements,inthe orderofseveralmillimeters,aresufficienttoneedperiodiccablealignments. 2.3Icecontentandstratigraphy Verticalresistivitysoudings(VES)andelectricalresisitivitytomography(ERT)wereperformedin2007 and 2009 on four profiles across the rock glacier. No significant changes have been observed between2007and2009.allertprofilesshowveryhighresistivityvalues,typicalofhighicecontent. Thishighicecontentwassubsequentlyconfirmedbytwoboreholes. Bothdestructiveboreholesshowasimilarstratigraphy(fig.4): Ontop,2.1mofdrydebris,correspondingtotheblockyactivelayer. 7.5mofveryicerichmaterial.Fromtheinterpretationofthepenetrationlogsandofthe cuttings,thislayercanbesubdividedonboreholesd1intoanuppericerockmixtureand andaloweralmostpureicelayer,whereasinboreholesd2thewholelayerismadeofanice rockmixture. Bedrockwasreachedinbothboreholesatca9.5mdepth.Theicerichlayerliesinboth boreholesdirectlyonthebedrock. 91


95 PermaNET CasestudiesintheEuropeanAlps Fig.4 BoreholestratigraphyofthetwoboreholesatBellecombesrockglacier. Theboreholesconfirmedthepresenceofveryhighicecontent,asdeducedfromtheERTprofiles. However,thethicknessinterpretedfromtheERTprovedtobelargelyoverestimated,duetothevery highresistivityvalues.thisknowndrawbackoftheertmethodlimitsitsuseforthedeterminationof thethicknessofpermafrostbodies.combinedtestsofseveralgeophysicalmethodsonthesame profilesshowthatonly thegeoradarcanpossiblyhelptodeterminethe realthicknessofthe permafrostbody. 2.4Temperatureprofiles Thetwoboreholeswereequippedwiththermistorchains(PT100sensors)connectedtoaloggerfor temperatureprofilemonitoring.theresultsofboreholesd1areshowninfig.5.theinfluenceofthe icecontentonthetemperaturevariationsappearsveryobviously: Strongseasonaltemperaturevariationsoccurwithinthe2mthickactivelayerwithalmostno icecontent. Theseasonaltemperaturevariationsaredrasticallyattenuatedatca.2mdepth,atthe boundarywiththeicerichlayer. Thezeroannualamplitudecanbesetatthetransitionfromfrozendebristomassiveice. 92
96 PermafrostResponsetoClimateChange Fig.5 TemperatureprofileofboreholeSD1andevolutionfromNovember2009toJuly2011. Intheicerichlayer,aswellasinthebedrockbelow,temperaturevariationsarealmost absentorlimitedtoarangeof±0.1 C. Thetemperatureoftheicerichlayerisveryconstantandstable: Theabsolutevalueisaround0.2 C,veryclosetothemeltingpoint. Itshowsnotrendtowardsdepth,buttheprofileisveryshort(ca13mtotaldepth). Variationsarelimitedtoaverynarrowrange. 2.5LessonsfromtheBellecombescase TheinvestigationsontheBellecombesrockglaciershowthelimitsofgeophysicalmethodsforthe determinationoficebodythicknessandgeometry.themostfavourablegeophysicalmethodusedin permafrost,geoelectricaltomography(ert),provestostronglyoverestimatethethicknessofthe permafrostbodyincaseofaveryhighicecontentinducingveryhighresistivityvalues.thispointis verycritical,astheknowledgeofthethicknessiscrucialforacorrectmanagementofgeotechnical problemsliketheoneofthechairliftstation.sofar,boreholesremainthebestmethodtoassessthe stratigraphyofpermafrostbodies. The most interesting aspect of the Bellecombes study case is the temperature profile of the boreholes.thevery warm temperaturesregisteredinthepermafrostbodycontrastwiththelow winterequilibriumtemperaturesregisteredonthesurface.moreover,thevaluesverycloseto0 C andtheirconstancywithdepthandstabilityintimeraisethequestionofthestatusoftheice: Theconstancyoftemperatureintimeanddepthsuggeststhattheicecouldbeatthemelting pointtemperature,similarto temperate glaciers. Howeverthevaluesarestillnegative,andtheconsistencyofthevaluesonbothsensor chainsseemtoindicatethattheyarereliableandnotduetoalackofaccuracy. Actually the physics of icerock mixtures is poorly known, and the value of the melting point temperatureinsuchamaterialisunknown.itcouldbeslightlybelowzero,intherangemeasuredin thebellecombesboreholes.ontheotherhand,theveryhighresistivityvaluesindicatetheabsence ofliquidwaterintheicebody,andtheverylowdisplacementratesindicatethatnobasalsliding occurs,likeitwouldbeexpectedincaseof temperate basalice.thequestionremainsopenand needsfurtherinvestigations. 93
97 PermaNET CasestudiesintheEuropeanAlps 3. Possiblefuturethermalanddynamicresponsetopredictedclimatechange Theknowledgeofthestratigraphyandofthegeophysicalpropertiesoftherockglacierbodyallowed thecalibrationofathermaldiffusionmodel.themodelwasrunforvarioustemperatureevolution scenarios.themodelusedisaonedimensionalmodelthatcalculatestemperatureandicecontentat a spacing of 0.2m, and for time slices of 0.01 days. It uses as input the mean monthly air temperatureandageothermalfluxof0.05watt.m 2. Fig.6 LogofboreholeSD1andmodelsettingsforstructureandicecontent. Theicecontentwasestimatedfromthecuttingsandthedrillingprogressiongraph,accordingto figure6.themodelcharacteristicsweresetwiththevaluesoftable2. Table2 Intrinsicvaluesusedformodelcalculations Thermalconductivity Kw.m 1. C 1 Specificmass kg.m 3 Massicheat CpJ.kg 1. C 1 Snow Ice Debris Bedrock Themodelneedstosetameanairtemperatureaswellasprecipitation,andusesaclimaticscenario todrivethemodel.toavoiduncertaintiesrelatedtoaltitudinalgradientextrapolations,initialvalues weretakenfromthemeteorologicalstationofsaintsorlin,situatedca20kmnorthofthesite,at almostexactlythesamealtitudeandasimilarsituationinthealpinerange:themeanannualair temperatureduringtheyears is0.35 C,andthemeanprecipitationduringthelast35 yearsisbetween1and2mperyear.forthevariability,thehistoryofdeviationsagainstmean temperatureandprecipitationvaluesmeasuredatthestationchamonixfromoctober1959to September1994wastransferred. Themodelwasrunforvariousscenarios.Themainresultsarethefollowingones: 94


98 PermafrostResponsetoClimateChange Allscenarioswithameanannualairtemperature<3 Candprecipitation>1mperyearlead tothepersistenceofthesnowcoverandtotheformationofaglacier.intheseconditions, thegroundicevolumedoesn tchangeanditstemperaturerisestothemeltingpoint.the permafrostunderthepermanentsnowbecomestemperate. Withameanairtemperatureof0.5 Candaprecipitationof1mperyear,nothinghappens withinthefirsttenyears.thesnowcover,withameanthiknessof1minhighwinter preventsthesoilfromcooling,andthehighicecontentabsorbstheheatflux.underpresent conditions,thepermafrostandicebodyseemstobestable. Totesttheeffectofastrongandbrutalwarming,awarmingof5 Cwassetfromthesecond modelyear,leadingtoameanannualairtemperatureof4.5 C.Afterthreeyears,theice volumehasnotyetchanged,buthastotallydisappearedafter20years.thiscorrespondsto themeltingof150to200kg/m 2 /year.thethermalequilibriumhoweverisstillnotreached after30years,andthetemperatrureat2030mdepthisstillcloseto0 C(figure7).Inthis simulation,thewintersnowcoverisoftenverythin(0to1.5mdependingontheyear). Fig7 BoreholeSD1.Left:initialstate,year1(MAAT0.5 C).Right:monthlygeothermsofyear32,10 yearsaftertotaldisappearanceofgroundice,31yearsaftersuddenwarmingof5 C. Theresultsshowthat: The high ice content totally explains the damping of seasonal variations at the active layer/icerichbodytransition.thelatentheattransferduetoicemelting/freezingabsorbs almostthetotalheatflux. Thesiteisstableunderpresentdayconditions. Incaseofaprogressivetemperaturerise,theheatfluxincreasewouldbealmosttotally absorbedbylatentheatduringthefirstdecade,andneithericetemperaturewouldrisenor significanticevolumelosswouldoccur. 95
99 PermaNET CasestudiesintheEuropeanAlps Significant changes would occur only after several decades or in case of a very strong warming. Thus,veryicerichpermafrostcouldshowahighresistancetoclimatechange.However,themodel runconsideredameltingpointat0 Canddoesnottakeintoaccounttheeffectofpossiblemelt waterflows. Acknowledgements. ThestudyoftheBellecombesRockglacierwassupportedbytheFondation MAIF.TheboreholeswerecofinancedbytheRegionRhôneAlpesthroughtheCIBLE2008program. TheskiresortDeuxAlpesfacilitatedtheworkandprovidedhelpforlogistics. References: LorierL.etal.,2010:Analysedesrisquesinduitsparladégradationdupermafrostalpin.Rapport final,projetfondationmaif.adrgt,gières. SchoeneichP.,BodinX.,KrysieckiJ.M.,DelineP.&RavanelL.,2010:PermafrostinFrance.Report N 1.PermaFrancenetwork,Grenoble,InstitutdeGéographieAlpine. 96
100 PermafrostResponsetoClimateChange 3. CasestudiesintheEuropeanAlps 3.8 AiguilleduMidi,MontBlancMassif,FrenchAlps Citationreference DelineP.,CremoneseE.,DrenkelflussA.,GruberS.,KemnaA.,KrautblatterM.,MagninF.,MaletE., MorradiCellaU.,NoetzliJ.,PogliottiP.,RavanelL.(2011).Chapter3.8:CasestudiesintheEuropean Alps AiguilleduMidi,MontBlancmassif,FrenchAlps.InKellererPirklbauerA.etal.(eds):Thermal andgeomorphicpermafrostresponsetopresentandfutureclimatechangeintheeuropeanalps. PermaNETproject,finalreportofAction5.3.OnlinepublicationISBN ,p Authors Coordination:PhilipDeline Involvedprojectpartnersandcontributors: EDYTEM,UniversitédeSavoie,France(EDYTEM) PhilipDeline,VelioCoviello,Florence Magnin,EmmanuelMalet,LudovicRavanel RegionalAgencyfortheEnvironmentalProtectionoftheAostaValley,Italy(ARPAVdA) EdoardoCremonese,UmbertoMorradiCella,PaoloPogliotti UniversityofBonn AnjaDrenkelfluss,AndreasKemna,MichaelKrautblatter UniversityofZurich StephanGruber,JeanetteNoetzli Content Summary 1. Introductionandstudyarea 2. Permafrostindicatorsandrecentthermalevolution 3. Possiblefuturethermalresponsetopredictedclimatechange References 97
101 PermaNET CasestudiesintheEuropeanAlps Summary WedevelopinvestigationsattheAiguilleduMidi(3842ma.s.l),whererockwallsareofdiverse aspectsandslopeangles,andgalleriesareaccessibleyearround.intheframeworkoftheproject PermaNET,wemonitortherockthermalregime(i)with9sensorswithonetothreethermistors installeduptoadepthof55cm;(ii)withthree10mdeepboreholesequippedwiththermistor chains;and(iii)byusingelectricalresistivitytomography(ert),basedonthetemperature resistivityrelationshipofthelocalgranite.thesemeasurementswerecompletedbytwomobile automaticweatherstations.combinedwitha3dhighresolutiondemmadeusinglongand shortrangeterrestriallaserscanning(forrockwallsandgalleries,respectively),thesedatawill be used for physicallybased model validation or construction of statistical models of rock temperaturedistributionandevolutionintherockwalls.thesitestartedtobeinstrumentedin 2005,andsomemethodsarestillexperimental.Herewefocusonthethermalmonitoringdevice installedonthesiteandpresentsomefirstresults. 98


becauseof(i)itsele")
, (ii) its steep rockwalls characterized by differents aspects, slope angles, rock")


102 PermafrostResponsetoClimateChange 1. Introductionandstudyarea Starting off in the framework of the EU cofunded FrenchItalian PERMAdataROC project and presentlyunderdevelopmentwithintheprojectpermanet,ourinvestigationsattheaiguilledumidi (N45 52',E6 53')beganinNovember2005.Wechoosethissite(Fig.1)becauseof(i)itselevation (3842m a.s.l.), (ii) its steep rockwalls characterized by differents aspects, slope angles, rock structures,andsnowcovers,and(iii)itsaccessibilitythroughouttheyearfromchamonixbyacable carfrom1955 halfamilliontouristsvisitthesiteeachyear;rockwallsofthepitoncentralare accessiblebyabseilingfromtheupperterrace,andgalleriesallowtopenetrateintotherockmass whichisrareinhighmountainareas,andlede.g.toobserveasignificantcirculationofwaterduring thehotsummerof2003,forthefirsttimesincetheopeningofthesite.aiguilledumidihasbecome amajorsiteforthestudyofrockwallpermafrostinthealps. A B C D Fig.1TheAiguilleduMidi(3842ma.s.l.):(A)viewfromtheeast.Atthecenter:Pitoncentral;ontheright: Pitonnord,withthecablecarstation.(B)westside(1000mhigh).Atitsbottom:GlacierdesBossonsetGlacier Rond;ontheleft,intheshadow:northsideofthegroupoftheAiguilleduMidi,mainlyglaciated.(C)underthe pylon:subverticalnorthwestsideofthepitoncentral(100mhigh).(d)southeastside(200mhigh).ontheleft: beginningofthearêtedescosmiques;ontheright:pilastresudest.photographsbyp.delineands.gruber(a, C,D: ;B: ) 99
103 PermaNET Case studies in the European Alps The group of the Aiguille du Midi, at the western end of the Aiguilles de Chamonix, develops asymmetrically over 2 km between the Col du Midi and the Col du Plan (Fig. 2). It forms a rocky scarp whose west face and north face (which is glaciated on its upper half) are towering the Glacier des Bossons (by 1000 m) and the Glacier des Pélerins (by 1350 m) respectively (Fig. 1B). However, the back of this scarp is occupied by the western basin of Glacier du Géant, separated from west and north faces by the rocky Arête des Cosmiques and the summit of the Aiguille du Midi. The bulk of the rock is granite of Mont Blanc, a massive rock with a grained facies that contributes to the steepness of the Aiguille du Midi faces 50 for the north face, 57Ͳ58 for the southeast (only 200 m high) and west sides. Many rockwalls within these faces are subvertical, as the north face of the Piton central (Fig. 1C) or the Pilastre sudͳest (Fig. 1D), because of the subvertical dip of the two main families of faults whose dense network cuts across the Mont Blanc massif. Because of a dense secondary fracturing unevenly distributed very massive rockwalls alternate with very densely fractured ones (Fig. 1D). Our study focuses on the summit of the Aiguille du Midi, between 3740 and 3842 m a.s.l., here termed Aiguille du Midi. Fig. 2 Group of the Aiguille du Midi. The instrumented site is the peak labelled Aig du Midi. Detail of the map Mont Blanc n 1 NordͲAiguille du Midi (IGN, 1952) at 1: (contour interval: 10 m). This extract is 4 km large. le 2. Permafrost indicators and recent thermal evolution 2.1 Methods Rock temperature monitoring The rock surface temperature is measured every hour over all faces of the Piton central since 2005 by several miniͳdataloggers with thermistors placed at depths of 3, 10, 30 and 55 cm below the surface. Three 10 m deep boreholes have also been drilled in September 2009 (Fig. 3), normal to the rock 100
,a55 slopeangleinahighlyfracturedareasnowcoveredduringapartoftheyear;and (iii)thenortheastface(boreholeat3753ma.s.l.),witha65 slopeangleinaveryfracturedcouloir, wheresnowoccursoveralargepartoftheyearduetotheconcavetopography.")
104 PermafrostResponsetoClimateChange surfaceof:(i)thenorthwestface(boreholeat3738ma.s.l.),averticalrockwallinaverymassive granite;snowcanonlyaccumulateonasmall2mwideterrace;(ii)thesoutheastface(boreholeat 3745ma.s.l.),a55 slopeangleinahighlyfracturedareasnowcoveredduringapartoftheyear;and (iii)thenortheastface(boreholeat3753ma.s.l.),witha65 slopeangleinaveryfracturedcouloir, wheresnowoccursoveralargepartoftheyearduetotheconcavetopography.theseboreholesare locatedwellbelowthecablecarinfrastructurelevelinordertominimizeitsthermalinfluenceon rocktemperature.theyareequippedwith10mlongchainsof15thermistorsthatmeasurerock temperatureevery3hourssincedecember2009onthenorthwestandsoutheastfaces,sinceapril 2010onthenortheastface. Fig.3Drillingofa10mdeepboreholeinthesoutheastfaceofPitoncentralinSeptember2009.Photograph byp.deline Electricalresistivitytomography ElectricalResistivityTomography(ERT)isincreasinglybeingusedasanoninvasiveimagingtoolin alpinepermafroststudies(krautblatter&hauck,2007;krautblatteretal.,2010).keyobjectivesof thismethodare(i)themappingoftemperaturedistributionsinsidetherocktoinferthepresenceof permafrost,and(ii)thedelineationoffracturezonesgiventheirinfluencingroleonpermafrost dynamicsandstability.forthefirstpurposeapreliminaryrelationshipbetweentemperatureand resistivityoftherockhasbeenestablishedinlaboratory.theimagingoffractures,however,isa notoriouslydifficulttaskusingconventionalertapproacheswhichrelyonsmoothnessconstraint regularization.attheaiguilledumidi,weinvestigateregularizationschemesforimprovedfracture delineationbymeansofnumericalsimulationsandapplicationtofielddata. 101


105 PermaNET CasestudiesintheEuropeanAlps Since2008,fourERTsurveyswereconductedatthesite.Eachonecomprisedtheacquisitionofmore than10,000normalandreciprocaldipoledipoledataoverthreedifferentarraysofaltogether144 electrodes.theelectrodesoftwoarrayscouldbeplacedtoalmostsurroundthepitoncentraland thepitonnordinahorizontalplane,offeringafavourabletomographiccoverage.averticalnorth southtransectacrossthepitoncentralwasinstalledbyabseilingonthenearverticalnorthandsouth faces.theertdatawereinvertedusingisotropicsmoothing,anisotropicsmoothing,andafocussing regularizationschemebasedonthesocalledminimumgradientsupport(mgs),andemployinga finiteelementgridwhichcapturestheirregulargeometryoftherockaswellastheelectrodelayout. Airtemperaturemonitoring Airtemperatureandrelativehumidityaremeasuredonsouthandnorthfacesbythemeanofmini dataloggersplacedinsideradiationshields.onthesouthface,meteorologicalparameters(incoming andoutgoingsolarradiationinbothshortwaveandlongwavebands,windspeedanddirection)were measuredduringnearly4years(december2006tooctober2010)byanautomaticweatherstation adaptedandinstalleddirectlyontherockwall. TerrestrialLaserScanning ADEMisnecessary(i)toaccuratelyrepresenttherockvolume,(ii)asabasisforageological structureanalysis,(iii)torefinethemodelingofrocktemperaturedistribution,and(iv)tostudythe water flow into the rock mass. A highresolution DEM was made using long and shortrange TerrestrialLaserScanning forrockwallsandgalleries,respectively(fig.4). Fig.4 TriangulatedIrregularNetwork(TIN)modeloftherockwallsofthePitonsnord(left)andcentral, obtainedbylongrangeterrestriallaserscanning. 102

106 PermafrostResponsetoClimateChange 2.2 Preliminaryresultsaboutrocktemperature Allthesubsurfacedataarecollectedmainlyforinitialization,calibrationandvalidationofrock temperature and permafrost distribution models. However their statistical analysis allows quantifyingthegreatspatialvariabilityofsubsurfacetemperaturesinsuchcomplexmorphologies. Preliminaryresults(Table1;Fig.5)showthat:(i)themeanannualgroundsurfacetemperaturecan varyofmorethan6 Cwithinfewmetersofdistance,dependingontheaspect;(ii)freezethawcycles onsouthernaspectarenearlytwiceasfrequentthaninthenorthbutmarkedlyshallower;(iii)a significantthermaloffsetprobablyexistsdespitethecompactrockmassandtheabsenceofground covers(e.g.debris,snow)onsouthfaces. Fig.5 MeandailyrocktemperatureonthesouthandnorthfacesofthePitonCentralforthehydrologicalyear atthreedifferentdepthsbelowthesurface. Table1 Rocktemperature55cmbelowthesurfaceonsouthandnorthfacesofthePitonCentralofthe Aiguille du Midi for , , and hydrological years. MAGT: mean annual ground temperature;max/minabs:absolutelywarmestandcoldesttemperature;datemax/minabs:occurrencedate ofmax/minabs; Tavg/max/min:mean,maximalandminimalamplitudeofdailytemperatures;ZCD:Zero CrossingDays,i.e.numberofdaysperyearwherethe0 Cisothermiscrossed;MAX/MINday:warmestand coldestmeandailytemperature;datemax/minday:occurrencedateofmax/minday;dbz:daysbelowzero, i.e.numberofdayswithmaximumtemperaturebelow0 C. 103
 and minimal and maximal rock temperature")
107 PermaNET CasestudiesintheEuropeanAlps Deeperboreholethermistorchainsshowaverysharpcontrastbetweenthethreesurveyedfaces (Fig.6).Atimelagofapproximatelyhalfayearbetweenminimalandmaximalairtemperature periods (JanuaryFebruary, and July, respectively) and minimal and maximal rock temperature periodsatadepthof10m(junejuly,anddecemberjanuary,respectively;fig.7).in2010,theactive layerthicknessvariedfrom1.80minthenorthwestfaceto5.20minthesoutheastface. WhileanisotropicsmoothingcanbeadjustedsuchastoallowacorrectinterpretationoftheERT image, inversion with MGSbased regularization provides most convincing results in terms of resolvingsharpstructuralfeaturesassociatedwithlithologicalchangessuchasfractures,butatthe sametimepreservingsmoothchangestypicaloftemperaturevariationsintherock.lowresistivity zonescouldbedelineatedatthepitonnord,whichseemtocoincidewithwatercontainingfractures causedbyartificialheatsupply;continuationofthesefracturesoutsidetheheatedgalleryindicates permafrostconditions.atthepitoncentral,resistivityvalueswerebelow200000minoctober 2010,whichisquitereasonablewithrespecttothetemperaturerange(Fig.8). Meteorologicaldataontherockwallshowthat:(i)thepeakofSWradiationoccursduringthewinter (>1300W/m 2 )givingstrongdailytemperatureamplitudesatrocksurface(upto30 C);(ii)thereisa clearprevalenceofupslopewindswithspeedsrangingfrom4to9m/s;(iii)themeanannualair temperatureisaround7 Conaverage(Table2),with5to6 Cofdailyamplitudeandanabsolute temperaturerangebetween25to+12 C. Fig.6Plotsofrocktemperaturefromthesurfaceto10mdepthfortheperiod to at thenorthwestandsoutheastfaces,and13/04/2009to21/01/2011atthenortheastfaceoftheaiguilledumidi (continuednextpage) 104


108 PermafrostResponsetoClimateChange Fig.6continued 105


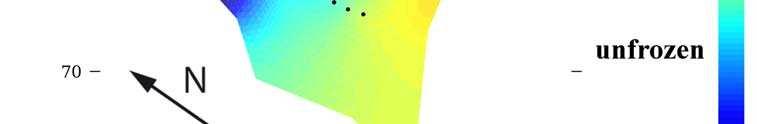
109 PermaNET CasestudiesintheEuropeanAlps Fig.7Timelagbetweenairtemperatureand10mdeeprockatthesoutheast,northeastandnorthwestfaces ofthepitoncentraloftheaiguilledumidi. Fig.8 ElectricalresistivitytomographyinahorizontalplaneatthePitoncentraloftheAiguilleduMidion Blackdotsareelectrodelocations;blue/green:unfrozen;yellow:transitionfromunfrozentofrozen; red:frozen;resistivityisintherange m.reliableresultsareonlyinsidethearcthatisenclosedby the48electrodes. 106
,frostdays(FD),ice days(id)andfreezethawdays(ftd)calculatedassuggestedinchapter2.onthenorthface,hydrologicalyear 200708istheonlyonewithoutmissingdata.")
110 PermafrostResponsetoClimateChange Table2 AirTemperatureonthesouthface(A)andnorthface(B)ofthePitonCentraloftheAiguilleduMidifor ,200809and200910hydrologicalyears.Meanannualairtemperature(MAAT),frostdays(FD),ice days(id)andfreezethawdays(ftd)calculatedassuggestedinchapter2.onthenorthface,hydrologicalyear istheonlyonewithoutmissingdata. (A) South face Mean (B) North face Outlook MAAT ( C) FD (d) ID (d) FTD (d) AiguilleduMidiisthemostelevatedAlpinesitetostudypermafrostinrockwalls.Duringthenext yearsnumericalmodellingofthetransient3dsubsurfacetemperaturefields,combiningadistributed energybalancemodelwitha3dheatconductionscheme,willbeaccomplished(noetzlietal.,2007; Delineetal.,2009).Severalstatisticalmodelsofdistributionofsurfacetemperaturesoftherockwalls begantobedevelopedforthemontblancmassif,butcomparingtemperaturedataattheaiguilledu Midiwithoneofthesemodelsshowssomediscrepancies:whereasthePitoncentralnorthface modeledtemperatureisintherangeof7 to13 C(Fig.9),itsmonitoredaveragetemperatureisca. 6 C(Table1). Fig.9ModeleddistributionofrocksurfacemeanannualtemperatureintheMontBlancmassif(Frenchside) withthemodeltebal(viewfromthewest;imagedraping:e.ployon).thetemperatureisintherange1 C (darkorange)to13 C(darkblue);groupoftheAiguilleduMidi(northandwestsides)isdelimited. 107
111 PermaNET CasestudiesintheEuropeanAlps Thecombinationofprocessunderstanding,statisticalanalysesand/ormodelling(e.g.numerical modelling of water flow in rock fractures) will help to improve our understanding of the characteristics of the mountain permafrost degradation. Secondly, we are interested in how a reductionintheuncertaintyofdata,processunderstandingandmodelsmaycontributetoour predictive skill of corresponding effects. This longterm monitoring and modelling approach at AiguilleduMidiwillbeastrongsupporttotakeintoaccountfuturethermalresponseofrockwall permafrosttopredictedclimatechangeinthenext50yearsanditsgeomorphicconsequences. 3. Possiblefuturethermalresponsetopredictedclimatechange Assuggestedinchapter2,frostdays,icedaysandfreezethawdayshavebeencomputedusingthe availableairtemperaturedatasetofthesouthfaceofaiguilledumidi(table2a).referringtomaps andpredictionsinchapter2,theairtemperaturemeasurementsconductedonbothsouthandnorth facesoftheaiguilledumidifrom2007to2010areinaccordancewiththemeansoftheperiod fortheGreatAlpineRegion(GAR).ThatisanumberofIDintherange241260andanumberof FDgreaterthan320.OnlythenumberofFTDisabovethemeaninthemeasurements(96vs.70/80 ofthemean ),probablybecausethesensorisplacedonasouthnearverticalrockwall wheredailytemperaturevariationsareverystrong,especiallyduringwinter. Thepredictionsfortheperiod inthestudyareaareadecreaseofIDrangingfrom13/16 daysperyearthatmeans232229idinsteadof245,andadecreaseoffdrangingfrom14/15days peryearthatmeans326fdinsteadof341.applyingthesescenariostothedataofthenorthface (Table2B)thenumberofIDcouldfalltoabout260daysperyearthatmeansconditionsmoresimilar tothoseobservedtodayonthesouthfaces.thesechangescouldleadtoadoublingoftheactive layerthicknessofthenorthexposedrockwallsofthealpsinthefuture,withaconsequentlyincrease ofinstabilitiesandrockfallevents. Acknowledgements. CompagnieduMontBlanc,especiallyE.Desvaux,areacknowledgedfortheir assistancetoourstudyataiguilledumidi.participationofchamonixalpineguidesm.arizzi,l. Collignon,andS.Frendo,andEDYTEMcolleaguesP.PaccardandM.LeRoy,totheSeptember2009 drillingwascrucialforitssuccess.manythanksareduetor.bölhert,s.jaillet,a.rabatel,b.sadier, S.Verleysdonkfortheirhelpandcontributions. References: DelineP.,BölhertR.,CovielloV.,CremoneseE.,GruberS.,KrautblatterM.,JailletS.,MaletE.,MorradiCellaU., NoetzliJ.,PogliottiP.,RabatelA.,RavanelL.,SadierB.,VerleysdonkS.,2009:L AiguilleduMidi(massif dumontblanc):unsiteremarquablepourl étudedupermafrostdesparoisd altitude.collection EDYTEM,8 CahierdeGéographie, KrautblatterM.,Hauck,C.,2007:Electricalresistivitytomographymonitoringofpermafrostinsolidrockwalls. JournalofGeophysicalResearch,112,F02S20,doi: /2006JF KrautblatterM.,VerleysdonkS.,FloresOrozcoA.,KemnaA.,2010:Temperaturecalibratedimagingofseasonal changes in permafrost rock walls by quantitative electrical resistivity tomography (Zugspitze, German/AustrianAlps).JournalofGeophysicalResearch,115,F NoetzliJ.,GruberS.,2009:TransientthermaleffectsinAlpinepermafrost.TheCryosphere,3,8599. NoetzliJ.,GruberS.,KohlT.,SalzmannN.,HaeberliW.,2007:Threedimensionaldistributionandevolutionof permafrosttemperaturesinidealizedhighmountaintopography.journalofgeophysicalresearch, 112,F02S13.doi: /2006JF000545: 108
112 PermafrostResponsetoClimateChange 3. CasestudiesintheEuropeanAlps 3.9 RockfallsintheMontBlancmassif,FrenchItalianAlps Citationreference DelineP.,RavanelL.(2011).Chapter3.9:CasestudiesintheEuropeanAlps RockfallsintheMont Blancmassif,FrenchItalianAlps.InKellererPirklbauerA.etal.(eds):Thermalandgeomorphic permafrostresponsetopresentandfutureclimatechangeintheeuropeanalps.permanetproject, finalreportofaction5.3.onlinepublicationisbn ,p Authors Coordination:PhilipDeline Involvedprojectpartnersandcontributors: EDYTEM,UniversitédeSavoie,France(EDYTEM) PhilipDeline,LudovicRavanel Content Summary 1. Introductionandstudyarea 2. Permafrostindicatorsandrecentthermalevolution 3. Possiblefuturethermalresponsetopredictedclimatechange References 109
113 PermaNET CasestudiesintheEuropeanAlps Summary The frequency and volumes of rockfalls as well as their triggering factors remain poorly understoodduetoalackofsystematicobservations.intheframeworkoftheprojectpermanet, thisstudycaseanalysesinventoriesofrockfallsacquiredinthewholemontblancmassifby innovativemethodsinordertocharacterizethelinkbetweenclimateandrockfalls,andto emphasizetheroleofpermafrost.intwosectorsofthemassif,thecomparisonofphotographs takensincetheendofthelittleiceageallowedtheidentificationof50rockfalls.inmostcases theserockfallsoccurredduringthehottestperiods.onanothertimescale,anetworkoflocal observersallowedthedocumentationofthe139rockfallsthatoccurredin2007,2008and2009 inthecentralareaofthemontblancmassif.furthermore,theanalysesofasatelliteimage allowedtheidentificationof182rockfallsinthewholemassifattheendofthe2003summer heatwave.formostofthoserockfalls,thepermafrostdegradationseemstobethemain triggeringfactor. 110
114 PermafrostResponsetoClimateChange 1. Introductionandstudyarea Arockfallcorrespondstothesuddencollapseofarockmassfromasteeprockwall,withavolume exceeding100m 3.Inthelasttwodecades,manyrockfallsandrockavalanches(volume> m 3 )occurredfrompermafrostaffectedrockwallsthroughouttheworld(noetzlietal.2003). Rockfallsgenerallyoccurinhardrocksalongpreexistingfractures.Inhighmountains,threemajor factors possiblycombined cantriggerrockfalls:(i)glacialdebuttressingduetoglacialretreat,(ii) seismic activity, and (iii) permafrost degradation, generating physical changes of the potential interstitialice(gruber&haeberli2007). Thecharacterizationofrockfalleventsandtheunderstandingoftheirevolutionareprerequisitesto anyresponseofmanagement.however,dataonrockfallsathighelevationarerareanditisdifficult tointerpretnonrepresentativedata(fewisolatedexamples). Started in the framework of the EU cofunded FrenchItalian PERMAdataROC project, our investigations are presently carried out within the project PermaNET. In this context, we systematicallycollectandprocesshistoricalandcurrentdataonrockfalls(ravanel2010)inorderto bettercharacterizethisprocess(triggeringconditions,frequency,andvolumes). ThefirstaimofthisstudycaseistoshowthecorrelationexistingbetweenrockfallsintheMontBlanc massifandglobalwarming.thesecondoneistohighlighttheprobablycrucialroleofthepermafrost degradationontherockfalltrigger. 2. Permafrostindicatorsandrecentthermalevolution 2.1Methods Photocomparisonapproach Written and oral evidences of rockfalls are not sufficient to accurately reconstruct the recent rockwallmorphodynamics.thephotointerpretationofaseriesofphotographsisthereforethemost appropriate method. We focus on two areas of the Mont Blanc massif with a rich existing documentation:thewestfaceofthepetitdru(3730ma.s.l.)andthenorthsideoftheaiguillesde Chamonix(3842ma.s.l.fortheAiguilleduMidi).TheproximityofthesepeakswithChamonix,their morphologyandtheirsymbolismallowarichiconographysincetheendofthelittleiceage(lia). Thefirststepconsistsinsettingupdocumentarycorpus,whichisverytimeconsuming.Nearly400 photographsofthetwostudiedareashavebeengatheredbutonlyafewdozencouldfinallybeused. Photographsarecomparedandinterpretedindifferentsteps:(i)delineationoftherockfallscars (Fig.1),(ii)determinationoftheperiodscharacterizedbymorphologicalandcolourchangescaused byrockfalls itwasoftennecessarytodiversifyandcrosscheckinformationsourcesinorderto precisedatesofcollapse,and(iii)estimationoftheinvolvedvolumes.50rockfallsoccurredinthe twoareasduringtheperiodfromtheendoftheliato2009,involvingrockvolumesrangingfrom 500to265000m 3 (Fig.2;Ravanel&Deline2008,2011). Networkofobservers,SPOT5imageandGISanalysis BesidestheinventoriesofpostLIArockfalls,itisimportanttocharacterizecurrentrockfalls.Onlya structurednetworkofobservationcoupledwithfieldworkcanallowanearcompletenessofthe inventoryofthecurrentrockfalls. 111
. Thenetworkconsistsofdozensofguides,hutkeepersandmountaineers.")
115 PermaNET CasestudiesintheEuropeanAlps Fig.1Comparisonbetweenphotographsof1862and2009ofthewestfaceoftheGrandsCharmozandthe AiguilleduGrépon,andofthenorthfaceoftheRognondesGrandsCharmoz.Yellowellipsesindicateareas affectedbyrockfallsbetweenthetwodates(ravanel&deline2011,slightlymodified). Thenetworkconsistsofdozensofguides,hutkeepersandmountaineers.Initiatedin2005,this observernetworkbecamefullyoperationalin2007.focusedonthecentralpartofthemontblanc massif,theinventoryiscarriedoutwithreportingforms,indicatingthemaincharacteristicsofthe rockfallsandtheconditionsoftheaffectedrockwall.animportantfieldworkisconductedeveryfall inordertocheckandtocompletethereportedobservations. Meanwhile, in order to compare the data obtained by the network with the exceptional morphodynamicsofthethreemonth2003summerheatwave,the2003rockfallsweresurveyedon thebaseofsupraglacialdepositsthroughtheanalysisofaspot5imageoftheentiremassiftakenat theendoftheheatwave( ,10:50gmt). Characteristicsofeachcollapsearedeterminedusingseveralmethods.Altitudeofscars,slopeangle andorientationoftheaffectedrockwalls,andthedepositareasarecalculatedinagis.because directmeasurementsofthescarvolumeswerenotpossible,theareaofthedepositswasmultiplied withanestimateoftheirthicknessesinordertoassessthecollapsedvolumes.geologicalparameters arederivedfromgeologicalmaps,andthepossiblepresenceofpermafrostwasdeterminedfroma modelofmeanannualgroundsurfacetemperature. Thenetworkofobserversallowedthedocumentationof45rockfallsin2007,22in2008and72in 2009(Fig.3),involvingrockvolumesrangingfrom100to33000m 3 (Delineetal.2008,Ravaneletal. 2010, Ravanel & Deline in press). Furthermore, the analysis of the SPOT5 image allowed the identificationof182rockfallsinthewholemassifattheendofthe2003summerheatwave(fig.4; Ravaneletal.2011). 112

 and")

116 Permafrost Response to Climate Change Fig. 2 Location of the 8 scars of the main (outlines) and secondary (stars) rockfalls at the west face of the Drus. 113


117 PermaNET CasestudiesintheEuropeanAlps Fig.3 RockfallsoccurredintheMontBlancmassifin2007(reddots),2008(yellowdots)and2009(green dots). 2.2 Linkbetweenclimateandrockfalls Todealwiththerelationshipsbetweenrockfallsandglobalwarming,wecomparedtheoccurrenceof rockfalls at the Drus and the Aiguilles of Chamonix with available climate data local and reconstructedforthealps.atthedrus,theclimaticfactor especiallythethermalone seems importantinthetriggeringofrockfallswhichoccurredaftertheendofthelia,asshownbytheir occurrenceduringthehottestperiods(fig.5;ravanel&deline2008).theclimatecontrolisalso demonstratedbytheanalysisofthe42rockfallsdocumentedonthenorthsideoftheaiguillesde Chamonixduringthesameperiod,withaverystrongcorrelationbetweenrockfallsandhottest periods.70%oftherockfallsoccurredduringthepasttwodecades,whichwerecharacterizedbyan acceleration of the global warming. Heat wave periods are particularly prone to rockfalls: the maximumrockfallfrequencyoccurredduringthe2003summerheatwave(ravanel&delinein press). 114
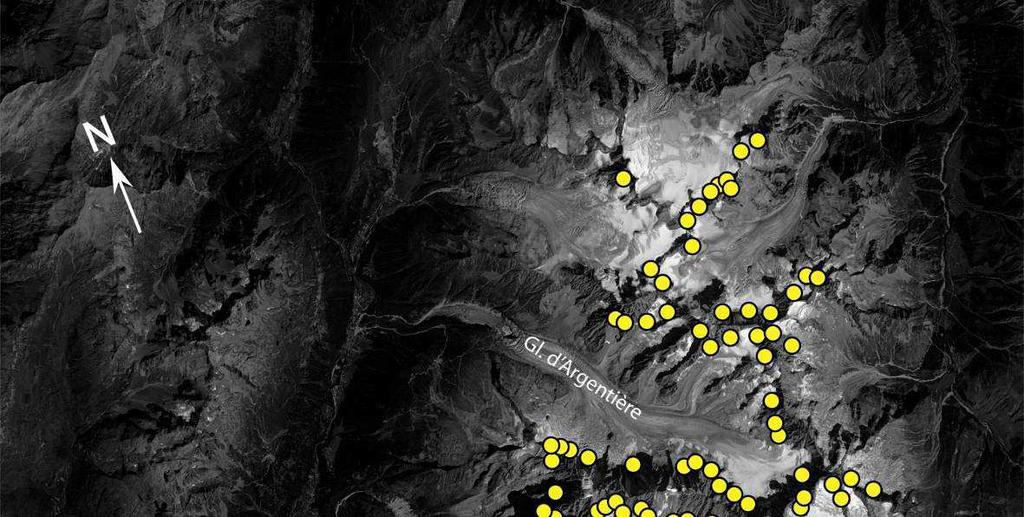


118 PermafrostResponsetoClimateChange Fig.4Locationofthe182rockfallsthatoccurredduringthehotsummer2003onthepanchromaticSPOT5 satelliteimage051/257ofthe (ravaneletal.2011,slightlymodified). 115

119 PermaNET CasestudiesintheEuropeanAlps Fig.5ChangesinChamonixmeansummertemperature,volumeandelevationofdocumentedrockfallsinthe westfaceofthedrus(afiveyearfilterhasbeenappliedtoremoveinterannualnoise).dottedquadrilaterals representthedifferentrockfalls. There is also correspondence between the 2003, 2007, 2008 and 2009 rockfalls and climatic conditions of those years in particular with temperatures (Fig. 6). 139 rockfalls have been documentedbetween2007and2009inthecentralareaofthemontblancmassif,53ofthembeing preciselydated(38%).amongthem,51rockfalls(96%)occurredbetweenjuneandseptember,i.e. duringthehottestmonthsoftheyear.the2003summerheatwave,withapositivemeandailyair Temperature (MDAT) located at very high elevation, has generated extremely active morphodynamics.intheareacoveredbythenetworkofobservers,with152rockfallsreportedin 2003outofthe182observed,2003hasbeenquiteexceptionalintermsofrockfalloccurrence.Some intensestormsduringsummer2003mayhavecausedhighfluidpressureinfracturesthattriggered rockfalls,butthisfactorremainsdifficulttoassess.finally,itisworthytonotethat38(72%)ofthe 53preciselydatedrockfallsof2007,2008and2009occurredafteraperiodofMDATwarmingofat leasttwodays(ravanel2010). 2.3 Theprobableroleofpermafrost Theroleofclimate especiallytheoneofthethermalfactor hasbeendemonstratedbythe analysis of the rockfalls documented in the Mont Blanc massif. This relation can only be fully explained by temperaturedependent factors: permafrost degradation, glacial debuttressing and evolutionofice/snowcoveronrockwalls(cryosphericfactors).thetwolastfactorsmayonlyexplain alittlepartoftherockfalls.furthermore,itissometimesdifficulttodistinguishbetweenrockfalls linked to glacial debuttressing or to ice/snow cover retreat, and rockfalls due to permafrost degradation,asbothfactorsareoftencloselyrelatedandfavouredbysummertemperatures. Secondly,topographicfactorsarehighlightingtheimportanceofpermafrostinrockfalltriggering. TheaveragerockwallselevationintheMontBlancmassifisaround3000ma.s.l.,whereasthe averageelevationofrockfallscarsof2003and is3335ma.s.l.althoughrockwallsarevery commonbelow3000ma.s.l.,theyareaffectedbyveryfewcollapses.themostaffectedaltitudinal beltis ma.s.l.,whichcorrespondstoareasof warm permafrost(closeto0 C,withfast degradation).moreover,observationsareconsistentwithpermafrostdistributionanditsevolution: (i)thehotterthesummer,thehigherthescarelevations;(ii)asharpcontrastinthescarelevations betweennorthandsouthfaces.rockfallsoccurmorefrequentlyincontextofpillars,spursand ridges,particularlyaffectedbypermafrostdegradation. 116


120 PermafrostResponsetoClimateChange Fig.6MeandailyairtemperatureattheAiguilleduMidi(3842ma.s.l.)anddailytotalrainfallatChamonix for the year Arrows indicate the days when one or several collapses occurred, with the value of temperatureandrainfallforthesedays. Finally,thepermafrostdegradationappearstobethemostlikelytriggeringfactorforseveralother reasons(ravanel2010): Almostalloftherecordedrockfalls(98%)occurredinpossibleorprobablemodelledpermafrost; Rockfallsoccurprimarilyduringsummertime,whichispronetopermafrostdegradation; Massiveicewasobservedinatleast22scarsofthe rockfalls; Summer 2003 rockfalls were unusually numerous and could mainly be explained only by permafrostdegradation(gruberetal.2004); Forthelargestidentifiedrockfalls(e.g.June2005attheDrus),theformationofadeepthaw corridorinthepermafrostmayhavepredisposedrockwallstocollapse. WhenrockfallsinhighAlpinesteeprockwallsareconsideredindividually,theroleofpermafrostin theirtriggeringisdifficulttoestablish.ontheotherhand,thisroleinthemontblancmassifis stronglysupportedbytheanalysisof:(i)the50surveyedrockfalls(ranginginvolumefrom500to m 3 )atthewestfaceofthedrusandonthenorthsideoftheaiguillesofchamonixsince 1862;(ii)the182surveyedrockfalls(ranginginvolumefrom100to65000m 3 )inthewholemont Blancmassifattheendofthe2003summerheatwave;and(iii)the139surveyedrockfallsbetween 2007and2009inthecentralpartofthemassif(ranginginvolumefrom100to33000m 3 ). 117
121 PermaNET CasestudiesintheEuropeanAlps 3. Possiblefuturethermalresponsetopredictedclimatechange Withintheglobalwarmingpredictionforthe21 th century,rockfallsfromhighalpinesteeprockwalls areexpectedtooccurmorefrequently,withvolumesthatarelikelytoincrease.thefrequencythatis currentlyincreasingshouldmaintainthesametrendinthenextdecades,duetothedeepeningof theactivelayerasthetemperatureriseabove1800ma.s.l.inthealpsforthe21 th centurywillbe higherbynearly1 Cthantheglobalone,asreportedinchapter2.Moreover,heatadvectionby triggeringofwatercirculationatdepthalongthawcorridorswouldincreasethecollapsedvolumes. Acknowledgements. AlpineguidesandhutkeepersfromChamonixandCourmayeurwhoare involvedintherockfallinventoryofthemontblancmassifsince2005arekindlyacknowledged. References: DelineP.,KirkbrideM.,RavanelL.,RavelloM.,2008:TheTrélaTêterockfallontotheglacierdelaLexBlanche (MontBlancmassif,Italy)inSeptember2008.GeografiaFisicaeDinamicaQuaternaria,31, GruberS.,HoelzleM.,Haeberli,W.,2004:PermafrostthawanddestabilizationofAlpinerockwallsinthehot summerof2003.geophysicalresearchletter,31.l13504.doi: /2004gl GruberS.,HaeberliW.,2007:Permafrostinsteepbedrockslopesanditstemperaturerelateddestabilization followingclimatechange.journalofgeophysicalresearch,112.f02s18.doi: /2006jf NoetzliJ.,HoelzleM.,HaeberliW.,2003:MountainpermafrostandrecentAlpinerockfallevents:aGISbased approachtodeterminecriticalfactors.proceedingsofthe8 th InternationalConferenceonPermafrost, Zurich,Switzerland, Ravanel L., 2010: Caractérisation, facteurs et dynamiques des écroulements rocheux dans les parois à permafrostdumassifdumontblanc.thèsededoctorat,universitédesavoie,lebourgetdulac, France,322pp. RavanelL.,DelineP.,2008:LafaceouestdesDrus(massifduMontBlanc):évolutiondel instabilitéd uneparoi rocheusedanslahautemontagnealpinedepuislafindupetitageglaciaire.géomorphologie,4, RavanelL.,DelineP.,2011:ClimateinfluenceonrockfallsinhighAlpinesteeprockwalls:thenorthsideofthe AiguillesdeChamonix(MontBlancmassif)sincetheendoftheLittleIceAge.TheHolocene,21, RavanelL.,DelineP.,inpress:Onthetriggerofrockfallsinhighalpinemountain.Astudyoftherockfalls occurredin2009inthemontblancmassif.proceedingsoftherockslopestabilityconference,paris, France. RavanelL.,AllignolF.,DelineP.,GruberS.,RavelloM.,2010:RockfallsintheMontBlancMassifin2007and 2008.Landslides,7, RavanelL.,AllignolF.,DelineP.,2011:LesécroulementsrocheuxdanslemassifduMontBlancpendantl été caniculairede2003.actesducolloque2009delassgm,olivone,suisse,
122 Citationreference 3. CasestudiesintheEuropeanAlps 3.10 CimeBianchePass,ItalianAlps PogliottiP,CremoneseE.,MorradiCellaU.(2011).Chapter3.10:CasestudiesintheEuropeanAlps Cime Bianche Pass, Italian Alps. In KellererPirklbauer A. et al. (eds): Thermal and geomorphic permafrostresponsetopresentandfutureclimatechangeintheeuropeanalps.permanetproject, finalreportofaction5.3.onlinepublicationisbn ,p Authors Coordination:PaoloPogliotti Involvedprojectpartnersandcontributors: RegionalAgencyfortheEnvironmentalProtectionoftheAostaValley,Italy(ARPAVdA) PaoloPogliotti,EdoardoCremonese,UmbertoMorradiCella Content Summary 1. Introductionandstudyarea 2. Permafrostindicatorsandrecentthermalevolution 3. Possiblefuturethermalresponsetopredictedclimatechange Reference 119
123 PermafrostResponsetoClimateChange Summary CimeBianchePass(45 55'N7 41'E)islocatedattheheadoftheValtournencheValleyinthe northeasterncorneroftheaostavalleyregion(italy)atanelevationof3100ma.s.l.twoboreholes ofdifferentdepth(6and41m)drilled30mapartindifferentmorphologicalconditionshavebeen realizedin2005andinstrumentedin2006.theactivelayerthicknessreflectsthedifferentsnow coverconditionsofthetwoboreholes:inthedeepboreholeitisalmosttwicethevalueobservedin theshallowone.thetemperatureprofilesofthedeepboreholeallowtoidentifythedepthofzero annualamplitude(zaa)atca.17m.themeanpermafrosttemperatureisabout 1.36 Cinthis depth.inthenextfutureaprobabledecreaseinthenumberofid/yearwillstronglyaffectthe groundthermalregimeleadingtoathickeningoftheactivelayer,increasingwaterpressureand permafrost degradation in the study area. All these changes will probably affect the spatial distributionofthehydrogeologicalriskinsucharegion. 120
 is located at the head of the Valtournenche Valley in the northeastcorneroftheaostavalleyregionatanelevationof3100ma.s.l.(fig.1).")
.")
124 PermafrostResponsetoClimateChange 1.Introductionandstudyarea Cime Bianche Pass (45 55'N 7 41'E) is located at the head of the Valtournenche Valley in the northeastcorneroftheaostavalleyregionatanelevationof3100ma.s.l.(fig.1).thesiteis characterizedbybarefracturedbedrocklocallymantledbyshallowcoarsedebrisdeposits.the lithologyismainlyconsistingofgarnetiferousmicaschistsandcalcschistsbelongingtotheupperpart ofthezermattsaasophiolitecomplex(dalpiazetal.1992).severalgelifluctionlobes,terracettes andsortedpolygonsoccuronthedeposits. A B Fig.1 Studyarea:(A)localizationofthestudyarea.(B)Siteoverviewandinstruments;intheforegrounda GSTgridarea(fencedbytheyellowflags)andinthebackgroundfromrighttoleft:boreholesdataloggers,GST grid datalogger, automatic weather station and related dataloggers. Skilifts of the BreuilCervinia ValtournencheZermattresortarevisibleinthebackground. 121
125 PermafrostResponsetoClimateChange Thelocalclimatecanbedefinedasslightlycontinentalwithmeanprecipitationaround1000mm/a (meanoftheperiod atthelakegoilletweatherstation,2540ma.s.l.,1.5kmfar,fig.1a left).themeanairtemperature(derivedfromplateaurosàweatherstation(3480ma.s.l.,2kmfar, Fig.1Aright)isabout3.2 Cfortheperiod (Mercallietal.2003).Themeanmonthlyair temperaturesoverthesameperiodgivepositivevaluesonlyfromjunetoseptember.februaryisthe coldestmonthandjulyisthehottestone.thesiteisverywindyandmainlyinfluencedbynortheast northwestairmasses.thecombinedeffectofirregularmorphologyandstrongwindactionleadtoa highvariabilityofsnowcoverthicknesswithinfewmeters. Thepermafrostmonitoringisperformedby: Twoboreholesofdifferentdepth(6and41m)drilled30mapartindifferentmorphological conditions(fig.1a).theshallowborehole(sh)isdrilledonaconvexcoarsedebrislandform highlysubjecttowinderosionwhichusuallyavoidstheformationofthicksnowcovers.onthe other hand the deep borehole (DP) is located in a depression where the snow tends to accumulate,assuringasnowthicknessalwaysgreaterandmoredurablethanthoseobservedin SH.TemperaturemeasurementsintheboreholestartedinJanuary2005fortheSHandin August2008forDP. AsmallGSTgridareaequippedwiththepurposetoquantifythespatialvariabilityofsurface temperatureinasmallarea.thegridhasanextensionof40x10mandisactivesincejanuary 2005.TheGSTismeasuredat5nodes:4atthegridcornersand1inthecentreofthearea.In eachnodethegroundtemperatureismeasured2and30cmbelowthesurfacewithhourly frequency.thesurfaceischaracterizedbycoarseblockymaterialslightlypendingandirregular whichgivesgreatvariabilityofsnowcoveramongthenodes(fig.1b). Thesiteisequippedwithanautomaticweatherstationforthemeasurementofsnowdepth,air temperature and relative humidity, wind speed and direction as well as radiation. The site is accessibleallovertheyear,bycablecarandskiinwinterandbyoffroadvehicleduringsummer. 2.Permafrostindicatorsandrecentthermalevolution 2.1Meteorologicalrecords Airtemperatureandsnowdeptharetheparametersthatmainlyaffectthegroundthermalregimein permafrost environments (Zhang 2005). On the study site both parameters are measured in correspondenceoftheshborehole. TheFig.2Ashowsmonthlyairtemperatureanomaliescalculatedcomparingthemonthlymeans measured at Cime Bianche Pass with longterm monthly means ( ) derived from the PlateauRosàmeteorologicalstation.Anextrapolationmethodbasedonmonthlylapserateswas usedtoshiftdownthelongtermdatasetfromtheelevationofplateaurosàtocimebianchepass. TheFig.2BshowsthemeansnowdepthoftheperiodNovember15 th June15 th overtheboreholesh for3availablehydrologicalyears. 2.2ActiveLayerThickness Theactivelayerthicknessreflectsthedifferentsnowcoverconditionsofthetwoboreholes.The combinedeffectofmorphologyandwindleadstothicksnowcoverabovethedpboreholeandathin snow cover above the SH. These morphological differences strongly affect the ground thermal regime:itfollowsthatthethicknessoftheactivelayer(alt),definedasthemaximumdepthofthe 0 Cisotherm,inthedeepboreholeisalmosttwicetheoneobservedintheshallowone.Table1 summarizesthevaluesofaltofsomeyearsobtainedbylinearinterpolationamongthemeasured temperaturesatdifferentdepths. 122

126 PermafrostResponsetoClimateChange A B Fig.2 (A):monthlyairtemperaturesfrom2006to2009comparedwithalongtermmean( )derived fromplateaurosaobservations.theverticallinesgivethestandarddeviationofthelongtermmonthlymeans. RedlinesarethemonthlymeansmeasuredatCimeBianchePass.(B)meanseasonalsnowdepthabovethe boreholeshcalculatedovertheperiodnovember15 th June15 th. 123


127 PermafrostResponsetoClimateChange A B Fig.3 Maximumdailygroundtemperaturevs.timeintheSH(A)andDP(B)boreholes.Theblacklineisthe 0 Cisotherm.Notethatyaxeshavedifferentranges. 124
128 PermafrostResponsetoClimateChange Table1 Valuesofthemaximumactivelayerthickness(ALT)inthetwoboreholesatCimeBianchePassand dayoftheyearinwhichthevaluehasbeenreached. ActiveLayerThickness(ALT)(m) OccurrencedayofmaximumALT Hydrological Shallow Deep Shallow Deep Year Borehole Borehole Borehole Borehole 2005/ October7 th 2006/ October11 th 2007/ September30 th September27 th 2008/ October22 th October17 th Comparingthecontourplotsofbothboreholes(Fig.3)withthesnowdepthmeasuresofFig.2B,a goodcorrelationbetweenthemeanseasonalsnowdepthandtheactivelayerthicknesscanbeseen. Thedifferenceintheactivelayerthicknessfrom2008to2009inbothboreholesshowsthesame behaviour:2009maximumdepthhasanincreaseofabout1mcomparedto2008,duetothe exceptionalsnowfallsofthewinterseason2008/09whichleadtoimportantsnowcoverthroughout thewinteronbothboreholes. 2.3PermafrostTemperature Thetemperatureprofilesofthedeepboreholeallowtoidentifythedepthofzeroannualamplitude (ZAA)ataround17m.Themeanpermafrosttemperatureatthisdepthisabout1.36 C(Fig.4A).The thermaloffset,definedinaccordancetoromanovsky&osterkamp(1995)asthedifferencebetween TTOP(meanannualpermafrostsurfacetemperature)andMAGST(meanannualgroundsurface temperature),seemsquitevariablefromyeartoyear.theavailablevaluesforbothboreholesare reportedintable2. Table2 Valuesofthermaloffsetintheboreholes.MAGSTiscalculatedusingthenodeat 2cmfromthe groundsurface.ttopiscalculatedatthedepthofalt(table1)bylinearinterpolationamongthemeanannual temperaturesofthefirstnodeaboveandfirstnodebelowthealtvalue. Hydro.Year MAGST ( C) ShallowBorehole TTOP ( C) ThOffset ( C) MAGST ( C) DeepBorehole TTOP ( C) ThOffset ( C) '08' '09' Fig.4showstheboreholetemperatureprofilesatspecificdaysoftheyear.Meandailytemperature profileof1 st Aprilarerepresentativeofgroundtemperaturesattheendofthewinterseasonwhile thoseof1 st Octoberarerepresentativeofgroundtemperaturesattheendofthehydrologicalyear neartheoccurrenceofthemaximumalt. Theeffectofdifferentsnowamountduringthewinterseasonisclearlyreflectedinthe1 st April profiles of borehole SH. The profiles differ very much from each other with the colder ones corresponding to the less snowy years. The great differences at the end of the winter are systematicallylevelledduringthespring/summerperiod,indeedthe1 st Octoberprofilesdifferless fromeachother.fromthebeginningofthemeasuresthehydrologicalyear2007/08showsthe coldestgroundtemperatureprofilesandshalloweralt(table1).thisresultsfromacombinationof 125
129 PermafrostResponsetoClimateChange scarcesnowaccumulationandsummerairtemperaturearoundthemean(fig.2).incontrastthe seasonswhichshowwarmergroundtemperatureprofilesanddeeperaltarethosewithabundant snowduringthewinterandairtemperatureabovethemeanduringthewintersummerperiod.this ismainlytrueforthehydrologicalyear2008/09whilein2005/06thequitecoldgroundtemperature profile of April is completely overhung by the extremely warm spring/summer All these considerationssuggestthatevenifwinterconditionsarestronglyfavourabletogroundcoolingthey are often not enough to restrain the effect of very hot springsummer conditions on ground temperatures. A B Fig.4 GroundtemperatureprofilesovertheSH(A)andDP(B)boreholesatspecificdaysattheendofwinter andsummerseasons. 126
130 PermafrostResponsetoClimateChange 3.Possiblefuturethermalresponsetopredictedclimatechange Assuggestedinchapter2,frostdays(FD),icedays(ID)andfreezethawdays(FTD)havebeen computedusingtheairtemperaturedatasetofthecimebianchepassovertheavailableyearsof observation(table3). Table3 Frostdays(FD),IceDays(ID)andFreezeThawDays(FTD)occurrenceattheCimeBianchesiteduring theavailablehydrologicalyears(october1 st November30 th ).Thelastcolumnreportsthemeanvalueofthe period. 2006/ / / /10 Mean MAAT ( C) FD ID FTD Referringtothemapsandpredictionsofchapter2,theairtemperaturemeasurementsconductedat CimeBianchePassfrom2006to2010areinaccordancewiththemeansoftheperiod computedforthegreatalpineregion(gar).thatisanumberofidintherangeof261280,a numberoffdintherangeof181200andanumberofftdintherangeof8090.thepredictionfor theperiod inthestudyareaareadecreaseofidrangingfrom 15/16days/yearthat means172idinsteadof187andadecreaseoffdrangingfrom15/16days/yearthatmeans264fd insteadof279. Comparing the data of Table 3 and plots of Figure 3 year by year, it is evident that the air temperature is not the only factor controlling the ground temperatures. In fact, as already highlighted,thesnowcoverplaysakeyrole.despitethis,lookingatthehydrologicalyear2006/07a clearcorrelationbetweenwarmerairtemperatureanddeeperaltexists.lookingattable3itis interestingtonotethatthenumberofidisthemostaffectedvaluebythisanomalouswinter. ProbablyafuturedecreaseinthenumberofID/yearwillstronglyaffectthegroundthermalregime leadingtoathickeningofthealt,increasingwaterpressureandpermafrostdegradation.allthese changeswillprobablyaffectthespatialdistributionofthehydrogeologicalriskinsucharegion. References: DalPiazG.etal.,1992:LeAlpidalMonteBiancoalLagoMaggiore.GuideGeologicheRegionaliacuradella SocietàGeologicaItaliana,3/II,211pp. MercalliL.,CastellanoC.,CatBerroD.,DiNapoliG.,MontuschiS.,MortaraG.,RattiM.&GuindaniN.,2003: AtlanteClimaticodellaValled'Aosta.EditionsSMS,405pp. ZhangT.,2005:Influenceoftheseasonalsnowcoveronthegroundthermalregime:anoverview.Reviewof Geophysics,43:RG
131 PermafrostResponsetoClimateChange RomanovskyV.E.&OsterkampT.E.,1995:Interannualvariationsofthethermalregimeoftheactivelayerand nearsurfacepermafrostinnorthernalaska.permafrostandperiglacialprocesses,6,
132 PermafrostResponsetoClimateChange 3. CasestudiesintheEuropeanAlps 3.11 Maroccarorockglacier,ValdiGenova,ItalianAlps Citationreference SeppiR.,BaroniC.CartonA.,Dall AmicoM.,RigonR.,ZampedriG.,ZumianiM.(2011).Chapter3.11: CasestudiesintheEuropeanAlps Maroccarorockglacier,ValdiGenova,ItalianAlps.InKellerer PirklbauerA.etal.(eds):Thermalandgeomorphicpermafrostresponsetopresentandfutureclimate changeintheeuropeanalps.permanetproject,finalreportofaction5.3.onlinepublicationisbn ,p Authors Coordination:RobertoSeppi Involvedprojectpartnersandcontributors: UniversityofPavia RobertoSeppi UniversityofPisa CarloBaroni Mountaineeringsrl MatteoDall Amico UniversityofTrento RiccardoRigon GeologicalSurvey,AutonomousProvinceofTrento GiorgioZampedri Geologist MatteoZumiani Content Summary 1. Introductionandstudyarea 2. Permafrostindicatorsandrecentthermalandgeomorphicevolution 3. Possiblefuturethermalandgeomorphicresponsetopredictedclimatechange References 129
133 PermaNET CasestudiesintheEuropeanAlps Summary In2001westartedatopographicstudyonanactiverockglacier(namedMaroccarorockglacier, acronymmarg,coordinates: N, E)locatedintheAdamelloPresanella massif(centralitalianalps).since2004,alsothenearsurfacegroundtemperaturewasmeasured usingaminiaturedatalogger.ourdatashowthatineightyears( )marghasmoved downslopewithaveragevelocitiesrangingfrom0.02to0.21m/year.thevelocityreachesa maximuminthemiddleandthelowerpartoftherockglacier,anddecreasestowardstheupper sector,wherethesurveyedbouldersarealmoststationary.aconsiderabledifferentvelocityfrom yeartoyearhasbeenobserved,butnocleartrendsseemtoemergefromthemeanannual displacementrate.ontherockglaciertheevolutionofthegroundtemperaturesince2004is directlyassociatedwiththeairtemperatureandthesnowconditions,intermsofthicknessand durationofthesnowpack.thegroundhaswarmedsignificantlybothin2007,afteraverymild and little snowy winter, and in 2009, after a cold but exceptionally snowy winter. The displacement rate of MaRG seems to rapidly react to the ground temperature variations, apparentlywithoutanytimedelay.theexceptionallysnowywinter2008/09seemstohave playedasignificantroleonthedisplacementrate,causingagroundtemperatureincreaseand, probably,anincreaseinvelocity,whichreacheditsmaximuminthatyear. 130
134 PermafrostResponsetoClimateChange 1. Introductionandstudyarea IntheAdamelloPresanellaGroup(CentralItalianAlps),anactiverockglacier(MaRG)locatedinVal Genova has been selected for carrying out multitemporal topographic surveys (Fig. 1). The measurements aim at studying its surface displacement rate and its dynamic behaviour. The displacementratesoftherockglacierarecomparedwiththenearsurfacethermalregimeofthe groundandwiththemajorclimaticparameters,inordertoinvestigatethepotentialrelationships betweenitsdynamicbehaviourandthelocalclimaticconditions.thisrockglacierisincludedinan inventorypublishedbybaronietal.(2004),inwhichithasthenumber41andisalsobriefly described. Fig.1 GeographicalsettingofthestudyareawithrockglacierMaRGandautomaticweatherstations(AWS) Thetopographicmeasurementsstartedin2001andhavebeenrepeatedinlatesummerofthe followingyears(2002,2004,2006,2007,2008and2009).ontherockglaciersurface,amonitoring networkof25largebouldersmarkedwithsteelboltshasbeenestablishedandalasertheodolitehas beenusedforperformingthesurveys.formonitoringthenearsurfacetemperatureoftheground,a miniaturetemperaturedatalogger(utl1,accuracy:±0,25 C;Hoelzleetal.1999)hasbeenplacedin 2004fewcentimetresbelowthesurface,inaplacewerefinegrainedmaterialoutcrops.Detailed meteorologicaldata(i.e.airtemperatureandsnowthickness)coveringthefullmonitoringperiodare availablefromtwohighaltitudeautomaticweatherstations(aws)locatednearthestudiedrock glacier(cimapresena,3015ma.s.l.,andcapannapresena,2730ma.sl.). MaRGisatongueshaperockglacier,about280mlongand100mwide.Itfacessouthwestandits lowerpart(topedgeofthefrontalslope)reachesanaltitudeof2760ma.s.l.(fig.2).thesurfaceof MaRGdoesn tdisplaythetypicalmorphologicalfeaturesofactiverockglaciers,suchaslongitudinal andtransversalridges,furrowsandhollows.margiscomposedoftalusmaterialcomingfromthe shatteredrockwallssituatedabove,andnofieldevidencesoflittleiceageglaciationarepresentin 131
,andfinegrainedrockmaterialoutcropsonlyonthesteep frontalandlateralslopes.")
 On this rock glacier, BTS measurements carried out in late March 2003 recorded very cold temperatures,consistentwiththepresenceofafrozencoreintothedebrisdeposit.")

.Onthisrockglacier,thetotaldisplacementrangesbetween0.")
135 PermaNET CasestudiesintheEuropeanAlps itsrootingarea.itisalmostcompletelycoveredbylargeandveryangularboulders(fromfew decimetrestosomemetersindiameter),andfinegrainedrockmaterialoutcropsonlyonthesteep frontalandlateralslopes.accordingtothedefinitiongivenbybarsch(1996),margcanbedefinedas atalusrockglacier. Fig.2 GeneralviewofMaRG.Theelevationatthefrontisabout2760ma.s.l.,thehighestpeaksinthe backgroundreachelevationsofabout3000ma.s.l.photographybyr.seppi( ) On this rock glacier, BTS measurements carried out in late March 2003 recorded very cold temperatures,consistentwiththepresenceofafrozencoreintothedebrisdeposit.thebtsvalues rangedbetween2.1 Cand6.1 C(averagevalueof23measurementpoints:4.2 C)andtheaverage thicknessofthesnowpackwas230cm.thetemperatureofaspringemergingfromthebottomof thefrontalslopeisalsoundermeasurementssince2004.thewatertemperaturemeasuredduring thelatesummerseasonisconstantlybelow1 C,indicatingfurthermorethepresenceofpermafrost intherockglacier. 2. Permafrostindicatorsandrecentthermalandgeomorphicevolution Fig.3showsthetotalhorizontaldisplacementofMaRGinthefullperiodofmeasurements( ).Onthisrockglacier,thetotaldisplacementrangesbetween0.12m(boulder19)and1.67m (boulder2),correspondingtoavelocityof0.02and0.21m/year,respectively(table1).thesurveyed bouldersmovedalongthemaximumgradientoftheslopeinaratherhomogeneouspattern.the velocityreachesamaximuminthemiddleandthelowerpartofthelandform,anddecreases towardstheuppersector,wheretheslowestboulders(18,19and20)arelocated.afterthesecond survey(2002)theboulder3felldownfromthefrontalslope. 132
136 PermafrostResponsetoClimateChange ThemeandisplacementofMaRGinallthemeasurementintervalsisshowninFig.7(topgraph), whereallthesurveyedbouldersoftherockglacierhavebeentakenintoaccount.theaverage velocityissignificantlyvariablefromyeartoyear,rangingfromaminimumof0.08m/year( ) to a maximum of 0.17m/year ( ). No clear trends seems to emerge from the evolution of the mean annual displacement. The interannual variability of the velocity and an acceleratingtrendhavebeenrecentlyreportedforseveralrockglaciersintheeuropeanalps(roeret al.2005,delaloyeetal.2008,permos2009,bodinetal.2009). Table1 HorizontaldisplacementsofMaRG.Thefirstsixcolumnsshowthedisplacementforeachperiodof measurements,thecolumnseventhetotaldisplacement,andthecolumneighttheannualdisplacementrate. (*)Measurementperiodoftwoyears;(**)Thebouldernumber3fellfromthefrontalslopeafter2002. Boulder ID Horizontaldisplacement(m) (*) (*) total horizontal displacement (m) horizontal displacement rate (m/yr) (**) ThenearsurfacetemperatureofthegroundrecordedonMaRGfromAugust2004toAugust2009is showninfig.4(bottomgraph).inthisfigurethegroundtemperature(dailymean)isassociatedto theairtemperature(centralgraph)andtothethicknessofthesnowcover(topgraph),recordedat twometeorologicalstationslocatedabout1kmfromtherockglacier(cimapresenaawsand CapannaPresenaAWS). Focusingonthegroundthermalregimeduringwinter,thecoldesttemperatureswererecordedin the and winter seasons. During the first winter, the ground reached a minimumtemperatureofabout10 CinlateFebruary,andastrongwarmingfollowedinMarchdue 133
137 PermaNET CasestudiesintheEuropeanAlps toanearlystartingofthesnowmelt.inthewinterof ,thegroundcooledveryquickly towardstheminimumvaluesofabout8 C.Thestrongcoolingofthegroundinthesetwowinters maybeduetothecombinedeffectofcoldairtemperatureandrelativelythinsnowpackinautumn andearlywinter.inthetwofollowingwinters,thegroundtemperaturewaswarmerandreacheda phaseofwinterequilibriumtemperature(weqt)ofabout5 C.Thewinter wasverymild andthesnowpackwasrelativelythinuntilmidwinter,whilethefollowingwinterwascolderand snowier. Fig.3 Totalhorizontaldisplacement( )ofMaRG. Fig.4 Topandmiddlegraphs:snowthicknessandairtemperatureatCapannaPresenaautomaticweather station;bottomgraph:groundnearsurfacetemperaturefromaugust2004toaugust2009formarg.for locationoftemperaturedataloggerrefertofig

,computedasthecumulativevalueofthenegativedailymean groundtemperaturesbetween1 st Octoberand30 th June,isshowninFig.5.")
.")
138 PermafrostResponsetoClimateChange Withrespecttothepreviousyears,thegroundtemperaturewascomparativelywarmerduringthe winterseason,andreachedarelativelyshortWEqTofabout4 C.Althoughinthiswinter theairtemperaturewasnotparticularlymildcomparedtotheprecedingones,thesnowpackalready reachedasignificantthicknessinautumnandearlywinter,preventingthecoolingoftheground. Moreover,thesnowpackfurtherthickenedinthefollowingwintermonths.Thisunderlinesthe strongcontrolofthesnowcoveronthewintertemperatureofthegroundand,consequently,onthe meanannualgroundtemperature. TheGroundFreezingIndex(GFI),computedasthecumulativevalueofthenegativedailymean groundtemperaturesbetween1 st Octoberand30 th June,isshowninFig.5.Thelowestvalueswere recorded in the winter and (1197 Cday and 1052 Cday, respectively). Despiteathinandlateappearedsnowcoverinwinter ,theGFIwaslessnegativethanthe previousandthefollowingwinter,probablybecauseoftherelativelyhighairtemperature(seecima PresenaAWSinFig.4).ThehighestGFI(471 CDay)sincethebeginningofthemeasurementswas recordedinwinter ,whenaverythicksnowpackwaspresentontherockglaciersincethe middleofautumn. Fig.5 Annualgroundfreezingindex(GFI)atMaRGfrom2004to2009. TheeffectofthesnowcoveronthegroundtemperaturecanbeobservedinFig.6.Inthegraph,the evolutionofthemeanannualairtemperature(maat)atcimapresenaawsandtheevolutionofthe mean annual ground temperature at MaRG are compared on the same period of time. The temperaturesaredisplayedas12monthsrunningmeans,andthedateonthexaxiscorrespondsto theendoftheperiodusedforthecalculation.themeangroundtemperatureonmargranged between0 Cand2 Cintheperiodofmeasurements(mid2005tomid2009),reachingthehighest valuesin2007andin2009.thefirstwarmingphase(2007)occurredafterawinterseasonthatwas verymildandwithlittlesnow,whilethesecond(2009)followedanexceptionallysnowywinterwith relativelycoldairtemperature.onthisrockglacier,theevolutionofthegroundtemperatureseems tobewellcorrelatedwiththemaat,atleastuntil2008.infact,thestrongwarmingoftheground observedin2009ismoreduetoaneffectofthethicksnowcoverofthepreviouswinterthantoa correspondingwarmingintheairtemperature. 135
139 PermaNET CasestudiesintheEuropeanAlps Fig.6 EvolutionofthemeanannualairtemperatureatCimaPresenaautomaticweatherstation(topgraph) andofthenearsurfacegroundtemperatureatmarg(bottomgraph).allthetemperaturesaredisplayedas12 monthsrunningmeans,andthedateonthexaxiscorrespondstotheendoftheperiodusedforthecalculation. InFig.7alltheobservationscarriedoutonMaRGaresummarized.Thetopgraphshowsthemean annualdisplacementsince2001andhasbeendescribedabove.theintermediategraphshowsthe meanannualnearsurfacetemperatureoftheground,andthebottomgraphreportsthemean annualairtemperatureatcimapresenaaws.inordertoemphasizethecontributionofthewinter seasons,thevaluesofthemeanannualtemperature(bothforthegroundandfortheair)havebeen calculatedtakingintoaccountanannualbasisextendingfromthe15 th Augustofthepreviousyearto the14 th Augustofthefollowingyear.Forthisreason,anextremelywarmsummerlike2003isnotas wellvisibleinthedatarecordasamildwinterlike Fig.7 MeandisplacementofMaRG(topgraph)comparedwiththemeanannualgroundtemperature(middle graph)andthemeanannualairtemperatureatcimapresenaautomaticweatherstation(bottomgraph). 136

140 PermafrostResponsetoClimateChange Fig.8 Potentialchangeoffrost,iceandfreezethawdaysfor ,asproposedinchapter2.The locationofmargisshown. 137
141 PermaNET CasestudiesintheEuropeanAlps The displacement of the MaRG seems to react rapidly to the ground temperature variations, apparentlywithoutanytimedelay.inthelastthreeyears,indeed,highergroundtemperatures correspondratherwellwithhigherdisplacementvelocities,asclarifiede.g.intheyear in thisyear,therockglacierhasmovedfasterthaninthepreviousandinthefollowingyears,inclose relationwiththehighermeantemperatureofthegroundthatwasslightlyabove0 C.Inthelastyear of measurements ( ) MaRG reached the highest velocity since the beginning of the observations.thisaccelerationcorrespondswithameangroundtemperaturethatapproachedagain 0 C,buttheeffectseemstobeamplifiedbythesnowcover.Infact,theexceptionallysnowywinter of couldhaveplayedaroleindeterminingthedisplacementrate,probablybecauseofthe longmeltingphaseofthesnowcoverassociatedtothelongzerocurtainphaseofthegroundthat characterizedmarg(fromearlymaytolatejuly;seefig.4,bottomgraph).thelongmeltingphase couldhaveinducedaprolongedinfiltrationofmeltwaterintotheactivelayerand,possibly,intothe frozencoreoftherockglacier,causingtheobservedacceleration.asimilareffecthasrecentlybeen observedanddescribedbyikedaetal.(2008)onarockglacieroftheswissalps. 3. Possiblefuturethermalandgeomorphicresponsetopredictedclimate change Accordingtotheanalysesinchapter2,somespeculationsonthefutureevolutionofMaRGcanbe done.intheareawheremargislocated,themodelledaveragenumberoffrostdaysintheperiod rangesbetween280and300peryear,andthepredictedchangefor showsa decreaseof15/16days/year.inthesameareaandthesameperiod,theaveragenumberoficedays isbetween201and220peryear,withapredicteddecreaseof17/19days/yearfor Regardingtheaveragenumberoffreezethawdays,ithasbeenmodelledasrangingbetween70and 80peryearinthe30yearreferenceperiod,andanincreaseof3/4days/yearispredictedfor InFig.8thelocationofMaRG(whitedot)onthemapsofthepredictedchangeinfrost,iceand freezethawdaysisdisplayed.somechangesinthedynamicresponseofmargtoclimatechange canbeexpected,becauseofthecloserelationshipbetweenitsbehaviourandtheclimaticvariables. However, an assessment of its future evolution should carefully take into account the future evolution of the precipitation (amount and distribution) and not only the predicted rise in air temperature. Acknowledgements. Mauro Degasperi and Franco Crippa (Geological Survey, Autonomous ProvinceofTrento)conductedthetopographicsurveysandprocessedtheroughtopographicdata. FieldcollaborationwasprovidedbyLucaCarturan,StefanoFontanaandDavideTagliavini.Thiswork waspartlyfundedbytheprin2008project ClimateChangeeffectsonglaciers,onglacierderived waterresourceandonpermafrost:quantificationoftheongoingvariationsintheitalianalps. References: BaroniC.,CartonA.&SeppiR.,2004:DistributionandbehaviourofrockglaciersintheAdamelloPresanella Massif(ItalianAlps).PermafrostandPeriglacialProcesses,15, Barsch D., 1996: Rockglaciers: Indicators for the Present and Former geoecology in High Mountain Environments.Springer,Berlin,331pp. 138
142 PermafrostResponsetoClimateChange BodinX.,ThibertE.,FabreD.RiboliniA.,SchoeneichP,FrancouB.,LouisReynaudL.&FortM.,2009:Two DecadesofResponses( )toClimatebytheLaurichardRockGlacier,FrenchAlps.Permafrost andperiglacialprocesses,20, DelaloyeR.,PerruchoudE.,AvianM.,KaufmannV.,BodinX.,IkedaA.,HausmannH.,KääbA.,Kellerer PirklbauerA.,KrainerK.,LambielC.,MihajlovicD.,StaubB.,RoerI.&ThibertE.,2008:Recent interannualvariationsofrockglacierscreepintheeuropeanalps.proceedingsofthe9 th International ConferenceonPermafrost(NICOP),UniversityofAlaska,Fairbanks,June29July3,2008, HaeberliW.,HalletB.,ArensonL.,ElconinR.,HumlumO.,KaabA.,KaufmannV.,LadanyiB.,MatsuokaN., SpringmanS.&VonderMühllD.,2006:Permafrostcreepandrockglacierdynamics.Permafrostand PeriglacialProcesses,17, HoelzleM.,WegmannM.&KrummenacherB.,1999:Miniaturetemperaturedataloggersformappingand monitoringofpermafrostinhighmountainareas:firstexperiencefromtheswissalps.permafrostand PeriglacialProcesses,10, KääbA.,FrauenfelderR.&RoerI.,2007:Ontheresponseofrockglaciercreeptosurfacetemperatureincrease. GlobalandPlanetaryChange,56, IkedaA.,MatsuokaN.&KääbA.,2008:Fastdeformationofperenniallyfrozendebrisinawarmrockglacierin theswissalps:aneffectofliquidwater.journalofgeophysicalresearch113,f PERMOS,2009:PermafrostinSwitzerland2004/2005and2005/2006.Noetzli,J.,Naegeli,B.,andVonder Muehll,D.(eds.),GlaciologicalReportPermafrostNo.6/7oftheCryosphericCommissionoftheSwiss AcademyofSciences,100pp. RoerI.,KääbA.&DikauR.,2005:RockglacieraccelerationintheTurtmannvalley(SwissAlps) probable controls.norwegianjournalofgeography,59,
143 PermaNET CasestudiesintheEuropeanAlps Citationreference 3. CasestudiesintheEuropeanAlps 3.12 Amolarockglacier,Vald Amola,ItalianAlps SeppiR.,BaroniC.CartonA.,Dall AmicoM.,RigonR.,ZampedriG.,ZumianiM.(2011).Chapter3.12: Case studies in the European Alps Amola rock glacier, Val d Amola, Italian Alps. In Kellerer PirklbauerA.etal.(eds):Thermalandgeomorphicpermafrostresponsetopresentandfutureclimate changeintheeuropeanalps.permanetproject,finalreportofaction5.3.isbn , p Authors Coordination:RobertoSeppi Involvedprojectpartnersandcontributors: UniversityofPavia RobertoSeppi UniversityofPisa CarloBaroni Mountaineeringsrl MatteoDall Amico UniversityofTrento RiccardoRigon GeologicalSurvey,AutonomousProvinceofTrento GiorgioZampedri Geologist MatteoZumiani Content Summary 1. Introductionandstudyarea 2. Permafrostindicatorsandrecentthermalandgeomorphicevolution 3. Possiblefuturethermalandgeomorphicresponsetopredictedclimatechange References 140
144 PermafrostResponsetoClimateChange Summary Topographicmeasurementsareinprogresssince2001onaglacierderived,activerockglacier (namedamolarockglacier,acronymamrg,coordinates: N, E)locatedin theadamellopresanellagroup,centralitalianalps.inaddition,dataonthegroundtemperature measuredfewcentimetresbelowthesurfaceareavailablesince2004.thedisplacementdata showthatsomeareasoftherockglaciercurrently( )movewithvelocitiesrangingfrom 10to20cm/year,whileothersectorscanbedefinedas dynamicallyinactive.theaverage velocityissignificantlyvariablefromyeartoyear,rangingfromaminimumof0.06m/year( )toamaximumof0.13m/year( ),andaslowingtrendhasbeenrecordedinthe lasttwoyears.in ahigherrateofdisplacementseemstoberelatedtoariseinthe meanairtemperaturethatprobablycausedacorrespondingriseinthegroundtemperature. However,inthelastyearofmeasurements( ),anincreaseinthegroundtemperature causedbythelargeamountofsnowoftheprecedingwinter,didnotresultinacorresponding increaseofthedisplacementrate.thedynamicbehaviourofthisrockglacierreactsveryfastto theexternalforcing,anditsresponseseemstobemodulatedbytheamountandevolutionofthe snowduringwinter,duetoitseffectonthegroundtemperature.thus,notonlythetemperature butalsotheprojectedchangesintheamountanddistributionofprecipitation,especiallyas snow,shouldbetakenintoaccountinassessingtheresponseofthislandformtofutureclimate change. 141
145 PermaNET CasestudiesintheEuropeanAlps 1. Introductionandstudyarea Activerockglaciersoriginatefromthecreepofperenniallyfrozendebris(i.e.permafrost)andmove downslopewithtypicalvelocitiesrangingfromfewcmtomorethan1mperyear.thesurface displacementofactiverockglaciersismarkedlyvariablefromyeartoyear,andintheeuropeanalps arecentspeedinguptrendhasbeenunderlinedonsomelandforms(roeretal.2005,haeberlietal. 2006,Delaloyeetal.2008,PERMOS2009).Theinterannualvariabilityofthesurfacevelocityseems toberelatedtotheclimaticfactorsinfluencinggroundsurfacetemperatureofthedeposits,suchas theairtemperature,thethicknessanddurationofthewintersnowcoverandtheprocessesofwater infiltration(kääbetal.2007,ikedaetal.2008;bodinetal.2009) In 2001 we choose an active rock glacier located in Val d Amola for performing topographic measurements,inordertostudyitssurfacedisplacementrateandthepotentialvelocityvariations (Fig.1).Thisrockglacierisoneoftheactivelandformsincludedintherockglacierinventoryofthe AdamelloPresanellamassif(Baronietal.2004),whereithasthenumber51andisalsobriefly described.themeasurementshavebeencarriedoutusingalasertheodoliteandafterthefirst surveyhavebeenrepeatedinthelatesummer/earlyautumnofthefollowingyears(2002,2004, 2006,2007,2008,2009).ThesurveyswereconductedeveryyearbetweenearlySeptemberandmid October.Onthesurfaceoftherockglacier,amonitoringnetworkof25largebouldersmarkedwith steelboltshasbeenestablished. Fig.1 GeographicalsettingofthestudyareawithrockglacierAmRGandautomaticweatherstations(AWS) In2004wealsostartedtomeasurethetemperatureofthegroundfewcentimetresbelowthe surface,usingaminiaturetemperaturedatalogger(utl1,accuracy:±0,25 C;Hoelzleetal.1999) placedinfinegraineddebrisonthelowerpartoftherockglacier.thedataloggerhadamalfunction in2006andstoppedtocollectdatabetweenmarchandaugust2006.inordertocomparethe groundtemperaturewiththeairtemperatureandtheevolutionofthewintersnowcover,weused 142
(fig.2).")

.")

146 PermafrostResponsetoClimateChange themeteorologicaldataoftwohighaltitudeautomaticweatherstations/aws(cimapresenaaws, 3015ma.s.l.,andCapannaPresenaAWS,2730ma.sl.)locatedabout10kmfromtherockglacier. AmRGisatongueshaperockglacierlocatedinanorthfacingglacialcirque,betweenanupper altitudeof2480ma.s.l.andaloweraltitudeof2360ma.s.l.(topedgeofthefrontalslope)(fig.2).it isabout530mlongand250mwideandshowsadistinctivesetoflongitudinalandtransversalridges onitssurface.initsintermediateanduppersector,awidehollowlocatedbetweentwoelongated longitudinalridgesispresent,whilethecompressiveridgescanbemainlyobservedinitslowerarea. Therockglaciersurfaceismostlycomposedofmatrixfree,largeandveryangulargraniteboulders (uptosomemetersindiameter),whilethefinegrainedmaterialfrequentlyoutcropsnotonlyonthe lateralandfrontalslopes,butalsoonthetopofthelongitudinalandtransverseridges.intherooting area of the rock glacier, snow patches are present over the whole summer only in the most favourableyears(i.e.withalargeamountsofsnowduringtheprecedingwinter). Fig.2 GeneralviewofAmRG.Theelevationatthefrontisabout2300ma.s.l.,thehighestpeaksinthe backgroundreachelevationsofabout2700ma.s.l.photographybyr.seppi( ). Fieldevidences,confirmedbyhistoricalmaps,showthatacirqueglacierwaspresentintherooting areaoftherockglacierduringandafterthelittleiceage.thislittleglacierisstillreportedina 1:75.000mapof1903,whileinmorerecentmaps(e.g1:25.000mapof1973)thecirqueisindicated withoutaglacier.thematerialcomposingthisrockglacierisprobablyofdifferentorigin,butglacial tillseemsprevailing.therefore,thislandformisdevelopingfromglacialdepositsandthuscanbe defined,accordingtothedefinitionofbarsch(1996),asadebrisrockglacier. 143

147 PermaNET CasestudiesintheEuropeanAlps SeveralspringsemergeatthebaseofthefrontalslopeofMaRG.Besidetheotherinvestigations,in 2004westartedtomeasurethetemperatureofthewater,inordertogetadditionalinformationon thepresenceofafrozencorewithintherockglacier.thewatertemperaturewasmeasuredseveral timesduringsummerusingahandheldthermometerandcontinuouslyfromearlyaugusttolate September2004usingdataloggers(HoboH8Temp,accuracy:±0,4 C). 2. Permafrostindicatorsandrecentthermalandgeomorhicevolution Thewatertemperaturethatwasmonitoredcontinuouslyinlatesummer2004showedverycold values(below1 C).Therefore,thisdatasupportthepresenceofpermafrostintherockglacier (Fig.3). Fig.3 Watertemperatureofaspring(SLC7)emergingfromAmRGcontinuouslymeasuredbetweenAugust andseptember2004.thelocationofthespringisindicatedinfig.4. The total displacement ( ) of AmRG ranges between 0.05m (boulder 9) and 1.60m (boulder15),correspondingtoavelocityof0.01and0.20m/year,respectively(fig.4andtab.1). Thefrontalareaofthisrockglaciershowsaverydifferentbehaviour,withanactivesector(boulders 1to6)closetoasectorthatcanberegardedasdynamicallyinactive(boulders7to11).Similarly,the rightsideoftherockglacier(boulders12to20)ismoreactivethanthemiddleandtheleftsectors (boulders21to25).thesurveyedboulderslocatedonthelongitudinalridgemovetowardthecentre ofthelandform,whereawidehollowispresent. ThemeandisplacementofAmRGinallintervalofmeasurementsisshowninFigure8(topgraph), whereallthesurveyedpointshavebeentakenintoaccount.theaveragevelocityissignificantly variablefromyeartoyear,rangingfromaminimumof0,06m/year( )toamaximumof 0,13m/year( ).Aslowingtrendseemstoemergeinthelasttwoyearsofmeasurements. ThenearsurfacetemperatureofthegroundrecordedonAmRGfromAugust2004toAugust2009is showninfig.5(bottomgraph).inthisgraph,thegroundtemperature(dailymean)isassociatedto theairtemperature(centralgraph)andtothethicknessofthesnowcover(topgraph). 144
148 PermafrostResponsetoClimateChange Table1 HorizontaldisplacementofAmRG.Thefirstsixcolumnsshowthedisplacementforeachperiodof measurements,thecolumnseventhetotaldisplacement,andthecolumneightthedisplacementrate.(*) Measurementperiodoftwoyears. Boulder ID Horizontaldisplacement(m) (*) (*) total horizontal displacement (m) horizontal displacement rate (m/yr) Focusingonthewintersthecoldesttemperatureswererecordedinthe and seasons.duringbothwinters,thegroundreachedtemperaturesbelow10 C.Thestrongcoolingof thegroundmaybeduetothecombinedeffectofcoldairtemperatureandrelativelythinsnowpack inautumnandearlywinter.inthetwofollowingwinters( and ),theground temperaturewaswarmer,withamarkedphaseofweqt(winterequilibriumtemperature)ofabout 5 C.Thewinter wasverymildandthesnowpackwasrelativelythinuntilmidwinter, whilethefollowingwinter( )wascolderandsnowier. Thehighestwintertemperatureswererecordedduringthe seasonandreachedaWEqT phaseofabout3 C.Thiswasmainlyduetothepresenceofaverythicksnowcover,whichappeared earlyinautumnandfurtherincreasedinthefollowingwintermonths.thesnow,withitsthermal insulatingeffect,preventedthecoolingofthegroundalreadyinthefirstpartofthewinter,whilethe airtemperaturewasnotparticularlymildcomparedtotheprecedingwinters.thisunderlinesthe strongcontrolofthesnowcoveronthewintertemperatureofthegroundand,consequently,onthe meanannualgroundtemperature. 145
149 PermaNET CasestudiesintheEuropeanAlps Fig.4 Totalhorizontaldisplacement( )ofAmRG.ThelocationofthespringmentionedinFig.3is indicated. Fig.5 Topandmiddlegraphs:snowthicknessandairtemperatureatCapannaPresenaautomaticweather station;bottomgraph:groundnearsurfacetemperaturefromaugust2004toaugust2009foramrg.thelack ofdatainthefirsthalfof2006wasduetoadataloggerfailure.forlocationoftemperaturedataloggersee Fig

150 PermafrostResponsetoClimateChange Fig.6 Annualgroundfreezingindex(GFI)atAmRGfrom2004to2009.Nodatawereavailableforthe period. Fig.7 EvolutionofthemeanannualairtemperatureatCimaPresenaautomaticweatherstation(topgraph) andofthenearsurfacegroundtemperatureatamrg(bottomgraph).allthetemperaturesaredisplayedas 12monthsrunningmeans,andthedateonthexaxiscorrespondstotheendoftheperiodusedforthe calculation. ThecoolingofthegroundduringthewinterseasonisalsohighlightedbytheGroundFreezingIndex (GFI),calculatedasthecumulativevalueofthenegativedailymeangroundtemperaturesbetween 1 st Octoberand30 th June(Fig.6).Thecoldestwinter(1020 Cday)wasrecordedin dueto acombinationofverycoldairtemperatureandrelativelythinsnowcover.theindexwasalsovery 147
151 PermaNET CasestudiesintheEuropeanAlps lowinthewinter (972 Cday),asaresultofthestrongcoolingofthegroundatthe beginningofthewinterduetocoldairtemperatureduringautumnandearlywinter.averyhighgfi value(360 Cday)wasrecordedin ,mainlyduetotheverythicksnowcoverofthat winter. TheroleofthewintersnowcoveronthegroundtemperaturecanalsobeobservedinFig.7,where theevolutionofthemeanannualairtemperature(maat)atcimapresenaawsandtheevolutionof themagstarecomparedonthesameperiodoftime.thetemperaturesaredisplayedas12months runningmeans,andthedateonthexaxiscorrespondstotheendoftheperiodusedforthe calculation.groundtemperaturedataaremissingin2006and2007becauseofthefailureofthedata logger.forexample,astrongwarmingofthegroundin2009(temperaturesabove1 C)andaclear separationbetweenthetemperaturetrendsofsoilandaircanbeobserved.thisisduemoretothe effectofthethicksnowcoverofthepreviouswinterthantoacorrespondingwarmingoftheair temperature. Finally,inFig.8themeanannualdisplacementrateiscomparedwiththemeanannualtemperature ofthegroundandtheair.inordertoemphasizetheroleofthewinterseasons,thevaluesofthe meanannualtemperature(bothforthegroundandfortheair)havebeencalculatedtakinginto accountanannualbasisextendingfromthe15 th Augustofthepreviousyeartothe14 th Augustofthe followingyear.forthisreason,anextremelywarmsummerlike2003isnotaswellperceptibleinthe datarecordasamildwinterlike thegroundtemperaturedataaremissingfor and Fig.8 MeandisplacementofAmRG(topgraph)comparedwiththemeanannualgroundtemperature(middle graph)andthemeanannualairtemperatureatcimapresenaautomaticweatherstation(bottomgraph). In , an increase in the displacement rate corresponds quite well with a higher air temperaturecomparedtotheprecedingyear.inthefollowingyear,thedisplacementratedecreased considerably,ingoodagreementwithalowerairtemperature.inthelastyearofmeasurements ( ),thedisplacementratewasonlyslightlyhigherandthemeanairtemperaturesomewhat lowerthanintheprecedingyear.inthesameyear,asignificantincreaseinthegroundtemperature duetothelargeamountofsnow(seeabove)wasrecorded,butthisdoesnotseemtohaveresulted inanincreaseofthedisplacementrate. 148
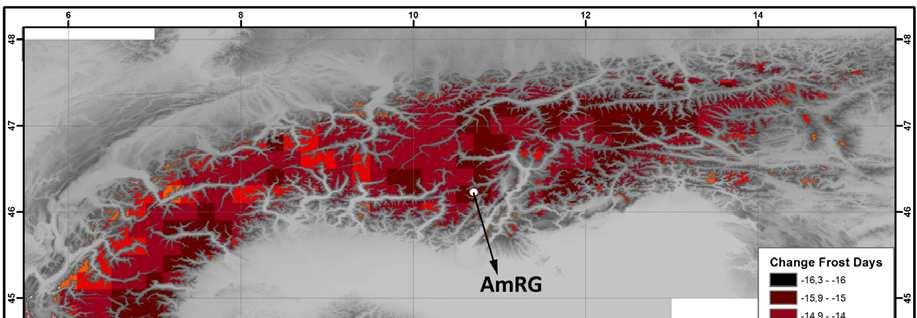


152 PermafrostResponsetoClimateChange Fig.9 Potentialchangeoffrost,iceandfreezethawdaysfor ,asproposedinchapter2.The locationofamrgisshown. 149
153 PermaNET CasestudiesintheEuropeanAlps 3. Possiblefuturethermalandgeomorphicresponsetopredictedclimate change FutureevolutionandgeomorphicresponseofAmRGtoclimatechangearedifficulttohypothesize. Asreportedinchapter2,notonlychangesinthetemperaturefortheendofthe21 st century(a warmingof4.2 Cinthealpineareasabove1800ma.s.l.),butalsosignificantchangesinthenumber offrost,iceandfreezethawdaysfortheperiod canbeexpected.accordingtothis,inthe areawhereamrgislocated,weexpectadecreaseinthefrostdaysof15/16days/year,adecreasein theicedaysof15/19days/yearandaslightincreaseinthefreezethawdaysof0/4days/year(fig.9). Ashighlightedabove,thedynamicresponseofAmRGseemstoberelatedtothechangesinthe amountandevolutionofthesnowduringwinter,duetoitseffectonthegroundtemperature.thus alsothefuturechangesintheamountanddistributionofprecipitations,especiallyassnow,should betakenintoaccountinassessingtheresponseofthislandformtofutureclimatechange. Acknowledgements. Mauro Degasperi and Franco Crippa (Geological Survey, Autonomous ProvinceofTrento)conductedthetopographicsurveysandprocessedtheroughtopographicdata. FieldcollaborationwasprovidedbyLucaCarturan,StefanoFontanaandAndreaPaoli.Thisworkwas partlyfundedbytheprin2008project ClimateChangeeffectsonglaciers,onglacierderivedwater resourceandonpermafrost.quantificationoftheongoingvariationsintheitalianalps. References: BaroniC.,CartonA.&SeppiR.,2004:DistributionandbehaviourofrockglaciersintheAdamelloPresanella Massif(ItalianAlps).PermafrostandPeriglacialProcesses,15, Barsch D., 1996: Rockglaciers: Indicators for the Present and Former geoecology in High Mountain Environments.Springer,Berlin,331pp. BodinX.,ThibertE.,FabreD.RiboliniA.,SchoeneichP,FrancouB.,LouisReynaudL.&FortM.,2009:Two DecadesofResponses( )toClimatebytheLaurichardRockGlacier,FrenchAlps.Permafrost andperiglacialprocesses,20, DelaloyeR.,PerruchoudE.,AvianM.,KaufmannV.,BodinX.,IkedaA.,HausmannH.,KääbA.,Kellerer PirklbauerA.,KrainerK.,LambielC.,MihajlovicD.,StaubB.,RoerI.&ThibertE.,2008:Recent interannualvariationsofrockglacierscreepintheeuropeanalps.proceedingsofthe9 th International ConferenceonPermafrost(NICOP),UniversityofAlaska,Fairbanks,June29 July3,2008, HaeberliW.,HalletB.,ArensonL.,ElconinR.,HumlumO.,KaabA.,KaufmannV.,LadanyiB.,MatsuokaN., SpringmanS.&VonderMühllD.,2006:Permafrostcreepandrockglacierdynamics.Permafrostand PeriglacialProcesses,17, HoelzleM.,WegmannM.&KrummenacherB.,1999:Miniaturetemperaturedataloggersformappingand monitoringofpermafrostinhighmountainareas:firstexperiencefromtheswissalps.permafrostand PeriglacialProcesses,10, KääbA.,FrauenfelderR.&RoerI.,2007:Ontheresponseofrockglaciercreeptosurfacetemperatureincrease. GlobalandPlanetaryChange,56, IkedaA.,MatsuokaN.&KääbA.,2008:Fastdeformationofperenniallyfrozendebrisinawarmrockglacierin theswissalps:aneffectofliquidwater.journalofgeophysicalresearch113,f PERMOS,2009:PermafrostinSwitzerland2004/2005and2005/2006.Noetzli,J.,Naegeli,B.,andVonder Muehll,D.(eds.),GlaciologicalReportPermafrostNo.6/7oftheCryosphericCommissionoftheSwiss AcademyofSciences,100pp. RoerI.,KääbA.&DikauR.,2005:RockglacieraccelerationintheTurtmannvalley(SwissAlps) probable controls.norwegianjournalofgeography,59,
154 PermafrostResponsetoClimateChange 3. CasestudiesintheEuropeanAlps 3.13 PizBoèrockglacier,Dolomites,EasternItalianAlps Citationreference A.CrepazA.,CagnatiA.,GaluppoA.,CarolloF.,MarinoniF.,MagnaboscoL.,DefendiV.(2011). Chapter3.13:CasestudiesintheEuropeanAlps PizBoèrockglacier,Dolomites,EasternItalian Alps.InKellererPirklbauerA.etal.(eds):Thermalandgeomorphicpermafrostresponsetopresent andfutureclimatechangeintheeuropeanalps.permanetproject,finalreportofaction5.3.online publicationisbn ,p Authors Coordination:AndreaCrepaz Involvedprojectpartnersandcontributors: RegionalAgencyfortheEnvironmentalProtectionofVeneto,Italy(ARPAV) AndreaCrepaz, AnselmoCagnati Regione Veneto, Direzione Geologia e Georisorse, Servizio Geologico (GeoVE) Anna Galuppo,LauraMagnabosco,ValentinaDefendi E.P.C.EuropeanProjectConsultingS.r.l. FedericoCarollo Freelancer FrancescoMarinoni Content Summary 1. Introductionandstudyarea 2. Permafrostindicatorsandrecentthermalevolution 3. Possiblefuturethermalresponsetopredictedclimatechange References 151
155 PermaNET CasestudiesintheEuropeanAlps Summary Recently,ARPAVincollaborationwithGeoVEstartedtomonitortheperiglacialenvironmentof PizBoè(46.51 N,11.83 E),inVenetoregion,atanaltitudeof2900ma.s.l.Inthepast,some preliminarygeoelectricalandgeoseismicsurveyswerecarriedoutontherockglacier,butonlyin theframeworkofthepermanetprojectthecharacteristicsofthepermafrostareextensively studied.continuousgst(groundsurfacetemperature)measurementswerecarriedoutinthe winter2009/2010;a30mdeepboreholewasdrilledindolomitebedrockandanautomatic weatherstationwasinstalledinsummer2010.laterweplannedtocarryoutasecondelectrical resistivitytomography(ert)campaign(firstonein2005)ontherockglacier.inthisreportwe presentthefirstresultsonthecomparisonofertmeasurementscarriedoutin2005and2010. Thedatacomparisondoesnotshowsignificantchangesinthestructureoftheicecoveredwith debrisduringthelastfiveyears.inparticular,itseemsthatthecoveredicedidneithermodifyits consistencenoritsextent.duetotheshortmonitoringtimeandthelackofotherexperimental dataonthepizboèsite,itisverydifficulttoexplainitsfuturebehaviour.arpavmanagesalsoa broadweatherstationnetworkonvenetomountainregion,sothehigheststationdata(ra Vales)wasusedtomakesomeanalysisofthelastyears.Forthenextcenturyclimatemodels estimate a dramatic increase of air temperature. This condition will directly influence the thickness,theextensionandthedisplacementoftherockglacieratpizboè. 152
.")
.")
, nodular limestones of the Rosso Ammonitico Formation(Jurassic)and MarnedelPuez Formation(LowerCretaceous). Fig.")
,butadebris coveredglacier(insomemapsitisconsideredarockglacier)hasbeenformedbelowtheglacier.")
156 PermafrostResponsetoClimateChange 1. Introductionandstudyarea ThePizBoèsiteislocatedintheNorthEastofItaly(46.51 N,11.83 E;Fig.1),ontheborderof Venetoregion,at2900ma.s.l.ontheSellaGroup,nearPizBoèpeak(Fig2).TheSellaGroup representsoneofthemostimportantmassifsofthedolomites.itsbaseisconstitutedbythe DolomiadelloSciliar Formation(LadinianLowerCarnian).Thethicknessofthisnonstratifiedcoral reefvariesfrom300to600m.thetopofthemassifismadeupby DolomiaPrincipale (Norian). Thegeologicalboundarybetweenthetwoabovementionedformationsisveryclearandmarkedby layersofmarlsandclaysofthe RaiblFormation (Carnian).Thewhite/cleargreyDolomiaPrincipale Formationiswellstratifiedanditsthicknessreachesitsmaximum(300350m)atPizBoè,whereitis covered by the most recent Calcari di Dachstein (Lias), nodular limestones of the Rosso Ammonitico Formation(Jurassic)and MarnedelPuez Formation(LowerCretaceous). Fig.1 GeographicalsettingofVenetoregionandPizBoèintheDolomites,EasternItalianAlps AtNorthEastofthepeakPizBoètherewasaglacier,listedin1980 scampaignsurveywithabouta surfaceof0.04km 2.Nowadaystheglaciatedareaisverylimited(about0.014km 2 ),butadebris coveredglacier(insomemapsitisconsideredarockglacier)hasbeenformedbelowtheglacier.at thebottomofthedebristhereisasmallshallowlake(lechdlacé,fig.3),whichiscompletely coveredbysnowandiceithemostpartoftheyearover(novembertojune). 153
(30.07.2008).")

(30.07.2008).")
157 PermaNET CasestudiesintheEuropeanAlps Fig.2 SellaGroupandPizBoè(3151ma.s.l.)fromEast(Livinallongo).Locationofthestudysiteisindicated withanarrow.photographbybrunorenon(arpav)( ). Boreholeand weatherstation Dataloggers 2005/ WE Spring Fig.3 ViewtowardsSouthWestofthelakeLechDlacéandtherockglacierofPizBoèwiththelocationofthe boreholeandtheweatherstation,dataloggers,ertprofilesandthespring.elevationofthelakeis2833m a.s.l.,elevationofthepeakinthebackground(pizboè)is3151ma.s.l.notethewidespreadappearanceoflate lyingsnowpatches.photographbybrunorenon(arpav)( ). 154
158 PermafrostResponsetoClimateChange 2. Permafrostindicatorsandrecentthermalevolution 2.1Methods InJuly2010aboreholewasdrilledintothebedrockdowntoadepthof30mandathermistorchain of16sensors(at0.02,0.3,0.6,1.0,1.5,2.0,3.0,3.5,4.5,5.5,10.0,15.0,20.0,25.0,30.0mfromthe surface)wasplacedtomeasurethegroundtemperatures.inseptember2010aweatherstationwas installedatthelocationindicatedinfig.3;itmeasuesairtemperature,relativehumidity,snowpack height,winddirectionandvelocity,incomingandoutcoming(shortwaveandlongwave)radiation. DuringSummer2010watersampleswerecollectedfromthespringcomingoutfromtherockglacier andfromthelechdlacéwithatemporalresolutionofabout15days,inordertoevaluatechemical compositionanditsrelativeseasonalchanges;watertemperaturesweremeasuredaswell. SinceOctober2009twodataloggers(HoboProV2U23001,OnsetComputerCorp.),loggingevery30 minutes, have been placed near Piz Boè rock glacier in order to measure the ground surface temperature.thefirstonewasputontherockglacierfrontandthesecondoneoutsideoftherock glacier,belowthefront,wheretheweatherstationwasplannedtobeinstalledinseptember2010 (seefig.3forlocation).theywererecoveredinthemeltingseasoninjuly2010.attheendof October,onedataloggerwasreplacedinthesameprevioussite,afewcentimetersbelowthesurface oftherockglacier,whiletheotherone,outsideoftherockglacier,wasmovedabout30mtowards SouthEast. Duringthesummer2005adetailedtopographicsurveywascarriedoutandinthesummer2010a LaserScannersurveywasperformedbyIRPICNR. Thestudyareawasfurthermoreinvestigatedon byperforminganelectricalresistivity profile(ert)of124m,usingthedeviceelectrodewennerschlumbergerwithadistancebetween the electrodes equal to 4m and maximum depth of exploration of 25m. The inversion of geoelectricaltomographicdatawasperformedusingthemethodproposedbylabrequeetal.(1996), usingafiniteelementalgorithmbasedontheconceptofreverseocam's(oldenburg,1994)and implementedinsoftwareprofiler(binely,2003).theconfigurationwascomparabletotheoneof theertcampaignon ,thelengthofwhichwas141m. 2.2Resultsoncurrentpermafrostexistence Fig.4showsthemeasuredtemperaturesduringtheperiod and alsodepicting somesignificantevents.on22 nd Octoberthefirstsnowfalloccurred(about510cmoffreshsnow), meltingthefollowingdays.thenextsignificantsnowfalloccurredatthebeginningofnovemberwith about5060cmoffreshsnow;thispartofsnowpackremainedallthewinter,eventhoughatthe endofnovembertheairtemperatureincreasedwithfreezinglevelatabout m.duringall thewinter,groundsurfacetemperaturesremainedatabout4to2 C.InFebruary,Marchandpart ofaprilgstwasabout4 Cinbothsites(winterequilibriumtemperature WeqT).Attheendof Aprilontherockglacierzerocurtainwasreached,whileonthemonitoringsitetemperatures remainedbelow0 C,excepton29 th Aprilwhentemperaturesincreasedupto0 C.On17 th May2010 asnowpitwasdugonthemonitoringsiteandabottomtemperatureofsnowcover(bts)of1.5 C wasmeasured(dataloggervalueswerearound1.7 C).Zerocurtainonthebedrockstartedon11 th June,whileontherockglaciersnowwasalreadycompletelymelted;atthebeginningofJulythe dataloggeronthebedrockwasburiedinameltingicelayer. Thesetemperatureresultsindicatethepossiblepresenceofpermafrostonthebedrockandonthe debris, where in 2005 ERT measurements were performed, as well. In summer 2010, the ERT measurementswererepeatedalongthesamesectionandtheinvestigationwasextendedtoanew orthogonalweorientedtransect,alongthemaximumslopegradient.inthisworkwecomparethe profilescarriedoutin2005and2010alongthesamesection. 155
159 PermaNET CasestudiesintheEuropeanAlps 12.0 GST ( C) /10 5/10 cm Fresh snow 02-03/11 Snow Height 50/60 cm Bedrock Rock glacier Snow pit (Snow Height 240 cm) Zero curtain on the bedrock 09/10/ /10/ /11/ /11/ /12/ /12/ /01/ /01/ /02/ /02/ /03/ /03/ /04/ /04/ /05/ /05/ /06/ /06/2010 Date Fig.4 Evolutionofthegroundsurfacetemperaturebetween and InredGSTfromthe rockglacier,inbluefromthesiteoftheplannedborehole. Thetwodimensionalmodelobtainedbyinversionofapparentresistivitydata(Fig.5)returnsthe actualdistributionofvaluesofresistivityinthesubsurface;itishighlightedbothbyisolinesandby colourscale.thefirstcontourhasbeentracedtoavalueof5*10 4 *m.thesecondisolineis 1*10 5 *m,whilethesubsequentonesareplacedatintervalsof2*10 5 *muptothevalueof 1*10 6 *m;forhigherresistivitythespacingbetweentheisoresistivelinesishigher. Highestresistivityvalues(above1.5*10 6 *m)mightberelatedtomassiveice;valuesbetween 1*10 5 *m and 1.5*10 6 *m should correspond to ice mixed with boulders, while lower values (5*10 4 *m<<1*10 5 *m)mightdetecttheactivelayer. Comparingthetwoprofileswecanmakethefollowingobservations.Thegeometryofthebodyat veryhighresistivityissimilarinthetwosections.at2940maltitudea.s.l.,thewidthoftheanomaly resistive(>1.5x10 6 *m)isapproximatelyequalto99m.thesurfacemateriallayer(about2mof bouldersmixedtofinegraineddebris)showsmoreorlessthesamethicknessinbothprofiles (<5*10 4 ). Thethicknessoftherockglacierismoreorlessthesame,greaterthan23minbothcases.Inboth profiles the maximum depth of investigation was not sufficient to achieve resistence values attributabletothebedrock.theanalysisofthetwosectionsalsoshowsthelimiteddifferencesinthe patternofdeepersections;inthesectionofthe2005isoresistivelinesremainopenonvalues ranging from 1.5 to 5*10 6 *m, while in the section of 2010 they reach values close to 2*10 6 *m.thesedifferencesarenotsignificantbecausetheslightdiscrepancyinthepositioningof twoprofilesonthegroundandhighdifferenceofresistivityonsurfacelayer,whichmayaffect,in part,theresultsofthereverseprocesses. Thesectionof2005showedadifferenceintheresistivebody,withtwoanomaliesatveryhigh resistivity(>4x10 6 *m),separatedbyastripwithslightlylowerresistivity(=1.5x10 6 *m).the 156

160 PermafrostResponsetoClimateChange sectionof2010showsthesetwoanomalies,too,buttheirseparationismoreweakened.alsothis differencecanbeexplainedinpartwiththeconsiderationslistedabove. Wecanconcludethatthesetwoprofilesareverysimilarandthattheslightdifferencesaremainly attributabletothemethoduncertainty. Altitude(m) 2005 Distance(m) Altitude(m) 2010 Resistivity(ohm*m) Distance(m) Fig.5 Resultsoftheelectricaltomography(ERT)campaignson and Possiblefuturethermalresponsetopredictedclimatechange ThePizBoèrockglacierismonitoredsince2005.From2005to2010noairtemperaturesdataare availablebecausetheweatherstationwasnotinstalledbeforeseptember2010.however,time seriesofbothairtemperature(until2009)andsnowheightisavailableforravalesstation,at 2615ma.s.l.,about19kmtotheEastNorthEastofPizBoè. Takingintoaccountthelasttenyears(Table1);thefirstperiod( )seemstobecolderthan thelastone( ).maatwassignificantloweralltheyears,whileitincreasedinthelastfive years,whenvalueswereabove0 Cin2006,2007and2008.Thenumberoffrostandicedays decreased in the last years. Snow cover duration is similar during these two periods. A little differencecanbeobservedinjune;inthelastthreeyearssnowcoverdurationwaslongerinthe earlysummer,whilein someyearswerecharacterizedbyatotalabsenceofsnowcover. Wintersnowheightwasnotsohighin ,whileinthelasttwoyearssnowamountwas higher. 157
161 PermaNET CasestudiesintheEuropeanAlps Table1 DifferenttemperaturederivedparametersfromthemeteorologicalstationRaVales(2615ma.s.l.) 19kmtotheEastNorthEastofBizPoè(DSC=dayswithsnowcover;MAAT=meanannualairtemperature; JJA=JuneJulyAugust). RaVales Frostdays Icedays Freeze/Thawdays DaysofSnowcover JuneDSC MAAT JJAMeanAirTemp Summermeantemperature(JJA)seemstoincreaseduringthelasttenyearswithapeakin2003;this veryhotsummercertainlyinfluencedthemeltingoftheseasonalsnowpackandoftheiceaswell. Thelastyear(2010)wasthecoldestoneofthelasteleven,withaverylongsnowcoverduration;this mighthavesignificantlyinfluencedertprofileofthe2010.thismeteorologicalbehaviouralloweda quasisteadysituationforthedebriscoveredglacierofpizboèinthelastfiveyears. Climatemodelsshowadramaticairtemperaturesincreaseforthenextcentury(seechapter2), especially at high altitudes, and this will certainly influence covered ice. In the next decades, accordingtosresa1b,frostandicedayswilldecreasebyabout1415days.coveredicewilllikely meltquicklyduringthenextdecadesandthedisplacementoficewillincrease.themoreimportant factors that will determine the velocity of melting and displacement, will be the summer temperaturesandsnowcoverdurationintheearlysummer.duringthenextyearsarpavisgoingto investigatethefutureevolutionofpermafrostatpizboè. Acknowledgements. TheauthorsthankAbuZeidNasserforhisworkduringfieldcampaign. References: BinelyA.,2003:2Dinversionofapparentresistivitydatausing Profiler.InstituteofEnvironmental andnaturalsciences,lancasteruniversity,lancaster,uk.6pp. LaBrequeD.J.,MilettoM.,DailyW.,RamirezA.,OwenE.,1996:TheeffectsofnoiseonOccam s inversionofresistivitytomographydata.geophysics,61, OldenburgD.,L.Y.,1994:Inversionofinducedpolarizationdata.Geophysics,59,9:
162 PermafrostResponsetoClimateChange 3. CasestudiesintheEuropeanAlps 3.14 UpperSuldenValley,OrtlerMountains,ItalianAlps Citationreference ZischgA.,MairV.(2011).Chapter3.14:CasestudiesintheEuropeanAlps UpperSuldenValley, Ortler Mountains, Italian Alps. In KellererPirklbauer A. et al. (eds): Thermal and geomorphic permafrostresponsetopresentandfutureclimatechangeintheeuropeanalps.permanetproject, finalreportofaction5.3.onlinepublicationisbn ,p Authors Coordination:AndreasZischg Involvedprojectpartnersandcontributors: AbenisAlpinexpertGmbH/srl AndreasZischg AutomousProvinceofBolzano SouthTyrol,OfficeforGeologyandBuildingMaterials Testing(GeoLAB) VolkmarMair Content Summary 1. Introductionandstudyarea 2. Permafrostindicatorsandrecentthermalandgeomorphicevolution 3. Possiblefuturethermalresponsetopredictedclimatechange References 159
163 PermaNET CasestudiesintheEuropeanAlps Summary ThecasestudyfromtheUpperSuldenValley( N, E),OrtlerMountains, ItalianAlps,showedthegeomorphicresponseofflatorgentlyinclinedareascoveredbydebrisin ahighmountainskiresortoutsideofrockglaciers.thesubsidenceofthesurfaceduetothe meltingofthegroundiceliesinadimensionof4min11years( ).themeasured surfacesubsidenceisaccompaniedwithgeomorphicsignssuchasthermokarstphenomenaor withincreasingsurfacetemperatures.insteeperareas,geomorphicsignsofslopemovements arefoundinareaswithprobablepresenceofpermafrost.thesubsidenceofsurfaceisrelevant forskiinfrastructuresandmustbehandledwithsometechnicaleffort.inthevicinityofthepillar no.12oftheskiliftmadritschjoch,mostprobablythegroundicehasmeltedtotally.therefore, thesubsidenceprocessofthesurfacenearthepillarisfinished.however,thiscanbeconcluded onlyforthisspecificlocationinthestudyarea.inotherareaswheregroundiceisstillpresent, thedegradationprocesswillcontinuewiththeexpectedincreaseoftemperatures. 160


164 PermafrostResponsetoClimateChange 1. Introductionandstudyarea Thestudyareaissituatedintheskiresort"SuldenMadritsch"intheUpperSuldenValley,community ofstilfs/stelvio,autonomousprovinceofbozen/bolzano( N, E,Figs.1,2 and3).thestudyareaissituatedintheortlermountainrangenearthestilfserjochpass.theextent ofthestudyareaisabout5km 2.Theareaismostlyfreeofvegetationandispartiallycoveredby debris.onesmallrockglacierissituatedinthestudyarea.duringtheperiodbetween1805and 1850,partsoftheareawerecoveredbyasmallglacier. Intheearly1990s,ateamoftheUniversityofMunichbeganitsfirstpermafrostinvestigationsinthis area(stötter1994).in1992firstmeasurementsofthetemperaturesatthebottomofthesnowcover (BTS),topographicsurveysandgeophysicalmeasurements(seismics)formappingthepermafrost distributionhadbeenmade.since2004,thebtsmeasurementshavebeenrepeatedintheyears 2004,2006,2007,2008and2009.BTSmeasurementswerecarriedoutatmorethan1100pointsin thestudyarea.since2006,devicesformeasuringthegroundsurfacetemperatures(utldataloggers) wereinstalledon10locationsinthestudyarea. Fig.1 LocationofthestudyareaUpperSuldenValley. Fig.2 OverviewofthestudyareaUpperSuldenValley.Photographtakenfromtheupperstationofthe "Madritschjoch"skiliftlocatedat3150ma.s.l.PhotographbyA.Zischg( ).Thestudyareaistheski resortintheforegroundofthepicture. 161


165 PermaNET CasestudiesintheEuropeanAlps Fig.3 OverviewofthestudyareaUpperSuldenValley.Theblacklinesindicatethelocationofthechairsliftsof themadritschskiresort.orthoimage2008. Fig.4. OverviewofthestudyareaUpperSuldenValley.HillshadeoftheairborneLidarDEM2006.Thered circleshowsthelocationofthepillarno.12oftheskilift"madritschjoch"mentionedinthetext.thegreendots showthelocationofthegstmeasurementdevices(utldataloggers). 162

166 PermafrostResponsetoClimateChange 2. Permafrostindicatorsandrecentthermalandgeomorphicevolution Themeasurementsofthetemperaturesatthebottomofthesnowcoverin1992and1996showed the main areas with probable presence of permafrost. Geophysical measurements (seismic refraction)andtheconstructionoftheskiliftsprovedtheexistenceofcompacticelensesinthearea aroundthepillarno.12oftheskilift Madritschjoch.InAugust1992,massiveicewasfoundduring thefoundationofthispillar(fig.5). Fig.5 Excavationworksforthefoundationofthepillarno.12oftheskilift"Madritschjoch"inAugust1992. PhotographbyM.Maukisch.Source:Stötteretal.(2003).Groundicewasobservedintheconstructionsiteand underthemoraineattheleftoftheconstructionsite. Thefirstmeasurementsofthetemperaturesatthebottomofthesnowcover(BTS)intheareawere carriedoutin1992and1996bymeansofmobiledevicesinthemonthsfebruaryandmarch.since 2004,themeasurementshavebeenrepeated.Duringthewinterhalfyearsbetween2004and2008 themeasurementshavebeenrepeatedonlyinthepartswhereasnowdepthofatminimum60cm wasexistent(figs.6and7,table1). Table1 SummaryofthefiveBTSmeasurementcampaignsinthestudyareaUpperSuldenValley. Year Measurement date/period NumberofBTS measurements Probable permafrost(n) Possible permafrost(n) Nopermafrost(n) 1992 March March ,03.03., , ,27.03., , Allyears


167 PermaNET CasestudiesintheEuropeanAlps Fig.6 ResultsoftheassessmentofpermafrostexistenceusingBTSmeasurementsin1992,1996and


168 PermafrostResponsetoClimateChange Fig.6 ResultsoftheassessmentofpermafrostexistenceusingBTSmeasurementsin2007,2008andallyears. 165
.")

169 PermaNET CasestudiesintheEuropeanAlps Since 2006, the ground surface temperatures (GST) have been monitored continuously by 10 miniaturetemperaturedataloggerssituatedindifferentpartsofthestudyarea(utldatalogger, logginginterval1hour,forlocationsseefig.4). ThecomparisonoftheBTSmeasurementsofthedifferentyearsshowedanincreaseoftemperatures at the bottom of the snow cover in the area near the mentioned pillar no. 12 of the ski lift Madritschjoch. TheGSTmeasurementsinthisareashowedahighinterannualvariability.Despitethisfactthe followingpatternscouldbefound:theupperpartoftheslopeofthehintereschöntaufpeakshows constantlynegativetemperatures(ca. 6 C)overallobservedperiods.Thelowestpartsofthehill betweenthebottomandtheupperstationoftheskilift Madritschjoch showedanincreaseofthe temperaturesovertheyears. Intheyearsbeforetheconstructionoftheskilift,topographicsurveyshadbeenmade.These measurementshavebeenrepeatedregularlysincetheconstructionoftheskilift.inthistimeperiod between1992and2004,thesurfaceoftheareasinthealignmentoftheskilift Madritschjoch that arecoveredbydebrisweresupposedtosubsidenceprocesses.inthevicinityofpillarno.12,the surfacesaggedfor4m(topographicsurveysbytheskiresortoperator).thissubsidenceofsurface wasduetothemeltingofgroundice.inthevicinityofpillarno.12geomorphologicevidencesfor surfacesubsidencehavebeenobserved(fig.7). Fig.7 Photographofsubsidenceprocessesinthevicinityofpillarno.12oftheskilift"Madritschjoch"inJuly 2006.PhotographbyA.Zischg. Thefoundationofthepillarmovedsidewardanddisarrangedthepositionofthepillarno.12. Therefore,thepillarhadtobeadjustedseveraltimessince1992untilthefoundationofthepillarwas reconstructedbymeansofadeeperfoundationreachingthebedrockunderthedebriscover (Fig.8). 166


170 PermafrostResponsetoClimateChange Fig.8 Photographofthereadjustmentofthepositionofthepillarno.12oftheskilift"Madritschjoch". PhotographbyA.Zischg. Duringtheconstructionoftheskilift,theridgeofdebrismaterialalongsidetheskilift(Fig.9)had beengrabbedslightlywithanexcavator.in1996,theridgeshowedanoutcropofmassiveiceonits lateralpartexposedtowardstheskilift.theslopewasnearlyvertical.inthemeantimetheridge slumpeddown.theslopeexposedtowardsthealignmentoftheskiliftisrecontouredandflattened. Theoutcropoficedisappeared. Fig.9 Photographofthedebrisridgealongtheskilift"Madritschjoch"inJuly2006.PhotographbyA.Zischg. Theredarrowshowsthelocationwithoftheobservedslopedeformation. 167


171 PermaNET Case studies in the European Alps In the steeper parts of the areas covered with debris, some evidences for slope movements could be observed (Fig. 10). The evidences for moving downwards of the slope were more frequently in the areas that are showing warmer ground temperatures of the measurements during the last years. The geomorphic signs for slope movements in this area were observed for the first time in Fig. 10 Photograph of evidences for slope movements in the active layer of the southͳwestern slope of the peak Hintere Schöntaufspitze in the ski resort SuldenͲMadritsch in July Photograph by A. Zischg. 3. Possible future thermal response to predicted climate change The observations of the surface subsidence are relevant for the infrastructure of the ski resort. With some technical efforts, the problem for the stability of the foundation of a pillar of the ski lift due to this geomorphic phenomenon of subsidence could be handled. The phenomenon has accelerated in the years from 2000 to In the vicinity of the pillar no. 12 most probably the ground ice has been melted totally. Therefore, the further subsidence of the surface nearby of the pillar is finished. However, this can be concluded only for this specific location in the study area. In other areas where ground ice is still present, the degradation process will continue with the increase of temperatures. After the analyses provided in Chapter 2, the number of frost days in the Madritsch ski resort is likely to decrease for 15 days and the number of ice days will decrease for 17Ͳ19 days. The freezeͳthaw days will increase about 3Ͳ4 days. This will have consequences for a further continuation of the permafrost degradation process. The monitoring of the permafrost degradation in this area will be continued. In case of a beginning subsidence process in other parts of the study area, the course of this event will be observed. 168
CONSIDERATION OF PERMAFROST AND PERMAFROST DEGRADATION IN NATURAL HAZARDS ASSESSMENT
 12 th Congress INTERPRAEVENT 2012 Grenoble / France Conference Proceedings www.interpraevent.at CONSIDERATION OF PERMAFROST AND PERMAFROST DEGRADATION IN NATURAL HAZARDS ASSESSMENT Andreas Zischg 1, Volkmar
Extent of Periglacial = Global Permafrost Permafrost: Soil and/or rock where temperatures remain below 0 degrees C for 2 or more years.
 Geog 1000 - Lecture 34 Periglacial Environments and Paleoclimatology http://scholar.ulethbridge.ca/chasmer/classes/ Today s Lecture (Pgs 422-434) 1. Exam questions from last week, and today 2. Extent of
Observatoire des Sciences de l Univers de Grenoble
 Involvment of the SOERE CRYOBS-CLIM (CRYosphere, an OBServatory of the CLIMate IR OZCAR) in snow and ice related hazards prevention in an Alpine context Delphine Six (Univ. Grenoble Alpes / IGE) Florence
Periglacial Geomorphology
 Periglacial Geomorphology Periglacial Geomorphology Periglacial: literally means around glacial - term introduced in 1909 to describe landforms and processes around glaciated areas. Periglacial environments:
Terrestrial Climate Change Variables
 Terrestrial Climate Change Variables Content Terrestrial Climate Change Variables Surface Air Temperature Land Surface Temperature Sea Level Ice Level Aerosol Particles (acid rain) Terrestrial Climate
CLIMATE RESILIENCE FOR ALBERTA MUNICIPALITIES CLIMATE PROJECTIONS NORTHERN ALBERTA. Dr. Mel Reasoner Reasoner Environmental Consulting
 CLIMATE RESILIENCE FOR ALBERTA MUNICIPALITIES CLIMATE PROJECTIONS NORTHERN ALBERTA Dr. Mel Reasoner Reasoner Environmental Consulting Probability of occurrence Increase in Mean Temperature & Variance Less
Towards assessing thermal and dynamic reaction scenarios of different permafrost sites in the European Alps: One action within the PermaNET project
 4th Symposium ofthe Hohe Tauern National Park Conference Volume for Research in Protected Areas pages 169-174 September 17th to 19th, 2009, Castle of Kaprun Towards assessing thermal and dynamic reaction
DOWNLOAD PDF SCENERY OF SWITZERLAND, AND THE CAUSES TO WHICH IT IS DUE.
 Chapter 1 : The Scenery of Switzerland (Sir John Lubbock - ) (ID) ebay The scenery of Switzerland and the causes to which it is due / Related Titles Series: Collection of British authors ; vol. These diseases
ATOC OUR CHANGING ENVIRONMENT Class 19 (Chp 6) Objectives of Today s Class: The Cryosphere [1] Components, time scales; [2] Seasonal snow
![ATOC OUR CHANGING ENVIRONMENT Class 19 (Chp 6) Objectives of Today s Class: The Cryosphere [1] Components, time scales; [2] Seasonal snow](/thumbs/95/126309683.jpg "ATOC OUR CHANGING ENVIRONMENT Class 19 (Chp 6) Objectives of Today s Class: The Cryosphere [1] Components, time scales; [2] Seasonal snow") ATOC 1060-002 OUR CHANGING ENVIRONMENT Class 19 (Chp 6) Objectives of Today s Class: The Cryosphere [1] Components, time scales; [2] Seasonal snow cover, permafrost, river and lake ice, ; [3]Glaciers and
ATOC 1060-002 OUR CHANGING ENVIRONMENT Class 19 (Chp 6) Objectives of Today s Class: The Cryosphere [1] Components, time scales; [2] Seasonal snow cover, permafrost, river and lake ice, ; [3]Glaciers and
Quantification and visualization of periglacial surface deformation in the Inneres Hochebenkar cirque, Ötztal Alps, Austria
 Quantification and visualization of periglacial surface deformation in the Inneres Hochebenkar cirque, Ötztal Alps, Austria Institute of Geodesy Graz University of Technology Steyrergasse 30 A-8010 Graz,
PERIGLACIAL PROCESSES & LANDFORMS
 PERIGLACIAL PROCESSES & LANDFORMS Periglacial processes all non-glacial processes in cold climates average annual temperature between -15 C and 2 C fundamental controlling factors are intense frost action
Research highlights from permafrost research: Rock glacier mapping in the HKH region with Google Earth
 Research highlights from permafrost research: Rock glacier mapping in the HKH region with Google Earth M.-O. Schmid, P. Baral, S. Gruber, S. Shahi, T. Shrestha, D. Stumm, and P. Wester International Centre
CLIMATE. UNIT TWO March 2019
 CLIMATE UNIT TWO March 2019 OUTCOME 9.2.1Demonstrate an understanding of the basic features of Canada s landscape and climate. identify and locate major climatic regions of Canada explain the characteristics
The Distribution of Cold Environments
 The Distribution of Cold Environments Over 25% of the surface of our planet can be said to have a cold environment, but defining what we actually mean by that can be very challenging. This is because cold
In the last years, several initiatives were launched to structure the French permafrost monitoring activity and the young researcher community.
 In the last years, several initiatives were launched to structure the French permafrost monitoring activity and the young researcher community. Set up in 2008, the PermaFRANCE network aims at: i) providing
4 th Symposium of the Hohe Tauern National Park for Research in Protected Areas September 17 th to 19 th, 2009, Castle of Kaprun
 Conference Volume 4 th Symposium of the Hohe Tauern National Park for Research in Protected Areas September 17 th to 19 th, 2009, Castle of Kaprun pages 157-162 The project ALPCHANGE Climate Change and
Recent Interannual Variations of Rockglacier Creep in the European Alps
 Recent Interannual Variations of Rockglacier Creep in the European Alps Reynald Delaloye, Eric Perruchoud Department of Geosciences, Geography, University of Fribourg, Switzerland Michael Avian, Viktor
Climate Change 2007: The Physical Science Basis
 Climate Change 2007: The Physical Science Basis Working Group I Contribution to the IPCC Fourth Assessment Report Presented by R.K. Pachauri, IPCC Chair and Bubu Jallow, WG 1 Vice Chair Nairobi, 6 February
Recent Interannual Variations of Rock Glacier Creep in the European Alps
 Recent Interannual Variations of Rock Glacier Creep in the European Alps Reynald Delaloye, Eric Perruchoud Department of Geosciences, Geography, University of Fribourg, Switzerland Michael Avian, Viktor
THE EARTH S CLIMATE SYSTEM
 THE EARTH S CLIMATE SYSTEM Earth s Climate System is driven by interactions between the parts of our biosphere So.what is the Biosphere? a relatively thin layer of Earth that has conditions suitable for
A u s t r i a n A l p s
 Documentation of the glacier retreat in the eastern part of the Granatspitz Mountains (Austrian Alps) using aerial photographs V. Kaufmann*, R. Plösch**, S. Ritter*, J. Streber* * Institute of Remote Sensing
Natural Causes of Climate. 3B Day 2
 Natural Causes of Climate 3B Day 2 Critical Content 3B: Investigate how daily weather over time determines climate patterns in a given region 2C: Recall the difference between weather and climate Describe
Sylvain BIGOT 1, Guillaume FORTIN 2, Florian RAYMOND 1 2, Sandra ROME 1 and Dominique DUMAS 3
 Recent (1960-2012) and future (2021-2050) major temperature variations in middle mountain areas: comparison between Vercors (Rhône-Alpes, France) and Gaspe Peninsula (Quebec, Canada) Sylvain BIGOT 1, Guillaume
6. State two factors and explain how each influences the weather in Ohio. Respond in the space provided in your Answer Document.
 6. State two factors and explain how each influences the weather in Ohio. Respond in the space provided in your Answer Document. (4 points) Sample Response for Item 6 (Extended Response): Other Correct
Central Asia High Elevation International Geophysical (HEIG) Project, since 2015
 Project, since 2015") Central Asia High Elevation International Geophysical (HEIG) Project, since 2015 Under auspices of UNESCO: the International Geoscience Programme (IGCP), the US, Japan, Germany, China, France, Kazakhstan,
Central Asia High Elevation International Geophysical (HEIG) Project, since 2015 Under auspices of UNESCO: the International Geoscience Programme (IGCP), the US, Japan, Germany, China, France, Kazakhstan,
The TEMPS project: The evolution of mountain permafrost in Switzerland
 The TEMPS project: The evolution of mountain permafrost in Switzerland Christian Hauck, Reynald Delaloye, Isabelle Gärtner-Roer, Andreas Hasler, Christin Hilbich, Martin Hoelzle, Robert Kenner, Sven Kotlarski,
HIGH-MOUNTAIN PERMAFROST IN THE AUSTRIAN ALPS (EUROPE)
") HIGH-MOUNTAIN PERMAFROST IN THE AUSTRIAN ALPS (EUROPE) Gerhard Karl Lieb Institute of Geography University of Graz Heinrichstrasse 36 A-8010 Graz e-mail: gerhard.lieb@kfunigraz.ac.at Abstract Permafrost
HIGH-MOUNTAIN PERMAFROST IN THE AUSTRIAN ALPS (EUROPE) Gerhard Karl Lieb Institute of Geography University of Graz Heinrichstrasse 36 A-8010 Graz e-mail: gerhard.lieb@kfunigraz.ac.at Abstract Permafrost
CLIMATE RESILIENCE FOR ALBERTA MUNICIPALITIES CLIMATE PROJECTIONS SOUTHERN ALBERTA. Dr. Mel Reasoner Reasoner Environmental Consulting
 CLIMATE RESILIENCE FOR ALBERTA MUNICIPALITIES CLIMATE PROJECTIONS SOUTHERN ALBERTA Dr. Mel Reasoner Reasoner Environmental Consulting Probability of occurrence Increase in Mean Temperature & Variance Less
What factors affect climate? Dr. Michael J Passow
 What factors affect climate? Dr. Michael J Passow Energy from the Sun (mostly light and heat) radiates to Earth SUN 150 x 10 6 km (92 x 10 6 mi) EARTH Challenge: If the speed of light is 300,000 km/sec,
Impacts of snowpack accumulation and summer weather on alpine glacier hydrology
 Impacts of snowpack accumulation and summer weather on alpine glacier hydrology Caroline Aubry-Wake, Dhiraj Pradhananga, John W. Pomeroy GEWEX 8 th Open Science Meeting, Canmore AB, May 3-11 2018 Canadian
10 years of monitoring of the Doesen rock glacier (Ankogel group, Austria) a review of the research activities for the time period
 a review of the research activities for the time period") 10 years of monitoring of the Doesen rock glacier (Ankogel group, Austria) a review of the research activities for the time period 1995-2005 V. Kaufmann 1, R. Ladstädter 1 and G. Kienast 2 1 Institute
10 years of monitoring of the Doesen rock glacier (Ankogel group, Austria) a review of the research activities for the time period 1995-2005 V. Kaufmann 1, R. Ladstädter 1 and G. Kienast 2 1 Institute
Climates are described by the same conditions used to describe
 58 The Causes of Climate R EA D I N G Climates are described by the same conditions used to describe weather, such as temperature, precipitation, and wind. You now know that oceans have an important effect
Thermal Diffusivity Variability in Alpine Permafrost Rockwalls
 Thermal Diffusivity Variability in Alpine Permafrost Rockwalls P.Pogliotti GEOSITLAB, Department of Earth Sciences, University of Turin, Italy ARPA Valle d Aosta, Climate Change Div., Aosta, Italy E. Cremonese
Monte Rosa east face and Belvedere Glacier:
 Monte Rosa east face and Belvedere Glacier: Glacier surge, glacier lake, slope instabilities and related emergencies Christian Huggel, Luzia Fischer Glaciers in an Environmental Context: Case Studies C.
Chapter outline. Reference 12/13/2016
 Chapter 2. observation CC EST 5103 Climate Change Science Rezaul Karim Environmental Science & Technology Jessore University of science & Technology Chapter outline Temperature in the instrumental record
Climate and Environment
 Climate and Environment Oxygen Isotope Fractionation and Measuring Ancient Temperatures Oxygen Isotope Ratio Cycles Oxygen isotope ratio cycles are cyclical variations in the ratio of the mass of oxygen
LAB J - WORLD CLIMATE ZONES
 Introduction LAB J - WORLD CLIMATE ZONES The objective of this lab is to familiarize the student with the various climates around the world and the climate controls that influence these climates. Students
Grade 9 Geography Chapter 11 - Climate Connections
 Grade 9 Geography Chapter 11 - Climate Connections 1. Define: Weather. 2. In what way has weather affected your activities in the last two weeks? 3. Define: Climate. 4. Canada s climate is a function of
Measuring rock glacier surface deformation using SAR interferometry
 Permafrost, Phillips, Springman & Arenson (eds) 2003 Swets & Zeitlinger, Lisse, ISBN 90 5809 582 7 Measuring rock glacier surface deformation using SAR interferometry L.W. Kenyi Institute for Digital Image
Chapter 1 Section 2. Land, Water, and Climate
 Chapter 1 Section 2 Land, Water, and Climate Vocabulary 1. Landforms- natural features of the Earth s land surface 2. Elevation- height above sea level 3. Relief- changes in height 4. Core- most inner
The landforms of Svalbard
 The landforms of Svalbard Content Periglacial landforms -) ice-wedges -) rock glaciers -) pingos -) solifluction -) avalanches -) debris flows -) rock falls -) nivation -) aeolian landforms Glacial landforms
Planetary Atmospheres (Chapter 10)
") Planetary Atmospheres (Chapter 10) Based on Chapter 10 This material will be useful for understanding Chapters 11 and 13 on Jovian planet systems and Extrasolar planets Chapters 4, 5, and 8 on Momentum,
Planetary Atmospheres (Chapter 10) Based on Chapter 10 This material will be useful for understanding Chapters 11 and 13 on Jovian planet systems and Extrasolar planets Chapters 4, 5, and 8 on Momentum,
Lithosphere: (Rocky Sphere) Solid, rocky, outer layer of the Earth. Includes the crust and part of the upper mantle. Lithosphere
 Solid, rocky, outer layer of the Earth. Includes the crust and part of the upper mantle. Lithosphere") Lithosphere: (Rocky Sphere) Solid, rocky, outer layer of the Earth. Includes the crust and part of the upper mantle. Lithosphere Permafrost Permafrost Ground that is at a temperature of 0 or below for
Lithosphere: (Rocky Sphere) Solid, rocky, outer layer of the Earth. Includes the crust and part of the upper mantle. Lithosphere Permafrost Permafrost Ground that is at a temperature of 0 or below for
Extremes Events in Climate Change Projections Jana Sillmann
 Extremes Events in Climate Change Projections Jana Sillmann Max Planck Institute for Meteorology International Max Planck Research School on Earth System Modeling Temperature distribution IPCC (2001) Outline
History. Late 18 th /early 19 th century Europeans observed that erratic boulders dispersed due to the retention of glaciers caused by climate chance
 Ice ages What is an ice age? Geological period of long-term reduction in the temperature of the Earth's surface and atmosphere which results in the formation and expansion of continental ice sheets, polar
Deke Arndt, Chief, Climate Monitoring Branch, NOAA s National Climatic Data Center
 Thomas R. Karl, L.H.D., Director, NOAA s National Climatic Data Center, and Chair of the Subcommittee on Global Change Research Peter Thorne, PhD, Senior Scientist, Cooperative Institute for Climate and
PREDICTION OF FROST HEAVE INDUCED DEFORMATION OF DYKE KA-7 IN NORTHERN QUEBEC
 PREDICTION OF FROST HEAVE INDUCED DEFORMATION OF DYKE KA-7 IN NORTHERN QUEBEC J.-M. Konrad 1, M. Shen 1, R. Ladet 2 1. Dept. of Civil Engineering UniversitŽ Laval,QuŽbec, Canada, G1K 7P4 2. Hydro-QuŽbec,
CLIMATE READY BOSTON. Climate Projections Consensus ADAPTED FROM THE BOSTON RESEARCH ADVISORY GROUP REPORT MAY 2016
 CLIMATE READY BOSTON Sasaki Steering Committee Meeting, March 28 nd, 2016 Climate Projections Consensus ADAPTED FROM THE BOSTON RESEARCH ADVISORY GROUP REPORT MAY 2016 WHAT S IN STORE FOR BOSTON S CLIMATE?
Observed changes in climate and their effects
 1 1.1 Observations of climate change Since the TAR, progress in understanding how climate is changing in space and time has been gained through improvements and extensions of numerous datasets and data
A downscaling and adjustment method for climate projections in mountainous regions
 A downscaling and adjustment method for climate projections in mountainous regions applicable to energy balance land surface models D. Verfaillie, M. Déqué, S. Morin, M. Lafaysse Météo-France CNRS, CNRM
National Framework for Glacier Monitoring & Assessment National-scale Reference :
 National Framework for Glacier Monitoring & Assessment National-scale Reference : Western & Northern Cordillera High Arctic (Queen Elizabeth Islands) Low Arctic (Baffin Island) emphasis on long time series
GEOGRAPHY EYA NOTES. Weather. atmosphere. Weather and climate
 GEOGRAPHY EYA NOTES Weather and climate Weather The condition of the atmosphere at a specific place over a relatively short period of time Climate The atmospheric conditions of a specific place over a
How Will Melting Ice Sheets Affect Us?
 PASSAGE 4 How Will Melting Ice Sheets Affect Us? Variation is normal. During the last ice age, for example, ice sheets also covered much of North America and Scandinavia. Why is what s happening now different
Atmospheric Composition and Structure
 Atmospheric Composition and Structure Weather and Climate What is weather? The state of the atmosphere at a specific time and place. Defined by: Humidity, temperature, wind speed, clouds, precipitation,
FROM CRYOSPHERE TO ANTHROPOGENIC IMPACTS
 FROM CRYOSPHERE Balázs Nagy Department of Physical Geography Eötvös Loránd University, Budapest TO ANTHROPOGENIC IMPACTS primary data and environmental applications: - summary of the Hungarian high altitude
Vendredi 27 août : les glaciers rocheux de la Valpisella, les plus spectaculaires de la vallée.
 Vendredi 27 août : les glaciers rocheux de la Valpisella, les plus spectaculaires de la vallée. groupe A : Refuge des Forni, Valpisella, glaciers rocheux, arête du Cima dei Forni (3233 m, passages faciles
3 Temperate and Polar Zones
 CHAPTER 3 3 Temperate and Polar Zones SECTION Climate BEFORE YOU READ After you read this section, you should be able to answer these questions: What biomes are found in the temperate zone? What biomes
ANALYSIS OF GLACIER CHANGE IN THE SIERRA NEVADA PORTLAND STATE UNIVERSITY DEPARTMENT OF GEOLOGY BRADLEY BUSELLI
 ANALYSIS OF GLACIER CHANGE IN THE SIERRA NEVADA PORTLAND STATE UNIVERSITY DEPARTMENT OF GEOLOGY BRADLEY BUSELLI Study area: Sierra Nevada (Glaciers, 2015) Closer look (Glaciers, 2015) Primary goal: Research
Chapter 2: Physical Geography
 Chapter 2: Physical Geography Pg. 39-68 Learning Goals for Chp2: q q q q q Explain how the Earth moves in space and why seasons change. Outline the factors that influence climate and recognize different
Zambia. General Climate. Recent Climate Trends. UNDP Climate Change Country Profiles. Temperature. C. McSweeney 1, M. New 1,2 and G.
 UNDP Climate Change Country Profiles Zambia C. McSweeney 1, M. New 1,2 and G. Lizcano 1 1. School of Geography and Environment, University of Oxford. 2. Tyndall Centre for Climate Change Research http://country-profiles.geog.ox.ac.uk
Name Date. What s the weather like today? Watch the beginning of the video Basics of geography- climate.
 FACTORS THAT INFLUENCE CLIMATE worksheet 1 STARTER Look at the weather symbols and answer: What s the weather like today? WHAT S CLIMATE? Watch the beginning of the video Basics of geography- climate.
CLIMATE SCENARIOS FOR IMPACT STUDIES IN THE NETHERLANDS
 CLIMATE SCENARIOS FOR IMPACT STUDIES IN THE NETHERLANDS G.P. Können Royal Meteorological Institute (KNMI), De Bilt, May 2001 1. INTRODUCTION These scenarios described here are an update from the WB21 [1]
EKOLOGI BIOMA (BIOME) TEMA 10. Program Studi Tadris Biologi Fakultas Tarbiyah dan Ilmu Keguruan Institut Agama Islam Negeri Jember
 TEMA 10. Program Studi Tadris Biologi Fakultas Tarbiyah dan Ilmu Keguruan Institut Agama Islam Negeri Jember") EKOLOGI TEMA 10 BIOMA (BIOME) Program Studi Tadris Biologi Fakultas Tarbiyah dan Ilmu Keguruan Institut Agama Islam Negeri Jember What is difference of this picture????? Why are they different????? Have
EKOLOGI TEMA 10 BIOMA (BIOME) Program Studi Tadris Biologi Fakultas Tarbiyah dan Ilmu Keguruan Institut Agama Islam Negeri Jember What is difference of this picture????? Why are they different????? Have
Earth s Major Terrerstrial Biomes. *Wetlands (found all over Earth)
") Biomes Biome: the major types of terrestrial ecosystems determined primarily by climate 2 main factors: Depends on ; proximity to ocean; and air and ocean circulation patterns Similar traits of plants
Biomes Biome: the major types of terrestrial ecosystems determined primarily by climate 2 main factors: Depends on ; proximity to ocean; and air and ocean circulation patterns Similar traits of plants
Keys to Climate Climate Classification Low Latitude Climates Midlatitude Climates High Latitude Climates Highland Climates Our Changing Climate
 Climate Global Climates Keys to Climate Climate Classification Low Latitude Climates Midlatitude Climates High Latitude Climates Highland Climates Our Changing Climate Keys to Climate Climate the average
Sun, Moon, Hydrosphere Worksheet - Answers
 Sun, Moon, Hydrosphere Worksheet - Answers Question 1 WHAT TERM CORRESPONDS TO EACH OF THE FOLLOWING DEFINITIONS? a) a landform, slope or terrain that can affect water circulation b) the Earth s blue envelope
On the critical need for mountain observatories to monitor and detect amplified climate change in British Columbia (BC) s Mountains
 s Mountains") On the critical need for mountain observatories to monitor and detect amplified climate change in British Columbia (BC) s Mountains Aseem Sharma & Stephen Déry University of Northern British Columbia,
On the critical need for mountain observatories to monitor and detect amplified climate change in British Columbia (BC) s Mountains Aseem Sharma & Stephen Déry University of Northern British Columbia,
Climate Change in Newfoundland & Labrador
 Climate Change in Newfoundland & Labrador Impacts and Adaptation Newleef Conference 08 October 2015 Met-Ocean Services The Team 55 personnel; 24/7 operational weather forecast desk; Equipment technician
What is the IPCC? Intergovernmental Panel on Climate Change
 IPCC WG1 FAQ What is the IPCC? Intergovernmental Panel on Climate Change The IPCC is a scientific intergovernmental body set up by the World Meteorological Organization (WMO) and by the United Nations
Developing new methods for monitoring periglacial phenomena
 Developing new methods for monitoring periglacial phenomena Permafrost, Phillips, Springman & Arenson (eds) 2003 Swets & Zeitlinger, Lisse, ISBN 90 5809 582 7 D. Mihajlovic, D. Kölbing, I. Kunz, S. Schwab,
Today. Events. Terrestrial Planet Atmospheres (continued) Homework DUE
 Homework DUE") Today Terrestrial Planet Atmospheres (continued) Events Homework DUE Sources of Gas Outgassing from volcanoes 2014 Pearson Education, Inc. Evaporation of surface liquid; sublimation of surface ice (cometary
Today Terrestrial Planet Atmospheres (continued) Events Homework DUE Sources of Gas Outgassing from volcanoes 2014 Pearson Education, Inc. Evaporation of surface liquid; sublimation of surface ice (cometary
Climate Classification
 Chapter 15: World Climates The Atmosphere: An Introduction to Meteorology, 12 th Lutgens Tarbuck Lectures by: Heather Gallacher, Cleveland State University Climate Classification Köppen classification:
Climate Dataset: Aitik Closure Project. November 28 th & 29 th, 2018
 1 Climate Dataset: Aitik Closure Project November 28 th & 29 th, 2018 Climate Dataset: Aitik Closure Project 2 Early in the Closure Project, consensus was reached to assemble a long-term daily climate
Brita Horlings
 Knut Christianson Brita Horlings brita2@uw.edu https://courses.washington.edu/ess431/ Natural Occurrences of Ice: Distribution and environmental factors of seasonal snow, sea ice, glaciers and permafrost
Transformational Climate Science. The future of climate change research following the IPCC Fifth Assessment Report
 Transformational Climate Science The future of climate change research following the IPCC Fifth Assessment Report www.exeter.ac.uk/climate2014 Working Group I The challenge of climate change #climate2014
Permafrost & climate change in northern Finland Dr Steve Gurney
 Permafrost & climate change in northern Finland Dr Steve Gurney Senior Lecturer in Geomorphology University of Reading, UK Docent in cold climate geomorphology University of Turku, Finland Topics Introduction
SECTION 2 How Is Pacific Northwest Climate Changing?
 SECTION 2 How Is Pacific Northwest Climate Changing? The Pacific Northwest is experiencing a suite of long-term changes that are consistent with those observed globally as a result of human-caused climate
World Geography Chapter 3
 World Geography Chapter 3 Section 1 A. Introduction a. Weather b. Climate c. Both weather and climate are influenced by i. direct sunlight. ii. iii. iv. the features of the earth s surface. B. The Greenhouse
3. Climate Change. 3.1 Observations 3.2 Theory of Climate Change 3.3 Climate Change Prediction 3.4 The IPCC Process
 3. Climate Change 3.1 Observations 3.2 Theory of Climate Change 3.3 Climate Change Prediction 3.4 The IPCC Process 3.1 Observations Need to consider: Instrumental climate record of the last century or
Abstract. Introduction. Geographical Setting
 Remote Sensing Data for Monitoring Periglacial Processes in Permafrost Areas: Terrestrial Laser Scanning at the Hinteres Langtalkar Rock Glacier, Austria Michael Avian Institute of Remote Sensing and Photogrammetry,
Ponce de Leon Middle School 6 th Grade Summer Instructional Packet
 Ponce de Leon Middle School 6 th Grade Summer Instructional Packet DIRECTIONS: 1. You are required to complete the Summer Instructional Packet. 2. Turn in your completed package to your teacher, when you
Thermal flow in glaciers: Application to the Lys Glacier (Italian Western Alps)
") Thermal flow in glaciers: Application to the Lys Glacier (Italian Western Alps) A. Deponti, L. De Biase & V. Pennati Environmental Science Department, University of Milano Bicocca, Italy Abstract In the
Thermal flow in glaciers: Application to the Lys Glacier (Italian Western Alps) A. Deponti, L. De Biase & V. Pennati Environmental Science Department, University of Milano Bicocca, Italy Abstract In the
Future Climate Change
 Future Climate Change How do you know whether to trust a prediction about the future? All predictions are based on global circulation models (GCMs, AOGCMs) - model accuracy is verified by its ability to
ATOC OUR CHANGING ENVIRONMENT
 ATOC 1060-002 OUR CHANGING ENVIRONMENT Class 22 (Chp 15, Chp 14 Pages 288-290) Objectives of Today s Class Chp 15 Global Warming, Part 1: Recent and Future Climate: Recent climate: The Holocene Climate
Mass balance of Storglaciären 2004/05
 Tarfala Research Station Annual Report 2004/2005 Mass balance of Storglaciären 2004/05 Yvo Snoek Dept. Physical Geography & Quaternary Geology, Stockholm University, Sweden and Department of Physical Geography,
Biomes and Biodiversity
 Biomes and Biodiversity Agenda 2/4/13 Biomes review terrestrial and aquatic Biodiversity Climate Change Introduction Weather Terrestrial Biomes Review Tundra Boreal Forest (Taiga) Temperate Forest Temperate
Spatial mountain permafrost modelling in the Daisetsu Mountains, northern Japan
 Permafrost, Phillips, Springman & Arenson (eds) 2003 Swets & Zeitlinger, Lisse, ISBN 90 5809 582 7 Spatial mountain permafrost modelling in the Daisetsu Mountains, northern Japan M. Ishikawa Frontier Observational
VERY HOT ALL YEAR WEATHER CONDITIONS IN A LONG TIME THE CONDITIONS FOR FEW DAYS
 WEATHER VERY HOT ALL YEAR CLIMATE WEATHER CONDITIONS IN A LONG TIME TROPICAL ZONE THERE ARE THE FOUR SEASONS TEMPERATE ZONE HERE IS FREEZING COLD ALL YEAR POLAR ZONE THE CONDITIONS FOR FEW DAYS Worksheet
Social Studies. Chapter 2 Canada s Physical Landscape
 Social Studies Chapter 2 Canada s Physical Landscape Introduction Canada s geography its landforms and climate - has a great impact on Canadians sense of identity. Planet Earth The earth is divided into
Climatic change in the Alps
 Climatic change in the Alps Prof. Martin Beniston Martin.Beniston@unige.ch Wengen-2006 Workshop Overview Introduction Current and future climate in the Alps Potential impacts Conclusions 1 Introduction
ATMOSPHERIC CIRCULATION AND WIND
 ATMOSPHERIC CIRCULATION AND WIND The source of water for precipitation is the moisture laden air masses that circulate through the atmosphere. Atmospheric circulation is affected by the location on the
Needs for traceability, to establish comparability in permafrost stations and networks
 MeteoMet International Workshop Metrology for High Mountains Climate Observational Issues Moncalieri, 15 th Feb. 2017 Needs for traceability, to establish comparability in permafrost stations and networks
netw rks Guided Reading Activity Essential Question: How does geography influence the way people live? Earth's Physical Geography
 Guided Reading Activity Lesson 1 Earth and the Sun Essential Question: How does geography influence the way people live? Looking at Earth Directions: What are the layers that make up Earth? Use your textbook
Glaciers form wherever snow and ice can accumulate High latitudes High mountains at low latitudes Ice temperatures vary among glaciers Warm
 The Cryosphere Glaciers form wherever snow and ice can accumulate High latitudes High mountains at low latitudes Ice temperatures vary among glaciers Warm (temperate) glaciers: at pressure melting point,
Climate Change or Climate Variability?
 Climate Change or Climate Variability? Key Concepts: Greenhouse Gas Climate Climate change Climate variability Climate zones Precipitation Temperature Water cycle Weather WHAT YOU WILL LEARN 1. You will
Chapter 52 An Introduction to Ecology and the Biosphere
 Chapter 52 An Introduction to Ecology and the Biosphere Ecology The study of the interactions between organisms and their environment. Ecology Integrates all areas of biological research and informs environmental
Malawi. General Climate. UNDP Climate Change Country Profiles. C. McSweeney 1, M. New 1,2 and G. Lizcano 1
 UNDP Climate Change Country Profiles Malawi C. McSweeney 1, M. New 1,2 and G. Lizcano 1 1. School of Geography and Environment, University of Oxford. 2. Tyndall Centre for Climate Change Research http://country-profiles.geog.ox.ac.uk
Chapter 7 Part III: Biomes
 Chapter 7 Part III: Biomes Biomes Biome: the major types of terrestrial ecosystems determined primarily by climate 2 main factors: Temperature and precipitation Depends on latitude or altitude; proximity
The Ice Age sequence in the Quaternary
 The Ice Age sequence in the Quaternary Subdivisions of the Quaternary Period System Series Stage Age (Ma) Holocene 0 0.0117 Tarantian (Upper) 0.0117 0.126 Quaternary Ionian (Middle) 0.126 0.781 Pleistocene
Bright blue marble floating in space. Biomes & Ecology
 Bright blue marble floating in space Biomes & Ecology Chapter 50 Spheres of life Molecules Cells (Tissues Organ Organ systems) Organisms Populations Community all the organisms of all the species that