Fri. Apr. 06, Map Projections Environmental Applications. Reading: Finish Chapter 9 ( Environmental Remote Sensing )
|
|
|
- Laura Peters
- 5 years ago
- Views:
Transcription
1 Fri. Apr. 06, 2018 Map Projections Environmental Applications Reading: Finish Chapter 9 ( Environmental Remote Sensing ) Once again -- Satellites old but principles still apply Skim Sabins Chapter 10. Oil Exploration Start reading Hewson et al "Seamless geological map generation using ASTER in the Broken Hill-Curnamona province of Australia." Remote Sensing of theenvironment 99: (link on class website "Reading List" Page 1
2 Independent Labs Independent labs next and following week Think about possible remote sensing topics Talk with me by next Friday about it, and about possible data sources 2
3 Chapter 9: Environmental Apps. Misc. Topics from chapter 9 (Environmental Remote Sensing) Won t go into it in as much detail as Sabins Ozone mapping Precipitation Ice (just summary we discussed this earlier) Ocean observations Bathymetry Ocean bottom geology from sonar Ocean Productivity 3

4 TOMS: Total Ozone Mapping Spectrometer Measure UV radiation in to μm range Compare incoming solar to backscattered light from lower atmosphere More Ozone means less UV makes it back out of atmosphere 1 Dobson unit = cm-atm 1 cm-atm = amount of gas which would form layer 1 cm deep if at STP Dec. 14, 2007

5 TOMS: Seasonal Formation of Hole 1 Dobson unit = cm-atm 1 cm-atm = amount of gas which would form layer 1 cm deep if at STP


6 Antarctic Ozone: Monthly, Yearly variations Hole reappears each Antarctic Spring Effects leveling off now Freon releases have stopped
 GOES Precipitation index: GPI Uses frequent IR cloud measurements In Tropics Coldest (<235K) clouds most associated")
7 Rainfall Mapping, 1 Precipitation critical for vegetation forecasts Rain gauges are just point measurements sparse over many regions and missing over oceans Radar estimates Use fact that radar is scattered by raindrops, not cloud particles Coverage is limited (GPM just launched) GOES Precipitation index: GPI Uses frequent IR cloud measurements In Tropics Coldest (<235K) clouds most associated with rain
8 Rainfall Mapping, 2 Passive Microwave Images Uses thermal emission from cm wavelength range Emission methods Looks for varying thermal emission over oceans Won t work over land too non-uniform Scattering methods Ice (present in high clouds) scatters upgoing thermal radiation Comparing Horizontal vs. Vertical Polarization indicates how much scattering has occurred Scattered light is polarized in horizontal plane (in & out of plane of paper. Newer work: and

9 GPM (Global Precipitation Mission) JAXA/NASA Launched Feb. 27, GHz Microwave Imager DPR: Dual-Frequency Precipitation Radar Ku, Ka (13.6, 35.5 GHz)

10 Global Rainfall Estimates (monthly)


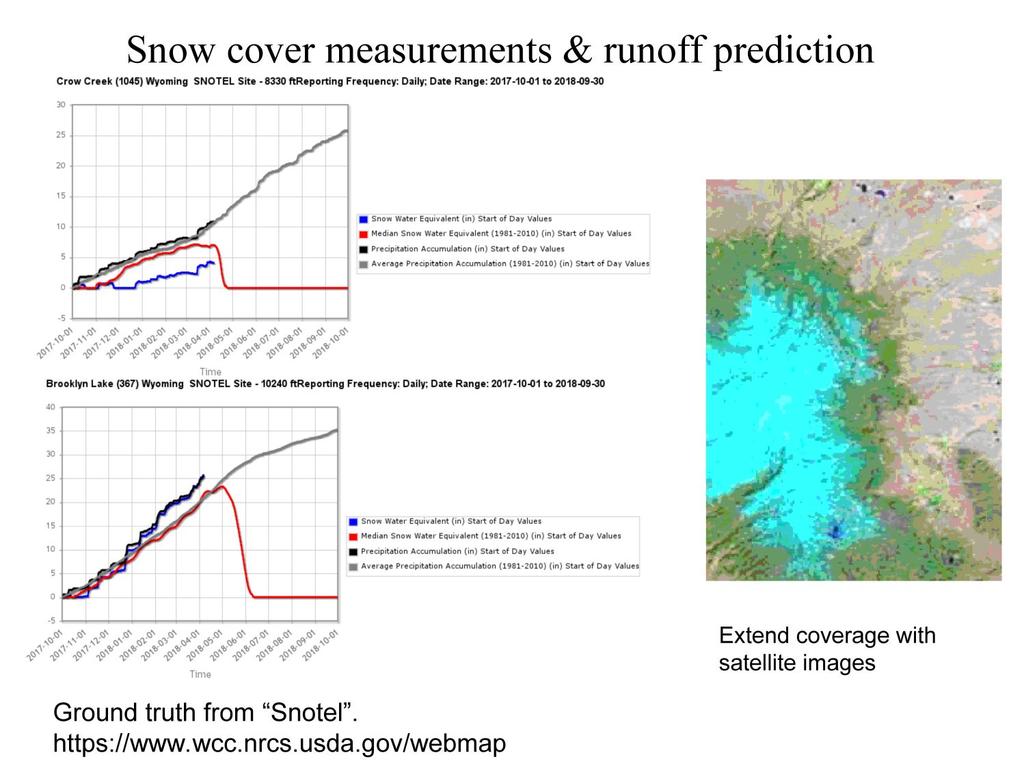
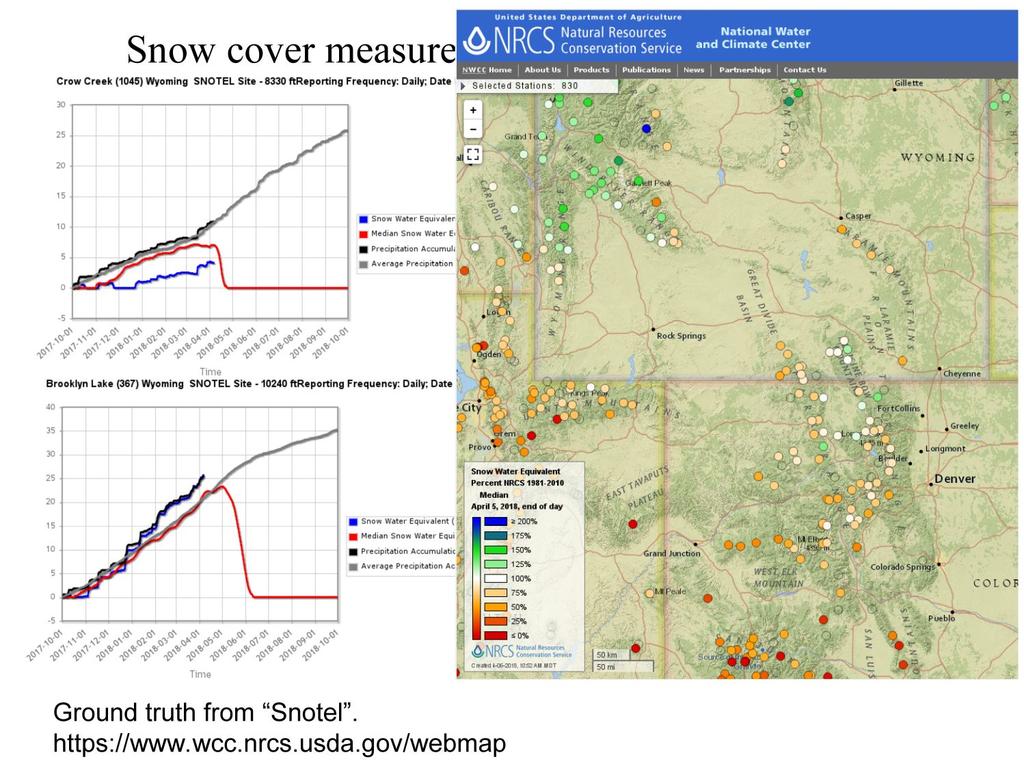
11 Monitoring snow fields, mountain snow pack and glaciers The snow cap of Mount Kilimanjaro may be gone in two decades. The ice fields on Africa s highest mountain shrank by 80 percent in the past century. The snow cap formed some 11,000 years ago. Landsat captured these images of Kilimanjaro February 17, 1993 and February 21, 2000.

12 Snowcover from AVHRR image

13 Snowpack and reflectance
14
15

16 Gamma Ray Surveys for Snow Water

17 Planetary Ice Mars H2O Inventory -- polar caps, ground ice Lunar Polar Ice Mercury Polar Ice Sensing technique: Polarization effects in radar Measure amount of neutrons of various speeds Presence of H moderates fast neutrons

18 Ground Penetrating Radar Sharad Ground Penetrating Radar on Mars Image from RadarsatTeam
19 Antarctic Ice and Sea Ice Ship information for arctic waters Global Change Imaging, Laser Altimeter, and Radar data important Radar can observe in cloudy regions Radar can help characterize ice types based on roughness Radar (interferometry) can measure flow rates Much of radar data in text is from Seasat Oct June 1978 Newer RadarSat (Canadian satellite) and ERS and ENVISAT (European satellites) data available CryoSat 2 launched Spring 2010 ENVISAT failed April 2012


20 Laser Elevation from IceSat: Ice, Cloud, and Elevation Satellite: Greenland 2003 launch laser died in October 2009 follow-on satellites should give more coverage Monitor changing ice thickness Laser pulses: 40 per second (170m spacing) Laser spot size: 70 m Vertical resolution: 5 cm for single pulse Repeat cycle: 8 days early in mission, 183 days during multiyear phase Theses images from Korn et al. on-line poster from Korn et al. on-line poster
 at NSIDC.")
21 Changes in Greenland Ice thickness Previously observed changes in Greenland ice thickness, from various airborn measurements: Edges thinning by up to 60 cm/yr Center thickening by 10 cm/yr Image from IceSat web site IceSat data available as DEM's from NSIDC (National Snow and Ice Data Center) at NSIDC.ORG
22 CryoSat 2 Launched Spring 2010 European Radar mission to monitor changes in Arctic ice Improved version of techniques tested on earlier ERS radar satellite Radar avoids problems with clouds Original CryoSat lost in launch failure Oct (on converted Russian ICBM) Orbit High inclination 92o (data up to 88o lat.) 700 km altitude NON sun synchronous Main instrument = SIRAL: SAR Interferometric Radar Altimeter 250 m resolution along track from SAR Two-antenna interferometry for cross-track resolution Can measure freeboard of floating ice as well as mapping location Can monitor changes in thickness of grounded ice sheets Has other radio receivers and laser retroreflectors so satellite position can be determined very accurately (since you want absolute elevation of ice)
23 CryoSat 2 Doppler SAR + Interferometry Main instrument = SIRAL: SAR Interferometric Radar Altimeter 250 m resolution along track from SAR Two-antenna interferometry for cross-track resolution
24 CryoSat 2 Primary Goals: Determine regional trends in Arctic perennial sea-ice thickness and mass; Determine the contribution that the Antarctic and Greenland ice sheets are making to mean global rise is sea level. Secondary Goals Observe the seasonal cycle and inter-annual variability of Arctic and Antarctic sea-ice mass and thickness; Observe the variation in the thickness of Earth's ice caps and glaciers. Measurement goals: At least 3 years of measurements Arctic Sea Ice Regional Scale Ice Sheets Antarctic Ice Sheets 1.6 cm/yr 3.3 cm/yr 0.17 cm/yr
25 Wilkins Ice Shelf Collapse: MODIS Images Recent changes


26 IceSat: Antarctic Data From Korn et al. on-line poster Foundation Ice Stream Megadunes
27 Antarctic Geography, Summary Ice shelves floating, their melting doesn t raise sea level but may enable on-land ice sheets to flow to oceans more easily symptom of climate change W Antarctic Ice Sheet: 6 m of sea level rise E Antarctic Ice Sheet: 73 m of sea level rise (Greenland ~ 7 m) USGS assembling archive of Landsat MSS and other data back to early 1970 s

28 Antarctic Geography, Summary Largest warming along Antarctic Peninsula: 0.5oC / decade for last 5 decades Several ice shelve there have collapsed Larsen Ice shelf Wilkens Ice shelf Other locations we ll discuss: Filchner Ice Shelf
 suggests such break-ups unusual Terra MODIS data from NSIDC")
29 Larsen B Ice Shelf Break-up: 2002 event Break-up events in late 1990 s and 2002 Recent studies of seafloor (drop stones) suggests such break-ups unusual Terra MODIS data from NSIDC 2002_01_31
 suggests such break-ups unusual Terra MODIS data from NSIDC 2002_02_17 790 km2")
30 Larsen B Ice Shelf Break-up: 2002 event Break-up events in late 1990 s and 2002 Recent studies of seafloor (drop stones) suggests such break-ups unusual Terra MODIS data from NSIDC 2002_02_ km2 lost
 suggests such break-ups unusual Terra MODIS data from NSIDC 2002_02_23 1960 km2")
31 Larsen B Ice Shelf Break-up: 2002 event Break-up events in late 1990 s and 2002 Recent studies of seafloor (drop stones) suggests such break-ups unusual Terra MODIS data from NSIDC 2002_02_ km2 lost
 suggests such break-ups unusual Terra MODIS data from NSIDC 2002_03_05 525 km2")
32 Larsen B Ice Shelf Break-up: 2002 event Break-up events in late 1990 s and 2002 Recent studies of seafloor (drop stones) suggests such break-ups unusual Terra MODIS data from NSIDC 2002_03_ km2 lost

33 Wilkins Ice Shelf Collapse MODIS Images Blue = deep glacial ice 41 x 2.5 km iceberg separated Triggered 405 km2 collapse km2 region probably about to go

34 RadarSat (1) Observations of Glacier Flow Radarsat (1) interferometric measurements of glacier movement over 24 days 100x100 km Recovery Glacier, drains to Filchner Ice Shelf Speed color coded: slow fast blue, green, yellow, red Fastest measured rates are 340 m/yr ~ 1 km/yr at end of glacier where interferometry fails Image from RadarsatTeam
Remote sensing of sea ice
 Remote sensing of sea ice Ice concentration/extent Age/type Drift Melting Thickness Christian Haas Remote Sensing Methods Passive: senses shortwave (visible), thermal (infrared) or microwave radiation
Remote Sensing I: Basics
 Remote Sensing I: Basics Kelly M. Brunt Earth System Science Interdisciplinary Center, University of Maryland Cryospheric Science Laboratory, Goddard Space Flight Center kelly.m.brunt@nasa.gov (Based on
CryoSat: ESA s Ice Mission:
 CryoSat: ESA s Ice Mission: 6 years in operations: status and achievements T. Parrinello CryoSat Mission Manager M. Drinkwater Mission Scientist CryoSat March 2016 sea-ice thickness CryoSat: A bit of history
Remote Sensing in Meteorology: Satellites and Radar. AT 351 Lab 10 April 2, Remote Sensing
 Remote Sensing in Meteorology: Satellites and Radar AT 351 Lab 10 April 2, 2008 Remote Sensing Remote sensing is gathering information about something without being in physical contact with it typically
GEOSC/METEO 597K Kevin Bowley Kaitlin Walsh
 GEOSC/METEO 597K Kevin Bowley Kaitlin Walsh Timeline of Satellites ERS-1 (1991-2000) NSCAT (1996) Envisat (2002) RADARSAT (2007) Seasat (1978) TOPEX/Poseidon (1992-2005) QuikSCAT (1999) Jason-2 (2008)
Interpretation of Polar-orbiting Satellite Observations. Atmospheric Instrumentation
 Interpretation of Polar-orbiting Satellite Observations Outline Polar-Orbiting Observations: Review of Polar-Orbiting Satellite Systems Overview of Currently Active Satellites / Sensors Overview of Sensor
EUMETSAT STATUS AND PLANS
 1 EUM/TSS/VWG/15/826793 07/10/2015 EUMETSAT STATUS AND PLANS François Montagner, Marine Applications Manager, EUMETSAT WMO Polar Space Task Group 5 5-7 October 2015, DLR, Oberpfaffenhofen PSTG Strategic
CryoSat-2: A new perspective on Antarctica
 CryoSat-2: A new perspective on Antarctica K. Briggs 1, R. Cullen 2, L. Foresta 3, R. Francis 2, A. Hogg 1, M. McMillan 1, A. Muir 4, N. Galin 4, L. Gilbert 4, N. Gourmelen 3, A. Ridout 4, A. Shepherd
Components of the Climate System. Lecture 2: Earth s Climate System. Pop Quiz. Sub-components Global cycles What comes in What goes out
 Lecture 2: Earth s Climate System Components of the Climate System terrestrial radiation Atmosphere Ocean solar radiation Land Energy, Water, and Biogeochemistry Cycles Sub-components Global cycles What
Lecture 2: Earth s Climate System
 Lecture 2: Earth s Climate System terrestrial radiation solar radiation Atmosphere Ocean Solid Earth Land Energy, Water, and Biogeochemistry Cycles Sub-components Global cycles What comes in What goes
ACTIVITY II: THE FATE OF THE LARSEN S, A FAMILY OF ANTARCTIC ICE SHELVES
 ACTIVITY II: THE FATE OF THE LARSEN S, A FAMILY OF ANTARCTIC ICE SHELVES Ice Shelves play a critical role in Antarctica, serving as a buffer between the ocean and the continental ice sheet covering the
The ICESat 2 Mission Laser altimetry of ice, clouds and land elevation
 OSTM SWT San Diego October 2011 The ICESat 2 Mission Laser altimetry of ice, clouds and land elevation and also ocean, coastal, and continental waters Charon Birkett, ESSIC/UMD on behalf of T. Markus,
Spectral Albedos. a: dry snow. b: wet new snow. c: melting old snow. a: cold MY ice. b: melting MY ice. d: frozen pond. c: melting FY white ice
 Spectral Albedos a: dry snow b: wet new snow a: cold MY ice c: melting old snow b: melting MY ice d: frozen pond c: melting FY white ice d: melting FY blue ice e: early MY pond e: ageing ponds Extinction
Exploring The Polar Connection to Sea Level Rise NGSS Disciplinary Core Ideas Science & Engineering Crosscutting Concepts
 Exploring The Polar Connection to Sea Level Rise NGSS Disciplinary Core Ideas Science & Engineering Crosscutting Concepts Practices MS - ESS: Earth & Space Science 1. Ask questions 2. Developing and using
Ice sheet mass balance from satellite altimetry. Kate Briggs (Mal McMillan)
") Ice sheet mass balance from satellite altimetry Kate Briggs (Mal McMillan) Outline Background Recap 25 year altimetry record Recap Measuring surface elevation with altimetry Measuring surface elevation
Ice sheet mass balance from satellite altimetry Kate Briggs (Mal McMillan) Outline Background Recap 25 year altimetry record Recap Measuring surface elevation with altimetry Measuring surface elevation
Lecture 19: Operational Remote Sensing in Visible, IR, and Microwave Channels
 MET 4994 Remote Sensing: Radar and Satellite Meteorology MET 5994 Remote Sensing in Meteorology Lecture 19: Operational Remote Sensing in Visible, IR, and Microwave Channels Before you use data from any
Meteorological Satellite Image Interpretations, Part III. Acknowledgement: Dr. S. Kidder at Colorado State Univ.
 Meteorological Satellite Image Interpretations, Part III Acknowledgement: Dr. S. Kidder at Colorado State Univ. Dates EAS417 Topics Jan 30 Introduction & Matlab tutorial Feb 1 Satellite orbits & navigation
DLR s TerraSAR-X contributes to international fleet of radar satellites to map the Arctic and Antarctica
 DLR s TerraSAR-X contributes to international fleet of radar satellites to map the Arctic and Antarctica The polar regions play an important role in the Earth system. The snow and ice covered ocean and
Earth Exploration-Satellite Service (EESS)- Active Spaceborne Remote Sensing and Operations
- Active Spaceborne Remote Sensing and Operations") Earth Exploration-Satellite Service (EESS)- Active Spaceborne Remote Sensing and Operations SRTM Radarsat JASON Seawinds TRMM Cloudsat Bryan Huneycutt (USA) Charles Wende (USA) WMO, Geneva, Switzerland
Earth Exploration-Satellite Service (EESS)- Active Spaceborne Remote Sensing and Operations SRTM Radarsat JASON Seawinds TRMM Cloudsat Bryan Huneycutt (USA) Charles Wende (USA) WMO, Geneva, Switzerland
Reminder: All answers MUST GO ON ANSWER SHEET! Answers recorded in the exam booklet will not count.
 Reminder: All answers MUST GO ON ANSWER SHEET! Answers recorded in the exam booklet will not count. 1. Identify the following acronyms; compare these platform types; provide situations where one platform
A two-season impact study of the Navy s WindSat surface wind retrievals in the NCEP global data assimilation system
 A two-season impact study of the Navy s WindSat surface wind retrievals in the NCEP global data assimilation system Li Bi James Jung John Le Marshall 16 April 2008 Outline WindSat overview and working
This presentation was assembled as part of the outreach initiative for the Canadian Network for the Detection of Atmospheric Change.
 This will be a lesson for students in grades 9-12. The subject matter is climate change - the greenhouse effect, greenhouse gases, how greenhouse gases are measured and studied, and the impacts of climate
Climate Roles of Land Surface
 Lecture 5: Land Surface and Cryosphere (Outline) Climate Roles Surface Energy Balance Surface Water Balance Sea Ice Land Ice (from Our Changing Planet) Surface Albedo Climate Roles of Land Surface greenhouse
Precipitation, snow accumulation and sea ice thickness over the Arctic Ocean
 Precipitation, snow accumulation and sea ice thickness over the Arctic Ocean Alek Petty, Linette Boisvert, Melinda Webster, Thorsten Markus, Nathan Kurtz, Jeremy Harbeck www.alekpetty.com / @alekpetty
HY-2A Satellite User s Guide
 National Satellite Ocean Application Service 2013-5-16 Document Change Record Revision Date Changed Pages/Paragraphs Edit Description i Contents 1 Introduction to HY-2 Satellite... 1 2 HY-2 satellite data
- satellite orbits. Further Reading: Chapter 04 of the text book. Outline. - satellite sensor measurements
 (1 of 12) Further Reading: Chapter 04 of the text book Outline - satellite orbits - satellite sensor measurements - remote sensing of land, atmosphere and oceans (2 of 12) Introduction Remote Sensing:
Radio Frequency Earth Science
 Radio Frequency Earth Science Overview for Committee On Radio Frequency (CORF) National Academy of Science National Research Council April 27, 2005 Bill.Watson@NASA.Gov Program Executive for Ground Networks
Today s Lecture: Land, biosphere, cryosphere (All that stuff we don t have equations for... )
") Today s Lecture: Land, biosphere, cryosphere (All that stuff we don t have equations for... ) 4 Land, biosphere, cryosphere 1. Introduction 2. Atmosphere 3. Ocean 4. Land, biosphere, cryosphere 4.1 Land
Today s Lecture: Land, biosphere, cryosphere (All that stuff we don t have equations for... ) 4 Land, biosphere, cryosphere 1. Introduction 2. Atmosphere 3. Ocean 4. Land, biosphere, cryosphere 4.1 Land
Climate & Earth System Science. Introduction to Meteorology & Climate. Chapter 05 SOME OBSERVING INSTRUMENTS. Instrument Enclosure.
 Climate & Earth System Science Introduction to Meteorology & Climate MAPH 10050 Peter Lynch Peter Lynch Meteorology & Climate Centre School of Mathematical Sciences University College Dublin Meteorology
Using Remote-sensed Sea Ice Thickness, Extent and Speed Observations to Optimise a Sea Ice Model
 Using Remote-sensed Sea Ice Thickness, Extent and Speed Observations to Optimise a Sea Ice Model Paul Miller, Seymour Laxon, Daniel Feltham, Douglas Cresswell Centre for Polar Observation and Modelling
APPENDIX 2 OVERVIEW OF THE GLOBAL PRECIPITATION MEASUREMENT (GPM) AND THE TROPICAL RAINFALL MEASURING MISSION (TRMM) 2-1
 AND THE TROPICAL RAINFALL MEASURING MISSION (TRMM) 2-1") APPENDIX 2 OVERVIEW OF THE GLOBAL PRECIPITATION MEASUREMENT (GPM) AND THE TROPICAL RAINFALL MEASURING MISSION (TRMM) 2-1 1. Introduction Precipitation is one of most important environmental parameters.
APPENDIX 2 OVERVIEW OF THE GLOBAL PRECIPITATION MEASUREMENT (GPM) AND THE TROPICAL RAINFALL MEASURING MISSION (TRMM) 2-1 1. Introduction Precipitation is one of most important environmental parameters.
Is the Number of Icebergs Around Antarctica Really Increasing?
 Is the Number of Icebergs Around Antarctica Really Increasing? David G. Long* and Jarom Ballantyne Brigham Young University 459 Clyde Building Provo UT 84601 long@ee.byu.edu Cheryl Bertoia U. S. National
RADAR Remote Sensing Application Examples
 RADAR Remote Sensing Application Examples! All-weather capability: Microwave penetrates clouds! Construction of short-interval time series through cloud cover - crop-growth cycle! Roughness - Land cover,
Microwave Remote Sensing of Soil Moisture. Y.S. Rao CSRE, IIT, Bombay
 Microwave Remote Sensing of Soil Moisture Y.S. Rao CSRE, IIT, Bombay Soil Moisture (SM) Agriculture Hydrology Meteorology Measurement Techniques Survey of methods for soil moisture determination, Water
Ice Sheets and Glaciers
 Ice Sheets and Glaciers Technical University of Denmark Kees van der Veen Department of Geography University of Kansas Why are glaciers and ice sheets important? Large volume of fresh water stored in ice
ESM 186 Environmental Remote Sensing and ESM 186 Lab Syllabus Winter 2012
 ESM 186 Environmental Remote Sensing and ESM 186 Lab Syllabus Winter 2012 Instructor: Susan Ustin (slustin@ucdavis.edu) Phone: 752-0621 Office: 233 Veihmeyer Hall and 115A, the Barn Office Hours: Tuesday
Welcome and Introduction
 Welcome and Introduction Riko Oki Earth Observation Research Center (EORC) Japan Aerospace Exploration Agency (JAXA) 7th Workshop of International Precipitation Working Group 17 November 2014 Tsukuba International
2 nd Asia CryoNet Workshop Current methods of measurement of the cryosphere in Asia consistency and issues
 2 nd Asia CryoNet Workshop Current methods of measurement of the cryosphere in Asia consistency and issues Dongqi Zhang, Cunde Xiao, Vladimir Aizen and Wolfgang Schöner Feb.5, 2016, Salekhard, Russia 1.
New NASA Ocean Observations and Coastal Applications
 New NASA Ocean Observations and Coastal Applications Duane Armstrong Chief, Applied Science & Technology Project Office August 20, 2014 1 Outline NASA s new Earth Science Ocean Science Missions for 2014
Remote Sensing of Snow GEOG 454 / 654
 Remote Sensing of Snow GEOG 454 / 654 What crysopheric questions can RS help to answer? 2 o Where is snow lying? (Snow-covered area or extent) o How much is there? o How rapidly is it melting? (Area, depth,
Merged sea-ice thickness product from complementary L-band and altimetry information
 Merged sea-ice thickness product from complementary L-band and altimetry information Contributors AWI Team Stefan Hendricks Robert Ricker Stephan Paul University Hamburg Team Lars Kaleschke Xiangshan Tian-Kunze
Remote Sensing of Precipitation
 Lecture Notes Prepared by Prof. J. Francis Spring 2003 Remote Sensing of Precipitation Primary reference: Chapter 9 of KVH I. Motivation -- why do we need to measure precipitation with remote sensing instruments?
The continent of Antarctica Resource N1
 The continent of Antarctica Resource N1 Prepared by Gillian Bunting Mapping and Geographic Information Centre, British Antarctic Survey February 1999 Equal area projection map of the world Resource N2
REVISION OF THE STATEMENT OF GUIDANCE FOR GLOBAL NUMERICAL WEATHER PREDICTION. (Submitted by Dr. J. Eyre)
") WORLD METEOROLOGICAL ORGANIZATION Distr.: RESTRICTED CBS/OPAG-IOS (ODRRGOS-5)/Doc.5, Add.5 (11.VI.2002) COMMISSION FOR BASIC SYSTEMS OPEN PROGRAMME AREA GROUP ON INTEGRATED OBSERVING SYSTEMS ITEM: 4 EXPERT
WORLD METEOROLOGICAL ORGANIZATION Distr.: RESTRICTED CBS/OPAG-IOS (ODRRGOS-5)/Doc.5, Add.5 (11.VI.2002) COMMISSION FOR BASIC SYSTEMS OPEN PROGRAMME AREA GROUP ON INTEGRATED OBSERVING SYSTEMS ITEM: 4 EXPERT
Global Ocean Heat Content (0-700m) Other signs of (global) warming. Global Sea Level Rise. Change in upper ocean temperature ( )
 Other signs of (global) warming. Global Sea Level Rise. Change in upper ocean temperature ( )") Global Ocean Heat Content (0-700m) Change in upper ocean temperature (1955-2003) 0.25C 0.50C Solid lines are three independent estimates (95% confidence interval in grey) IPCC 2007 Fig TS.16 Trends in
Global Ocean Heat Content (0-700m) Change in upper ocean temperature (1955-2003) 0.25C 0.50C Solid lines are three independent estimates (95% confidence interval in grey) IPCC 2007 Fig TS.16 Trends in
ATOC OUR CHANGING ENVIRONMENT Class 19 (Chp 6) Objectives of Today s Class: The Cryosphere [1] Components, time scales; [2] Seasonal snow
![ATOC OUR CHANGING ENVIRONMENT Class 19 (Chp 6) Objectives of Today s Class: The Cryosphere [1] Components, time scales; [2] Seasonal snow](/thumbs/95/126309683.jpg "ATOC OUR CHANGING ENVIRONMENT Class 19 (Chp 6) Objectives of Today s Class: The Cryosphere [1] Components, time scales; [2] Seasonal snow") ATOC 1060-002 OUR CHANGING ENVIRONMENT Class 19 (Chp 6) Objectives of Today s Class: The Cryosphere [1] Components, time scales; [2] Seasonal snow cover, permafrost, river and lake ice, ; [3]Glaciers and
ATOC 1060-002 OUR CHANGING ENVIRONMENT Class 19 (Chp 6) Objectives of Today s Class: The Cryosphere [1] Components, time scales; [2] Seasonal snow cover, permafrost, river and lake ice, ; [3]Glaciers and
GEOG Lecture 8. Orbits, scale and trade-offs
 Environmental Remote Sensing GEOG 2021 Lecture 8 Orbits, scale and trade-offs Orbits revisit Orbits geostationary (36 000 km altitude) polar orbiting (200-1000 km altitude) Orbits revisit Orbits geostationary
"Ice Sheets and Sea Level Rise: How Should IPCC Handle Deep Uncertainty?" Michael Oppenheimer For Inside the IPCC Princeton University 1 April 2008
 "Ice Sheets and Sea Level Rise: How Should IPCC Handle Deep Uncertainty?" Michael Oppenheimer For Inside the IPCC Princeton University 1 April 2008 This Talk is about: IPCCs (controversial) assessment
Remote Sensing and GIS. Microwave Remote Sensing and its Applications
 Subject Paper No and Title Module No and Title Module Tag Geology Remote Sensing and GIS Microwave Remote Sensing and its Applications RS & GIS XVII Principal Investigator Co-Principal Investigator Co-Principal
WELCOME TO PERIOD 14:CLIMATE CHANGE. Homework #13 is due today.
 WELCOME TO PERIOD 14:CLIMATE CHANGE Homework #13 is due today. Note: Homework #14 due on Thursday or Friday includes using a web site to calculate your carbon footprint. You should complete this homework
NASA Images of Antarctica and the Arctic covered in both land and sea ice
 ICE SHELVES ACTIVITY 1: DECODING THE ROLE OF ANTARCTIC ICE IN GLOBAL CLIMATE Ice Shelves play a critical role in Antarctica, serving as a buffer between the ocean and the continental ice sheet covering
Status of Indian Satellite Meteorological Programme
 Status of Indian Satellite Meteorological Programme Pradeep K Thapliyal Space Applications Centre (SAC) Indian Space research Organisation (ISRO) Ahmedabad (INDIA) Email: pkthapliyal@sac.isro.gov.in International
K&C Phase 4 Status report. Ice Sheet Monitoring using ALOS-2. University of California, Irvine 2 JPL
 K&C Phase 4 Status report Ice Sheet Monitoring using ALOS-2 Bernd Scheuchl 1, Jeremie Mouginot 1, Eric Rignot 1,2 1 University of California, Irvine 2 JPL Science Team meeting #24 Tokyo, Japan, January
REMOTE SENSING OF THE ATMOSPHERE AND OCEANS
 EAS 6145 SPRING 2007 REMOTE SENSING OF THE ATMOSPHERE AND OCEANS Instructor: Prof. Irina N. Sokolik office 2258, phone 404-894-6180 isokolik@eas.gatech.edu Meeting Time: Mondays: 3:05-4:25 PM Wednesdays:
Lake ice cover and surface water temperature II: Satellite remote sensing
 Lake ice cover and surface water temperature II: Satellite remote sensing Claude Duguay University of Waterloo (Canada) Earth Observation Summer School ESA-ESRIN, Frascati, Italy (4-14 August 2014) Lecture
Active microwave systems (2) Satellite Altimetry * the movie * applications
 Satellite Altimetry * the movie * applications") Remote Sensing: John Wilkin wilkin@marine.rutgers.edu IMCS Building Room 211C 732-932-6555 ext 251 Active microwave systems (2) Satellite Altimetry * the movie * applications Altimeters (nadir pointing
Remote Sensing: John Wilkin wilkin@marine.rutgers.edu IMCS Building Room 211C 732-932-6555 ext 251 Active microwave systems (2) Satellite Altimetry * the movie * applications Altimeters (nadir pointing
1 IntroductIon to the cryosphere
 1 IntroductIon to the cryosphere in this place, nostalgia roams, patient as slow hands on skin, transparent as melt-water. nights are light and long. Shadows settle on the shoulders of air. time steps
Torben Königk Rossby Centre/ SMHI
 Fundamentals of Climate Modelling Torben Königk Rossby Centre/ SMHI Outline Introduction Why do we need models? Basic processes Radiation Atmospheric/Oceanic circulation Model basics Resolution Parameterizations
Studies of Austfonna ice cap (Svalbard) using radar altimetry with other satellite techniques
 using radar altimetry with other satellite techniques") 15 Years of progress in Radar Altimetry Symposium Ocean surface topography science team (OSTST) International Doris Service (IDS) Workshop, Argo Workshop 13-18 March 2006, Venice, Italy Alexei V. Kouraev,
15 Years of progress in Radar Altimetry Symposium Ocean surface topography science team (OSTST) International Doris Service (IDS) Workshop, Argo Workshop 13-18 March 2006, Venice, Italy Alexei V. Kouraev,
Observations of Arctic snow and sea ice thickness from satellite and airborne surveys. Nathan Kurtz NASA Goddard Space Flight Center
 Observations of Arctic snow and sea ice thickness from satellite and airborne surveys Nathan Kurtz NASA Goddard Space Flight Center Decline in Arctic sea ice thickness and volume Kwok et al. (2009) Submarine
How Will Melting Ice Sheets Affect Us?
 PASSAGE 4 How Will Melting Ice Sheets Affect Us? Variation is normal. During the last ice age, for example, ice sheets also covered much of North America and Scandinavia. Why is what s happening now different
Future Climate and Sea Level
 Future Climate and Sea Level Tonight: 2 nd night on human changes and controversy around them. three night series : 1) An Inconvenient truth 2) Impacts: Observed Warming and Projected Sea Level Changes
Ice & Snow Session. Chairs: J. Mouginot & N. Gourmelen
 Ice & Snow Session Chairs: J. Mouginot & N. Gourmelen Session 12 talks and 10 posters Antarctic ice motion, ground-line detection and monitoring, dynamics ice-fluctuations in Antarctica and Greenland,
Annual September Arctic Sea ice extent
 Annual September Arctic Sea ice extent 1979-2012 Annual September Arctic Sea ice extent 1979-2012 Notes: The month of September has the minimum sea ice cover each year. Passive microwave instruments on
Application Status and Prospect of Microwave Remote Sensing
 2017 International Conference on Computing, Communications and Automation(I3CA 2017) Application Status and Prospect of Microwave Remote Sensing Cheng Lele, Yan Xinsui, Zhou Mengqiu, Zhou Yongqin, Wang
Climate change: How do we know?
 Climate change: How do we know? This graph, based on the comparison of atmospheric samples contained in ice cores and more recent direct measurements, provides evidence that atmospheric CO2 has increased
The State of the cryosphere
 The State of the cryosphere Course outline Introduction The cryosphere; what is it? The Earth; a unique planet Cryospheric components Classifications Lecture outlines The State of the cryosphere The State
The Earth Explorer Missions - Current Status
 EOQ N 66 July 2000 meteorology earthnet remote sensing solid earth future programmes Earth Observation Quarterly The Earth Explorer Missions - Current Status G. Mégie (1) and C.J. Readings (2) (1) Institut
Radar mapping of snow melt over mountain glaciers in High Mountain Asia Mentor: Tarendra Lakhankar Collaborators: Nir Krakauer, Kyle MacDonald and
 Radar mapping of snow melt over mountain glaciers in High Mountain Asia Mentor: Tarendra Lakhankar Collaborators: Nir Krakauer, Kyle MacDonald and Nick Steiner How are Glaciers Formed? Glaciers are formed
National Aeronautics and Space Administration. Earth Day is everyday at NASA. activity booklet
 National Aeronautics and Space Administration Earth Day is everyday at NASA activity booklet Earth Day is everyday at NASA NASA s Fleet of Earth Observing Satellites ACRIMSAT Landsat 7 Aqua SORCE Terra
Extremes of Weather and the Latest Climate Change Science. Prof. Richard Allan, Department of Meteorology University of Reading
 Extremes of Weather and the Latest Climate Change Science Prof. Richard Allan, Department of Meteorology University of Reading Extreme weather climate change Recent extreme weather focusses debate on climate
PRINCIPLES OF REMOTE SENSING. Electromagnetic Energy and Spectral Signatures
 PRINCIPLES OF REMOTE SENSING Electromagnetic Energy and Spectral Signatures Remote sensing is the science and art of acquiring and analyzing information about objects or phenomena from a distance. As humans,
ELECTROMAGNETIC SPECTRUM All waves travel the SAME speed (the speed of light) 300,000 km/sec (186,000 miles/sec) in a vacuum
 300,000 km/sec (186,000 miles/sec) in a vacuum") ELECTROMAGNETIC SPECTRUM All waves travel the SAME speed (the speed of light) 300,000 km/sec (186,000 miles/sec) in a vacuum 10 4 Hz 10 6 Hz 10 8 Hz 10 12 Hz 10 14 Hz 10 16 Hz 10 18 Hz 1 million 1 trillion
ELECTROMAGNETIC SPECTRUM All waves travel the SAME speed (the speed of light) 300,000 km/sec (186,000 miles/sec) in a vacuum 10 4 Hz 10 6 Hz 10 8 Hz 10 12 Hz 10 14 Hz 10 16 Hz 10 18 Hz 1 million 1 trillion
1. The frequency of an electromagnetic wave is proportional to its wavelength. a. directly *b. inversely
 CHAPTER 3 SOLAR AND TERRESTRIAL RADIATION MULTIPLE CHOICE QUESTIONS 1. The frequency of an electromagnetic wave is proportional to its wavelength. a. directly *b. inversely 2. is the distance between successive
S3-A Land and Sea Ice Cyclic Performance Report. Cycle No Start date: 21/04/2017. End date: 18/05/2017
 PREPARATION AND OPERATIONS OF THE MISSION PERFORMANCE CENTRE (MPC) FOR THE COPERNICUS SENTINEL-3 MISSION Cycle No. 017 Start date: 21/04/2017 End date: 18/05/2017 Ref. S3MPC.UCL.PR.08-017 Contract: 4000111836/14/I-LG
Grade 8 Science. Unit 1: Water Systems on Earth Chapter 1
 Grade 8 Science Unit 1: Water Systems on Earth Chapter 1 Effects of Water? Churchill River Large Ocean Wave How do you use water? House Hold Use Personal Use Recreational Activities Water Distribution
Today we will discuss global climate: how it has changed in the past, and how the current status and possible future look.
 Global Climate Change Today we will discuss global climate: how it has changed in the past, and how the current status and possible future look. If you live in an area such as the Mississippi delta (pictured)
S3-A Land and Sea Ice Cyclic Performance Report. Cycle No Start date: 30/09/2017. End date: 27/10/2017
 PREPARATION AND OPERATIONS OF THE MISSION PERFORMANCE CENTRE (MPC) FOR THE COPERNICUS SENTINEL-3 MISSION Start date: 30/09/2017 End date: 27/10/2017 Ref. S3MPC.UCL.PR.08-023 Contract: 4000111836/14/I-LG
10/24/2010. Venus Roman goddess of love. Bulk Properties. Summary. Venus is easier to observe than Mercury! Venus and Earth
 Venus Roman goddess of love Birth of Venus Botticelli (1485) Bulk Properties Summary 1. Venus is 28% closer to the Sun having an orbital period of 225 Earth days 2. Venus is roughly 95% the size, 82% the
6. What has been the most effective erosive agent in the climate system? a. Water b. Ice c. Wind
 Multiple Choice. 1. Heinrich Events a. Show increased abundance of warm-water species of planktic foraminifera b. Show greater intensity since the last deglaciation c. Show increased accumulation of ice-rafted
Chapter 10 Planetary Atmospheres Earth and the Other Terrestrial Worlds. What is an atmosphere? Planetary Atmospheres
 Chapter 10 Planetary Atmospheres Earth and the Other Terrestrial Worlds What is an atmosphere? Planetary Atmospheres Pressure Composition Greenhouse effect Atmospheric structure Color of the sky 1 Atmospheres
Lecture 21: Glaciers and Paleoclimate Read: Chapter 15 Homework due Thursday Nov. 12. What we ll learn today:! Learning Objectives (LO)
") Learning Objectives (LO) Lecture 21: Glaciers and Paleoclimate Read: Chapter 15 Homework due Thursday Nov. 12 What we ll learn today:! 1. 1. Glaciers and where they occur! 2. 2. Compare depositional and
Learning Objectives (LO) Lecture 21: Glaciers and Paleoclimate Read: Chapter 15 Homework due Thursday Nov. 12 What we ll learn today:! 1. 1. Glaciers and where they occur! 2. 2. Compare depositional and
Long-Term Time Series of Water Vapour Total Columns from GOME, SCIAMACHY and GOME-2
 Graphics: ESA Graphics: ESA Graphics: ESA Long-Term Time Series of Water Vapour Total Columns from GOME, SCIAMACHY and GOME-2 S. Noël, S. Mieruch, H. Bovensmann, J. P. Burrows Institute of Environmental
2006 UAH REGIONAL SCIENCE OLYMPIAD DYNAMIC PLANET EXAM
 2006 UAH REGIONAL SCIENCE OLYMPIAD DYNAMIC PLANET EXAM INSTRUCTIONS WRITE YOUR GROUP NUMBER ON THE ANSWER SHEET NOW!!! Do not open the test until we tell you. Write your answers ONLY on the answer sheet.
 Page 1 of 10 Search NSIDC... Search Education Center Photo Gallery Home Data Programs & Projects Science Publications News & Events About Overview Global Temperatures Northern Hemisphere Snow Glaciers
Chapter 1 Section 2. Land, Water, and Climate
 Chapter 1 Section 2 Land, Water, and Climate Vocabulary 1. Landforms- natural features of the Earth s land surface 2. Elevation- height above sea level 3. Relief- changes in height 4. Core- most inner
This is version v0.2 of this report issued together with the SIT and SIV data sets at the ICDC ESA-CCI- Projekt web page
 Report about Retrieval of sea-ice volume (SIV) from SICCI-2 sea-ice thickness (SIT) data and combined OSI-450 and SICCI-2 sea-ice concentration (SIC) data version v0.2, June 2018 by Stefan Kern, ICDC,
GEOGRAPHY AND HISTORY
 GEOGRAPHY AND HISTORY YEAR 1, PART 1 www.vicensvives.es Contents 01 Our planet Earth 02 The representation of the Earth: maps 03 The Earth s relief 04 Rivers and seas 05 Weather and climate 06 Climates
 Electromagnetic Spectrum ANSWER ALL OF THE FOLLOWING USING THE WEB SITES LISTED. http://missionscience.nasa.gov/ems/index.html Introduction to The Electromagnetic Spectrum 1) Electromagnetic energy travels
SNOW DEPTH AND SURFACE CONDITIONS OF AUSTFONNA ICE CAP (SVALBARD) USING FIELD OBSERVATIONS AND SATELLITE ALTIMETRY
 USING FIELD OBSERVATIONS AND SATELLITE ALTIMETRY") SNOW DEPTH AND SURFACE CONDITIONS OF AUSTFONNA ICE CAP (SVALBARD) USING FIELD OBSERVATIONS AND SATELLITE ALTIMETRY Alexei Kouraev (1,2), Benoît Legrésy (1), Frédérique Rémy (1), Andrea Taurisano (3,4),
SNOW DEPTH AND SURFACE CONDITIONS OF AUSTFONNA ICE CAP (SVALBARD) USING FIELD OBSERVATIONS AND SATELLITE ALTIMETRY Alexei Kouraev (1,2), Benoît Legrésy (1), Frédérique Rémy (1), Andrea Taurisano (3,4),
Recent Improvements in the U.S. Navy s Ice Modeling Efforts Using CryoSat-2 Ice Thickness for Model Initialization
 Recent Improvements in the U.S. Navy s Ice Modeling Efforts Using CryoSat-2 Ice Thickness for Model Initialization Richard Allard 1, David Hebert 1, Pamela Posey 1, Alan Wallcraft 1, Li Li 2, William Johnston
Where is Earth s Water?
 PASSAGE 1 Where is Earth s Water? Our planet contains a limited amount of water that is always in motion. The water that comes out of your faucet moved through the atmosphere, flowed across Earth s surface,
Earth Science and Climate Change
 Earth Science and Climate Change Dr. Mary L. Cleave February 7, 2007 YOU ARE HERE 3 Land Use Changes Over Time Lingering Doubts on Temperature Trends Have Been Resolved 1st CCSP Synthesis & Assessment
Chapter 2. Changes in Sea Level Melting Cryosphere Atmospheric Changes Summary IPCC (2013)
") IPCC (2013) Ice is melting faster (sea ice, glaciers, ice sheets, snow) Sea level is rising More ocean heat content More intense rainfall More severe drought Fewer frosts More heat waves Spring is arriving
IPCC (2013) Ice is melting faster (sea ice, glaciers, ice sheets, snow) Sea level is rising More ocean heat content More intense rainfall More severe drought Fewer frosts More heat waves Spring is arriving
Understanding and attributing climate variations: The role of energy. Kevin E Trenberth NCAR
 Understanding and attributing climate variations: The role of energy Kevin E Trenberth NCAR NCAR: attribution A way to organize a lot of research Makes it relevant to societal concerns Has some implications
Ice in a changing climate
 Ice in a changing climate ESA$Ice$sheets$CCI$$ Phase$1$Results$&$Contribu8on$to$Climate$ Research$ $ $ R"Forsberg,"L"Sørensen,"R"Meister,"J"Levinsen,"" J"Dall,"A"Kusk"(DTU>Space,"Denmark)" T"Nagler"(ENVEO,"Austria)"
CRACKS IN THE ARMOR?
 CRACKS IN THE ARMOR? R BY ROBERT MONROE ULE NO. 1 FOR BEHAVIOR around Loose Tooth : Maintain half a football field s distance from its rift zones at all times. As the name of the soon-to-be iceberg suggests,
Once a specific data set is selected, NEO will list related data sets in the panel titled Matching Datasets, which is to the right of the image.
 NASA Earth Observations (NEO): A Brief Introduction NEO is a data visualization tool that allows users to explore a wealth of environmental data collected by NASA satellites. The satellites use an array
Energy Systems, Structures and Processes Essential Standard: Analyze patterns of global climate change over time Learning Objective: Differentiate
 Energy Systems, Structures and Processes Essential Standard: Analyze patterns of global climate change over time Learning Objective: Differentiate between weather and climate Global Climate Focus Question
We greatly appreciate the thoughtful comments from the reviewers. According to the reviewer s comments, we revised the original manuscript.
 Response to the reviews of TC-2018-108 The potential of sea ice leads as a predictor for seasonal Arctic sea ice extent prediction by Yuanyuan Zhang, Xiao Cheng, Jiping Liu, and Fengming Hui We greatly