S3-A Land and Sea Ice Cyclic Performance Report. Cycle No Start date: 30/09/2017. End date: 27/10/2017
|
|
|
- Trevor Sparks
- 5 years ago
- Views:
Transcription

1 PREPARATION AND OPERATIONS OF THE MISSION PERFORMANCE CENTRE (MPC) FOR THE COPERNICUS SENTINEL-3 MISSION Start date: 30/09/2017 End date: 27/10/2017 Ref. S3MPC.UCL.PR Contract: /14/I-LG
2 Customer: ESA Document Contract No.: /14/I-LG Project: Title: Author(s): Approved by: PREPARATION AND OPERATIONS OF THE MISSION PERFORMANCE CENTRE (MPC) FOR THE COPERNICUS SENTINEL-3 MISSION Land and Sea Ice ESLs G. Quartly, STM ESL Coordinator Authorized by Sylvie Labroue, STM Technical Performance Manager Distribution: Accepted by ESA ESA, EUMETSAT, S3MPC consortium P. Féménias, MPC TO Filename S3MPC.UCL.PR i1r0 - LandSeaIce Cyclic Report 023.docx Disclaimer The work performed in the frame of this contract is carried out with funding by the European Union. The views expressed herein can in no way be taken to reflect the official opinion of either the European Union or the European Space Agency.
3 Cycle No. 23 Page: iii Changes Log Version Date Changes /01/2018 First Version List of Changes Version Section Answers to RID Changes
4 Cycle No. 23 Page: iv Table of content 1 INTRODUCTION CYCLE OVERVIEW PROCESSING BASELINES DATA AVAILABILITY & INSTRUMENT MODES DATA AVAILABILITY SRAL INSTRUMENT MODE AVAILABILITY OF POLAR GEOPHYSICAL CORRECTIONS AVAILABILITY OF GEOPHYSICAL CORRECTIONS OVER ICE SHEETS (NTC PRODUCTS) AVAILABILITY OF GEOPHYSICAL CORRECTIONS OVER ICE SHELVES (NTC PRODUCTS) AVAILABILITY OF GEOPHYSICAL CORRECTIONS OVER SEA ICE AVAILABILITY OF SNOW DENSITY, SNOW DEPTH AND SEA ICE CONCENTRATION OVER SEA ICE GEOPHYSICAL PARAMETER MONITORING FOR LAND ICE HZ KU BAND ELEVATION (ELEVATION_ICE_SHEET_20_KU) HZ KU BAND ICE SHEET RANGE (RANGE_ICE_SHEET_20_KU) HZ KU BAND ICE SHEET SIGMA0 (SIG0_ICE_SHEET_20_KU) HZ KU BAND OCOG (ICE-1) RANGE (RANGE_OCOG_20_KU) HZ KU BAND OCOG (ICE-1) SIGMA0 (SIG0_OCOG_20_KU) HZ KU BAND PLRM ICE RANGE (RANGE_ICE_20_PLRM_KU) HZ KU BAND PLRM SIGMA0 (SIG0_ICE_20_PLRM_KU) HZ KU BAND SURFACE CLASS (SURF_CLASS_20_KU) SLOPE CORRECTION ASSESSMENT GEOPHYSICAL PARAMETER MONITORING FOR SEA ICE HZ KU BAND ALTIMETER DERIVED SURFACE TYPE (SURF_TYPE_CLASS_20_KU) HZ KU BAND FREEBOARD ( FREEBOARD_20_KU) HZ KU BAND INTERPOLATED SEA SURFACE HEIGHT ANOMALY (INT_SEA_ICE_SSHA_20_KU) SEA SURFACE HEIGHT ANOMALY (SEA_ICE_SSHA_20_KU) HZ KU BAND SEA ICE CONCENTRATION (SEA_ICE_CONCENTRATION_20_KU) CROSSOVER ANALYSIS REPEAT TRACK ANALYSIS LONG TERM MONITORING EVENTS CONCLUSIONS APPENDIX A...49
5 Cycle No. 23 Page: v List of Figures Figure 3 : Map of SRAL mode over Antarctic ice sheet and ice shelves for cycle 23 NTC Figure 4: Map of SRAL mode over Greenland ice sheet for cycle 23 NTC Figure 5: Map of SRAL mode over the Antarctic sea ice for cycle 23 NTC Figure 6: Map of SRAL mode over the Arctic sea ice for cycle 23 NTC Figure 7: Percentage of Geophysical Correction Non-availability over Antarctic Ice Sheets Figure 8: Percentage of Geophysical Correction Non-availability over the Greenland Ice Sheet Figure 9: Availability of Geophysical Corrections over Antarctic Ice Shelves Figure 10: Map of Ocean Tide Correction (sol. 2) over Antarctic ice shelves in cycle 23 NTC Figure 11: Map of Ocean Tide Correction (sol. 2) Failure Locations over Arctic in cycle 23 NTC Figure 12: Map of 20Hz Ku band Ice Sheet Elevation over Antarctica and Greenland for cycle Figure 13: Maps of 20Hz Ku Band Ice Sheet Range (range_ice_sheet_20_ku) Figure 14: Maps of 20Hz Ku Band Ice Sheet Sigma0 (sig0_ice_sheet_20_ku) Figure 15: Maps of 20Hz Ku Band OCOG (Ice-1) Range (range_ocog_20_ku) Figure 16: Maps of 20Hz Ku Band OCOG (Ice-1) Sigma0 (sig0_ocog_20_ku) Figure 17: Maps of 20Hz Ku Band PLRM Ice Range (range_ice_20_plrm_ku) Figure 19: Maps of 20Hz Ku Band PLRM Sigma0 (sig0_ice_20_plrm_ku) Figure 20: Maps of 20Hz Ku Band Surface Class (surf_class_20_ku) Figure 21: Maps of Slope Correction Failure Locations Figure 22: Maps of 20Hz Ku Band Altimeter Derived Surface Type (surf_type_class_20_ku) Figure 23: Maps of 20Hz Ku band Freeboard ( freeboard_20_ku) Figure 24: Maps of 20Hz Ku band Sea Ice Concentration (sea_ice_concentration_20_ku) List of Tables Table 1: Data Availability for NTC Table 4: % Non Availability of Geophysical Corrections over Sea Ice (NTC) Table 5: % Availability of Snow Density, Snow Depth, Sea Ice Concentration over Sea Ice
6 Page: 1 1 Introduction This document provides a report of the performance and data quality of the Sentinel-3A SRAL Level 2 data products over land ice (polar ice sheets, ice shelves, and ice caps) and sea ice surfaces. For land ice the SR_2_LAN Level 2 NTC (Non Time Critical) products which contain the final orbit and geophysical corrections are assessed. These are produced by the S3 Instrument Processing Facility (IPF) at CNES. For sea ice, we assess the SR_2_WAT Marine Level 2 NTC (Non Time Critical) products, produced by the S3 Marine Centre. The objectives of this document are : To provide a data quality assessment. To report on any changes likely to impact data quality at any level, from instrument status to software configuration. To present the major useful results for cycle 23, from 30 September 2017 to 27 October 2017.
7 Page: 2 2 Cycle Overview This is 27-day cycle 23 (30-Sep-2017 to 27-Oct-2017), the tenth cycle since Sentinel-3A entered its routine operational phase following commissioning. Sentinel-3A was launched on 16-February During this cycle, Sentinel-3A SRAL operated in SAR mode over land ice and sea ice surfaces.
8 Page: 3 3 Processing Baselines During this cycle there was no Instrument Processing Facility (IPF) software version change for SR_2_LAN NTC products. One version of the IPF was used to compute the altimeter parameters for the L2 Land (SR_2-LAN) NTC dataset during this cycle. This was IPF-SM-2, version SR_2_LAN NTC Cycle Processing Baseline L2 IPF Versions L1 IPF Versions 23 PB 2.12 SM (since 12/04/ :37 UTC) SR One version of the IPF was used to compute the altimeter parameters for the L2 Land (SR_2-WAT) NTC dataset during this cycle. This was IPF-SM-2, version SR_2_WAT NTC Cycle Processing Baseline L2 IPF Versions L1 IPF Versions 23 PB 2.12 SM (since 12/04/ :54 UTC) SR
9 Page: 4 4 Data Availability & Instrument Modes 4.1 Data Availability The percentage of L2 product orbits received during this 27 day cycle by the MPC and contributing to this report were: Product Type Latency % Orbits Received SR_2_LAN NTC 100% SR_2_WAT NTC 100% Table 1: Data Availability for NTC Note that these are percentages of products received by the Mission Performance Centre at the time of report issue, and may be lower than the final data availability if there have been processing centre delays.

10 Page: SRAL Instrument Mode Over land ice surfaces the SRAL instrument operated in SAR closed loop during this cycle. Closed-loop is the autonomous form of surface tracking typically used for altimetry missions, as compared with openloop which depends on a pre-computed DEM stored onboard. Figure 1 : Map of SRAL mode over Antarctic ice sheet and ice shelves for cycle 23 NTC

11 Page: 6 Figure 2: Map of SRAL mode over Greenland ice sheet for cycle 23 NTC

12 Page: 7 For sea ice and ocean surfaces the SRAL instrument operated in SAR open loop mode during this cycle. Note that the mode mask is fixed and does not dynamically change from cycle to cycle. In open loop the range window is positioned using a 1-D along track DEM with a-priori knowledge of the surface height. Figure 3: Map of SRAL mode over the Antarctic sea ice for cycle 23 NTC

13 Page: 8 Figure 4: Map of SRAL mode over the Arctic sea ice for cycle 23 NTC
14 Page: 9 5 Availability of Polar Geophysical Corrections In this section the availability of geophysical corrections to altimeter range contained in the L2 products over ice sheets, ice shelves and sea ice are analysed for this cycle. Missing or invalid geophysical corrections can cause errors in the final L2 elevation parameters, and erroneous steps in derived time series of ice sheet surface elevation change or sea ice freeboard. 5.1 Availability of Geophysical Corrections over Ice Sheets (NTC Products) For polar ice sheets, the primary geophysical corrections applied to the range are model dry tropospheric, model wet tropospheric, GIM ionospheric, solid earth tide, pole tide and ocean loading tide. We would normally expect 100% availability of all corrections except the altimeter derived ionospheric corrections (iono_cor_alt_01_ku, iono_cor_alt_20_ku). For cycle 23 NTC the percentage of non-available geophysical corrections over Antarctic ice sheets was: Figure 5: Percentage of Geophysical Correction Non-availability over Antarctic Ice Sheets

15 Page: 10 For cycle 23 NTC the percentage of non-available geophysical corrections over the Greenland ice sheet was: Figure 6: Percentage of Geophysical Correction Non-availability over the Greenland Ice Sheet
16 Page: Availability of Geophysical Corrections over Ice Shelves (NTC Products) For polar ice shelves, the primary geophysical corrections applied to the range are as for ice sheets plus ocean tide and inverse barometric corrections. For cycle 23 NTC the percentage availability of geophysical corrections over Antarctic ice shelves was: Figure 7: Availability of Geophysical Corrections over Antarctic Ice Shelves For ice shelf studies it is recommended that users replace the ocean tide correction (Ocean Tide Solution 2 in cycle 23) where it is valid in the L2 NTC products over Antarctic ice shelves with a more accurate high resolution circumpolar ocean tide model correction such as the Circum Antarctic Tidal Simulation (CATS 2008a), Padman et al (2008). Note that the % non availability of ocean tide fields shown appear to be predominantly due to use of a different glacier grounding line (GLL) mask in the S3A processing as compared to the reports test mask which uses the Rignot 2016 GLL.
 over Antarctic ice shelves in cycle 23")
17 Page: 12 Figure 8: Map of Ocean Tide Correction (sol. 2) over Antarctic ice shelves in cycle 23 NTC

18 Page: Availability of Geophysical Corrections over Sea Ice Over sea ice the model dry tropospheric, model wet tropospheric, ionospheric, solid earth tide, pole tide and ocean tide and inverse barometric corrections are applied in the STC L2 Marine product. For cycle 23 NTC the percentage availability of geophysical corrections over sea ice was: Table 2: % Non Availability of Geophysical Corrections over Sea Ice (NTC) The Ocean Tide solutions over the Arctic show missing values only very close to the coast:

19 Page: 14 Figure 9: Map of Ocean Tide Correction (sol. 2) Failure Locations over Arctic in cycle 23 NTC 5.4 Availability of Snow Density, Snow Depth and Sea Ice Concentration over Sea Ice Correction % Availability Arctic Sea Ice % Availability Antarctic Sea Ice Sea Ice Concentration Snow Density Snow Depth Table 3: % Availability of Snow Density, Snow Depth, Sea Ice Concentration over Sea Ice 1 Snow Density is set to a single value of 400 Kg/m 3 as expected. 2 Snow depth over Antarctic sea ice is set to zero as expected. 3 Sea Ice Concentration is derived from a dynamic 3 day average of sea ice concentration calculated from SSM/I daily brightness temperature data.
20 Page: 15 6 Geophysical Parameter Monitoring for Land Ice This section shows results and analysis of the primary L2 NTC parameters relating to land ice in cycle Hz Ku Band Elevation (elevation_ice_sheet_20_ku) 20Hz Ku band surface elevation is the primary output of the land ice products over continental ice sheets and ice shelves. Analysis of this parameter shows that the map of elevation is as expected but there is an unexpectedly high rate of parameter failure over the whole ice area in both Antarctica (32%) and Greenland (43%). This is currently under investigation by the MPC and ESA but it is believed to be due an issue with the L1 SAR processing over areas of sloping terrain. This affects the stability of the waveform positioning within the range window, particularly in the continental margins. This results in waveforms being located towards the edge of the range window, outside the retracker s central fit window, or being truncated. Additionally, tests indicate that an error in the SAR slope correction is present in this version of the IPF processing which will cause a resulting error in the elevation (of 30cm to several meters, dependent on slope) and to the location of the echo. A small number of anomalous large negative values are also present. This is under investigation by the MPC. The following maps show the 20Hz Ku band Elevation parameter plotted for the complete cycle.
21 Page: 16

22 Page: 17 Figure 10: Map of 20Hz Ku band Ice Sheet Elevation over Antarctica and Greenland for cycle 23
 The ice sheet range is retracked using the SAR ice margin retracker and is the primary range used to calculate elevation in the L2")
23 Page: Hz Ku Band Ice Sheet Range (range_ice_sheet_20_ku) The ice sheet range is retracked using the SAR ice margin retracker and is the primary range used to calculate elevation in the L2 product. There are higher than expected rates of failure in this parameter over all ice areas. An explanation of this is given in the preceding section on ice sheet elevation.

24 Page: 19 Figure 11: Maps of 20Hz Ku Band Ice Sheet Range (range_ice_sheet_20_ku)
25 Page: Hz Ku Band Ice Sheet Sigma0 (sig0_ice_sheet_20_ku) The Ku band ice sheet sigma0 backscatter parameter is derived from the SAR ice margin retracker. The map of sigma0 over the ice sheets shows similar patterns of backscatter values to previous missions. Backscatter values are controlled by surface roughness characteristics, surface slope and differences in surface and volume echo. Over the ice sheet margins backscatter is low due to high surface slope, and over the East Antarctic ice sheet it is also low due to strong winds causing high surface roughness. Over the West Antarctic ice sheet and areas of Dronning Maud land there are high backscatter returns due to very smooth surfaces. In Greenland the ice sheet surface is smoother due to lower winds and regular melt events causing higher backscatter values. There are higher than expected rates of failure in this parameter over all ice areas. An explanation of this is given in the preceding section on ice sheet elevation.
26 Page: 21 Figure 12: Maps of 20Hz Ku Band Ice Sheet Sigma0 (sig0_ice_sheet_20_ku)
27 Page: Hz Ku Band OCOG (Ice-1) Range (range_ocog_20_ku) This parameter is the range derived from the OCOG (Ice-1) retracker. Note that there are are much lower failure rates (~2%) than for the SAR ice margin retracker (32%). This is because the OCOG centre of gravity retracking algorithm will retrack a wider range of waveform shapes and leading edge positions than the model fit approach used by the SAR ice margin retracker. This results in greater measurement density, but in some areas lower accuracy.
28 Page: 23 Figure 13: Maps of 20Hz Ku Band OCOG (Ice-1) Range (range_ocog_20_ku)

29 Page: Hz Ku Band OCOG (Ice-1) Sigma0 (sig0_ocog_20_ku) The Ku band OCOG sigma0 backscatter parameter is derived from the OCOG (Ice-1) retracker. The map of sigma0 over the ice sheets shows similar patterns of backscatter values to previous missions. Backscatter values are controlled by surface roughness characteristics, surface slope and differences in surface and volume echo. Over the ice sheet margins backscatter is low due to high surface slope, and over the East Antarctic ice sheet it is also low due to strong winds causing high surface roughness. Over the West Antarctic ice sheet and areas of Dronning Maud land there are high backscatter returns due to very smooth surfaces. In Greenland the ice sheet surface is smoother due to lower winds and regular melt events causing higher backscatter values. There are higher than expected rates of failure in this parameter over the margins, West Antarctica and the Antarctic Peninsula, but much lower failure rates than for the SAR ice margin retracker. This is because the OCOG centre of gravity retracking algorithm will retrack a wider range of waveform shapes than the model fit approach used by the SAR ice margin retracker. This results in greater measurement density, but in some areas lower accuracy.
30 Page: 25 Figure 14: Maps of 20Hz Ku Band OCOG (Ice-1) Sigma0 (sig0_ocog_20_ku)
31 Page: Hz Ku Band PLRM Ice Range (range_ice_20_plrm_ku) Range measurements derived from the PLRM waveforms and retracker show similar but slightly higher failure rates than for the SAR OCOG retracked range.
32 Page: 27 Figure 15: Maps of 20Hz Ku Band PLRM Ice Range (range_ice_20_plrm_ku)
 Backscatter sigma0")
33 Page: Hz Ku Band PLRM Sigma0 (sig0_ice_20_plrm_ku) Backscatter sigma0 derived from the 20Hz Ku PLRM waveforms are shown below.

34 Page: 29 Figure 16: Maps of 20Hz Ku Band PLRM Sigma0 (sig0_ice_20_plrm_ku)

35 Page: Hz Ku Band Surface Class (surf_class_20_ku) The 20Hz Ku surface classification parameter is derived from MODIS and GlobCover data. Users of the data requiring high resolution ice sheet glacier grounding line and calving front locations should consider applying their own surface type masks.

36 Page: 31 Figure 17: Maps of 20Hz Ku Band Surface Class (surf_class_20_ku)
37 Page: 32 7 Slope Correction Assessment A slope correction is applied to 20Hz Ku band elevation over ice sheets to relocate the SAR echo to the point of closest approach across track. In cycle 23, due to the high failure rate of the SAR Ice Margin retracker, the slope correction is not performed on more than 30-42% of range measurements over the ice sheets.
38 Page: 33 Figure 18: Maps of Slope Correction Failure Locations Tests of the SAR mode slope correction (of measurements that are retracked) in this cycle indicate that there is an error in the echo direction calculation in the current IPF processing. This results in an erroneous relocation down slope of the nadir track. As a result a slope dependent error in the resulting elevation measurement of approximately 30cm to several meters is present. Users are advised to consider this additional error if using the 20Hz elevation parameter over land ice. This slope error should be fixed in the next IPF version. A full assessment of the slope correction will be added to the report once the failure rate has been reduced.
 and that results from this")
39 Page: 34 8 Geophysical Parameter Monitoring for Sea Ice This section shows results and analysis of the primary L2 NTC parameters relating to sea ice in cycle Hz Ku Band Altimeter Derived Surface Type (surf_type_class_20_ku) This parameter is the output of the sea ice echo discriminator. Whilst the maps of surface type looks reasonable, validation of the data has shown that the discriminator requires some further tuning (with too few leads identified) and that results from this parameter should not be used for this product version of cycle 23.

40 Page: 35 Figure 19: Maps of 20Hz Ku Band Altimeter Derived Surface Type (surf_type_class_20_ku)
 The histogram of freeboard results from this cycle show a greater proportion of negative freeboard values and a wider spread of freeboard than would be")
41 Page: Hz Ku band Freeboard ( freeboard_20_ku) The histogram of freeboard results from this cycle show a greater proportion of negative freeboard values and a wider spread of freeboard than would be expected. Although negative freeboard is possible due to snow loading, this spread of values is likely to be erroneous. This is most likely to due to incomplete tuning of the surface type discriminator algorithm causing incorrect classification of leads as floes and a possible unresolved sea ice lead and floe retracker bias.

42 Page: 37 Figure 20: Maps of 20Hz Ku band Freeboard ( freeboard_20_ku)
 This parameter is the sea surface height with respect to the mean sea surface interpolated between leads")
43 Page: Hz Ku Band Interpolated Sea Surface Height Anomaly (int_sea_ice_ssha_20_ku) This parameter is the sea surface height with respect to the mean sea surface interpolated between leads in the sea ice (ie represents the SSHA underneath the sea ice floes) Analysis of this parameter will be added in future cycles once the sea ice discrimination has been tuned.
44 Page: 39

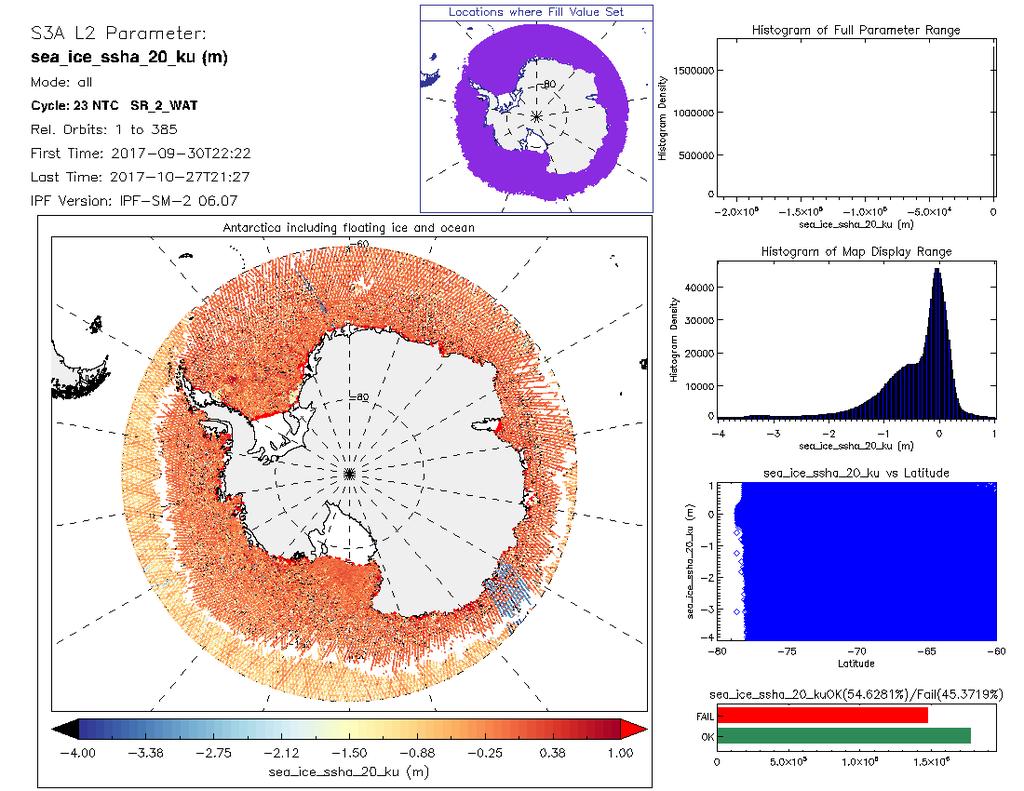
45 Page: Sea Surface Height Anomaly (sea_ice_ssha_20_ku) This parameter is the sea surface height with respect to the mean sea surface. Analysis of this parameter will be added in future cycles cycles once the sea ice discrimination has been tuned. Note that an anomalous band exists to the west of Greenland and east of Antarctics is due to an error in processing the GIM ionopheric correction. This will be corrected in the next IPF version.
46 Page: 41

47 Page: Hz Ku band Sea Ice Concentration (sea_ice_concentration_20_ku) Sea ice concentration data is available in 100% of records in the STC product in cycle 23. Sea Ice Concentration is derived from a dynamic 3 day average of sea ice concentration calculated from SSM/I daily brightness temparature data and this map is consistent with external sea ice extent maps for this period.
48 Page: 43 Figure 21: Maps of 20Hz Ku band Sea Ice Concentration (sea_ice_concentration_20_ku)
49 Page: 44 9 Crossover Analysis Measuring the elevation residual at orbit crossover points is a primary method of assessing the performance of the altimeter and the processing chain. Over time intervals where there is no expected change in the surface elevation, the elevation difference at a crossover provides a measure of altimeter and chain performance, height error and antenna polarity issues. Due to the reported high failure rates and slope correction error with the 20Hz Ku band Elevation parameter in this cycle, the density and accuracy of measurements is too low to produce meaningful crossover results that can be compared with previous missions. As soon as the failure rate is reduced to nominal levels then a crossover analysis result will be reported in this section for this cycle.
50 Page: Repeat Track Analysis Repeat track analysis is a method of processing several years of operational altimetry data to produce gridded maps of temporal change in the ice sheet s surface elevation and mass balance since the start of mission. These can be validated against known ice sheet dynamics and other external sources of temporal change data. Since cycle 23 is the 10th cycle since the start of the operational phase there is not a long enough time series of stable measurements to produce a repeat track analysis. This analysis will be added to reports from cycles in 2018 once at least a year of stable data is available.
51 Page: Long Term Monitoring In this section the long term performance statistics of Sentinel-3A parameters over land ice and sea ice will be analysed to indicate the stability of the instrument and ground processing. As cycle 23 is the 10th cycle in the routine operations phase, no long term statistics are available for this cycle.
52 Page: Events List of all events happened during the cycle affecting the Land and Sea Ice validation: 1. There were no changes in IPF versions which affect measurement density or quality for land ice or sea ice products in this cycle.
53 Page: Conclusions For Level-2 NTC Land products over polar ice sheets, maps of L2 ice sheet elevation and sigma0 backscatter show expected patterns of spatial variability over the ice sheet topography and surface types as compared to previous missions, but there are 32-42% higher than expected levels of retracker and tracker failure in the primary 20Hz Ku band ice sheet elevation and range parameters over all areas (ice sheet interior and margins) resulting in lower than expected measurement density. There is also an error in the slope correction in the current IPF affecting accuracy of the calculated elevation over sloping surfaces. This is currently under investigation by the MPC and ESA. For Level-2 NTC Marine products, the sea ice freeboard and surface discrimination parameters requires further tuning and we recommend that they are not used for this product baseline.
54 Page: Appendix A Other reports related to the STM mission are: S3-A SRAL Cyclic Performance Report, (ref. S3MPC.ISR.PR ) S3-A MWR Cyclic Performance Report, (ref. S3MPC.CLS.PR ) S3-A Ocean Validation Cyclic Performance Report, (ref. S3MPC.CLS.PR ), (ref. S3MPC.UCL.PR ) All Cyclic Performance Reports are available on MPC pages in Sentinel Online website, at: End of document
S3-A Land and Sea Ice Cyclic Performance Report. Cycle No Start date: 21/04/2017. End date: 18/05/2017
 PREPARATION AND OPERATIONS OF THE MISSION PERFORMANCE CENTRE (MPC) FOR THE COPERNICUS SENTINEL-3 MISSION Cycle No. 017 Start date: 21/04/2017 End date: 18/05/2017 Ref. S3MPC.UCL.PR.08-017 Contract: 4000111836/14/I-LG
S3 Product Notice Altimetry
 S3 Product Notice Altimetry Mission Sensor Product S3-A SRAL / MWR LAND L2 NRT, STC and NTC Product Notice ID Issue/Rev Date Version 1.0 Preparation S3A.PN-STM-L2L.06 04-April-2018 This Product Notice
CryoSat Monthly Quality Report #93
 9th May 2018-7th June 2018 Author(s): CryoSat Quality Control Team (Telespazio UK) IDEAS+-VEG-OQC-REP-2987 17 July 2018 AMENDMENT RECORD SHEET The Amendment Record Sheet below records the history and issue
Sentinel-3A Product Notice STM L2 Marine ( Spring-2018 Reprocessing Campaign )
") Sentinel-3A Product Notice STM L2 Marine ( Spring-2018 Reprocessing Campaign ) Mission Sensor Product S3-A SRAL/MWR L2 NTC (Marine Reprocessed Dataset from Spring-2018 Reprocessing Campaign ) Product Notice
Sentinel-3A Product Notice STM L2 Marine ( Spring-2018 Reprocessing Campaign ) Mission Sensor Product S3-A SRAL/MWR L2 NTC (Marine Reprocessed Dataset from Spring-2018 Reprocessing Campaign ) Product Notice
Sentinel-3A Product Notice STM L2 Marine (NRT, STC and NTC)
") Sentinel-3A Product Notice STM L2 Marine (NRT, STC and NTC) Mission Sensor Product S3-A SRAL/MWR L2 NRT STC and NTC (Marine Products) Product Notice ID S3A.PN-STM-L2M.01 EUM/OPS-SEN3/DOC/16/893228 Issue
Sentinel-3A Product Notice STM L2 Marine (NRT, STC and NTC) Mission Sensor Product S3-A SRAL/MWR L2 NRT STC and NTC (Marine Products) Product Notice ID S3A.PN-STM-L2M.01 EUM/OPS-SEN3/DOC/16/893228 Issue
Sentinel 3A Product Notice STM L2 Marine
 Sentinel 3A Product Notice STM L2 Marine Mission Sensor Product S3 A SRAL/MWR L2 NRT, STC and NTC (Marine Products) Product Notice ID EUM/OPS SEN3/DOC/16/893228 Issue Date 23 March 2018 Version Preparation
S3MPC STM Annual Performance Report - Year 1
 PREPARATION AND OPERATIONS OF THE MISSION PERFORMANCE CENTRE (MPC) FOR THE COPERNICUS SENTINEL-3 MISSION Contract: 4000111836/14/I-LG Customer: ESA Document Contract No.: 4000111836/14/I-LG Project: PREPARATION
CRYOSAT CYCLIC REPORT
 CRYOSAT CYCLIC REPORT CYCLE #14 12TH NOVEMBER 2011 11TH DECEMBER 2011 Prepared by/ préparé par CryoSat IDEAS Team Reference/ réference Issue/ édition 1 Revision/ révision 0 Date of issue/ date d édition
Sentinel-3 A STM (Altimetry) Disclaimer
 Disclaimer") Sentinel-3 A STM (Altimetry) Disclaimer The following table summarises the evolutions of the processing baseline used to process S3-A altimetry data since July 2016, end of commissioning phase. Reference
Sentinel-3 A STM (Altimetry) Disclaimer The following table summarises the evolutions of the processing baseline used to process S3-A altimetry data since July 2016, end of commissioning phase. Reference
Geophysical Correction Application in Level 2 CryoSat Data Products
 ESRIN-EOP-GQ / IDEAS IDEAS-VEG-IPF-MEM-1288 Version 2.0 29 July 2014 Geophysical Correction Application in Level 2 CryoSat Data Products TABLE OF CONTENTS 1 INTRODUCTION... 3 1.1 Purpose and Scope... 3
S3-A MWR Cyclic Performance Report. Cycle No Start date: 23/11/2017. End date: 20/12/2017
 PREPARATION AND OPERATIONS OF THE MISSION PERFORMANCE CENTRE (MPC) FOR THE COPERNICUS SENTINEL-3 MISSION Start date: 23/11/2017 End date: 20/12/2017 Contract: 4000111836/14/I-LG Customer: ESA Document
S3-A MWR Cyclic Performance Report. Cycle No Start date: 31/05/2018. End date: 27/06/2018
 PREPARATION AND OPERATIONS OF THE MISSION PERFORMANCE CENTRE (MPC) FOR THE COPERNICUS SENTINEL-3 MISSION Start date: 31/05/2018 End date: 27/06/2018 Contract: 4000111836/14/I-LG Customer: ESA Document
S3-A MWR Cyclic Performance Report. Cycle No Start date: 14/10/2016. End date: 10/11/2016
 PREPARATION AND OPERATIONS OF THE MISSION PERFORMANCE CENTRE (MPC) FOR THE COPERNICUS SENTINEL-3 MISSION Start date: 14/10/2016 End date: 10/11/2016 Contract: 4000111836/14/I-LG Customer: ESA Document
S3-A MWR Cyclic Performance Report. Cycle No Start date: 17/09/2016. End date: 14/10/2016
 PREPARATION AND OPERATIONS OF THE MISSION PERFORMANCE CENTRE (MPC) FOR THE COPERNICUS SENTINEL-3 MISSION Start date: 17/09/2016 End date: 14/10/2016 Contract: 4000111836/14/I-LG Customer: ESA Document
Sentinel-3A Product Notice STM Level-1 (NRT, STC and NTC)
") Sentinel-3A Product Notice STM Level-1 (NRT, STC and NTC) Mission Sensor Product S3-A SRAL L1 NRT, STC and NTC Product Notice ID S3.PN-STM.001 Issue Date 28/02/2017 Version I1r6 This is a Product Notice
Sentinel-3A Product Notice STM Level-1 (NRT, STC and NTC) Mission Sensor Product S3-A SRAL L1 NRT, STC and NTC Product Notice ID S3.PN-STM.001 Issue Date 28/02/2017 Version I1r6 This is a Product Notice
TECH NOTE. New Mean Sea Surface for the CryoSat-2 L2 SAR Chain. Andy Ridout, CPOM, University College London
 TECH NOTE Subject : From : To : New Mean Sea Surface for the CryoSat-2 L2 SAR Chain Andy Ridout, CPOM, University College London Tommaso Parrinello, CryoSat Mission Manager, ESRIN Date : 30 th June 2014
S3-A Wind & Wave Cyclic Performance Report. Cycle No Start date: 13/02/2018. End date: 11/03/2018
 PREPARATION AND OPERATIONS OF THE MISSION PERFORMANCE CENTRE (MPC) FOR THE COPERNICUS SENTINEL-3 MISSION Start date: 13/02/2018 End date: 11/03/2018 Contract: 4000111836/14/I-LG Customer: ESA Document
S3-A Wind & Wave Cyclic Performance Report. Cycle No Start date: 24/11/2017. End date: 20/12/2017
 PREPARATION AND OPERATIONS OF THE MISSION PERFORMANCE CENTRE (MPC) FOR THE COPERNICUS SENTINEL-3 MISSION Start date: 24/11/2017 End date: 20/12/2017 Contract: 4000111836/14/I-LG Customer: ESA Document
living planet symposium
 living planet symposium!!the Sentinel-3 Surface Topography!!Mission and Products C. Mavrocordatos ESA-ESTEC (Netherlands) P. Féménias ESA-ESRIN (Italy) N. Picot CNES (France) H. Bonekamp EUMETSAT (Germany)
S3-A Wind & Wave Cyclic Performance Report. Cycle No Start date: 07/08/2017. End date: 03/09/2017
 PREPARATION AND OPERATIONS OF THE MISSION PERFORMANCE CENTRE (MPC) FOR THE COPERNICUS SENTINEL-3 MISSION Start date: 07/08/2017 End date: 03/09/2017 Contract: 4000111836/14/I-LG Customer: ESA Document
CryoSat-2: A new perspective on Antarctica
 CryoSat-2: A new perspective on Antarctica K. Briggs 1, R. Cullen 2, L. Foresta 3, R. Francis 2, A. Hogg 1, M. McMillan 1, A. Muir 4, N. Galin 4, L. Gilbert 4, N. Gourmelen 3, A. Ridout 4, A. Shepherd
Validation Report: WP5000 Regional tidal correction (Noveltis)
") Consortium Members ESA Cryosat Plus for Oceans Validation Report: WP5000 Regional tidal correction (Noveltis) Reference: Nomenclature: CLS-DOS-NT-14-083 CP4O-WP5000-VR-03 Issue: 2. 0 Date: Jun. 20, 14
Consortium Members ESA Cryosat Plus for Oceans Validation Report: WP5000 Regional tidal correction (Noveltis) Reference: Nomenclature: CLS-DOS-NT-14-083 CP4O-WP5000-VR-03 Issue: 2. 0 Date: Jun. 20, 14
GLOBAL WAVEFORM SHAPE ANALYSIS FOR THE DETECTION AND MONITORING OF EPHEMERAL SURFACE WATER
 GLOBAL WAVEFORM SHAPE ANALYSIS FOR THE DETECTION AND MONITORING OF EPHEMERAL SURFACE WATER Dowson, M. (1), Berry, P.A.M. (1), Freeman, J.A. (1) (1) De Montfort University EAPRS Lab, De Montfort University,
Ice sheet mass balance from satellite altimetry. Kate Briggs (Mal McMillan)
") Ice sheet mass balance from satellite altimetry Kate Briggs (Mal McMillan) Outline Background Recap 25 year altimetry record Recap Measuring surface elevation with altimetry Measuring surface elevation
Ice sheet mass balance from satellite altimetry Kate Briggs (Mal McMillan) Outline Background Recap 25 year altimetry record Recap Measuring surface elevation with altimetry Measuring surface elevation
Sentinel-1 Mission Status
 Sentinel-1 Mission Status Pierre Potin, Sentinel-1 Mission Manager, ESA Luca Martino, Technical Support Engineer, ESA... and the Sentinel-1 operations team PSTG SAR Coordination Working Group 14 December
Merged sea-ice thickness product from complementary L-band and altimetry information
 Merged sea-ice thickness product from complementary L-band and altimetry information Contributors AWI Team Stefan Hendricks Robert Ricker Stephan Paul University Hamburg Team Lars Kaleschke Xiangshan Tian-Kunze
Analysis of Doppler signals from nadir altimeters over ocean. F. Boy (CNES)
") Analysis of Doppler signals from nadir altimeters over ocean F. Boy (CNES) Delay-Doppler Phase Altimetry of Radar Altimeter Pulses Launched in 2016, Sentinel-3A has been measuring oceans, land, ice to
Analysis of Doppler signals from nadir altimeters over ocean F. Boy (CNES) Delay-Doppler Phase Altimetry of Radar Altimeter Pulses Launched in 2016, Sentinel-3A has been measuring oceans, land, ice to
S3-A Wind & Wave Cyclic Performance Report. Cycle No Start date: 11/11/2016. End date: 07/12/2016
 PREPARATION AND OPERATIONS OF THE MISSION PERFORMANCE CENTRE (MPC) FOR THE COPERNICUS SENTINEL-3 MISSION Start date: 11/11/2016 End date: 07/12/2016 Contract: 4000111836/14/I-LG Customer: ESA Document
Polar Space Task Group Space Agency Report
 Polar Agency Report EUMETSAT WMO HQ, Geneva 16-18 October, 2018 EUMETSAT News EPS OSI SAF products Sentinel-3 PSTG8 Meeting, WMO, 16-18 Oct., 2018 EUMETSAT Polar System: Metop- C Launch Preparation Metop-C
Product Validation Report Polar Ocean
 Product Validation Report Polar Ocean Lars Stenseng PVR, Version 1.0 July 24, 2014 Product Validation Report - Polar Ocean Lars Stenseng National Space Institute PVR, Version 1.0, Kgs. Lyngby, July 24,
S3-A Winds & Waves Cyclic Performance Report. Cycle No Start date: 21/08/2016. End date: 17/09/2016
 PREPARATION AND OPERATIONS OF THE MISSION PERFORMANCE CENTRE (MPC) FOR THE COPERNICUS SENTINEL-3 MISSION Start date: 21/08/2016 End date: 17/09/2016 Contract: 4000111836/14/I-LG Customer: ESA Document
High resolution geoid from altimetry & bathymetry: requirements for a future mission
 High resolution geoid from altimetry & bathymetry: requirements for a future mission The GRAL team: J-Y Royer 1,2, M-F Lalancette 3, G Louis 1,2, M Maia 1,2, D Rouxel 3 & L Géli 4 Project funded by 1 2
CryoSat: ESA s Ice Mission:
 CryoSat: ESA s Ice Mission: 6 years in operations: status and achievements T. Parrinello CryoSat Mission Manager M. Drinkwater Mission Scientist CryoSat March 2016 sea-ice thickness CryoSat: A bit of history
SSH retrieval in the ice covered Arctic Ocean: from waveform classification to regional sea level maps
 ESA Climate Change Initiative SSH retrieval in the ice covered Arctic Ocean: from waveform classification to regional sea level maps CLS LEGOS PML Arctic SIE status 2 nd lowest on record with 4.14 10 6
Sentinels and Waves. GMES Sentinel-1 SAR GMES Sentinel-3 Altimeter
 Sentinels and Waves GMES Sentinel-1 SAR GMES Sentinel-3 Altimeter Simon Pinnock, ESA-ESRIN, Frascati, Italy with help from Craig Donlon (ESTEC) & Nuno Miranda (ESRIN) et al. GMES Space Component: dedicated
EUMETSAT STATUS AND PLANS
 1 EUM/TSS/VWG/15/826793 07/10/2015 EUMETSAT STATUS AND PLANS François Montagner, Marine Applications Manager, EUMETSAT WMO Polar Space Task Group 5 5-7 October 2015, DLR, Oberpfaffenhofen PSTG Strategic
Swath Mode Altimetry. Noel Gourmelen
 Swath Mode Altimetry Noel Gourmelen 1 Outline Background Impact case studies: Topography Rates of surface elevation change 2 Products and applications of radar altimetry over Ice Sheet, Ice Caps, Glaciers:
Sentinel-3A Product Notice SLSTR Level-2 Sea Surface Temperature
 Sentinel-3A Product Notice SLSTR Level-2 Sea Surface Temperature Mission Sensor Product Sentinel-3A SLSTR Level 2 Sea Surface Temperature Product Notice ID EUM/OPS-SEN3/DOC/18/984462 S3A.PN-SLSTR-L2M.003
ESA Status Report. ET-SAT-11, WMO, Geneva, CH, 4 April Prepared by Earth Observation Programmes Directorate
 ESA Status Report ET-SAT-11, WMO, Geneva, CH, 4 April 2017 Prepared by Earth Observation Programmes Directorate Presented by Ivan Petiteville, ESA, Earth Observation Programmes Issue/Revision: 0.0 Reference:
THE COPERNICUS SPACE COMPONENT: Sentinels Data Products List
 esrin Via Galileo Galilei Casella Postale 64 00044 Frascati Italy T +39 06 9418 01 F +39 06 9418 0280 www.esa.int THE COPERNICUS SPACE COMPONENT: Sentinels Data Products List Prepared by Copernicus Space
Impact of GPS box-wing models on LEO orbit determination
 Impact of GPS box-wing models on LEO orbit determination Heike Peter (1), Tim Springer (1),(2), Michiel Otten (1),(2) (1) PosiTim UG Sentinel-1 GPS-IIF (2) ESA/ESOC Sentinel-2 Credits:ESA gps.gov IGS Workshop
Active microwave systems (2) Satellite Altimetry * the movie * applications
 Satellite Altimetry * the movie * applications") Remote Sensing: John Wilkin wilkin@marine.rutgers.edu IMCS Building Room 211C 732-932-6555 ext 251 Active microwave systems (2) Satellite Altimetry * the movie * applications Altimeters (nadir pointing
Remote Sensing: John Wilkin wilkin@marine.rutgers.edu IMCS Building Room 211C 732-932-6555 ext 251 Active microwave systems (2) Satellite Altimetry * the movie * applications Altimeters (nadir pointing
Cryosat-2 SAR altimetry processing and use in the Arctic Ocean. Ole Andersen, M. Jain & Lars Stenseng
 Cryosat-2 SAR altimetry processing and use in the Arctic Ocean Ole Andersen, M. Jain & Lars Stenseng Context We investigate satellite altimetry in the Arctic Ocean for 1) Studies of long term changes 2)
Studies of Austfonna ice cap (Svalbard) using radar altimetry with other satellite techniques
 using radar altimetry with other satellite techniques") 15 Years of progress in Radar Altimetry Symposium Ocean surface topography science team (OSTST) International Doris Service (IDS) Workshop, Argo Workshop 13-18 March 2006, Venice, Italy Alexei V. Kouraev,
15 Years of progress in Radar Altimetry Symposium Ocean surface topography science team (OSTST) International Doris Service (IDS) Workshop, Argo Workshop 13-18 March 2006, Venice, Italy Alexei V. Kouraev,
1 The satellite altimeter measurement
 1 The satellite altimeter measurement In the ideal case, a satellite altimeter measurement is equal to the instantaneous distance between the satellite s geocenter and the ocean surface. However, an altimeter
P. Cipollini, H. Snaith - A short course on Altimetry. Altimetry 2 - Data processing (from satellite height to sea surface height)
") P. Cipollini, H. Snaith - A short course on Altimetry Altimetry 2 - Data processing (from satellite height to sea surface height) 1 2 Satellite height to sea surface height The altimeter measures the altitude
P. Cipollini, H. Snaith - A short course on Altimetry Altimetry 2 - Data processing (from satellite height to sea surface height) 1 2 Satellite height to sea surface height The altimeter measures the altitude
Sentinel-1 Mission Status
 Sentinel-1 Mission Status Pierre Potin, Sentinel-1 Mission Manager 5TH GEOGLAM RAPP Workshop 16-17 May 2017, ESRIN Sentinel-1: Copernicus radar imaging mission for ocean, land, emergency Part of the Copernicus
SENTINEL 1 Mission status and contribution to PSTG
 PSTG SAR WG meeting, 12 September 2016, ESTEC SENTINEL 1 Mission status and contribution to PSTG First Sentinel1B Images 28 April 2016 Sentinel-1B Launch from Kourou, 25 April 2016 Sentinel 1 Mission Operations
Remote sensing of sea ice
 Remote sensing of sea ice Ice concentration/extent Age/type Drift Melting Thickness Christian Haas Remote Sensing Methods Passive: senses shortwave (visible), thermal (infrared) or microwave radiation
Ice & Snow Session. Chairs: J. Mouginot & N. Gourmelen
 Ice & Snow Session Chairs: J. Mouginot & N. Gourmelen Session 12 talks and 10 posters Antarctic ice motion, ground-line detection and monitoring, dynamics ice-fluctuations in Antarctica and Greenland,
Julia Figa-Saldaña & Klaus Scipal
 Julia Figa-Saldaña & Klaus Scipal julia.figa@eumetsat.int klaus.scipal@esa.int Meeting, Outline MetOp/EPS status MetOp/EPS Second Generation status 2016 scatterometer conference Other European ocean programme
LEGOS Altimetric Sea Ice Thickness Data Product v1.0
 LEGOS Altimetric Sea Ice Thickness Data Product v1.0 (a) Ice thickness c2 02/2015 (m) 3.24 2.88 2.52 2.16 1.80 1.44 1.08 0.72 0.36 0.00 Authors: Kevin Guerreiro & Sara Fleury September 2017 (b) Incertitude
A Factor of 2-4 Improvement in Marine Gravity and Predicted Bathymetry from CryoSat, Jason-1, and Envisat Radar Altimetry: Arctic and Coastal Regions
 DISTRIBUTION STATEMENT A. Approved for public release; distribution is unlimited. A Factor of 2-4 Improvement in Marine Gravity and Predicted Bathymetry from CryoSat, Jason-1, and Envisat Radar Altimetry:
Status report on current and future satellite systems by EUMETSAT Presented to CGMS-44, Plenary session, agenda item D.1
 Status report on current and future satellite systems by EUMETSAT Presented to CGMS-44, Plenary session, agenda item D.1 CGMS-44-EUMETSAT-WP-19.ppt, version 1 (# 859110), 8 June 2016 MISSION PLANNING YEAR...
Main evolutions and Data Quality Status Summary
 esrin Largo Galileo Galilei,1 Casella Postale 64 00044 Frascati, Italy T +39 06 9418 01 F +39 06 9418 0280 www.esa.int 5 th December 2017 Prepared by R. Mannan (Telespazio UK) CryoSat Quality Team (IDEAS+)
sentinel-3 A BIGGER PICTURE FOR COPERNICUS
 sentinel-3 A BIGGER PICTURE FOR COPERNICUS SATELLITES TO SERVE By providing a set of key information services for a wide range of practical applications, Europe s Copernicus programme has been put in place
SPECIAL PROJECT PROGRESS REPORT
 SPECIAL PROJECT PROGRESS REPORT Progress Reports should be 2 to 10 pages in length, depending on importance of the project. All the following mandatory information needs to be provided. Reporting year
China France. Oceanography S A T. The CFOSAT project. e l l i t e. C. Tison (1), D. Hauser (2), A. Mouche (3) CNES, France (2)
, D. Hauser (2), A. Mouche (3) CNES, France (2)") China France The CFOSAT project C. Tison (1), D. Hauser (2), A. Mouche (3) (1) CNES, France (2) OVSQ, CNRS, LATMOS-IPSL, France (3) IFREMER, LOS, France celine.tison@cnes.fr Oceanography S A T e l l i
China France The CFOSAT project C. Tison (1), D. Hauser (2), A. Mouche (3) (1) CNES, France (2) OVSQ, CNRS, LATMOS-IPSL, France (3) IFREMER, LOS, France celine.tison@cnes.fr Oceanography S A T e l l i
Exploiting radar power to study oceans and climate: the rise and prospects of satellite altimetry
 Exploiting radar power to study oceans and climate: the rise and prospects of satellite altimetry Paolo Cipollini National Oceanography Centre, Southampton, UK with contributions by Peter Challenor, Ian
CRYOSAT ICE DATA QUALITY STATUS SUMMARY
 esrin Via Galileo Galilei Casella Postale 64 00044 Frascati Italy T +39 06 9418 01 F +39 06 9418 0280 www.esa.int CRYOSAT ICE DATA QUALITY STATUS SUMMARY 3 rd August 2017 Prepared by: R.Mannan (Telespazio
Sea Level Space Watch: Service Offering
 Space for Smarter Government Programme Sea Level Space Watch: Service Offering General Sea Level Space Watch : Operational service developed to support national flood defence planning. Systematically updated
K&C Phase 4 Status report. Ice Sheet Monitoring using ALOS-2. University of California, Irvine 2 JPL
 K&C Phase 4 Status report Ice Sheet Monitoring using ALOS-2 Bernd Scheuchl 1, Jeremie Mouginot 1, Eric Rignot 1,2 1 University of California, Irvine 2 JPL Science Team meeting #24 Tokyo, Japan, January
Coastal Altimetry Workshop February 5-7, Supported by NOAA (Stan Wilson) NASA (Eric Lindstrom, Lee Fu)
 NASA (Eric Lindstrom, Lee Fu)") Coastal Altimetry Workshop February 5-7, 2008 Organized by: Laury Miller, Walter Smith: NOAA/NESDIS Ted Strub, Amy Vandehey: CIOSS/COAS/OSU With help from many of you! Supported by NOAA (Stan Wilson) NASA
Coastal Altimetry Workshop February 5-7, 2008 Organized by: Laury Miller, Walter Smith: NOAA/NESDIS Ted Strub, Amy Vandehey: CIOSS/COAS/OSU With help from many of you! Supported by NOAA (Stan Wilson) NASA
ENVISAT - AATSR CYCLIC REPORT #63
 ENVISAT - AATSR CYCLIC REPORT #63 START END DATE 29 OCT 2007 03 DEC 2007 TIME 21:59:29 21:59:29 ORBIT # 29614 30114 Himalayas, 18 November 2007 Daytime visible image showing snow on the Western Himalayas.
The COASTALT Project: Towards an Operational use of Satellite Altimetry in the Coastal Zone
 The COASTALT Project: Towards an Operational use of Satellite Altimetry in the Coastal Zone Stefano Vignudelli (1), Paolo Cipollini (2), Christine Gommenginger (2), Helen Snaith (2), Henrique Coelho (3),
Dropping Ice Shelves onto an Ocean Model and Moving Grounding Lines. Robert Hallberg NOAA / GFDL
 Dropping Ice Shelves onto an Ocean Model and Moving Grounding Lines Robert Hallberg NOAA / GFDL Projected Global Mean Sea Level Rise Sources of uncertainty in 2100 global mean sea level projections: Forcing
Product Notice ID. OL_2_LFR in NRT and NTC OL_2_LRR in NRT and NTC. Product. Issue/Rev Date 25/01/2019 Version 1.0
 S3 Product Notice OLCI Mission Sensor Product & OLCI OL_2_LFR in NRT and NTC OL_2_LRR in NRT and NTC Product Notice ID S3.PN-OLCI-L2L.02 Issue/Rev Date 25/01/2019 Version 1.0 Preparation This Product Notice
Observations of Arctic snow and sea ice thickness from satellite and airborne surveys. Nathan Kurtz NASA Goddard Space Flight Center
 Observations of Arctic snow and sea ice thickness from satellite and airborne surveys Nathan Kurtz NASA Goddard Space Flight Center Decline in Arctic sea ice thickness and volume Kwok et al. (2009) Submarine
Fri. Apr. 06, Map Projections Environmental Applications. Reading: Finish Chapter 9 ( Environmental Remote Sensing )
") Fri. Apr. 06, 2018 Map Projections Environmental Applications Reading: Finish Chapter 9 ( Environmental Remote Sensing ) Once again -- Satellites old but principles still apply Skim Sabins Chapter 10.
Fri. Apr. 06, 2018 Map Projections Environmental Applications Reading: Finish Chapter 9 ( Environmental Remote Sensing ) Once again -- Satellites old but principles still apply Skim Sabins Chapter 10.
Meltwater produced by wind-albedo interaction stored in an East Antarctic ice shelf Supplementary Information
 Meltwater produced by wind-albedo interaction stored in an East Antarctic ice shelf Supplementary Information 1 Supplementary Figure 1: (a) Upper and (b) lower surface of an englacial lake surveyed by
Using Remote-sensed Sea Ice Thickness, Extent and Speed Observations to Optimise a Sea Ice Model
 Using Remote-sensed Sea Ice Thickness, Extent and Speed Observations to Optimise a Sea Ice Model Paul Miller, Seymour Laxon, Daniel Feltham, Douglas Cresswell Centre for Polar Observation and Modelling
Status of EUMETSAT Operational Services & EUMETCast Africa Dissemination Baseline Updates
 Status of EUMETSAT Operational Services & EUMETCast Africa Dissemination Baseline Updates Sally Wannop User Relations Manager 1 8th WMO RAIDEG meeting 1-2 November 2017 # 951881 Overview EUMETCast Overview
Coastal Altimetry: recent developments and proposed use in the Agulhas region. Paolo Cipollini (NOCS, UK)
") Coastal Altimetry: recent developments and proposed use in the Agulhas region Paolo Cipollini (NOCS, UK) Coastal altimetry - the concept Satellite altimetry has been designed for the open ocean 15 years
Coastal Altimetry: recent developments and proposed use in the Agulhas region Paolo Cipollini (NOCS, UK) Coastal altimetry - the concept Satellite altimetry has been designed for the open ocean 15 years
Envisat FDGDR Quality Assessment Report
 Envisat FDGDR Quality Assessment Report 08-09-2008 / 13-10-2008 Prepared by : IDEAS team Accepted by : Approved by : Table of contents 1 Introduction 1 2 Acronyms 2 3 Reference documents 4 4 General quality
SNOW DEPTH AND SURFACE CONDITIONS OF AUSTFONNA ICE CAP (SVALBARD) USING FIELD OBSERVATIONS AND SATELLITE ALTIMETRY
 USING FIELD OBSERVATIONS AND SATELLITE ALTIMETRY") SNOW DEPTH AND SURFACE CONDITIONS OF AUSTFONNA ICE CAP (SVALBARD) USING FIELD OBSERVATIONS AND SATELLITE ALTIMETRY Alexei Kouraev (1,2), Benoît Legrésy (1), Frédérique Rémy (1), Andrea Taurisano (3,4),
SNOW DEPTH AND SURFACE CONDITIONS OF AUSTFONNA ICE CAP (SVALBARD) USING FIELD OBSERVATIONS AND SATELLITE ALTIMETRY Alexei Kouraev (1,2), Benoît Legrésy (1), Frédérique Rémy (1), Andrea Taurisano (3,4),
Towards eenvironment Prague, March GMES Space Component. Josef Aschbacher Head, ESA GMES Space Office
 Towards eenvironment Prague, 25-27 March 2009 GMES Space Component Josef Aschbacher Head, ESA GMES Space Office Prague from Space Segment 2 05 Nov 2003 CNES 2003 GISAT 2007 ESA GSELAND GMES is an EU led
The impact of combined assimilation of altimeters data and wave spectra from S-1A and 1B in the operational model MFWAM
 The impact of combined assimilation of altimeters data and wave spectra from S-1A and 1B in the operational model MFWAM Lotfi Aouf and Alice Dalphinet Météo-France, Département Marine et Oceanographie
TEACHER PAGE Trial Version
 TEACHER PAGE Trial Version * After completion of the lesson, please take a moment to fill out the feedback form on our web site (https://www.cresis.ku.edu/education/k-12/online-data-portal)* Lesson Title:
Mass balance of sea ice in both hemispheres Airborne validation and the AWI CryoSat-2 sea ice data product
 Mass balance of sea ice in both hemispheres Airborne validation and the AWI CryoSat-2 sea ice data product Stefan Hendricks Robert Ricker Veit Helm Sandra Schwegmann Christian Haas Andreas Herber Airborne
Near Real-Time Alongtrack Altimeter Sea Level Anomalies: Options. Corinne James and Ted Strub Oregon State University. Motivation
 Near Real-Time Alongtrack Altimeter Sea Level Anomalies: Options Corinne James and Ted Strub Oregon State University Motivation Modelers want easy access to alongtrack SSHA, SLA or ADT, with enough explanations
Jason-1 orbit comparison : POE-E versus POE-D. L. Zawadzki, M. Ablain (CLS)
") Jason-1 orbit comparison : versus POE-D L. Zawadzki, M. Ablain (CLS) Jason-1 orbit comparison : versus POE-D Objectives Evaluate orbit for Jason-1 (by comparison to POE-D standard) Observe and analyse
Jason-1 orbit comparison : versus POE-D L. Zawadzki, M. Ablain (CLS) Jason-1 orbit comparison : versus POE-D Objectives Evaluate orbit for Jason-1 (by comparison to POE-D standard) Observe and analyse
The ICESat 2 Mission Laser altimetry of ice, clouds and land elevation
 OSTM SWT San Diego October 2011 The ICESat 2 Mission Laser altimetry of ice, clouds and land elevation and also ocean, coastal, and continental waters Charon Birkett, ESSIC/UMD on behalf of T. Markus,
Sea Ice Advisories for Indian Research & Supply Vessels
 Sea Ice Advisories for Indian Research & Supply Vessels D. Ram Rajak, R. K. Kamaljit Singh, Jayaprasad P., Sandip R. Oza, M. Javed Beg* Space Applications Centre, ISRO, Ahmedabad, India. *National Centre
Exploring The Polar Connection to Sea Level Rise NGSS Disciplinary Core Ideas Science & Engineering Crosscutting Concepts
 Exploring The Polar Connection to Sea Level Rise NGSS Disciplinary Core Ideas Science & Engineering Crosscutting Concepts Practices MS - ESS: Earth & Space Science 1. Ask questions 2. Developing and using
Sea level projections with semiempirical and earth system models
 Sea level projections with semiempirical and earth system models John C. Moore College of Global Change and Earth System Science, Beijing Normal University, Beijing, China and Arctic Centre, University
Presented at the FIG Congress 2018, May 6-11, 2018 in Istanbul, Turkey
 Presented at the FIG Congress 2018, May 6-11, 2018 in Istanbul, Turkey Paper ID: 9253 (Peer Review) By: Amalina Izzati Abdul Hamid, Ami Hassan Md Din & Kamaludin Mohd Omar Geomatic Innovation Research
The State of the cryosphere
 The State of the cryosphere Course outline Introduction The cryosphere; what is it? The Earth; a unique planet Cryospheric components Classifications Lecture outlines The State of the cryosphere The State
Sea ice concentration off Dronning Maud Land, Antarctica
 Rapportserie nr. 117 Olga Pavlova and Jan-Gunnar Winther Sea ice concentration off Dronning Maud Land, Antarctica The Norwegian Polar Institute is Norway s main institution for research, monitoring and
Evaluating the Discrete Element Method as a Tool for Predicting the Seasonal Evolution of the MIZ
 DISTRIBUTION STATEMENT A. Approved for public release; distribution is unlimited. Evaluating the Discrete Element Method as a Tool for Predicting the Seasonal Evolution of the MIZ Arnold J. Song Cold Regions
This is version v0.2 of this report issued together with the SIT and SIV data sets at the ICDC ESA-CCI- Projekt web page
 Report about Retrieval of sea-ice volume (SIV) from SICCI-2 sea-ice thickness (SIT) data and combined OSI-450 and SICCI-2 sea-ice concentration (SIC) data version v0.2, June 2018 by Stefan Kern, ICDC,
Analysis of Antarctic Sea Ice Extent based on NIC and AMSR-E data Burcu Cicek and Penelope Wagner
 Analysis of Antarctic Sea Ice Extent based on NIC and AMSR-E data Burcu Cicek and Penelope Wagner 1. Abstract The extent of the Antarctica sea ice is not accurately defined only using low resolution microwave
Hydrosphere The hydrosphere includes all water on Earth.
 Hydrosphere The hydrosphere includes all water on Earth. The abundance of water on Earth is a unique feature that clearly distinguishes our "Blue Planet" from others in the solar system. Not a drop of
ESA Agency Inputs 7 th Meeting of the Polar Space Task Group
 This image cannot currently be displayed. ESA Agency Inputs 7 th Meeting of the Polar Space Task Group Mark Drinkwater, ESA-ESTEC PSTG-7 Innsbruck, Austria 11-12 December, 2017 Sentinel-3 OLCI 864 29 October,
The Copernicus Sentinel-3 Mission: Status and First Results
 The Copernicus Sentinel-3 Mission: Status and First Results 21 st Appleton Space Conference, Harwell, UK, December 2016 Craig Donlon Sentinel-3 Mission Scientist (ESA/ESTEC) Francios Boy (CNES), Remko
GLAS Atmospheric Products User Guide November, 2008
 GLAS Atmospheric Products User Guide November, 2008 Overview The GLAS atmospheric measurements utilize a dual wavelength (532 nm and 1064 nm) transmitting laser to obtain backscattering information on
D2.1 Product Validation Plan (PVP)
") Consortium Members ESA Sea Level CCI D2.1 Product Validation Plan (PVP) Reference: Nomenclature: CLS-DOS-NT-10-278 SLCCI-PVP-005 Issue: 1. 1 Date: Oct. 11, 11 CLS-DOS-NT-10-278 SLCCI-PVP-005 Issue 1.1
Consortium Members ESA Sea Level CCI D2.1 Product Validation Plan (PVP) Reference: Nomenclature: CLS-DOS-NT-10-278 SLCCI-PVP-005 Issue: 1. 1 Date: Oct. 11, 11 CLS-DOS-NT-10-278 SLCCI-PVP-005 Issue 1.1
"Ice Sheets and Sea Level Rise: How Should IPCC Handle Deep Uncertainty?" Michael Oppenheimer For Inside the IPCC Princeton University 1 April 2008
 "Ice Sheets and Sea Level Rise: How Should IPCC Handle Deep Uncertainty?" Michael Oppenheimer For Inside the IPCC Princeton University 1 April 2008 This Talk is about: IPCCs (controversial) assessment
Bugs in JRA-55 snow depth analysis
 14 December 2015 Climate Prediction Division, Japan Meteorological Agency Bugs in JRA-55 snow depth analysis Bugs were recently found in the snow depth analysis (i.e., the snow depth data generation process)
SAR Coordination for Snow Products
 Polar SAR Coordination Working Meeting 5 SAR Coordination for Snow Products David Small 1, Thomas Nagler 2, David Jäger 1, Christoph Rohner 1, Adrian Schubert 1 1: University of Zurich, Switzerland 2:
Satellite Oceanography and Applications 2: Altimetry, scatterometry, SAR, GRACE. RMU Summer Program (AUGUST 24-28, 2015)
") Satellite Oceanography and Applications 2: Altimetry, scatterometry, SAR, GRACE RMU Summer Program (AUGUST 24-28, 2015) Altimetry 2 Basic principles of satellite altimetry Altimetry: the measurements of
Satellite Oceanography and Applications 2: Altimetry, scatterometry, SAR, GRACE RMU Summer Program (AUGUST 24-28, 2015) Altimetry 2 Basic principles of satellite altimetry Altimetry: the measurements of