Sea ice concentration off Dronning Maud Land, Antarctica
|
|
|
- Lucas Summers
- 6 years ago
- Views:
Transcription
1
2 Rapportserie nr. 117 Olga Pavlova and Jan-Gunnar Winther Sea ice concentration off Dronning Maud Land, Antarctica The Norwegian Polar Institute is Norway s main institution for research, monitoring and topographic mapping in Norwegian polar regions. The Institute also advises Norwegian authorities on matters concerning polar environmental management. Norsk Polarinstitutt
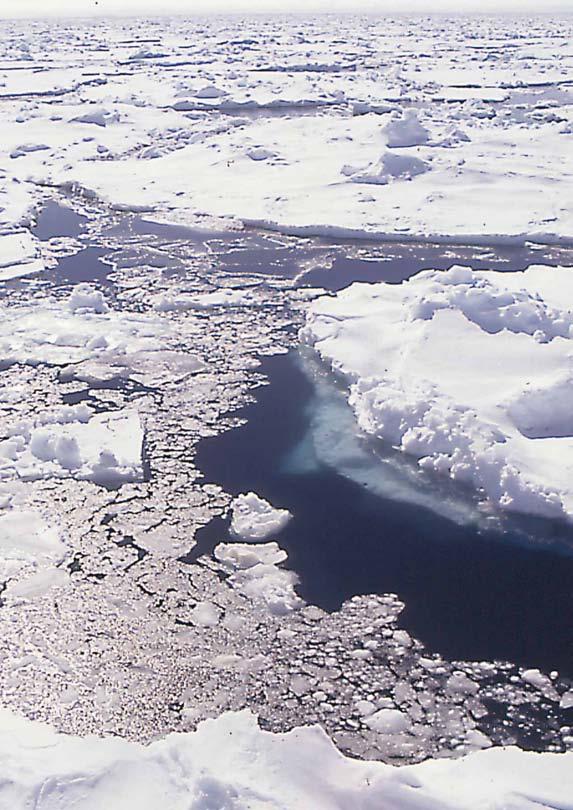
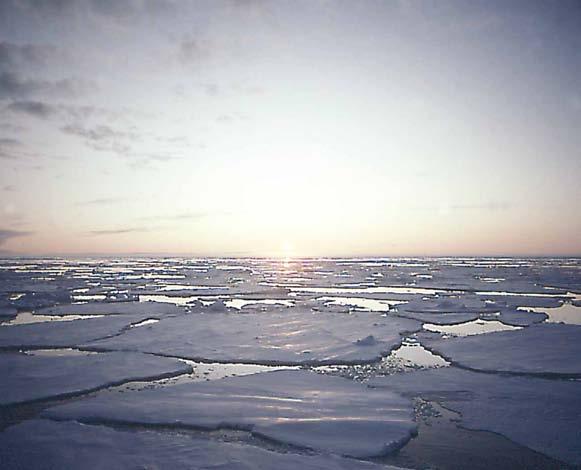
3 Addresses Olga Pavlova/Jan-Gunnar Winther Norwegian Polar Institute Polar Environmental Centre N-9296 Tromsø Norway Technical editor: Gunn Sissel Jaklin, Norwegian Polar Institute Design/layout: Jan Roald, Norwegian Polar Institute Cover photographs: Jan-Gunnar Winther Printed: January 2002 by Lundblad Media as ISBN: ISSN:
4 Contents page Introduction 4 Data set 4 Work description 5 References 6 Appendix I 7 Appendix II 22 Appendix III 37 3
5 Introduction This project was undertaken by the Norwegian Polar Institute for the Norwegian Petroleum Directorate (Oljedirektoratet) as support for planning of marine geophysical surveys offshore from Dronning Maud Land (DML), Antarctica. The project was carried out by scientists Olga Pavlova and Jan-Gunnar Winther at the Norwegian Polar Institute under the direction of Morten Sand at the Norwegian Petroleum Directorate. The main objectives of the project were to: a) calculate 10-day average historical (i.e., ) sea ice concentrations off DML for the months of December through April b) identify the minimum and maximum sea ice extent occurring in the period c) present the above information graphically Daily microwave satellite data covering the period with 25 x 25 km spatial resolution were used as basis for this study (see text below for description of data set). Data set This work concerns analysis and visualization of the spatial and temporal variations of Antarctic sea ice using ice concentration data set acquired by microwave satellite sensors. Our results are based on the NASA Goddard Space Flight Center (GSFC) sea ice concentration data set in the polar stereographic projection with a grid of about 25 x 25 km, covering the period from October 1978 through December This data set currently includes daily and monthly averaged sea ice concentrations derived from NASA Nimbus-7 Scanning Multichannel Microwave Radiometer (SMMR) and Defense Meteorological Satellite Program (DMSP) -F8, -F11, and -F13 Special Sensor Microwave/ Imager (SSM/I) daily brightness temperature. It is distributed by the National Snow and Ice Data Center (NSIDC). Information about the data set can be found at ENTRIES/nsi-0051.html. Spatial resolution and grid description The sea ice concentration data provide coverage of the Southern Ocean projected on a polar stereographic grid. This polar stereographic projection specifies a projection plane (i.e., the grid) tangent to the earth at 70 degrees south. The planar grid is designed so that the grid cell at 70 degrees latitude is 25 km by 25 km. The polar stereographic formulae for converting between latitude/longitude and X-Y grid coordinates was taken from the map projections used by the U.S. Geological Survey (Snyder 1982). The origin of each grid point (i.e., X, Y) is the pole. The grid size is 332 rows by 316 columns. The first data value in the Southern Hemisphere files corresponds to degrees latitude and degrees longitude. Temporal resolution 4
6 SMMR data were collected every other day (from 26 October 1978 through December 1987). Typically, there are at least 14 days of coverage per month. A major data gap in the SMMR data occurred in August 1982 and August SSM/I data were collected daily (from December 1987 through December 1996). A major data gap in the SSM/I data occurred between 3 December 1987 and 13 January Data range Ice concentration is ranging from 0.0 to 1.0. Thus, a sea ice concentration of 0% (i.e., no sea ice present) is mapped as a value of 0.0 and a sea ice concentration of 100% is mapped as a value of 1.0. We have presented plots of both 0.05 (or 5%) and 0.10 (or 10%) resolution in sea ice concentration (see Appendices I, II and III). Work description The area of interest is limited to the area between 60 degrees east longitude and 60 degrees west longitude. Our investigations cover the five summer months from December through April. Temporal coverage is the time series of 19 years of sea ice concentration from 1978 to To calculate 10-day average sea ice concentration fields we used gridded daily and everyother-day sea ice concentration. This process was divided into two steps. First, we prepared 10-days average data for each of the five summer months for the whole series (i.e., 19 years). This 10-day average data were generated by averaging all the available daily (or every-otherday for SMMR) ice concentration data split in three periods per month. Second, we averaged these 19 fields for each individual 10-day period. Thus, we obtained one average field for each of the three 10-day periods for each of the five months, producing totally 15 fields of mean sea ice concentration. For reading and averaging these data a FORTRAN program was used. For the selection of the absolute minimum and maximum sea ice extent for each 10-day period we used the following approach: we determined the minimum and maximum sea ice extent as the extreme situations occurring during for a sea ice concentration of 10% and 5%, respectively, for the whole region. This means that we plotted when the minimum and maximum areas with sea ice concentration of 10% and 5% over our domain occurred. This further means that there might have been more extreme sea ice conditions at a particular position (or pixel) since we show the extreme situations as they occurred over the whole area. Plotting the extreme situations occurring at each grid point (or location) would probably produce a scattered border line and not give a sound physical reconstruction of extreme sea ice conditions. Therefore, we selected the four 5
7 (i. e., two for sea ice concentration of 10% and 5%, respectively) extreme days occurring during (within each of the 10-day periods) in this region. We emphasize that such an approach of determination of minimum and maximum ice conditions depends on the region selected. This means that for another region the days of absolute minimum and maximum ice extent might be different. This work was done using FORTRAN as program language. We prepared three versions of the fifteen10-day average sea ice concentration; one with 10% resolution and two with 5% (one indicating every degree of latitude) in sea ice concentrations, respectively. The data behind the figures are identical for all three versions. Each of these figures presents the 10-day average of sea ice concentration and two solid lines that indicate the absolute minimum and maximum sea ice concentration of 10% (Appendix I) and 5% (Appendices II and III) for the period. the problems for ship operations caused by sea ice compared to early in the season because the sea ice is thin. On the other hand, relevant for ship operations, in April air temperatures drop quickly and the potential for icing increases significantly. As a tool to graphically display our results we used Golden Software SURFER Program. References Snyder, J.P. 1982: Map projections used by the U.S. Geological Survey. U.S. Geological Survey Bulletin 1532, 313 p. It should be emphasized that the microwave emissivity of sea ice is affected by the ice thickness. When the ice cover is thin, the satellitederived emissivity shows combined contributions from the underlying water and the ice, the contribution from the water decreasing with increasing ice thickness. This means that plots from early season (e.g., December) and late season (e.g., April) are not directly comparable. Thus, the plots from April overestimate 6
8 Appendices APPENDIX I 10-day average of sea ice concentrations (at 10% resolution) off Dronning Maud Land, Antarctica, for The extreme situations for sea ice concentrations of 10% for are also shown. Fig. I-1 10 day average of Antarctic sea ice concentrations for Solid lines indicate the absolute minimum (blue) and maximum (red) ice extent. APPENDIX I 7
9 8 Fig. I-2 10 day average of Antarctic sea ice concentrations for Solid lines indicate the absolute minimum (blue) and maximum (red) ice APPENDIX I
10 Fig. I-3 10 day average of Antarctic sea ice concentrations for Solid lines indicate the absolute minimum (blue) and maximum (red) ice APPENDIX I 9
11 10 Fig. I-4 10 day average of Antarctic sea ice concentrations for Solid lines indicate the absolute minimum (blue) and maximum (red) ice APPENDIX I
12 Fig. I-5 10 day average of Antarctic sea ice concentrations for Solid lines indicate the absolute minimum (blue) and maximum (red) ice extent. APPENDIX I 11
13 12 Fig. I-6 10 day average of Antarctic sea ice concentrations for Solid lines indicate the absolute minimum (blue) and maximum (red) ice extent. APPENDIX I
14 Fig. I-7 10 day average of Antarctic sea ice concentrations for Solid lines indicate the absolute minimum (blue) and maximum (red) ice APPENDIX I 13
15 14 Fig. I-8 10 day average of Antarctic sea ice concentrations for Solid lines indicate the absolute minimum (blue) and maximum (red) ice APPENDIX I
16 Fig. I-9 10 day average of Antarctic sea ice concentrations for Solid lines indicate the absolute minimum (blue) and maximum (red) ice extent. APPENDIX I 15
17 16 Fig. I day average of Antarctic sea ice concentrations for Solid lines indicate the absolute minimum (blue) and maximum (red) ice extent. APPENDIX I
18 Fig. I day average of Antarctic sea ice concentrations for Solid lines indicate the absolute minimum (blue) and maximum (red) ice extent. APPENDIX I 17
19 18 Fig. I day average of Antarctic sea ice concentrations for Solid lines indicate the absolute minimum (blue) and maximum (red) ice extent. APPENDIX I
20 Fig. I day average of Antarctic sea ice concentrations for Solid lines indicate the absolute minimum (blue) and maximum (red) ice APPENDIX I 19
21 20 Fig. I day average of Antarctic sea ice concentrations for Solid lines indicate the absolute minimum (blue) and maximum (red) ice APPENDIX I
22 Fig. I day average of Antarctic sea ice concentrations for Solid lines indicate the absolute minimum (blue) and maximum (red) ice extent. APPENDIX I 21
23 APPENDIX II 10-day average of sea ice concentrations (at 5% resolution) off Dronning Maud Land, Antarctica, for The extreme situations for sea ice concentrations of 5% for are also shown. Fig. II-1 10 day average of Antarctic sea ice concentrations for Solid lines indicate the absolute minimum (blue) and maximum (red) ice APPENDIX II 22
24 Fig. II-2 10 day average of Antarctic sea ice concentrations for Solid lines indicate the absolute minimum (blue) and maximum (red) ice APPENDIX II 23
25 24 Fig. II-3 10 day average of Antarctic sea ice concentrations for Solid lines indicate the absolute minimum (blue) and maximum (red) ice extent. APPENDIX II
26 Fig. II-4 10 day average of Antarctic sea ice concentrations for Solid lines indicate the absolute minimum (blue) and maximum (red) ice extent. APPENDIX II 25
27 26 Fig. II-5 10 day average of Antarctic sea ice concentrations for Solid lines indicate the absolute minimum (blue) and maximum (red) ice APPENDIX II
28 Fig. II-6 10 day average of Antarctic sea ice concentrations for Solid lines indicate the absolute minimum (blue) and maximum (red) ice extent. APPENDIX II 27
29 28 Fig. II-7 10 day average of Antarctic sea ice concentrations for Solid lines indicate the absolute minimum (blue) and maximum (red) ice extent. APPENDIX II
30 Fig. II-8 10 day average of Antarctic sea ice concentrations for Solid lines indicate the absolute minimum (blue) and maximum (red) ice APPENDIX II 29
31 30 Fig. II-9 10 day average of Antarctic sea ice concentrations for Solid lines indicate the absolute minimum (blue) and maximum (red) ice APPENDIX II
32 Fig. II day average of Antarctic sea ice concentrations for Solid lines indicate the absolute minimum (blue) and maximum (red) ice extent. APPENDIX II 31
33 32 Fig. II day average of Antarctic sea ice concentrations for Solid lines indicate the absolute minimum (blue) and maximum (red) ice APPENDIX II
34 Fig. II day average of Antarctic sea ice concentrations for Solid lines indicate the absolute minimum (blue) and maximum (red) ice APPENDIX II 33
35 34 Fig. II day average of Antarctic sea ice concentrations for Solid lines indicate the absolute minimum (blue) and maximum (red) ice APPENDIX II
36 Fig. II day average of Antarctic sea ice concentrations for Solid lines indicate the absolute minimum (blue) and maximum (red) ice extent. APPENDIX II 35
37 36 Fig. II day average of Antarctic sea ice concentrations for Solid lines indicate the absolute minimum (blue) and maximum (red) ice extent. APPENDIX II
38 APPENDIX III 10-day average of sea ice concentrations (at 5% resolution every degree of latitude is indicated) off Dronning Maud Land, Antarctica, for The extreme situations for sea ice concentrations of 5% for are also shown. Fig. III-1 10 day average of Antarctic sea ice concentrations for Solid lines indicate the absolute minimum (blue) and maximum (red) ice extent. APPENDIX III 37
39 Fig. III-2 10 day average of Antarctic sea ice concentrations for Solid lines indicate the absolute minimum (blue) and maximum (red) ice extent. APPENDIX III 38
40 Fig. III-3 10 day average of Antarctic sea ice concentrations for Solid lines indicate the absolute minimum (blue) and maximum (red) ice extent. APPENDIX III 39
41 40 Fig. III-4 10 day average of Antarctic sea ice concentrations for Solid lines indicate the absolute minimum (blue) and maximum (red) ice extent. APPENDIX III
42 Fig. III-5 10 day average of Antarctic sea ice concentrations for Solid lines indicate the absolute minimum (blue) and maximum (red) ice extent. APPENDIX III 41
43 42 Fig. III-6 10 day average of Antarctic sea ice concentrations for Solid lines indicate the absolute minimum (blue) and maximum (red) ice extent. APPENDIX III
44 Fig. III-7 10 day average of Antarctic sea ice concentrations for Solid lines indicate the absolute minimum (blue) and maximum (red) ice extent. APPENDIX III 43
45 44 Fig. III-8 10 day average of Antarctic sea ice concentrations for Solid lines indicate the absolute minimum (blue) and maximum (red) ice APPENDIX III
46 Fig. III-9 10 day average of Antarctic sea ice concentrations for Solid lines indicate the absolute minimum (blue) and maximum (red) ice extent. APPENDIX III 45
47 46 Fig. III day average of Antarctic sea ice concentrations for Solid lines indicate the absolute minimum (blue) and maximum (red) ice APPENDIX III
48 Fig. III day average of Antarctic sea ice concentrations for Solid lines indicate the absolute minimum (blue) and maximum (red) ice extent. APPENDIX III 47
49 48 Fig. III day average of Antarctic sea ice concentrations for Solid lines indicate the absolute minimum (blue) and maximum (red) ice extent. APPENDIX III
50 Fig. III day average of Antarctic sea ice concentrations for Solid lines indicate the absolute minimum (blue) and maximum (red) ice extent. APPENDIX III 49
51 50 Fig. III day average of Antarctic sea ice concentrations for Solid lines indicate the absolute minimum (blue) and maximum (red) ice extent. APPENDIX III
52 Fig. III day average of Antarctic sea ice concentrations for Solid lines indicate the absolute minimum (blue) and maximum (red) ice extent. APPENDIX III 51
53
A. Windnagel M. Savoie NSIDC
 National Snow and Ice Data Center ADVANCING KNOWLEDGE OF EARTH'S FROZEN REGIONS Special Report #18 06 July 2016 A. Windnagel M. Savoie NSIDC W. Meier NASA GSFC i 2 Contents List of Figures... 4 List of
Passive Microwave Sea Ice Concentration Climate Data Record
 Passive Microwave Sea Ice Concentration Climate Data Record 1. Intent of This Document and POC 1a) This document is intended for users who wish to compare satellite derived observations with climate model
Image 1: Earth from space
 Image 1: Earth from space Credit: NASA Spacecraft: Apollo 17 Sensor: camera using visible light Image date: December 7, 1972 This image is a photograph of Earth taken by Harrison "Jack" Schmitt, an astronaut
Analysis of Antarctic Sea Ice Extent based on NIC and AMSR-E data Burcu Cicek and Penelope Wagner
 Analysis of Antarctic Sea Ice Extent based on NIC and AMSR-E data Burcu Cicek and Penelope Wagner 1. Abstract The extent of the Antarctica sea ice is not accurately defined only using low resolution microwave
Could Instrumentation Drift Account for Arctic Sea Ice Decline?
 Could Instrumentation Drift Account for Arctic Sea Ice Decline? Jonathan J. Drake 3/31/2012 One of the key datasets used as evidence of anthropogenic global warming is the apparent decline in Arctic sea
Studying snow cover in European Russia with the use of remote sensing methods
 40 Remote Sensing and GIS for Hydrology and Water Resources (IAHS Publ. 368, 2015) (Proceedings RSHS14 and ICGRHWE14, Guangzhou, China, August 2014). Studying snow cover in European Russia with the use
Summer and early-fall sea-ice concentration in the Ross Sea: comparison of in situ ASPeCt observations and satellite passive microwave estimates
 Annals of Glaciology 44 2006 1 Summer and early-fall sea-ice concentration in the Ross Sea: comparison of in situ ASPeCt observations and satellite passive microwave estimates Margaret A. KNUTH, 1 Stephen
ERBE Geographic Scene and Monthly Snow Data
 NASA Contractor Report 4773 ERBE Geographic Scene and Monthly Snow Data Lisa H. Coleman, Beth T. Flug, Shalini Gupta, Edward A. Kizer, and John L. Robbins Science Applications International Corporation
This is version v0.2 of this report issued together with the SIT and SIV data sets at the ICDC ESA-CCI- Projekt web page
 Report about Retrieval of sea-ice volume (SIV) from SICCI-2 sea-ice thickness (SIT) data and combined OSI-450 and SICCI-2 sea-ice concentration (SIC) data version v0.2, June 2018 by Stefan Kern, ICDC,
Graphing Sea Ice Extent in the Arctic and Antarctic
 Graphing Sea Ice Extent in the Arctic and Antarctic 1. Large amounts of ice form in some seasons in the oceans near the North Pole and the South Pole (the Arctic Ocean and the Southern Ocean). This ice,
, ε TAWS TAWS, TS TAWS TAWS TB/TAWS AWS TAWS TAWS TAWS
 West Antarctic Ice Sheet Firn Temperature Record Continuity and Seasonal Trends: Implications for Determining Emissivity Trends from SSM/I Brightness Temperatures Jamika Baltrop, Brian Campbell, TreAsia
Regional Sea Ice Outlook for Greenland Sea and Barents Sea - based on data until the end of May 2013
 Regional Sea Ice Outlook for Greenland Sea and Barents Sea - based on data until the end of May 2013 Sebastian Gerland 1*, Max König 1, Angelika H.H. Renner 1, Gunnar Spreen 1, Nick Hughes 2, and Olga
 Page 1 of 10 Search NSIDC... Search Education Center Photo Gallery Home Data Programs & Projects Science Publications News & Events About Overview Global Temperatures Northern Hemisphere Snow Glaciers
+SOI Neutral SOI -SOI. Melt+ Melt- Melt+ Melt- Melt+ Melt- +SAM 1 (0.76) 6 (3.02) 1 (1.13) 5 (4.92) 1 (2.27) 0 (1.89) 14
 6 (3.02) 1 (1.13) 5 (4.92) 1 (2.27) 0 (1.89) 14") Supplementary Table 1. Contingency table tallying the respective counts of positive and negative surface melt index anomalies in the Ross sector as a function of the signs of the Southern Annular Mode
Supplementary Table 1. Contingency table tallying the respective counts of positive and negative surface melt index anomalies in the Ross sector as a function of the signs of the Southern Annular Mode
We greatly appreciate the thoughtful comments from the reviewers. According to the reviewer s comments, we revised the original manuscript.
 Response to the reviews of TC-2018-108 The potential of sea ice leads as a predictor for seasonal Arctic sea ice extent prediction by Yuanyuan Zhang, Xiao Cheng, Jiping Liu, and Fengming Hui We greatly
NSIDC Metrics Report. Lisa Booker February 9, 2012
 NSIDC Metrics Report Lisa Booker February 9, 2012 ACSI Scores 2011 ACSI survey summary Sent to 5458 users; increased number of users contacted NSIDC response rate was 10%, up 1% from last year. NSIDC Customer
Trends in the sea ice cover using enhanced and compatible AMSR-E, SSM/I, and SMMR data
 Click Here for Full Article JOURNAL OF GEOPHYSICAL RESEARCH, VOL. 113,, doi:10.1029/2007jc004257, 2008 Trends in the sea ice cover using enhanced and compatible AMSR-E, SSM/I, and SMMR data Josefino C.
Ocean & Sea Ice SAF. Validation of ice products January March Version 1.1. May 2005
 Ocean & Sea Ice SAF Validation of ice products January 2002 - March 2005 Version 1.1 May 2005 Morten Lind, Keld Q. Hansen, Søren Andersen 1 INTRODUCTION... 3 2 PRODUCTS VALIDATION METHODS... 3 3 GENERAL
Land Surface Temperature Measurements From the Split Window Channels of the NOAA 7 Advanced Very High Resolution Radiometer John C.
 Land Surface Temperature Measurements From the Split Window Channels of the NOAA 7 Advanced Very High Resolution Radiometer John C. Price Published in the Journal of Geophysical Research, 1984 Presented
Northern Hemisphere Snow and Ice Data Records
 Northern Hemisphere Snow and Ice Data Records Making Earth Science Data Records for Use in Research Environments (MEaSUREs) PoDAG XXX Oct 12-13 th, NSIDC MEaSUREs Snow Team David A. Robinson Gina Henderson
Climate Data Record (CDR) Program. Climate Algorithm Theoretical Basis Document (C-ATBD) Sea Ice Concentration
 Program. Climate Algorithm Theoretical Basis Document (C-ATBD) Sea Ice Concentration") Climate Data Record (CDR) Program Climate Algorithm Theoretical Basis Document (C-ATBD) Sea Ice Concentration CDR Program Document Number: CDRP-ATBD-0107 Configuration Item Number: 01B-11 and 01B-11a Revision
Climate Data Record (CDR) Program Climate Algorithm Theoretical Basis Document (C-ATBD) Sea Ice Concentration CDR Program Document Number: CDRP-ATBD-0107 Configuration Item Number: 01B-11 and 01B-11a Revision
OSI SAF Sea Ice products
 OSI SAF Sea Ice products Lars-Anders Brevik, Gorm Dybkjær, Steinar Eastwood, Øystein Godøy, Mari Anne Killie, Thomas Lavergne, Rasmus Tonboe, Signe Aaboe Norwegian Meteorological Institute Danish Meteorological
Condensing Massive Satellite Datasets For Rapid Interactive Analysis
 Condensing Massive Satellite Datasets For Rapid Interactive Analysis Glenn Grant University of Colorado, Boulder With: David Gallaher 1,2, Qin Lv 1, G. Campbell 2, Cathy Fowler 2, Qi Liu 1, Chao Chen 1,
The Polar Sea Ice Cover from Aqua/AMSR-E
 The Polar Sea Ice Cover from Aqua/AMSR-E Fumihiko Nishio Chiba University Center for Environmental Remote Sensing 1-33, Yayoi-cho, Inage-ku, Chiba, 263-8522, Japan fnishio@cr.chiba-u.ac.jp Abstract Historical
Ice Mass & Sea Level Change Unit 3: GROUP A Snowmelt Group
 Ice Mass & Sea Level Change Unit 3: GROUP A Snowmelt Group Becca Walker and Leigh Stearns You have been provided with two Greenland air temperature maps. Satellites equipped with radiometers (instruments
Københavns Universitet
 university of copenhagen Københavns Universitet The EUMETSAT sea ice concentration climate data record Tonboe, Rasmus T.; Eastwood, Steinar; Lavergne, Thomas; Sørensen, Atle M.; Rathmann, Nicholas Mossor;
Ocean & Sea Ice SAF. Validation of ice products January September Version 1.0. September 2004
 Ocean & Sea Ice SAF Validation of ice products January 2002 - September 2004 Version 1.0 September 2004 Keld Q. Hansen, Morten Lind, Søren Andersen 1 INTRODUCTION... 3 2 PRODUCTS VALIDATION METHODS...
Principal Component Analysis of Sea Surface Temperature via Singular Value Decomposition
 Principal Component Analysis of Sea Surface Temperature via Singular Value Decomposition SYDE 312 Final Project Ziyad Mir, 20333385 Jennifer Blight, 20347163 Faculty of Engineering Department of Systems
Correction to Evaluation of the simulation of the annual cycle of Arctic and Antarctic sea ice coverages by 11 major global climate models
 JOURNAL OF GEOPHYSICAL RESEARCH, VOL. 111,, doi:10.1029/2006jc003949, 2006 Correction to Evaluation of the simulation of the annual cycle of Arctic and Antarctic sea ice coverages by 11 major global climate
Towards a global climatology of cloud microphysical properties and why MODIS does not like sunsets (nor sunrise!)
") Towards a global climatology of cloud microphysical properties and why MODIS does not like sunsets (nor sunrise!) Daniel Grosvenor & Robert Wood (U. Washington) Using scattered solar radiation to infer
Towards a global climatology of cloud microphysical properties and why MODIS does not like sunsets (nor sunrise!) Daniel Grosvenor & Robert Wood (U. Washington) Using scattered solar radiation to infer
Blended Sea Surface Winds Product
 1. Intent of this Document and POC Blended Sea Surface Winds Product 1a. Intent This document is intended for users who wish to compare satellite derived observations with climate model output in the context
Use of SSM/I ice concentration data in the ECMWF SST analysis
 Meteorol. Appl. 5, 287 296 (1998) Use of SSM/I ice concentration data in the ECMWF SST analysis P Fernandez*, G Kelly and R Saunders, EUMETSAT/ECMWF Fellowship Programme, ECMWF, Shinfield Park, Reading,
Development of sea ice climate data records. W. Meier
 Development of sea ice climate data records W. Meier WOAP Workshop, Frascati, Italy, 18 April 2011 Passive microwave sea ice data 32+ year record able to track long-term trends Near-complete, daily fields
Summary The present report describes one possible way to correct radiometric measurements of the SSM/I (Special Sensor Microwave Imager) at 85.5 GHz f
 at 85.5 GHz f") Compensating for atmospheric eects on passive radiometry at 85.5 GHz using a radiative transfer model and NWP model data Stefan Kern Institute of Environmental Physics University of Bremen, 28334 Bremen,
Compensating for atmospheric eects on passive radiometry at 85.5 GHz using a radiative transfer model and NWP model data Stefan Kern Institute of Environmental Physics University of Bremen, 28334 Bremen,
Advancements and validation of the global CryoClim snow cover extent product
 www.nr.no Advancements and validation of the global CryoClim snow cover extent product Rune Solberg1, Øystein Rudjord1, Arnt-Børre Salberg1 and Mari Anne Killie2 1) Norwegian Computing Center (NR), P.O.
The importance of long-term Arctic weather station data for setting the research stage for climate change studies
 The importance of long-term Arctic weather station data for setting the research stage for climate change studies Taneil Uttal NOAA/Earth Systems Research Laboratory Boulder, Colorado Things to get out
Remote sensing of sea ice
 Remote sensing of sea ice Ice concentration/extent Age/type Drift Melting Thickness Christian Haas Remote Sensing Methods Passive: senses shortwave (visible), thermal (infrared) or microwave radiation
Comparison of Remotely Sensed Wind Data over Sulawesi and Maluku Islands Sea Areas
 ICoSE Conference on Instrumentation, Environment and Renewable Energy (2015), Volume 2016 Conference Paper Comparison of Remotely Sensed Wind Data over Sulawesi and Maluku Islands Sea Areas Faisal Mahmuddin,
JOURNAL OF GEOPHYSICAL RESEARCH, VOL. 111, F01003, doi: /2005jf000318, 2006
 JOURNAL OF GEOPHYSICAL RESEARCH, VOL. 111,, doi:10.1029/2005jf000318, 2006 Spatiotemporal variations of snowmelt in Antarctica derived from satellite scanning multichannel microwave radiometer and Special
Bugs in JRA-55 snow depth analysis
 14 December 2015 Climate Prediction Division, Japan Meteorological Agency Bugs in JRA-55 snow depth analysis Bugs were recently found in the snow depth analysis (i.e., the snow depth data generation process)
Antarctic sea ice variability and trends,
 doi:10.5194/tc-6-871-2012 Author(s) 2012. CC Attribution 3.0 License. The Cryosphere Antarctic sea ice variability and trends, 1979 2010 C. L. Parkinson and D. J. Cavalieri Cryospheric Sciences Laboratory/Code
A comparison of satellite-derived sea-ice motion with driftingbuoy data in the Weddell Sea
 Annals of Glaciology 52(57) 2011 1 A comparison of satellite-derived sea-ice motion with driftingbuoy data in the Weddell Sea Sandra SCHWEGMANN, 1 Christian HAAS, 2 Charles FOWLER, 3 Rüdiger GERDES 1 1
Accelerated decline in the Arctic sea ice cover
 Click Here for Full Article GEOPHYSICAL RESEARCH LETTERS, VOL. 35, L01703, doi:10.1029/2007gl031972, 2008 Accelerated decline in the Arctic sea ice cover Josefino C. Comiso, 1 Claire L. Parkinson, 1 Robert
Validation of passive microwave snow algorithms
 Remote Sensing and Hydrology 2000 (Proceedings of a symposium held at Santa Fe, New Mexico, USA, April 2000). IAHS Publ. no. 267, 2001. 87 Validation of passive microwave snow algorithms RICHARD L. ARMSTRONG
Earth Science and Climate Change
 Earth Science and Climate Change Dr. Mary L. Cleave February 7, 2007 YOU ARE HERE 3 Land Use Changes Over Time Lingering Doubts on Temperature Trends Have Been Resolved 1st CCSP Synthesis & Assessment
Norsk-amerikansk forskningsekspedisjon på innlandsisen i Antarktis. Kirsty Langley Norsk Polarinstitutt
 Norsk-amerikansk forskningsekspedisjon på innlandsisen i Antarktis Kirsty Langley Norsk Polarinstitutt The Antarctic ice sheet Area: ca. 14. 10 6 km 2 90 % of Earth s s ice Complete melting: 60 m sea-level
Brita Horlings
 Knut Christianson Brita Horlings brita2@uw.edu https://courses.washington.edu/ess431/ Natural Occurrences of Ice: Distribution and environmental factors of seasonal snow, sea ice, glaciers and permafrost
Investigation of Arctic ice cover variance using XX century historical ice charts information and last decades microwave data
 Investigation of Arctic ice cover variance using XX century historical ice charts information and last decades microwave data Vasily Smolyanitsky, Arctic and Antarctic Research Institute & JCOMM Expert
Discritnination of a wet snow cover using passive tnicrowa ve satellite data
 Annals of Glaciology 17 1993 International Glaciological Society Discritnination of a wet snow cover using passive tnicrowa ve satellite data A. E. WALKER AND B. E. GOODISON Canadian Climate Centre, 4905
Enhanced Southern Ocean marine productivity due to fertilization by giant icebergs
 Enhanced Southern Ocean marine productivity due to fertilization by giant icebergs Luis P. A. M. Duprat, Grant R. Bigg and David J. Wilton Methods The giant iceberg tracks used for the main analysis come
March was 3rd warmest month in satellite record
 April 4, 2016 Vol. 25, No. 12 For Additional Information: Dr. John Christy, (256) 961-7763 john.christy@nsstc.uah.edu Dr. Roy Spencer, (256) 961-7960 roy.spencer@nsstc.uah.edu Global Temperature Report:
EVALUATION OF ARCTIC OPERATIONAL PASSIVE MICROWAVE PRODUCTS: A CASE STUDY IN THE BARENTS SEA DURING OCTOBER 2001
 Ice in the Environment: Proceedings of the 16th IAHR International Symposium on Ice Dunedin, New Zealand, 2nd 6th December 2002 International Association of Hydraulic Engineering and Research EVALUATION
Antarctic sea ice variability and trends,
 The Cryosphere Discuss., 6, 931 96, 12 www.the-cryosphere-discuss.net/6/931/12/ doi:.194/tcd-6-931-12 Author(s) 12. CC Attribution 3.0 License. This discussion paper is/has been under review for the journal
Which graph best shows the relationship between intensity of insolation and position on the Earth's surface? A) B) C) D)
 B) C) D)") 1. The hottest climates on Earth are located near the Equator because this region A) is usually closest to the Sun B) reflects the greatest amount of insolation C) receives the most hours of daylight D)
1. The hottest climates on Earth are located near the Equator because this region A) is usually closest to the Sun B) reflects the greatest amount of insolation C) receives the most hours of daylight D)
ARCTIC SEA ICE ALBEDO VARIABILITY AND TRENDS,
 ARCTIC SEA ICE ALBEDO VARIABILITY AND TRENDS, 1982-1998 Vesa Laine Finnish Meteorological Institute (FMI), Helsinki, Finland Abstract Whole-summer and monthly sea ice regional albedo averages, variations
CLIMATE SIMULATIONS AND PROJECTIONS OVER RUSSIA AND THE ADJACENT SEAS: а CMIP5 Update
 CLIMATE SIMULATIONS AND PROJECTIONS OVER RUSSIA AND THE ADJACENT SEAS: а CMIP5 Update Tatiana Pavlova and Vladimir Kattsov Voeikov Main Geophysical Observatory, St. Petersburg, Russia Workshop on Global
Detection, tracking and study of polar lows from satellites Leonid P. Bobylev
 Detection, tracking and study of polar lows from satellites Leonid P. Bobylev Nansen Centre, St. Petersburg, Russia Nansen Centre, Bergen, Norway Polar lows and their general characteristics International
Observational Needs for Polar Atmospheric Science
 Observational Needs for Polar Atmospheric Science John J. Cassano University of Colorado with contributions from: Ed Eloranta, Matthew Lazzara, Julien Nicolas, Ola Persson, Matthew Shupe, and Von Walden
OSI SAF Sea Ice Products
 OSI SAF Sea Ice Products Steinar Eastwood, Matilde Jensen, Thomas Lavergne, Gorm Dybkjær, Signe Aaboe, Rasmus Tonboe, Atle Sørensen, Jacob Høyer, Lars-Anders Breivik, RolfHelge Pfeiffer, Mari Anne Killie
Assimilation of Snow and Ice Data (Incomplete list)
") Assimilation of Snow and Ice Data (Incomplete list) Snow/ice Sea ice motion (sat): experimental, climate model Sea ice extent (sat): operational, U.S. Navy PIPs model; Canada; others? Sea ice concentration
Assimilation of Snow and Ice Data (Incomplete list) Snow/ice Sea ice motion (sat): experimental, climate model Sea ice extent (sat): operational, U.S. Navy PIPs model; Canada; others? Sea ice concentration
Geography Long Term Plan. Autumn Spring Summer
 Geography Long Term Plan Autumn Spring Summer Year 1 Working Scientifically covered throughout the year Location Geography of UK Name, locate and identify characteristics of the four countries and capital
Global Temperature Report: December 2018
 Jan 2, 2019 Vol. 28, No. 9 For Additional Information: Dr. John Christy, (256) 961-7763 christy@nsstc.uah.edu Dr. Roy Spencer, (256) 961-7960 spencer@nsstc.uah.edu Global Temperature Report: December 2018
Antarctic Cloud Radiative Forcing at the Surface Estimated from the AVHRR Polar Pathfinder and ISCCP D1 Datasets,
 JUNE 2003 PAVOLONIS AND KEY 827 Antarctic Cloud Radiative Forcing at the Surface Estimated from the AVHRR Polar Pathfinder and ISCCP D1 Datasets, 1985 93 MICHAEL J. PAVOLONIS Cooperative Institute for
QUALITY INFORMATION DOCUMENT For Arctic Ice Extent Indicator. ARC_SEAICE_INDEX_002
 QUALITY INFORMATION DOCUMENT For Arctic Ice Extent Indicator. Issue: 1.2 Contributors: Steinar Eastwood, Lars-Anders Breivik, Bruce Hackett, Thomas Lavergne, Gorm Dybkjær, Cecilie Wettre Approval Date
Sea Ice Concentration Climate Data Record Validation Report
 Sea Ice Concentration Climate Data Record Validation Report OSI-450 Version : 1.0 Date : 10/05/2017 Matilde Brandt Kreiner, John Lavelle, Rasmus Tonboe, Eva Howe Danish Meteorological Institute Thomas
Interannual and regional variability of Southern Ocean snow on sea ice
 Annals of Glaciology 44 2006 53 Interannual and regional variability of Southern Ocean snow on sea ice Thorsten MARKUS, Donald J. CAVALIERI Hydrospheric and Biospheric Sciences Laboratory, NASA Goddard
SEA ICE OUTLOOK 2016 Report
 SEA ICE OUTLOOK 2016 Report Template with Core Requirements for Pan-Arctic Contributions and Guidelines for Submitting Optional Alaskan Regional Outlook, Figures, and Gridded Data Submission Guidelines:
Exemplar for Internal Achievement Standard. Mathematics and Statistics Level 3
 Exemplar for internal assessment resource Mathematics and Statistics for Achievement Standard 91580 Exemplar for Internal Achievement Standard Mathematics and Statistics Level 3 This exemplar supports
Sea Ice Extension and Concentration from SAC-D MWR Data
 Sea Ice Extension and Concentration from SAC-D MWR Data Project N 24/10 Federico Carballo 1, Sergio Masuelli 2, Héctor Salgado 1, Martín Labanda 2 and Sandra Barreira 1 1 Servicio de Hidrografía Naval,
World Geography Chapter 3
 World Geography Chapter 3 Section 1 A. Introduction a. Weather b. Climate c. Both weather and climate are influenced by i. direct sunlight. ii. iii. iv. the features of the earth s surface. B. The Greenhouse
EVALUATION OF WINDSAT SURFACE WIND DATA AND ITS IMPACT ON OCEAN SURFACE WIND ANALYSES AND NUMERICAL WEATHER PREDICTION
 5.8 EVALUATION OF WINDSAT SURFACE WIND DATA AND ITS IMPACT ON OCEAN SURFACE WIND ANALYSES AND NUMERICAL WEATHER PREDICTION Robert Atlas* NOAA/Atlantic Oceanographic and Meteorological Laboratory, Miami,
F O U N D A T I O N A L C O U R S E
 F O U N D A T I O N A L C O U R S E December 6, 2018 Satellite Foundational Course for JPSS (SatFC-J) F O U N D A T I O N A L C O U R S E Introduction to Microwave Remote Sensing (with a focus on passive
TEACHER VERSION: Suggested student responses are included. Seasonal Cycles: the North Atlantic Phytoplankton Bloom
 Name: Date: Guiding Question: TEACHER VERSION: Suggested student responses are included. Seasonal Cycles: the North Atlantic Phytoplankton Bloom What are the factors that control the patterns/cycles of
GLOBAL/CONTINENTAL LAND COVER MAPPING AND MONITORING
 GLOBAL/CONTINENTAL LAND COVER MAPPING AND MONITORING Ryutaro Tateishi, Cheng Gang Wen, and Jong-Geol Park Center for Environmental Remote Sensing (CEReS), Chiba University 1-33 Yayoi-cho Inage-ku Chiba
P2.21 Sea Ice Data Derived from Microwave Radiometer for Climate Monitoring
 P2.21 Sea Ice Data Derived from Microwave Radiometer for Climate Monitoring Takanori Matsumoto Climate Prediction Division, Japan Meteorological Agency Masayoshi Ishii Frontier Research Center for Global
ICEBERGS IN THE BARENTS SEA
 ICEBERGS IN THE BARENTS SEA Mapping ice and snow conditions in the Barents Sea, part-report 1 Icebergs Leif J Dalsgaard, Petroleum Safety Authority Norway Tore Syversen, Sintef Mars Goals Achieve better
!"#$%&'()**+###, -###./*00"/*0.)**+ 1)**+### -,2 34,52 3,2
**+###, -###./*00/*0.)**+ 1)**+### -,2 34,52 3,2") !"#$%&'()**+###, -###./*00"/*0.)**+ 1)**+### -,2 34,52 3,2 325,3,2,552### Operational Sea Ice Remote Sensing with AMSR-E 89 GHz Channels Gunnar Spreen Centre of Marine and Atmospheric Sciences University
!"#$%&'()**+###, -###./*00"/*0.)**+ 1)**+### -,2 34,52 3,2 325,3,2,552### Operational Sea Ice Remote Sensing with AMSR-E 89 GHz Channels Gunnar Spreen Centre of Marine and Atmospheric Sciences University
State of Passive Microwave Polar Stereographic Products. Walt Meier and polar stereographic product team
 State of Passive Microwave Polar Stereographic Products Walt Meier and polar stereographic product team State of PM PS datasets NRT Tb and sea ice running nominally after many issues (see subsequent slides)
Improving passive microwave sea ice concentration algorithms for coastal areas: applications to the Baltic Sea
 PUBLISHED BY THE INTERNATIONAL METEOROLOGICAL INSTITUTE IN STOCKHOLM SERIES A DYNAMIC METEOROLOGY AND OCEANOGRAPHY Tellus (2010), 62A, 393 410 Printed in Singapore. All rights reserved C 2010 The Authors
Sea Ice Advisories for Indian Research & Supply Vessels
 Sea Ice Advisories for Indian Research & Supply Vessels D. Ram Rajak, R. K. Kamaljit Singh, Jayaprasad P., Sandip R. Oza, M. Javed Beg* Space Applications Centre, ISRO, Ahmedabad, India. *National Centre
Measured Ozone Depletion
 Measured Ozone Depletion Global Ozone After carefully accounting for all of the known natural variations, a net decrease of about 3% per decade for the period 1978-1991 was found. This is a global average
S3-A Land and Sea Ice Cyclic Performance Report. Cycle No Start date: 30/09/2017. End date: 27/10/2017
 PREPARATION AND OPERATIONS OF THE MISSION PERFORMANCE CENTRE (MPC) FOR THE COPERNICUS SENTINEL-3 MISSION Start date: 30/09/2017 End date: 27/10/2017 Ref. S3MPC.UCL.PR.08-023 Contract: 4000111836/14/I-LG
Some NOAA Products that Address PSTG Satellite Observing Requirements. Jeff Key NOAA/NESDIS Madison, Wisconsin USA
 Some NOAA Products that Address PSTG Satellite Observing Requirements Jeff Key NOAA/NESDIS Madison, Wisconsin USA WMO Polar Space Task Group, 4 th meeting, Greenbelt, 30 September 2014 Relevant Missions
Tuition, Medical and Behaviour Support Service
 Tuition, Medical and Behaviour Support Service Curriculum Policy - Primary Geography Reviewed: October 2018 Next Review: October 2019 Responsibility: Andrea Snow AIMS AND PRINCIPLES The national curriculum
The ECMWF coupled data assimilation system
 The ECMWF coupled data assimilation system Patrick Laloyaux Acknowledgments: Magdalena Balmaseda, Kristian Mogensen, Peter Janssen, Dick Dee August 21, 214 Patrick Laloyaux (ECMWF) CERA August 21, 214
The Meteorological Observatory from Neumayer Gert König-Langlo, Bernd Loose Alfred-Wegener-Institut, Bremerhaven, Germany
 The Meteorological Observatory from Neumayer Gert König-Langlo, Bernd Loose Alfred-Wegener-Institut, Bremerhaven, Germany History of Neumayer In March 1981, the Georg von Neumayer Station (70 37 S, 8 22
Long-term global time series of MODIS and VIIRS SSTs
 Long-term global time series of MODIS and VIIRS SSTs Peter J. Minnett, Katherine Kilpatrick, Guillermo Podestá, Yang Liu, Elizabeth Williams, Susan Walsh, Goshka Szczodrak, and Miguel Angel Izaguirre Ocean
Global Warming and Changes in. Sea Ice in the Greenland Sea:
 Global Warming and Changes in : 1979-2007 Maxine von Eye 1 DAMTP, CMS University of Cambridge Wilberforce Rd Cambridge CB3 0WA, UK M.J.E.v.Eye@damtp.cam.ac.uk, +44 (0)1223 760 398 Alexander von Eye 316
Complete Geography Overview: Year 1 to Year 6
 Option 1 Complete Geography Overview: Year 1 to Year 6 Autumn Term Spring Term Summer Term Year 1 Where do I live? Around the World The Four Seasons Year 2 At the Farm Let s go on Safari My World and Me
Toward a better modeling of surface emissivity to improve AMSU data assimilation over Antarctica GUEDJ Stephanie, KARBOU Fatima and RABIER Florence
 Toward a better modeling of surface emissivity to improve AMSU data assimilation over Antarctica GUEDJ Stephanie, KARBOU Fatima and RABIER Florence International TOVS Study Conference, Monterey, California
VALIDATION OF INSAT-3D DERIVED RAINFALL. (Submitted by Suman Goyal, IMD) Summary and Purpose of Document
 Summary and Purpose of Document") WORLD METEOROLOGICAL ORGANIZATION COMMISSION FOR BASIC SYSTEMS OPEN PROGRAMME AREA GROUP ON INTEGRATED OBSERVING SYSTEMS INTER-PROGRAMME EXPERT TEAM ON SATELLITE UTILIZATION AND PRODUCTS SECOND SESSION
WORLD METEOROLOGICAL ORGANIZATION COMMISSION FOR BASIC SYSTEMS OPEN PROGRAMME AREA GROUP ON INTEGRATED OBSERVING SYSTEMS INTER-PROGRAMME EXPERT TEAM ON SATELLITE UTILIZATION AND PRODUCTS SECOND SESSION
S3-A Land and Sea Ice Cyclic Performance Report. Cycle No Start date: 21/04/2017. End date: 18/05/2017
 PREPARATION AND OPERATIONS OF THE MISSION PERFORMANCE CENTRE (MPC) FOR THE COPERNICUS SENTINEL-3 MISSION Cycle No. 017 Start date: 21/04/2017 End date: 18/05/2017 Ref. S3MPC.UCL.PR.08-017 Contract: 4000111836/14/I-LG
P4.4 THE COMBINATION OF A PASSIVE MICROWAVE BASED SATELLITE RAINFALL ESTIMATION ALGORITHM WITH AN IR BASED ALGORITHM
 P4.4 THE COMBINATION OF A PASSIVE MICROWAVE BASED SATELLITE RAINFALL ESTIMATION ALGORITHM WITH AN IR BASED ALGORITHM Robert Joyce 1), John E. Janowiak 2), and Phillip A. Arkin 3, Pingping Xie 2) 1) RS
Multiple satellite observations of cloud cover in extratropical cyclones
 JOURNAL OF GEOPHYSICAL RESEARCH: ATMOSPHERES, VOL. 118, 9982 9996, doi:1.12/jgrd.5718, 213 Multiple satellite observations of cloud cover in extratropical cyclones Catherine M. Naud, 1 James F. Booth,
Moisture transport to Syowa Station and Dome Fuji Station, Antarctica
 Session 5: Science Using Ground-Based and Satellite Measurements Moisture transport to Syowa Station and Dome Fuji Station, Antarctica Kazue Suzuki, Takashi Yamanouchi, Naohiko Hirasawa and Hideaki Motoyama
Estimation of snow surface temperature for NW Himalayan regions using passive microwave satellite data
 Indian Journal of Radio & Space Physics Vol 42, February 2013, pp 27-33 Estimation of snow surface temperature for NW Himalayan regions using passive microwave satellite data K K Singh 1,$,*, V D Mishra
Orbit Design Marcelo Suárez. 6th Science Meeting; Seattle, WA, USA July 2010
 Orbit Design Marcelo Suárez Orbit Design Requirements The following Science Requirements provided drivers for Orbit Design: Global Coverage: the entire extent (100%) of the ice-free ocean surface to at
Earth Science Seasons Test Name Per Date
 Name Per Date Page 1 1. The diagram below represents four positions of the Earth as it revolves around the Sun. 5. Base your answer to the following question on the diagram below, which shows the apparent
Monitoring the frozen duration of Qinghai Lake using satellite passive microwave remote sensing low frequency data
 Chinese Science Bulletin 009 SCIENCE IN CHINA PRESS ARTICLES Springer Monitoring the frozen duration of Qinghai Lake using satellite passive microwave remote sensing low frequency data CHE Tao, LI Xin
Comparison of Results Between the Miniature FASat-Bravo Ozone Mapping Detector (OMAD) and NASA s Total Ozone Mapping Spectrometer (TOMS)
 and NASA s Total Ozone Mapping Spectrometer (TOMS)") Comparison of Results Between the Miniature FASat-Bravo Ozone Mapping Detector (OMAD) and NASA s Total Ozone Mapping Spectrometer (TOMS) Juan A. Fernandez-Saldivar, Craig I. Underwood Surrey Space Centre,
Comparison of Results Between the Miniature FASat-Bravo Ozone Mapping Detector (OMAD) and NASA s Total Ozone Mapping Spectrometer (TOMS) Juan A. Fernandez-Saldivar, Craig I. Underwood Surrey Space Centre,