Dropping Ice Shelves onto an Ocean Model and Moving Grounding Lines. Robert Hallberg NOAA / GFDL
|
|
|
- Roland McCoy
- 5 years ago
- Views:
Transcription
1 Dropping Ice Shelves onto an Ocean Model and Moving Grounding Lines Robert Hallberg NOAA / GFDL
 Ocean heat storage (steric rise) (13 to 32 cm in IPCC AR4) Land ice (except ice sheets) (4 to 19 cm in IPCC AR4) Ice sheet surface mass balance (-10 to 4 cm in IPCC AR4) Dams & land water ±3")
 Reservoir sizes in Sea Level Rise equivalent: Mountain glaciers & ice caps 0.3 m Greenland Ice Sheet 7.3 m West Antarctic Ice Sheet (marine) 5 m East Antarctic Ice Sheet (land) 51.")
2 Projected Global Mean Sea Level Rise Sources of uncertainty in 2100 global mean sea level projections: Forcing scenario (~20 cm range at 2100 for GFDL-CM2.1) Ocean heat storage (steric rise) (13 to 32 cm in IPCC AR4) Land ice (except ice sheets) (4 to 19 cm in IPCC AR4) Ice sheet surface mass balance (-10 to 4 cm in IPCC AR4) Dams & land water ±3 cm/century? (Lettenmaier & Milly, Nature Geo. 2009) Antarctic & Greenland Ice sheet dynamics changes? Plausible range 20 to 110 cm by 2100 (Pfeffer et al., Science 2008) Reservoir sizes in Sea Level Rise equivalent: Mountain glaciers & ice caps 0.3 m Greenland Ice Sheet 7.3 m West Antarctic Ice Sheet (marine) 5 m East Antarctic Ice Sheet (land) 51.6 m (Uniform warming of ocean ~0.5 m C -1 ) Plausible 1 m ice-sheet dynamics contribution to sea level rise
3 What is needed to model ice-sheet dynamics contributions to global mean sea level rise? 1. Ice sheet dynamics model, including the ability to simulate the rapidly flowing ice streams. 3. Ice shelf model, including calving of ice-bergs and collapse. 4. Model of the ocean circulation in the ice-shelf cavity. Bamber et al., Science 2000; C. Rapley, British Antarctic Survey 5. Parameterizations or resolution of the eddy- and tidal- delivery of warm ocean water to the ice shelf cavity. Ice Shelf melts Cold-fresh Warm-salty Ocean-weather heat transport
4 Ocean ice-shelf interaction and sea-level rise. Surface melting of ice sheets is thought unlikely to contribute significant sea level rise. Ice shelves buttress most ice streams; in cases where these shelves disintegrated, the ice streams have accelerated. The grounding line determines where the ice starts to float; its location is set by a balance between ice flow and ocean heat flux driven melting. Bamber et al., Science 2000; C. Rapley, British Antarctic Survey Parameterizations or resolution of the eddy- and tidal- delivery of warm ocean water to the ice shelf cavity may be critical for predicting how shelves evolve. Little et al., 2009

5 Studies of the effects of ocean dynamics on ice-shelf melting We are actively working to put ice shelves into GOLD-based coupled models. Seafloor slopes up to north Flat seafloor Seafloor slopes down to north Studies to date have not used split time-stepping. Goldberg, Little, & Sergienko - Melting shapes the shelf-bottom, the shelfbottom guides the flow and localizes melting. Shelf-structures emerge spontaneously. Little, Gnanadesikan and Hallberg, melt in large ice shelves concentrated in southeastregardless of bottom slope. Little, Gnanadesikan and Oppenheimer, melt rate (contours) strongly controlled by ice shelf bottom.

6 Ice shelves - where water meets ice Ice shelves provide buttressing to ice sheets. Several shelves Antarctica have collapsed. Seafloor slopes up to north Flat seafloor Seafloor slopes down to north The resulting acceleration of flow into the ocean is significant! Little, Gnanadesikan and Hallberg, melt in large ice shelves concentrated in southeast- regardless of bottom slope. Key question: what determines distribution/rate of ice shelf melt? We are actively working to put ice shelves in GFDL s coupled models. Little, Gnanadesikan and Oppenheimer, melt rate (contours) strongly controlled by ice shelf bottom. Further work (w. Goldberg/Sergienko) indicating that the melting also shapes the bottom!
7 Baroclinic-barotropic split time stepping suitable for use with ice shelf cavities Transports used as input and output to the barotropic solver. The continuity solver is inverted to determine velocities. Barotropic accelerations are treated as anomalies from the baroclinic state. Bottom and surface drag laws are treated implicitly. The barotropic continuity solver uses flow-dependent thicknesses which approximate the sum of the layer thickness transports.
8 Baroclinic Velocities and Thicknesses Baroclinic Velocities and Thicknesses Marginal Continuity Thickness Marginal Continuity Thickness Barotropic Transport Barotropic Velocity Barotropic Transport Barotropic Velocity

9 An Ice Shelf Test Case Ice shelf is released from an average of ~0.72 m above its resting position, generating a tsunami. This tests the circulation response to impeding gravity waves.
10
11 So what s wrong with this? Ice shelves move with the tides, but do not exhibit breaking gravity waves! The short-term pressure at the bottom of an ice shelf is far from hydrostatic. Ice is rigid. Ice shelves resist bending. Ice is very viscous (viscosity ~ m 2 s -1 ) In the ice Approximate the surface pressure by or

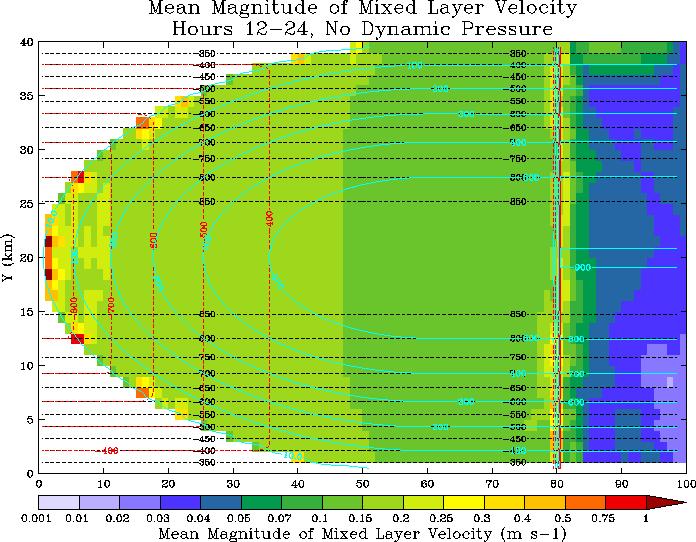
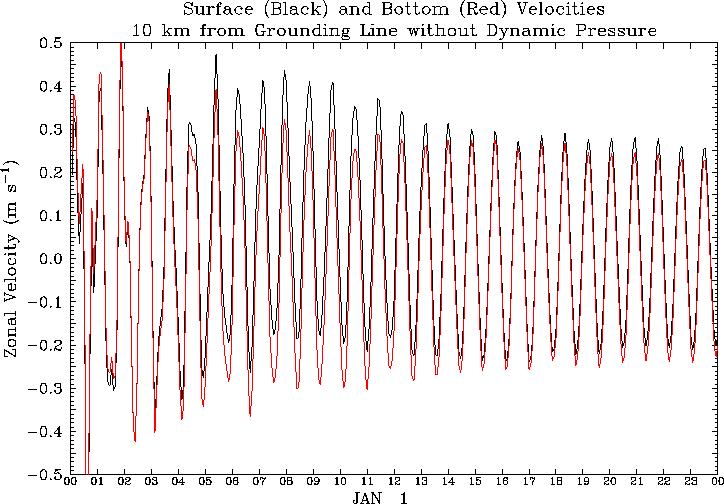
12 Impacts of Ice Shelf Dynamic Pressure Shelf Cavity Near Grounding Line Open Ocean Zonal Mixed Layer Velocity Surface Height Anomalies
13


14 Mean Magnitude of Velocity ( Melt Rate)
15 Driving an Ice Shelf Forward at 3 km /day
R. Hallberg, A. Adcroft, J. P. Dunne, J. P. Krasting and R. J. Stouffer NOAA/GFDL & Princeton University
 Sensitivity of 21st Century Steric Sea Level Rise to Ocean Model Formulation R. Hallberg, A. Adcroft, J. P. Dunne, J. P. Krasting and R. J. Stouffer NOAA/GFDL & Princeton University Hallberg, R., A. Adcroft,
NASA Images of Antarctica and the Arctic covered in both land and sea ice
 ICE SHELVES ACTIVITY 1: DECODING THE ROLE OF ANTARCTIC ICE IN GLOBAL CLIMATE Ice Shelves play a critical role in Antarctica, serving as a buffer between the ocean and the continental ice sheet covering
Projection of global and regional sea level change for the 21st century
 Projection of global and regional sea level change for the 21st century Jonathan Gregory 1,2 1 NCAS-Climate, University of Reading 2 Met Office Hadley Centre, Exeter Global mean sea level rise observed
Sea level projections with semiempirical and earth system models
 Sea level projections with semiempirical and earth system models John C. Moore College of Global Change and Earth System Science, Beijing Normal University, Beijing, China and Arctic Centre, University
Future sea level rise through 2100 and beyond
 Future sea level rise through 2100 and beyond Emma Stone Uncertain World Summit (Tuesday 20 October 2015) 1 Why are we interested in future sea level rise? How certain are we about the worst case scenario
Effect of Ocean Warming on West Antarctic Ice Streams and Ice Shelves. Bryan Riel December 4, 2008
 Effect of Ocean Warming on West Antarctic Ice Streams and Ice Shelves Bryan Riel December 4, 2008 Ice Sheet Mass Balance/WAIS Dynamics -Mass Balance = (Ice/Snow Accumulation) (Surface melting, ice outflux,
Oceans and Climate. Caroline Katsman. KNMI Global Climate Division
 Oceans and Climate Caroline Katsman KNMI Global Climate Division Aimée Slangen, Roderik van de Wal (IMAU, Utrecht University) Sybren Drijfhout, Wilco Hazeleger (KNMI, Global Climate) Bert Vermeersen (NIOZ/Delft
Ice Sheet Modeling and Sea Level Rise. William Lipscomb, NCAR CESM Sea Level Session 10 January 2018
 Ice Sheet Modeling and Sea Level Rise William Lipscomb, NCAR CESM Sea Level Session 10 January 2018 Ice sheets in IPCC AR4 The IPCC Fourth Assessment Report (AR4) projected 0.18 to 0.59 m of sea level
Hydrosphere The hydrosphere includes all water on Earth.
 Hydrosphere The hydrosphere includes all water on Earth. The abundance of water on Earth is a unique feature that clearly distinguishes our "Blue Planet" from others in the solar system. Not a drop of
Today s Lecture: Land, biosphere, cryosphere (All that stuff we don t have equations for... )
") Today s Lecture: Land, biosphere, cryosphere (All that stuff we don t have equations for... ) 4 Land, biosphere, cryosphere 1. Introduction 2. Atmosphere 3. Ocean 4. Land, biosphere, cryosphere 4.1 Land
Today s Lecture: Land, biosphere, cryosphere (All that stuff we don t have equations for... ) 4 Land, biosphere, cryosphere 1. Introduction 2. Atmosphere 3. Ocean 4. Land, biosphere, cryosphere 4.1 Land
Introduction to Global Warming
 Introduction to Global Warming Cryosphere (including sea level) and its modelling Ralf GREVE Institute of Low Temperature Science Hokkaido University Sapporo, 2010.09.14 http://wwwice.lowtem.hokudai.ac.jp/~greve/
Ice shelves in a warming world: The Filchner-Ronne Ice Shelf system
 Ice shelves in a warming world: The Filchner-Ronne Ice Shelf system Svein Østerhus Oceanographer uni research climate NARE prosjekt: Long-term observing system for the oceanic regime of Filchner-Ronne
Sea-level change: A scientific and societal challenge for the 21 st century John Church International GNSS Service Workshop, Sydney, Feb 11, 2016
 Sea-level change: A scientific and societal challenge for the 21 st century John Church International GNSS Service Workshop, Sydney, Feb 11, 2016 OCEANS AND ATMOSPHERE NATIONAL RESEARCH FLAGSHIP Our coastal
Northern European Sea Level Rise. Aslak Grinsted Centre for Ice and Climate Niels Bohr Institute University of Copenhagen
 Northern European Sea Level Rise Aslak Grinsted Centre for Ice and Climate Niels Bohr Institute University of Copenhagen Global Sea Level Rise The world is warming and this causes sea level to rise because:
Where is Earth s Water?
 PASSAGE 1 Where is Earth s Water? Our planet contains a limited amount of water that is always in motion. The water that comes out of your faucet moved through the atmosphere, flowed across Earth s surface,
ATOC OUR CHANGING ENVIRONMENT Class 19 (Chp 6) Objectives of Today s Class: The Cryosphere [1] Components, time scales; [2] Seasonal snow
![ATOC OUR CHANGING ENVIRONMENT Class 19 (Chp 6) Objectives of Today s Class: The Cryosphere [1] Components, time scales; [2] Seasonal snow](/thumbs/95/126309683.jpg "ATOC OUR CHANGING ENVIRONMENT Class 19 (Chp 6) Objectives of Today s Class: The Cryosphere [1] Components, time scales; [2] Seasonal snow") ATOC 1060-002 OUR CHANGING ENVIRONMENT Class 19 (Chp 6) Objectives of Today s Class: The Cryosphere [1] Components, time scales; [2] Seasonal snow cover, permafrost, river and lake ice, ; [3]Glaciers and
ATOC 1060-002 OUR CHANGING ENVIRONMENT Class 19 (Chp 6) Objectives of Today s Class: The Cryosphere [1] Components, time scales; [2] Seasonal snow cover, permafrost, river and lake ice, ; [3]Glaciers and
SUPPLEMENTARY INFORMATION
 SUPPLEMENTARY INFORMATION DOI: 10.1038/NGEO1189 Different magnitudes of projected subsurface ocean warming around Greenland and Antarctica Jianjun Yin 1*, Jonathan T. Overpeck 1, Stephen M. Griffies 2,
Ice Sheets and Climate Change. William H. Lipscomb Los Alamos National Laboratory
 Ice Sheets and Climate Change William H. Lipscomb Los Alamos National Laboratory What is an expert? An expert is somebody who is more than 50 miles from home, has no responsibility for implementing the
How Will Melting Ice Sheets Affect Us?
 PASSAGE 4 How Will Melting Ice Sheets Affect Us? Variation is normal. During the last ice age, for example, ice sheets also covered much of North America and Scandinavia. Why is what s happening now different
Current Climate Science and Climate Scenarios for Florida
 Current Climate Science and Climate Scenarios for Florida Daniel Bader and Vivien Gornitz Water Utilities and Climate Change Workshop Palm Beach County Water Utilities/ Water Research Foundation June 10,
Projecting regional sea-level changes for the 21 st century
 Projecting regional sea-level changes for the 21 st century Aimée Slangen In collaboration with Mark Carson (CEN Hamburg), Caroline Katsman (KNMI), Roderik van de Wal (IMAU), Armin Köhl (CEN Hamburg),
The impact of shelf-break currents on marginal sea overflows
 The impact of shelf-break currents on marginal sea overflows Shin Kida ( 木田新一郎 ) JAMSTEC Thanks to Keiko Takahashi (JAMSTEC) Kiyoshi Tanaka (ORI) Past studies on Overflows Open Ocean Marginal Seas Entrainment
Greenland and Antarctic ice sheets under 1.5 C global warming
 Greenland and Antarctic ice sheets under 1.5 C global warming Frank Pattyn, Catherine Ritz, Edward Hanna, Xylar Asay-Davis, Rob DeConto, Gaël Durand, Lionel Favier, Xavier Fettweis, Heiko Goelzer, Nicholas
Ice Sheets and Sea Level -- Concerns at the Coast (Teachers Guide)
") Ice Sheets and Sea Level -- Concerns at the Coast (Teachers Guide) Roughly 153 million Americans (~53% of the US population) live in coastal counties. World wide some 3 billion people live within 200 km
Ice Sheets and Sea Level -- Concerns at the Coast (Teachers Guide) Roughly 153 million Americans (~53% of the US population) live in coastal counties. World wide some 3 billion people live within 200 km
Effect of Ocean Warming on West Antarctic Ice Streams and Ice Shelves
 Effect of Ocean Warming on West Antarctic Ice Streams and Ice Shelves By Bryan Riel GEO 387H Physical Climatology Dr. Zong-Liang Yang November 18, 2008 Abstract The Intergovernmental Panel on Climate Change
Projecting regional sea-level changes for the 21 st century
 Projecting regional sea-level changes for the 21 st century Aimée Slangen Postdoctoral research fellow In collaboration with: Mark Carson (CEN Hamburg), Caroline Katsman (KNMI), Roderik van de Wal (IMAU),
Sea Level. John Church WCRP Antarctic Climate and Ecosystems CRC Centre for Australian Weather and Climate Research
 Sea Level John Church WCRP Antarctic Climate and Ecosystems CRC Centre for Australian Weather and Climate Research Sea level rose by more than 120 m since the last glacial maximum 2 Church et al., 2008
Global Warming and Changing Sea Level. Name: Part 1: Am I part of the problem?!
 Part 1: Am I part of the problem?! Name: The consumption of energy in the form of fossil fuel combustion is the largest single contributor to anthropogenic greenhouse gas emissions in the U.S. and the
Climate Change: Impacts, Solutions, and Perceptions (part 2) OLLI, Spring 2013
 OLLI, Spring 2013") Climate Change: Impacts, Solutions, and Perceptions (part 2) OLLI, Spring 2013 Climate Change: Impacts, Solutions, and Perceptions Spring 2013 (part 2) February 19 Ocean acidification and the increase
Climate Change: Impacts, Solutions, and Perceptions (part 2) OLLI, Spring 2013 Climate Change: Impacts, Solutions, and Perceptions Spring 2013 (part 2) February 19 Ocean acidification and the increase
"Ice Sheets and Sea Level Rise: How Should IPCC Handle Deep Uncertainty?" Michael Oppenheimer For Inside the IPCC Princeton University 1 April 2008
 "Ice Sheets and Sea Level Rise: How Should IPCC Handle Deep Uncertainty?" Michael Oppenheimer For Inside the IPCC Princeton University 1 April 2008 This Talk is about: IPCCs (controversial) assessment
The Wedge, Grease and Heat: Why Ice Sheets Hate Water
 The Wedge, Grease and Heat: Why Ice Sheets Hate Water Dr. Robert Bindschadler Chief Scientist Laboratory for Hydrospheric and Biospheric Sciences NASA Goddard Space Flight Center Robert.A.Bindschadler@nasa.gov
The State of the cryosphere
 The State of the cryosphere Course outline Introduction The cryosphere; what is it? The Earth; a unique planet Cryospheric components Classifications Lecture outlines The State of the cryosphere The State
Oceanography Short Study Guide
 Class: Date: Oceanography Short Study Guide Multiple Choice Identify the letter of the choice that best completes the statement or answers the question. 1. Which of the following was the first expedition
Summary for the Greenland ice sheet
 Contribution of Greenland and Antarctica to future sea level change Catherine Ritz, Gaël Durand, Fabien Gillet-Chaulet, Olivier Gagliardini, Vincent Peyaud EDGe team, LGGE, CNRS/UJF Grenoble, France Ice
UNSTOPPABLE COLLAPSE OF THE WEST ANTARCTIC ICE SHEET IS NOT HAPPENING
 UNSTOPPABLE COLLAPSE OF THE WEST ANTARCTIC ICE SHEET IS NOT HAPPENING Dr. Don J. Easterbrook, Western Washington University, Bellingham, WA May 19, 2014 A New York Times headline reads Scientists Warn
Sea level change recent past, present, future
 Sea level change recent past, present, future Anny Cazenave LEGOS-CNES Toulouse, France CCI_Colocation meeting, ESA/ESRIN Global mean sea level rise during the 20 th century (red : tide gauges; blue :
Frank PATTYN Laboratoire de Glaciologie Université Libre de Bruxelles Belgium
 Frank PATTYN Laboratoire de Glaciologie Université Libre de Bruxelles Belgium 200 x 10 6 people living in coastal floodplains IPCC, 2007 2 x 10 6 km 2 and 10 12 US$ worth of assets lying
The surface of the ocean floor is as varied as the land. The five major oceans, from largest to smallest, are
 11.1 Ocean Basins The surface of the ocean floor is as varied as the land. The five major oceans, from largest to smallest, are w the Pacific w the Atlantic w the Indian w the Southern w the Arctic The
Ocean Ice Interactions: A
 Ocean Ice Interactions: A Cryospheric Perspective Tony Payne a.j.payne@bristol.ac.uk Steph Cornford, Rupert Gladstone and Dan Martin (LLNL) KISS short course Sept. 2013 Slide number 1/37 Outline Evidence
Modeled and observed fast flow in the Greenland ice sheet
 Modeled and observed fast flow in the Greenland ice sheet Ed Bueler 1 Constantine Khroulev 1 Andy Aschwanden 2 Ian Joughin 3 1 Dept of Mathematics and Statistics, University of Alaska Fairbanks 2 Arctic
The Ocean Floor THE VAST WORLD OCEAN
 OCEANOGRAPHY Name Color all water LIGHT BLUE. Color all land LIGHT GREEN. Label the 5 Oceans: Pacific, Atlantic, Indian, Arctic, Antarctic. Label the 7 Continents: N.America, S.America, Europe, Asia, Africa,
Deep Ocean Circulation & implications for Earth s climate
 Deep Ocean Circulation & implications for Earth s climate I. Ocean Layers and circulation types 1) Ocean Layers Ocean is strongly Stratified Consists of distinct LAYERS controlled by density takes huge
Coastal Antarctic polynyas: A coupled process requiring high model resolution in the ocean and atmosphere
 Coastal Antarctic polynyas: A coupled process requiring high model resolution in the ocean and atmosphere Mike Dinniman and John Klinck Center for Coastal Physical Oceanography Old Dominion University
Thwaites and Pine Island Glaciers of Antarctica and the Prospect of Rapid Sea Level Rise
 Thwaites and Pine Island Glaciers of Antarctica and the Prospect of Rapid Sea Level Rise Thomas Mortlock and Paul Somerville, Risk Frontiers The Thwaites and Pine Island glaciers in Antarctica are flowing
Earth Science and Climate Change
 Earth Science and Climate Change Dr. Mary L. Cleave February 7, 2007 YOU ARE HERE 3 Land Use Changes Over Time Lingering Doubts on Temperature Trends Have Been Resolved 1st CCSP Synthesis & Assessment
Antarctica & Greenland, Theory & Observations
 Ocean-Ice Interactions: Antarctica & Greenland, Theory & Observations Keck Institute for Space Studies September 9, 2013 David HOLLAND New York University + Abu Dhabi 0 Overview: Ocean-Ice Interface Delivery
Decay of the Greenland Ice Sheet due to surface-meltwater-induced acceleration of basal sliding
 Decay of the Greenland Ice Sheet due to surface-meltwater-induced acceleration of basal sliding arxiv:0905.07v [physics.geo-ph] May 009 Ralf Greve Shin Sugiyama Institute of Low Temperature Science, Hokkaido
POLAR EXPLORER EXPLORING SEA LEVEL RISE
 POLAR EXPLORER EXPLORING SEA i LEVEL RISE Developed by: Margie Turrin, mkt@ldeo.columbia.edu As a polar explorer you and your team will be collec@ng evidence of changes occurring throughout the world that
Lesson 2. Antarctic Oceanography: Component I - Ice/Glaciers Component II - Marine Snow
 Lesson 2. Antarctic Oceanography: Component I - Ice/Glaciers Component II - Marine Snow Lesson Objectives: Introduces students to the different kinds of ice found in Antarctica, Students will become familiar
Evidence of Current Climate Change in the Polar Regions
 Evidence of Current Climate Change in the Polar Regions Dr. Mary Albert Cold Regions Research and Engineering Laboratory Thayer School of Engineering, Dartmouth College Hanover, NH Overview How do we detect
Exploring The Polar Connection to Sea Level Rise NGSS Disciplinary Core Ideas Science & Engineering Crosscutting Concepts
 Exploring The Polar Connection to Sea Level Rise NGSS Disciplinary Core Ideas Science & Engineering Crosscutting Concepts Practices MS - ESS: Earth & Space Science 1. Ask questions 2. Developing and using
ICE is less dense than water about 92% of the density of water; it floats. This is unlike the behavior of most substances, which generally are denser
 ICE is less dense than water about 92% of the density of water; it floats. This is unlike the behavior of most substances, which generally are denser as solids than as liquids (right). This is a result
Rapid Climate Change: Heinrich/Bolling- Allerod Events and the Thermohaline Circulation. By: Andy Lesage April 13, 2010 Atmos.
 Rapid Climate Change: Heinrich/Bolling- Allerod Events and the Thermohaline Circulation By: Andy Lesage April 13, 2010 Atmos. 6030 Outline Background Heinrich Event I/Bolling-Allerod Transition (Liu et
GSC 107 Lab # 3 Calculating sea level changes
 GSC 107 Lab # 3 Calculating sea level changes Student name Student ID Background Glacial-Interglacial Cycles Climate-related sea-level changes of the last century are very minor compared with the large
Guidance for Sea Level in 2100
 Guidance for Sea Level in 2100 Focus on Ice Melt - The Big Unknown Jim Houston 1 and Bob Dean 2 ¹ Director Emeritus, Army Engineer Research and Development Center, Corps of Engineers 2 Professor Emeritus,
SEA ICE AND GLOBAL WARMING
 jkjk SEA ICE AND GLOBAL WARMING Lesson plan for grades K- 3 By: Laura Sanders, Environmental Science Institute, March 2011 Length of lesson: two 30- minute class periods SOURCES AND RESOURCES: Atmospheric
Grounding line mapping in Antarctica using 15 years of DInSAR data
 Grounding line mapping in Antarctica using 15 years of DInSAR data Jérémie Mouginot 1 Eric Rignot 1,2, Bernd Scheuchl 1 1 University of California, Irvine 2 Jet Propulsion Laboratory Introduction Outline
Glaciers and climate change Jon Ove Hagen, Department of Geosciences University of Oslo
 Glaciers and climate change Jon Ove Hagen, Department of Geosciences University of Oslo joh@geo.uio.no Department of geosciences, Faculty of Mathematics and Natural Sciences Glaciers and climate change
The Dynamic Earth Section 3. Chapter 3 The Dynamic Earth Section 3: The Hydrosphere and Biosphere DAY 1
 Chapter 3 The Dynamic Earth Section 3: The Hydrosphere and Biosphere DAY 1 The Hydrosphere The hydrosphere includes all of the water on or near the Earth s surface. This includes water in the oceans, lakes,
Components of the Climate System. Lecture 2: Earth s Climate System. Pop Quiz. Sub-components Global cycles What comes in What goes out
 Lecture 2: Earth s Climate System Components of the Climate System terrestrial radiation Atmosphere Ocean solar radiation Land Energy, Water, and Biogeochemistry Cycles Sub-components Global cycles What
Sea level over glacial cycles.
 Sea level over glacial cycles. T1: 1 m/century With short periods of with rates up to 4m/century LIG Sea level higher than today (+9m) Siddall et al. 2003 Very stable sea level in human history. Image
Lecture 2: Earth s Climate System
 Lecture 2: Earth s Climate System terrestrial radiation solar radiation Atmosphere Ocean Solid Earth Land Energy, Water, and Biogeochemistry Cycles Sub-components Global cycles What comes in What goes
Surface Circulation in the North Atlantic & off of Southern California: Two Models
 Surface Circulation in the North Atlantic & off of Southern California: Two Models Objective 1. To become familiar with large scale surface circulation patterns in ocean. 2. To be able to predict current
Introduction to Atmospheric Circulation
 Introduction to Atmospheric Circulation Start rotating table Cloud Fraction Dice Results from http://eos.atmos.washington.edu/erbe/ from http://eos.atmos.washington.edu/erbe/ from http://eos.atmos.washington.edu/erbe/
Title. Author(s)Greve, Ralf. Issue Date Doc URL. Type. Note. File Information.
Greve, Ralf. Issue Date Doc URL. Type. Note. File Information.") Title Increased future sea level rise due to rapid decay o Author(s)Greve, Ralf CitationProceedings of the First International Symposium on Issue Date 008--04 Doc URL http://hdl.handle.net/5/4868 Type
Title Increased future sea level rise due to rapid decay o Author(s)Greve, Ralf CitationProceedings of the First International Symposium on Issue Date 008--04 Doc URL http://hdl.handle.net/5/4868 Type
Unit 1: Water Systems on Earth Chapter 2
 Unit 1: Water Systems on Earth Chapter 2 Create a mind map with the driving question, Why are Oceans Important? Remember: Why are oceans so important? Why are oceans so important? Primary water source
Future Climate and Sea Level
 Future Climate and Sea Level Tonight: 2 nd night on human changes and controversy around them. three night series : 1) An Inconvenient truth 2) Impacts: Observed Warming and Projected Sea Level Changes
ENIGMA: something that is mysterious, puzzling, or difficult to understand.
 Lecture 12. Attempts to solve the Eccentricity Enigma ENIGMA: something that is mysterious, puzzling, or difficult to understand. Milankovitch forcing glacier responses pre-900,000 yr BP glacier responses
Module 12: Oceanography Topic 6 Content: Oceans and Climate Change Notes
 Introduction Module 12: Oceanography With water covering a large portion of the planet, it is very important to monitor the consequences of global warming in the oceans. Click NEXT to learn about the potential
A Tutorial on Climate Change Science: The. 4 th National Climate Assessment CLIMATE SCIENCE. Don Wuebbles
 CLIMATE SCIENCE S P E C I A L R E P O R T A Tutorial on Climate Change Science: The Fourth National Climate Assessment Volume I 4 th National Climate Assessment Don Wuebbles Department of Atmospheric Sciences
Thwaites and Pine Island Glaciers of Antarctica and the Prospect of Rapid Sea Level Rise
 Thwaites and Pine Island Glaciers of Antarctica and the Prospect of Rapid Sea Level Rise Thomas Mortlock and Paul Somerville, Risk Frontiers; Tony Wong, University of Colorado at Boulder, USA, and; Alexander
What are the consequences of melting pack ice?
 The Hydrosphere s Cryosphere: A-Pack Ice: (Sea Ice) They are large sheets of ice found in the oceans around Antarctica and in the Arctic Ocean. Smaller ones are called ice floes. Example 1: What are the
GLOBAL SEA LEVEL RISE PROJECTIONS
 APPENDIX B: GLOBAL AND REGIONAL SEA LEVEL RISE: A REVIEW OF THE SCIENCE Sea level rise is increasingly being considered in coastal planning. Decision-makers require robust projections of future sea level
CLIMATE READY BOSTON. Climate Projections Consensus ADAPTED FROM THE BOSTON RESEARCH ADVISORY GROUP REPORT MAY 2016
 CLIMATE READY BOSTON Sasaki Steering Committee Meeting, March 28 nd, 2016 Climate Projections Consensus ADAPTED FROM THE BOSTON RESEARCH ADVISORY GROUP REPORT MAY 2016 WHAT S IN STORE FOR BOSTON S CLIMATE?
SUPPLEMENTARY INFORMATION
 This section includes additional information for the model parameters as well as the results of a set of sensitivity experiments to illustrate the dependence of the model behavior on different parameter
Our Climate without Antarctica
 Our Climate without Antarctica Cecilia Bitz, Hansi Singh, Dargan Frierson University of Washington Andrew Pauling, Inga Smith, & Pat Langhorne University of Otago Photo by John Weller Ice Shelf Cavity
The oceans: Sea level rise & gulf stream
 Lecture Climate Change Lesson 10 The oceans: Sea level rise & gulf stream Rene Orth rene.orth@bgc-jena.mpg.de 1 Course webpage https://www.bgc-jena.mpg.de/bgi/index.php/lectures/hydrobioclimclimatechange
Advanced Lecture: Oceanographic regime of the West Antarctic Ice Shelves
 ACDC2010: Ice Sheet - Ocean Interactions 8-19 June 2010, MIT FABLAB, Lyngen, NORWAY Advanced Lecture: Oceanographic regime of the West Antarctic Ice Shelves Adrian Jenkins British Antarctic Survey, Natural
How much are glaciers and ice sheets contributing to global sea-level rise?
 How much are glaciers and ice sheets contributing to global sea-level rise? From measurements made by the IPCC it is clear that Global sea level is rising, however the direct cause of this rise is not
( ) = 1005 J kg 1 K 1 ;
 = 1005 J kg 1 K 1 ;") Problem Set 3 1. A parcel of water is added to the ocean surface that is denser (heavier) than any of the waters in the ocean. Suppose the parcel sinks to the ocean bottom; estimate the change in temperature
Problem Set 3 1. A parcel of water is added to the ocean surface that is denser (heavier) than any of the waters in the ocean. Suppose the parcel sinks to the ocean bottom; estimate the change in temperature
XVI. Warming and the cryosphere
 XVI. Warming and the cryosphere review temperature from thermometers, satellites, glacier lengths and boreholes all show significant warming in the 20th C+ reconstruction of past temperatures from corals,
Module 7, Lesson 1 Water world
 Module 7, Lesson 1 Water world Imagine that the year is 2100. Scientists have determined that the rapidly warming climate of the earth will cause the ice sheets of Antarctica to break apart and melt at
Ice sheets of West Antarctica are warming fast. West Antarctic Ice Sheet warming twice earlier estimate
 Ice sheets of West Antarctica are warming fast 02 January 2013 Magazine issue 2898. Subscribe and save For similar stories, visit the Climate Change Topic Guide THE ice sheets of West Antarctica are warming
Resolution-dependent Eddy Parameterizations for Large-scale Ocean Models
 Resolution-dependent Eddy Parameterizations for Large-scale Ocean Models Robert Hallberg with contributions from Alistair Adcroft NOAA / GFDL and Princeton University Mercator/Tripolar Resolution Required
Section 2.1 Ocean Basins. - Has helped determine where ocean basins are located. - Tectonic plates move changing the position of the continents.
 Science 8 Unit 1: Water Systems on Earth Chapter 2: Oceans Control the Water Cycle Section 2.1 Ocean Basins Oceans are important because: 1. Primary water source for the water cycle 2. Control weather
BELISSIMA: BELgian Ice Sheet- Shelf Ice Measurements in Antarctica
 BELISSIMA: BELgian Ice Sheet- Shelf Ice Measurements in Antarctica Frank PATTYN 1, Jean-Louis TISON 1, Denis SAMYN 1, Kenichi MATSUOKA², Howard CONWAY², Bryn HUBBARD³ (1)Laboratoire de Glaciologie, DSTE,
Concurrent simulation of the eddying general circulation and tides in a global ocean model
 Concurrent simulation of the eddying general circulation and tides in a global ocean model Brian K. Arbic 1 E. Joseph Metzger 2 Alan J. Wallcraft 2 1 Department of Oceanography and Center for Ocean-Atmospheric
ASSESSING FUTURE EXPOSURE: GLOBAL AND REGIONAL SEA LEVEL RISE SCENARIOS FOR THE UNITED STATES
 ASSESSING FUTURE EXPOSURE: GLOBAL AND REGIONAL SEA LEVEL RISE SCENARIOS FOR THE UNITED STATES Chesapeake Bay Program Climate Resiliency Workgroup Conference Call May 15, 2017 William Sweet NOAA CO-OPS
E Antarctic Ice Unstable, 200ft Sea Level Rise Possible - DK Greenroots
 E Antarctic Ice Unstable, 200ft Sea Level Rise Possible - DK Greenroots by FishOutofWater Thu Apr 22, 2010 at 04:04:48 PM PDT The last time CO2 levels were this high (14-20 million years ago), ice advanced
Meltdown Evidence of Climate Change from Polar Science. Eric Wolff
 Meltdown Evidence of Climate Change from Polar Science Eric Wolff (ewwo@bas.ac.uk) Why are the polar regions important for climate? Heat engine Why are the polar regions important for climate? Heat engine
Chapter 1 Section 2. Land, Water, and Climate
 Chapter 1 Section 2 Land, Water, and Climate Vocabulary 1. Landforms- natural features of the Earth s land surface 2. Elevation- height above sea level 3. Relief- changes in height 4. Core- most inner
S3-A Land and Sea Ice Cyclic Performance Report. Cycle No Start date: 21/04/2017. End date: 18/05/2017
 PREPARATION AND OPERATIONS OF THE MISSION PERFORMANCE CENTRE (MPC) FOR THE COPERNICUS SENTINEL-3 MISSION Cycle No. 017 Start date: 21/04/2017 End date: 18/05/2017 Ref. S3MPC.UCL.PR.08-017 Contract: 4000111836/14/I-LG
Fast and Slow Response of Sea ice and the Southern Ocean to Ozone Depletion
 Fast and Slow Response of Sea ice and the Southern Ocean to Ozone Depletion Annual Minimum Sea ice extent 1979-2013 10 6 km 2 Arctic September Antarctic February Data from in passive microwave satellite
SUPPLEMENTARY INFORMATION
 SUPPLEMENTARY INFORMATION doi: 10.108/ngeo75 This section includes additional information for the model parameters as well as the results of a set of sensitivity experiments to illustrate the dependence
Mike Dinniman John Klinck Center for Coastal Physical Oceanography Old Dominion University Anna Wåhlin Department of Earth Sciences University of
 The importance of short duration wind events on intrusions of Circumpolar Deep Water onto Antarctic continental shelves Mike Dinniman John Klinck Center for Coastal Physical Oceanography Old Dominion University
Weather and Climate Change
 Weather and Climate Change What if the environmental lapse rate falls between the moist and dry adiabatic lapse rates? The atmosphere is unstable for saturated air parcels but stable for unsaturated air
Ocean and Climate I.
 Ocean and Climate I http://www.gerhardriessbeck.de/ Physical Characteristics of the Ocean Surface area: 3.61 10 14 m 2 Mean depth: 3.7 km Ocean volume: 3.2 10 17 m 3 Mean density: 1.035 10 3 kg/m 3 Ocean
How we think about sea level in ocean climate models circa 2012: (a brief version)
") How we think about sea level in ocean climate models circa 2012: (a brief version) Stephen.Griffies@noaa.gov NOAA/GFDL Princeton USA Presentation at the CESM workshop Breckenridge, Colorado 19 June 2012
How we think about sea level in ocean climate models circa 2012: (a brief version) Stephen.Griffies@noaa.gov NOAA/GFDL Princeton USA Presentation at the CESM workshop Breckenridge, Colorado 19 June 2012
Who is TPAC? TPAC. Located at University of Tasmania, Hobart Partnership between: University of Tasmania CSIRO Marine Atmos. Res.
 Who is? Tasmanian Partnership for Advanced Computing Partner in ARCS (Australian Research Collaboration Services Strengths, Earth Systems Science, Compute and storage facilities Located at University of
Future Sea Level Rise and its Implications for SIDS and LDCs
 Future Sea Level Rise and its Implications for SIDS and LDCs Bill Hare, Michiel Schaeffer, Mahé Perrette, Matthias Mengel COP17, Durban, 2 nd December Overview Part 1: Global sea level: past and future