Exploiting radar power to study oceans and climate: the rise and prospects of satellite altimetry
|
|
|
- Myrtle Houston
- 5 years ago
- Views:
Transcription

1 Exploiting radar power to study oceans and climate: the rise and prospects of satellite altimetry Paolo Cipollini National Oceanography Centre, Southampton, UK with contributions by Peter Challenor, Ian Robinson, Helen Snaith
2 Outline Rationale (why we need altimetry ) Principles of altimetry (how it works in principle) Corrections (how it is made accurate) Geophysical parameters (what quantities we measure) Examples of applications (how we use it!) 2

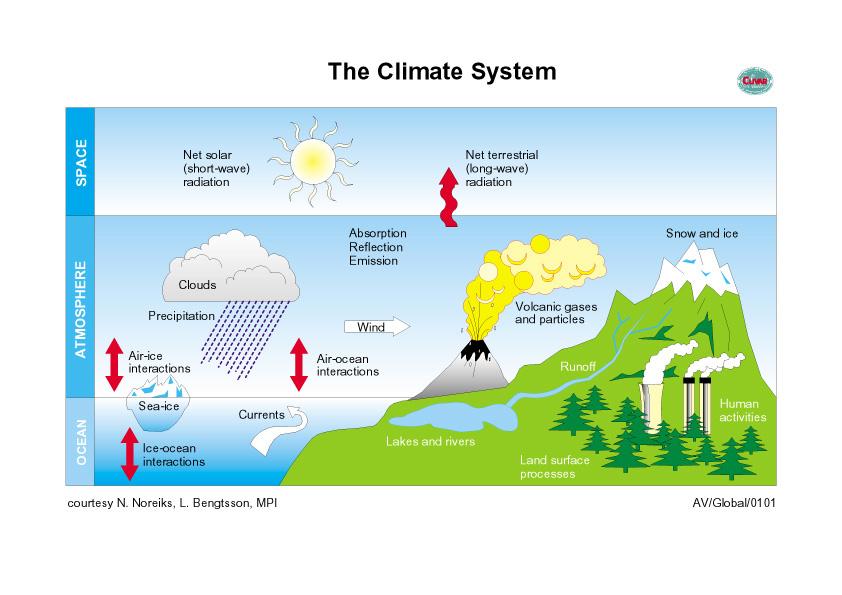
3 Rationale for Radar Altimetry over the oceans Climate change oceans are a very important component of climate system Altimeters monitor currents / ocean circulation that can be used to estimate heat storage and transport and to assess the interaction between ocean and atmosphere We also get interesting byproducts: wind/waves, rain, gas exchange 3
4 4

5 The sea is not flat. Surface dynamical features of height = tens of cm over lengths = hundreds of kms 5
6 Altimetry I - principles & instruments The altimeter is a radar at vertical incidence The signal returning to the satellite is from quasi-specular reflection Measure distance between satellite and sea Determine position of satellite Hence determine height of sea surface Oceanographers require height relative to geoid Geoid Orbit height Reference ellipsoid Altimeter measurement (A) Satellite orbit Sea Surface Geoid undulation Ocean dynamic surface topography (SSH) SSH = Orbit - A - Geoid 6
7 Measuring ocean topography with radar Measure travel time, 2T, from emit to return h = T/c (c = 3 x 10 8 m/s) Resolution to ~cm would need a precision of 3 x s, that is 0.3 nanoseconds) orbit Nadir view h sea surface Specular reflection 0.3ns. That is a pulse bandwidth of >3 GHz. ahem, wait a minute. 7
8 Chirp, chirp. So we have to use tricks: chirp pulse compression and average ~1000 pulses It is also necessary to apply a number of corrections for atmospheric and surface effects 8
9 Beam- and Pulse- Limited Altimeters In principle here are two types of altimeter: beam limited pulse limited 9
10 Beam Limited Altimeter In a beam limited altimeter the return pulse is dictated by the width of the beam 10
11 A plot of return power versus time for a beam limited altimeter looks like the heights of the specular points, i.e. the probability density function (pdf) of the specular scatterers The tracking point (point taken for the range measurement) is the maximum of the curve time 11
12 Beam-limited - technological problems Narrow beams require very large antennas and are impractical in space For a 5 km footprint a beam width of about 0.3 is required. For a 13.6 GHz altimeter this would imply a 5m antenna. Even more important is the high sensitivity to mispointing, which affects both amplitude and measured range Forthcoming mission like ESA s CRYOSAT and Sentinel-3 will use synthetic aperture techniques (delay- Doppler Altimeter) that can be seen as a beam-limited instrument in the along-track direction. 12
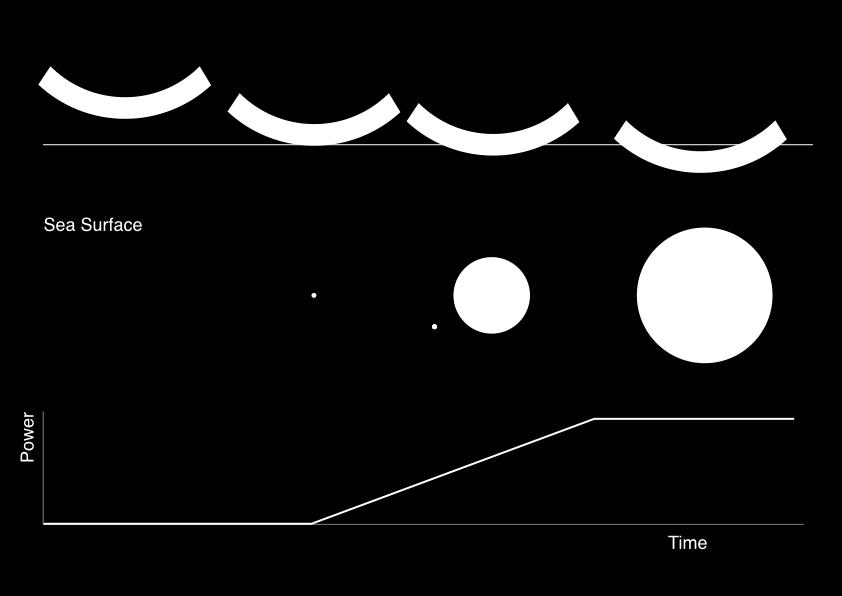
13 Pulse Limited Altimeter In a pulse limited altimeter the shape of the return is dictated by the length (width) of the pulse 13
14 The pulse-limited footprint Full illumination when rear of pulse reaches the sea then area illuminated stays constant Area illuminated has radius r = (2hcp) Measure interval between mid-pulse emission and time to reach half full height sea surface position of pulse at time: t = T t = T+p t =T+2p t =T+3p Emitted pulse 2h/c received power r Area illuminated at time: t = T t = T+p t =T+2p t =T+3p 0 p 2T+ p 2p 3p t Lecture 12
15 A plot of return power versus time for a pulse limited altimeter looks like the integral of the heights of the specular points, i.e. the cumulative distribution function (cdf) of the specular scatterers The tracking point is the half power point of the curve 15
16 Pulse- vs Beam- All the microwave altimeters (including very successful TOPEX/Poseidon, ERS-1 RA and ERS-2 RA, Envisat RA-2) flown in space to date are pulse limited but. laser altimeters (like GLAS on ICESAT) are beamlimited As said, delay-dopper Altimeter can be seen as pulselimited in the along-track direction But to understand the basis of altimetry we first consider the pulse limited design 16
17 Basics of pulse-limited Altimeter Theory We send out a thin shell of radar energy which is reflected back from the sea surface The power in the returned signal is detected by a number of gates (bins) each at a slightly different time 17
18 18
19 If we add waves... 19
20 The area illuminated The total area illuminated is related to the significant wave height The formula is where c is the speed of light, τ is the pulse length, H s significant wave height, R 0 the altitude of the satellite and R E the radius of the Earth 20
21 Hs (m) Effective footprint (km) (800 km altitude) Effective footprint (km) (1335 km altitude) From Chelton et al (1989) 21
22 The Brown Model Assume that the sea surface is a perfectly conducting rough mirror which reflects only at specular points, i.e. those points where the radar beam is reflected directly back to the satellite 22
23 The Brown Model - II Under these assumptions the return power is given by a three fold convolution P r ( t) = P FS ( t) P PT ( t) P H ( z) where P r t ( ) isthereturned power ( ) istheflatsurface response ( ) isthepointtargetresponse ( ) is the pdf of specular points on the sea surfac P FS t P PT t P H z 23
24 The Flat Surface Response Function The Flat surface response function is the response you would get from reflecting the radar pulse from a flat surface. It looks like where U(t) is the Heaviside function U(t) = 0 t <0 =1 otherwise G(t) is the two way antenna gain pattern 24
25 The Point Target Response Function The point target response function is the shape of the transmitted pulse It s true shape is given by For the Brown model we approximate this with a Gaussian. 25
26 The Brown Model - III P r ( t) = P FS ( 0)ηP T 2π σ p P r ( t) = P FS ( t t 0 )ηp T 2π σ p σ c 2 =σ p 2 + H s 2 4c 2 ( ) 2 1+ erf t t 0 2σ c ( ) 2 1+ erf t t 0 2σ c t < t 0 t > t 0 P FS t ( ) = G 0 2 λ 2 R cσ 0 4( 4π ) 2 L p h 3 exp 4 γ sin2 ξ 4ct γh cos2ξ I 0 4 γ ct h sin2ξ 26
27 where Compare with the Normal cumulative distribution function I 0 () is a modified Bessel function of the first kind 27
28 What are we measuring? Hs - significant wave height t 0 - the time for the radar signal to reach the Earth and return to the satellite (we then convert into height see in the next slides) σ 0 - the radar backscatter coefficient, (somehow related to wind) 28
29 What are the other parameters? λ R is the radar wavelength L p is the two way propagation loss h is the satellite altitude (nominal) G 0 is the antenna gain γ is the antenna beam width σ p is the pulse width η is the pulse compression ratio PT is the peak power ξ is the mispointing angle 29
30 Some example waveforms Looking at the slope of the leading edge of the return pulse we can measure wave height! 30


31 The effect of mispointing 31
32 Noise on the altimeter If we simply use the altimeter as a detector we will still have a signal - known as the thermal noise. The noise on the signal is known as fading noise It is sometimes assumed to be constant, sometimes its mean is measured For most altimeters the noise on the signal is independent in each gate and has a negative exponential distribution. 32
33 Averaging the noise For a negative exponential distribution the variance is equal to the mean. Thus the individual pulses are very noisy The pulse repetition frequency is usually about 1000 per second It is usual to transmit data to the ground at 20Hz and then average to 1 Hz 33

34 A single pulse Time (gate number) 34


35 Time (gate number) 35
36 How altimeters really work It is very difficult (if not impossible) to generate a single-frequency pulse of length 3 ns However it is possible to do something very similar in the frequency domain using a chirp, that is modulating the frequency of the carrier wave in a linear way The equivalent pulse width = 1/chirp bandwidth 36
37 Full chirp deramp - 1 A chirp is generated Two copies are taken The first is transmitted The second is delayed so it can be matched with the reflected pulse Generate chirp Delay Combine Transmit Receive 37
38 Full Chirp Deramp - 2 The two chirps are mixed. A point above the sea surface gives returns a frequency lower than would be expected and viceversa So a Brown return is received but with frequency rather than time along the x axis 38
39 A real waveform - from the RA-2 altimeter on ESA s Envisat Ku band, 13.5 Ghz, 2.1 cm 39
40 Altimeters - Some Instruments flown GEOS-3 (04/75-12/78) height 845 km, inclination 115 deg, accuracy 0.5 m, repeat period?? Seasat (06/78-09/78) 800 km, 108 deg, 0.1 m, 3 days Geosat (03/85-09/89) km, deg, 0.1 m 17.5 days ERS-1(07/ ); ERS-2 (04/95 present!) 785 km, 98.5 deg, 0.05 m 35 days TOPEX/Poseidon (09/ ); Jason-1 (12/01-present); Jason-2 (06/08-present) 1336 km, 66 deg, 0.03 m 9.92 days Geosat follow-on (GFO) (02/ ) 800 km, 108 deg, 0.1 m 17.5 days Envisat (03/02 - present) 785 km, 98.5 deg, 0.05 m 35 days 40

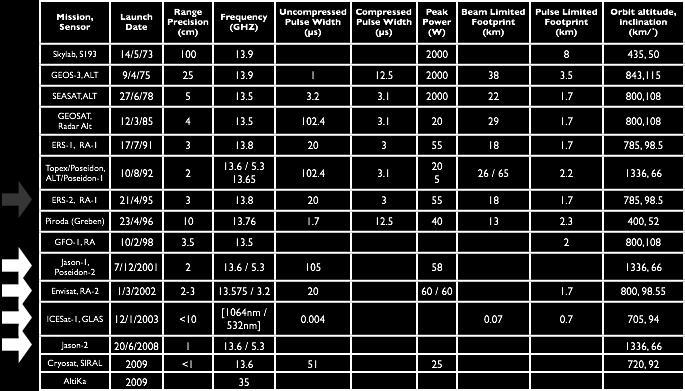
41 Altimeter missions to date
42 42
43 Altimetry II From satellite height to sea surface height The altimeter measures the altitude of the satellite The oceanographer wants a measurement of sea level Steps that need to be taken Instrument corrections Platform corrections Orbit determination The effect of refraction Sea surface effects

44
45 Altimeter Corrections & Orbits Platform Corrections - due to instrument geometry and other effects on the satellite Orbits - must be known as accurately as possible Correction for atmospheric delay effects Correction for surface effects Correction for barometric effects Estimating/Removing the geoid Estimating/Removing tides 45
46 Platform corrections The Earth is not round. The true shape of the earth is the geoid. As the satellite orbits the Earth it moves closer and further away responding to changes in gravity. This means that the satellite is constantly moving towards and away from the earth. A Doppler correction is therefore needed (applied by the space agencies) There are other platform corrections e.g. a correction needs to be made for the distance between the centre of gravity of the spacecraft and the altimeter antenna All these corrections are applied by the space agencies and need not worry the scientist (unless something goes wrong)
47 Orbits From the altimeter measurement we know the height of the satellite above the sea surface We want to know the height of the sea surface above the geoid (ellipsoid) Therefore we need to know the satellite orbit (to a few cm s or less) This is done through a combination of satellite tracking and dynamical modelling. A dynamical model is fitted through the tracking data. Solutions cover a few days at a time. The tracking information comes from DORIS, GPS and Satellite Laser ranging (SLR)

48 DORIS SLR
49 SLR Stations

50 DORIS stations
51 Quality of orbits for today s altimeters The quality of orbits are measured by the reduction of crossover differences and by comparison to SLR stations TOPEX/POSEIDON and JASON orbits are good to about 3-5 cm ERS-2 and ENVISAT 5-10 cm (much more affected by drag, as in orbit lower than T/P and Jason)
52 Topex/Poseidon Orbit Error Budget Size of observed error in orbit model, by parameter Gravity, 2.0 cm Radiation pressure, 2.0cm Atmospheric drag, 1.0 cm Geoid model, 1.0 cm Solid earth and ocean tide, 1.0 cm Troposphere, < 1 cm Station location, 1.0 cm Total radial orbit error, 3.5 cm Mission design specification, 12.8 cm With latest, state-of-art models, the above total orbit error decreases to ~2.5 cm 52
53 Empirical orbit removal If orbit errors dominate Either: Use repeat tracks Subtract average of all tracks Fit linear or quadratic function to each pass to remove trend Residuals give the time varying signal within the region Or: Use cross-over points Compute height difference between ascending and descending tracks Fit smooth function to each pass to minimise cross-over differences Subtract this function to give SSH residual A A A Individual pass B Mean of all passes Residual Trend B Detrended residual B A B 53
54 Atmospheric Corrections As the radar signal travels through the atmosphere it is slowed down w.r.t. speed of light in the vacuum Since we need speed to estimate range, we must correct for this effect. There are three parts of the atmosphere that must be taken in to account Ionospheric correction Dry tropospheric correction Wet tropospheric correction
55 Ionospheric correction Caused by free electrons in the ionosphere Frequency dependent so it can be measured with a dual frequency altimeter Otherwise use a model or other observations from a dual frequency radar system (GPS, DORIS) Average value 45mm, s.d. 35mm Depends on solar cycle

56 Low solar activity High solar activity
57 Annual sunspot numbers Monthly sunspot numbers
58 Dry Tropospheric Correction Due to O 2 molecules in the atmosphere Derived from atmospheric pressure (from met models) by: Dry_trop=2.277(p)( cos(2lat)) (mm) (hpa) ( ) Average value 2300mm, s.d. 30mm
 Standard")
59 Winter DJF Air Pressure Mean (hpa) Standard deviation
 Standard")
60 Summer JJA Atmospheric Pressure Mean (hpa) Standard Deviation
61 Wet Tropospheric Correction Caused by water vapour in the atmosphere Obtained by microwave radiometer on satellite two frequency on ERS and ENVISAT three frequency on T/P and JASON Or from weather forecasting models Average value 150mm, s.d. 40mm
 Standard")
62 Tropospheric water vapour from SSM/I Mean (g/m 2 ) Standard deviation
63 Atmospheric corrections - summary Ionospheric correction: 2-20 cm [+/- 3 cm] Caused by presence of free electrons in the ionosphere Use model or measure using dual frequency altimeter Dry tropospheric correction: 2.3 m [+/- 1-2 cm] Caused by oxygen molecules Model the correction accurately using surface atmospheric pressure Wet tropospheric correction: 5-35 cm [+/- 3-6 cm] Caused by clouds and rain (variable) Measure H 2 O with microwave radiometer Or use weather model predictions 63
64 Tracker bias Sea State Bias Corrections Problem with tracking the pulse when the sea is rough Electromagnetic Bias The radar return from the troughs is stronger than from the crests Empirical correction based on H s (approx 5%) mean surface least return from upper level most return from lower level Crests: Spiky surface, weaker back reflection Troughs: Flatter concave surface, stronger reflection 64
65 State of the art in sea state bias There is as yet no theoretical method for estimating the sea state bias. We are therefore forced to use empirical methods Find the function of H s (and U 10 - that is wind) that minimises the crossover differences

66 Parametric vs non-parametric methods With parametric methods we have a specified function for the SSB and estimate the parameters of this function, e.g. the BM4 model used for TOPEX With non-parametric methods we compile statistics and smooth the resulting 2-d histogram An example non-parametric SSB
67 TOPEX Latest Error Budget for 1-Hz measurement - from Chelton et al 2001 Source Instrument Noise Ionosphere EM Bias Skewness Dry Troposphere Wet Troposphere Orbit Total Error 1.7cm 0.5cm 2.0cm 1.2cm 0.7cm 1.1cm 2.5cm 4.1cm
68 Interpreting the Ocean Surface Topography Pressure Geoid (~100 m) Time invariant Not known to sufficient accuracy To be measured independently (gravity survey) Tides (~1-2 m) Apply a tidal prediction New tidal models derived from altimetry Choose orbit to avoid tidal aliasing High tide Geoid Low tide Dynamic topography reference level Atmospheric pressure (~0.5 m) Apply inverse barometer correction (1mbar ~ 1 cm) Dynamic topography (~1 m) The intended measurement 68
69 Inverse Barometer Correction When air pressure changes the ocean acts like a barometer (in reverse). High air pressure depresses the sea surface, low air pressure raises it. 1 mbar (hpa) change in air pressure is approximately equal to a 1cm change in the sea surface Good in mid and high latitudes not in Tropics Also, not very accurate in enclosed basins (like the Mediterranean)
70 Barotropic Models An alternative to an IB correction is to use a correction from a barotropic model of the ocean Barotropic (non-depth dependent) motions move very quickly and can be aliased by the altimeter ground tracks Barotropic models are quick to run but have proved hard to validate
71 The problem of the Geoid The geoid is the surface of equal gravity potential on the Earth s surface (the shape of the Earth) The ellipsoid is an approximation to the shape of the Earth We know the ellipsoid - we do not know the geoid with the accuracy we would like!!!
72 The Geoid Scale: magenta (-107 m) to red (84.5 m)
73 The geoid is usually expressed in terms of spherical harmonics (sine curves on the sphere). These have degree and order. Degree and order 360 is approximately a resolution of 1 Sea surface pressure and hence geostrophic currents are in terms of sea surface height relative to the geoid. We measure currents (sea surface slopes) relative to the ellipsoid.
74 The geoid is time invariant (approximately) So if we subtract a mean sea surface we will remove the geoid But we lose the mean circulation

75 Mean sea surface
76 SSH residuals The sea surface height residual (or Sea Surface Height Anomaly - SSHA) is what remains after removing the mean in each location (Mean Sea Surface) Any constant dynamic topography (from steady currents) will have been removed! Contains only the time-varying dynamic topography May still contain time varying errors Unremoved tidal or barometric signal Orbit error Important note: nowadays, with new independent accurate geoid models (GRACE and the forthcoming GOCE) we are starting to be able to subtract the geoid and work with absolute dynamic topography (much better for 76 oceanographers!)
77 Tides If we are going to use altimetry for oceanographic purposes we need to remove the effect of the tides (Alternatively we could use the altimeter to estimate the tides - tidal models have improved dramatically since the advent of altimetry!) In general we use global tidal models to make predictions and subtract them from the signal

78
79 As well as the ocean tide we have to consider 1. the loading tide (the effect of the weight of water). This is sometimes included in the ocean tide 3. the solid earth tide 5. the polar tide On continental shelves the global models are not very accurate and local models are needed Any residual tidal error is going to be aliased by the sampling pattern of the altimeter
80 Aliasing Periods T/P ERS Tide Period (h) Alias (days) wave length ( ) Alias (days) wave length ( ) M E 95 9E S W 0 N W 97 4W K W E O E 75 9E P W W

81 Example of corrections over a pass 81
82 82
83 83
 to red")
84 The Geoid Scale: magenta (-107m) to red (84.5m)
85 85
86 86
87 87
88 88
89 89
90 90
91 91
92 92
93 Altimetry III Geophysical parameters we can measure Sea Surface Height Anomaly Varying part of ocean circulation, eddies, gyres, tides, long waves, El Nino, etc Variable currents In near future (with accurate geoid): absolute SSH Absolute currents From shape of return: wave height From radar cross-section: wind
94 Geostrophic currents from Altimetry Assume geostrophic balance geostrophy: balance between pressure gradient and Coriolis force H fv = f = 2Ωsin( latitude) x g H x Unavoidable limitations v = g f Measures only cross-track component of current Cannot recover currents near the equator (geostrophy does not hold there) Only variable (non-steady) currents are detectable 94
95 Absolute currents / absolute topography - an example Kuroshio Current - important current system in North pacific We will see a model animation first Model data from OCCAM model at NOCS, courtesy of Andrew Coward Then we will see the combination of all Altimeter mission available subtracting the latest geoid (from GRACE mission) Courtesy of Doug McNeall, NOCS 95
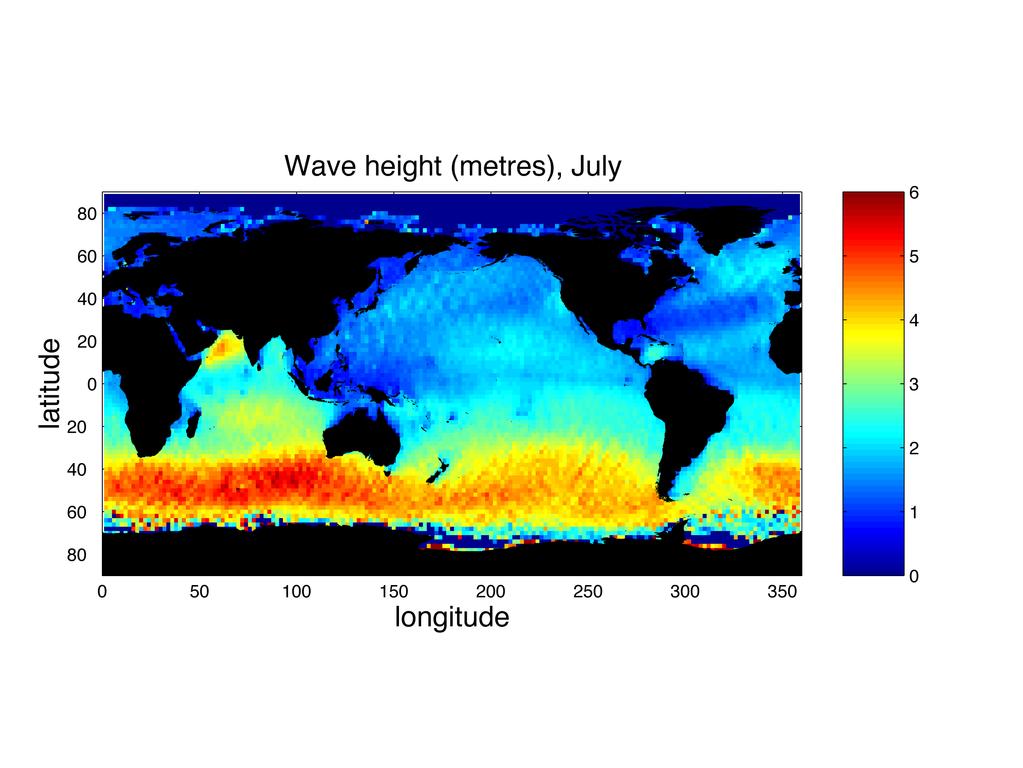
96 Waves, winds and other altimeter Significant wave height Altimeter winds Calibration/validation Wave climate parameters 96
97 What is significant wave height? H s (or SWH) is defined by H s =4 s.d.(sea surface elevation) Used to be defined (H 1/3 ) as Mean height (highest third of the waves) visual estimate of wave height 97

98 How an altimeter measures H s 98


99 Some example waveforms Looking at the shape of the return pulse we can measure wave height 99
100 100

101 Climate changes 101
102 Altimeter wind speeds The radar backscatter coefficient can be related theoretically to the mean square slope of the sea surface at wavelengths comparable with that of the radarnd Ku band is ~2 cm, so it will depend on capillary waves these, in turn, depend on the wind!! Empirically we relate this to wind speed (U 10 ) Wind stress? 102
103 103
104 Why altimeter wind speeds? Scatterometers measure wind velocity over wide swathes Passive microwave measures wind speed over wide swaths Altimeters give us wind speed on a v. narrow swath Wind speed information coincident with wave height and sea surface height (e.g. sea state bias) 104
105 Other parameters Ice Rain 105
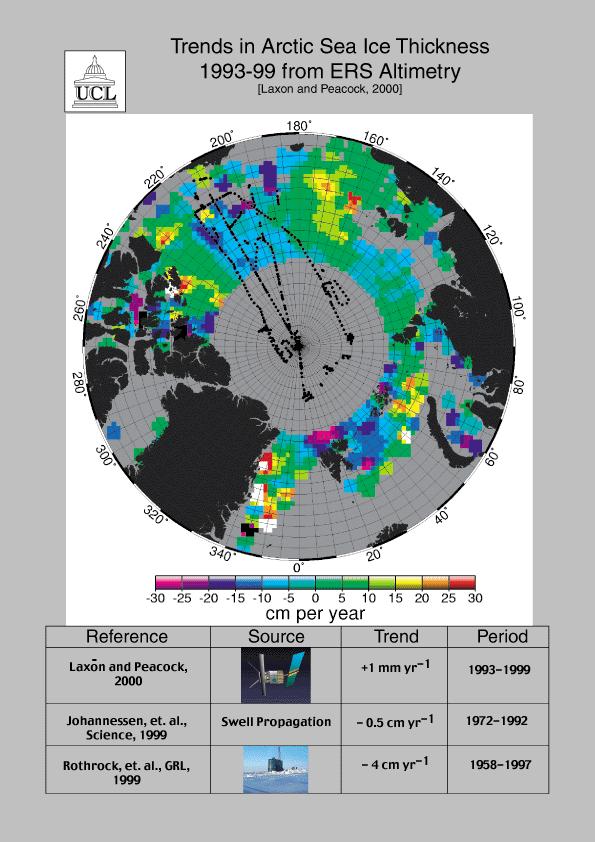
106 Ice Ice edge can be detected by a change in σ 0 Re-tracking of the altimeter pulses over sea-ice can give Sea surface topography in ice covered regions Sea ice thickness 106

107 107
108 Rain effects in altimeter data Dual frequency Topex altimeter (C and Ku band) Ku band attenuated C band is not Ku/C difference gives information on rain rate 108
109 Altimeter IV - some applications into Ocean dynamics & Climate studies Detect large scale SSH anomalies e.g. El Niño, Antarctic Circumpolar Wave, etc. Identify global connections Isolate seasonal current variability e.g. Monsoon dynamics Detect and follow mesoscale ( Km) eddies Use transect time series Identify planetary waves Use longitude/time (Hovmüller) plots Measure phase speed from gradients of wave signatures 109

110 Example: ocean meso-scale variability 110

111 Rossby Waves 111
P. Cipollini, H. Snaith - A short course on Altimetry. Altimetry 2 - Data processing (from satellite height to sea surface height)
") P. Cipollini, H. Snaith - A short course on Altimetry Altimetry 2 - Data processing (from satellite height to sea surface height) 1 2 Satellite height to sea surface height The altimeter measures the altitude
P. Cipollini, H. Snaith - A short course on Altimetry Altimetry 2 - Data processing (from satellite height to sea surface height) 1 2 Satellite height to sea surface height The altimeter measures the altitude
Active microwave systems (2) Satellite Altimetry * the movie * applications
 Satellite Altimetry * the movie * applications") Remote Sensing: John Wilkin wilkin@marine.rutgers.edu IMCS Building Room 211C 732-932-6555 ext 251 Active microwave systems (2) Satellite Altimetry * the movie * applications Altimeters (nadir pointing
Remote Sensing: John Wilkin wilkin@marine.rutgers.edu IMCS Building Room 211C 732-932-6555 ext 251 Active microwave systems (2) Satellite Altimetry * the movie * applications Altimeters (nadir pointing
A short course on Altimetry
 A short course on Altimetry Paolo Cipollini National Oceanography Centre, Southampton, UK cipo@noc.soton.ac.uk with contributions by Peter Challenor, Ian Robinson, Helen Snaith, R. Keith Raney + some other
Satellite Oceanography and Applications 2: Altimetry, scatterometry, SAR, GRACE. RMU Summer Program (AUGUST 24-28, 2015)
") Satellite Oceanography and Applications 2: Altimetry, scatterometry, SAR, GRACE RMU Summer Program (AUGUST 24-28, 2015) Altimetry 2 Basic principles of satellite altimetry Altimetry: the measurements of
Satellite Oceanography and Applications 2: Altimetry, scatterometry, SAR, GRACE RMU Summer Program (AUGUST 24-28, 2015) Altimetry 2 Basic principles of satellite altimetry Altimetry: the measurements of
1 The satellite altimeter measurement
 1 The satellite altimeter measurement In the ideal case, a satellite altimeter measurement is equal to the instantaneous distance between the satellite s geocenter and the ocean surface. However, an altimeter
COMBINING ALTIMETRY AND HYDROGRAPHY FOR GEODESY
 COMBINING ALTIMETRY AND HYDROGRAPHY FOR GEODESY Helen M. Snaith, Peter G. Challenor and S Steven G. Alderson James Rennell Division for Ocean Circulation and Climate, Southampton Oceanography Centre, European
P. Cipollini, H. Snaith - A short course on Altimetry. Altimetry 4 Geophysical parameters and applications
 P. Cipollini, H. Snaith - A short course on Altimetry Altimetry 4 Geophysical parameters and applications 1 2 What can we get from Altimetry? Sea Surface Height Anomaly Varying part of ocean circulation,
Comparison of Mean Sea Surface Data For Oceanography
 Universität Stuttgart Geodätisches Institut Comparison of Mean Sea Surface Data For Oceanography Studienarbeit im Studiengang Geodäsie und Geoinformatik an der Universität Stuttgart Naomi Zimmermann Stuttgart,
Coastal Altimetry Workshop February 5-7, Supported by NOAA (Stan Wilson) NASA (Eric Lindstrom, Lee Fu)
 NASA (Eric Lindstrom, Lee Fu)") Coastal Altimetry Workshop February 5-7, 2008 Organized by: Laury Miller, Walter Smith: NOAA/NESDIS Ted Strub, Amy Vandehey: CIOSS/COAS/OSU With help from many of you! Supported by NOAA (Stan Wilson) NASA
Coastal Altimetry Workshop February 5-7, 2008 Organized by: Laury Miller, Walter Smith: NOAA/NESDIS Ted Strub, Amy Vandehey: CIOSS/COAS/OSU With help from many of you! Supported by NOAA (Stan Wilson) NASA
Remote sensing of sea ice
 Remote sensing of sea ice Ice concentration/extent Age/type Drift Melting Thickness Christian Haas Remote Sensing Methods Passive: senses shortwave (visible), thermal (infrared) or microwave radiation
Geophysical Correction Application in Level 2 CryoSat Data Products
 ESRIN-EOP-GQ / IDEAS IDEAS-VEG-IPF-MEM-1288 Version 2.0 29 July 2014 Geophysical Correction Application in Level 2 CryoSat Data Products TABLE OF CONTENTS 1 INTRODUCTION... 3 1.1 Purpose and Scope... 3
Remote Sensing I: Basics
 Remote Sensing I: Basics Kelly M. Brunt Earth System Science Interdisciplinary Center, University of Maryland Cryospheric Science Laboratory, Goddard Space Flight Center kelly.m.brunt@nasa.gov (Based on
Analysis of Doppler signals from nadir altimeters over ocean. F. Boy (CNES)
") Analysis of Doppler signals from nadir altimeters over ocean F. Boy (CNES) Delay-Doppler Phase Altimetry of Radar Altimeter Pulses Launched in 2016, Sentinel-3A has been measuring oceans, land, ice to
Analysis of Doppler signals from nadir altimeters over ocean F. Boy (CNES) Delay-Doppler Phase Altimetry of Radar Altimeter Pulses Launched in 2016, Sentinel-3A has been measuring oceans, land, ice to
DERIVATION OF SEA LEVEL ANOMALY USING SATELLITE ALTIMETER. Ami Hassan Md Din, Kamaludin Mohd Omar
 DERIVATION OF SEA LEVEL ANOMALY USING SATELLITE ALTIMETER Ami Hassan Md Din, Kamaludin Mohd Omar Faculty of Geoinformation Science and Engineering Universiti Teknologi Malaysia Skudai, Johor E-mail: amihassan@utm.my
Thoughts on Sun-Synchronous* Altimetry
 Thoughts on Sun-Synchronous* Altimetry R. D. Ray NASA Goddard Space Flight Center 14 March 2007 * Yes, a sun-synchronous wide swath is still sun-synch! Whatʼs so bad about sun-synchronous altimetry? For
S3 Product Notice Altimetry
 S3 Product Notice Altimetry Mission Sensor Product S3-A SRAL / MWR LAND L2 NRT, STC and NTC Product Notice ID Issue/Rev Date Version 1.0 Preparation S3A.PN-STM-L2L.06 04-April-2018 This Product Notice
GEOSC/METEO 597K Kevin Bowley Kaitlin Walsh
 GEOSC/METEO 597K Kevin Bowley Kaitlin Walsh Timeline of Satellites ERS-1 (1991-2000) NSCAT (1996) Envisat (2002) RADARSAT (2007) Seasat (1978) TOPEX/Poseidon (1992-2005) QuikSCAT (1999) Jason-2 (2008)
Processing RADS Data LAXMIKANT DHAGE COAS OREGON STATE UNIVERSITY
 Processing RADS Data LAXMIKANT DHAGE COAS OREGON STATE UNIVERSITY 1 Declaration I hereby declare that the work incorporated in this project is original and carried out at the College of Oceanic and Atmospheric
CryoSat Monthly Quality Report #93
 9th May 2018-7th June 2018 Author(s): CryoSat Quality Control Team (Telespazio UK) IDEAS+-VEG-OQC-REP-2987 17 July 2018 AMENDMENT RECORD SHEET The Amendment Record Sheet below records the history and issue
EVALUATION OF WINDSAT SURFACE WIND DATA AND ITS IMPACT ON OCEAN SURFACE WIND ANALYSES AND NUMERICAL WEATHER PREDICTION
 5.8 EVALUATION OF WINDSAT SURFACE WIND DATA AND ITS IMPACT ON OCEAN SURFACE WIND ANALYSES AND NUMERICAL WEATHER PREDICTION Robert Atlas* NOAA/Atlantic Oceanographic and Meteorological Laboratory, Miami,
High resolution geoid from altimetry & bathymetry: requirements for a future mission
 High resolution geoid from altimetry & bathymetry: requirements for a future mission The GRAL team: J-Y Royer 1,2, M-F Lalancette 3, G Louis 1,2, M Maia 1,2, D Rouxel 3 & L Géli 4 Project funded by 1 2
A Mission to Planet Mars Gravity Field Determination
 A Mission to Planet Mars Gravity Field Determination Department for Theoretical Geodesy Graz University of Technology and Space Research Institute Austrian Academy of Sciences Gravity field CHAMP GRACE
Remote Sensing and GIS. Microwave Remote Sensing and its Applications
 Subject Paper No and Title Module No and Title Module Tag Geology Remote Sensing and GIS Microwave Remote Sensing and its Applications RS & GIS XVII Principal Investigator Co-Principal Investigator Co-Principal
HY-2A Satellite User s Guide
 National Satellite Ocean Application Service 2013-5-16 Document Change Record Revision Date Changed Pages/Paragraphs Edit Description i Contents 1 Introduction to HY-2 Satellite... 1 2 HY-2 satellite data
Measuring Changes in Ice Flow Speeds
 Measuring Changes in Ice Flow Speeds Ice flow speeds are commonly measured using a technique called Interferometric Synthetic Aperture Radar (InSAR). This is an active imaging technique the instrument
Earth Exploration-Satellite Service (EESS)- Active Spaceborne Remote Sensing and Operations
- Active Spaceborne Remote Sensing and Operations") Earth Exploration-Satellite Service (EESS)- Active Spaceborne Remote Sensing and Operations SRTM Radarsat JASON Seawinds TRMM Cloudsat Bryan Huneycutt (USA) Charles Wende (USA) WMO, Geneva, Switzerland
Earth Exploration-Satellite Service (EESS)- Active Spaceborne Remote Sensing and Operations SRTM Radarsat JASON Seawinds TRMM Cloudsat Bryan Huneycutt (USA) Charles Wende (USA) WMO, Geneva, Switzerland
Supplementary material to Challenges in Coastal Satellite Radar Altimetry
 Supplementary material to Challenges in Coastal Satellite Radar Altimetry Published 30 June 2009 Jérôme Benveniste, European Space Agency Center for Earth Observation (ESRIN), Frascati, Italy Stefano Vignudelli,
Sentinel-3A Product Notice STM L2 Marine (NRT, STC and NTC)
") Sentinel-3A Product Notice STM L2 Marine (NRT, STC and NTC) Mission Sensor Product S3-A SRAL/MWR L2 NRT STC and NTC (Marine Products) Product Notice ID S3A.PN-STM-L2M.01 EUM/OPS-SEN3/DOC/16/893228 Issue
Sentinel-3A Product Notice STM L2 Marine (NRT, STC and NTC) Mission Sensor Product S3-A SRAL/MWR L2 NRT STC and NTC (Marine Products) Product Notice ID S3A.PN-STM-L2M.01 EUM/OPS-SEN3/DOC/16/893228 Issue
TECH NOTE. New Mean Sea Surface for the CryoSat-2 L2 SAR Chain. Andy Ridout, CPOM, University College London
 TECH NOTE Subject : From : To : New Mean Sea Surface for the CryoSat-2 L2 SAR Chain Andy Ridout, CPOM, University College London Tommaso Parrinello, CryoSat Mission Manager, ESRIN Date : 30 th June 2014
A Factor of 2-4 Improvement in Marine Gravity and Predicted Bathymetry from CryoSat, Jason-1, and Envisat Radar Altimetry: Arctic and Coastal Regions
 DISTRIBUTION STATEMENT A. Approved for public release; distribution is unlimited. A Factor of 2-4 Improvement in Marine Gravity and Predicted Bathymetry from CryoSat, Jason-1, and Envisat Radar Altimetry:
GEO1010 tirsdag
 GEO1010 tirsdag 31.08.2010 Jørn Kristiansen; jornk@met.no I dag: Først litt repetisjon Stråling (kap. 4) Atmosfærens sirkulasjon (kap. 6) Latitudinal Geographic Zones Figure 1.12 jkl TØRR ATMOSFÆRE Temperature
PREDICTION AND MONITORING OF OCEANIC DISASTERS USING MICROWAVE REMOTE SENSING TECHNIQUES
 PREDICTION AND MONITORING OF OCEANIC DISASTERS USING MICROWAVE REMOTE SENSING TECHNIQUES O P N Calla International Centre for Radio Science, OM NIWAS A-23, Shastri Nagar, Jodhpur-342 003 Abstract The disasters
S3-A Land and Sea Ice Cyclic Performance Report. Cycle No Start date: 21/04/2017. End date: 18/05/2017
 PREPARATION AND OPERATIONS OF THE MISSION PERFORMANCE CENTRE (MPC) FOR THE COPERNICUS SENTINEL-3 MISSION Cycle No. 017 Start date: 21/04/2017 End date: 18/05/2017 Ref. S3MPC.UCL.PR.08-017 Contract: 4000111836/14/I-LG
QUINC2. Harvest MNPEAK MCDON4 MAZTLN HOLLAS
 Orbit analysis for the TOPEX altimeter calibration P.N.A.M. Visser 1 and C.K. Shum University of Texas at Austin Center for Space Research October 1993 Abstract Several orbits have been used in the calibration
NSIDC Distributed ICESat GLAS Laser Operations Periods: Latest Release
 Notes Laser 1A Laser 1B Laser 2A Laser 2A Laser 2A Laser 2B Laser 2C Laser 3A Laser 3B Laser 3C Laser 3D Laser 3E Laser 3F Laser 3G Laser 3H Laser 3I Laser 3J Laser 3K Laser 2D Laser 2E Laser 2F NSIDC
Jason-1 orbit comparison : POE-E versus POE-D. L. Zawadzki, M. Ablain (CLS)
") Jason-1 orbit comparison : versus POE-D L. Zawadzki, M. Ablain (CLS) Jason-1 orbit comparison : versus POE-D Objectives Evaluate orbit for Jason-1 (by comparison to POE-D standard) Observe and analyse
Jason-1 orbit comparison : versus POE-D L. Zawadzki, M. Ablain (CLS) Jason-1 orbit comparison : versus POE-D Objectives Evaluate orbit for Jason-1 (by comparison to POE-D standard) Observe and analyse
S3-A Land and Sea Ice Cyclic Performance Report. Cycle No Start date: 30/09/2017. End date: 27/10/2017
 PREPARATION AND OPERATIONS OF THE MISSION PERFORMANCE CENTRE (MPC) FOR THE COPERNICUS SENTINEL-3 MISSION Start date: 30/09/2017 End date: 27/10/2017 Ref. S3MPC.UCL.PR.08-023 Contract: 4000111836/14/I-LG
Atmospheric Lidar The Atmospheric Lidar (ATLID) is a high-spectral resolution lidar and will be the first of its type to be flown in space.
 is a high-spectral resolution lidar and will be the first of its type to be flown in space.") www.esa.int EarthCARE mission instruments ESA s EarthCARE satellite payload comprises four instruments: the Atmospheric Lidar, the Cloud Profiling Radar, the Multi-Spectral Imager and the Broad-Band Radiometer.
www.esa.int EarthCARE mission instruments ESA s EarthCARE satellite payload comprises four instruments: the Atmospheric Lidar, the Cloud Profiling Radar, the Multi-Spectral Imager and the Broad-Band Radiometer.
Comparison of Sea Surface Heights Observed by TOPEX Altimeter with Sea Level Data at Chichijima
 Journal of Oceanography Vol. 52, pp. 259 to 273. 1996 Comparison of Sea Surface Heights Observed by TOPEX Altimeter with Sea Level Data at Chichijima NAOTO EBUCHI 1 and KIMIO HANAWA 2 1 Center for Atmospheric
New satellite mission for improving the Terrestrial Reference Frame: means and impacts
 Fourth Swarm science meeting and geodetic missions workshop ESA, 20-24 March 2017, Banff, Alberta, Canada New satellite mission for improving the Terrestrial Reference Frame: means and impacts Richard
Electromagnetic bias estimates based on TOPEX, buoy, and wave model data
 JOURNAL OF GEOPHYSICAL RESEARCH, VOL. 108, NO. C11, 3351, doi:10.1029/2002jc001525, 2003 Electromagnetic bias estimates based on TOPEX, buoy, and wave model data Raj Kumar Oceanic Sciences Division, MOG/RESA,
Orbit and Transmit Characteristics of the CloudSat Cloud Profiling Radar (CPR) JPL Document No. D-29695
 JPL Document No. D-29695") Orbit and Transmit Characteristics of the CloudSat Cloud Profiling Radar (CPR) JPL Document No. D-29695 Jet Propulsion Laboratory California Institute of Technology Pasadena, CA 91109 26 July 2004 Revised
Orbit and Transmit Characteristics of the CloudSat Cloud Profiling Radar (CPR) JPL Document No. D-29695 Jet Propulsion Laboratory California Institute of Technology Pasadena, CA 91109 26 July 2004 Revised
Satellite oceanography, altimetry, sea surface height, ocean colour, sea-surface temperature, ocean waves, GODAE, ocean models, GHRSST.
 Chapter 6 SATELLITE MEASUREMENTS FOR OPERATIONAL OCEAN MODELS Ian Robinson Southampton Oceanography Centre, University of Southampton, U.K. Abstract: Key words: This chapter outlines the character of ocean
ON THE ACCURACY OF CURRENT MEAN SEA SURFACE MODELS FOR THE USE WITH GOCE DATA
 ON THE ACCURACY OF CURRENT MEAN SEA SURFACE MODELS FOR THE USE WITH GOCE DATA Ole B. Andersen 1, M-.H., Rio 2 (1) DTU Space, Juliane Maries Vej 30, Copenhagen, Denmark (2) CLS, Ramon St Agne, France ABSTRACT
Observations of Arctic snow and sea ice thickness from satellite and airborne surveys. Nathan Kurtz NASA Goddard Space Flight Center
 Observations of Arctic snow and sea ice thickness from satellite and airborne surveys Nathan Kurtz NASA Goddard Space Flight Center Decline in Arctic sea ice thickness and volume Kwok et al. (2009) Submarine
Remote Sensing in Meteorology: Satellites and Radar. AT 351 Lab 10 April 2, Remote Sensing
 Remote Sensing in Meteorology: Satellites and Radar AT 351 Lab 10 April 2, 2008 Remote Sensing Remote sensing is gathering information about something without being in physical contact with it typically
China France. Oceanography S A T. The CFOSAT project. e l l i t e. C. Tison (1), D. Hauser (2), A. Mouche (3) CNES, France (2)
, D. Hauser (2), A. Mouche (3) CNES, France (2)") China France The CFOSAT project C. Tison (1), D. Hauser (2), A. Mouche (3) (1) CNES, France (2) OVSQ, CNRS, LATMOS-IPSL, France (3) IFREMER, LOS, France celine.tison@cnes.fr Oceanography S A T e l l i
China France The CFOSAT project C. Tison (1), D. Hauser (2), A. Mouche (3) (1) CNES, France (2) OVSQ, CNRS, LATMOS-IPSL, France (3) IFREMER, LOS, France celine.tison@cnes.fr Oceanography S A T e l l i
Ice sheet mass balance from satellite altimetry. Kate Briggs (Mal McMillan)
") Ice sheet mass balance from satellite altimetry Kate Briggs (Mal McMillan) Outline Background Recap 25 year altimetry record Recap Measuring surface elevation with altimetry Measuring surface elevation
Ice sheet mass balance from satellite altimetry Kate Briggs (Mal McMillan) Outline Background Recap 25 year altimetry record Recap Measuring surface elevation with altimetry Measuring surface elevation
A two-season impact study of the Navy s WindSat surface wind retrievals in the NCEP global data assimilation system
 A two-season impact study of the Navy s WindSat surface wind retrievals in the NCEP global data assimilation system Li Bi James Jung John Le Marshall 16 April 2008 Outline WindSat overview and working
Lesson IV. TOPEX/Poseidon Measuring Currents from Space
 Lesson IV. TOPEX/Poseidon Measuring Currents from Space The goal of this unit is to explain in detail the various measurements taken by the TOPEX/Poseidon satellite. Keywords: ocean topography, geoid,
The ICESat 2 Mission Laser altimetry of ice, clouds and land elevation
 OSTM SWT San Diego October 2011 The ICESat 2 Mission Laser altimetry of ice, clouds and land elevation and also ocean, coastal, and continental waters Charon Birkett, ESSIC/UMD on behalf of T. Markus,
Geoid and MDT of the Arctic Ocean
 Geoid and MDT of the Arctic Ocean Rene Forsberg, Henriette Skourup Geodynamics Dept National Space Institute Techical University of Denmark rf@space.dtu.dk Outline: Determination of MDT from remote sensing
Lecture 4:the observed mean circulation. Atmosphere, Ocean, Climate Dynamics EESS 146B/246B
 Lecture 4:the observed mean circulation Atmosphere, Ocean, Climate Dynamics EESS 146B/246B The observed mean circulation Lateral structure of the surface circulation Vertical structure of the circulation
Satellite Geodesy and Navigation Present and Future
 Satellite Geodesy and Navigation Present and Future Drazen Svehla Institute of Astronomical and Physical Geodesy Technical University of Munich, Germany Content Clocks for navigation Relativistic geodesy
Wide-Swath Ocean Altimetry Using Radar Interferometry
 Wide-Swath Ocean Altimetry Using Radar Interferometry Ernest0 Rodriguez, Brian D. Pollard, Jan M. Martin, Jet Propulsion Laboratory California Institute of Technology Pasadena, CA E-mail: er@vermeer.jpl.nasa.gov
Coastal Altimetry Data Handbook Issue 2.0, 02 September 2014
 Coastal Altimetry Data Handbook Issue 2.0, 02 September 2014 Edited by the Coastal & Marine Research Centre, University College Cork DOCUMENT DETAILS Author Paolo Cipollini, Rory Scarrott, Helen Snaith
The Earth Explorer Missions - Current Status
 EOQ N 66 July 2000 meteorology earthnet remote sensing solid earth future programmes Earth Observation Quarterly The Earth Explorer Missions - Current Status G. Mégie (1) and C.J. Readings (2) (1) Institut
Status of Indian Satellite Meteorological Programme
 Status of Indian Satellite Meteorological Programme Pradeep K Thapliyal Space Applications Centre (SAC) Indian Space research Organisation (ISRO) Ahmedabad (INDIA) Email: pkthapliyal@sac.isro.gov.in International
Spectral Albedos. a: dry snow. b: wet new snow. c: melting old snow. a: cold MY ice. b: melting MY ice. d: frozen pond. c: melting FY white ice
 Spectral Albedos a: dry snow b: wet new snow a: cold MY ice c: melting old snow b: melting MY ice d: frozen pond c: melting FY white ice d: melting FY blue ice e: early MY pond e: ageing ponds Extinction
52 th International Astronautical Congress 1-5 Oct 2001 / Toulouse, France
 IAF 01 B.2.10 ALTIKA : A MICRO-SATELLITE Ka-BAND ALTIMETRY MISSION J. VERRON 1, P. BAHUREL 2, E. CAUBET 3, B. CHAPRON 4, J.F. CRETAUX 5, L. EYMARD 6, C. LE PROVOST 5, P.Y. LE TRAON 7, L. PHALIPPOU 3, F.
Sentinel-3A Product Notice STM L2 Marine ( Spring-2018 Reprocessing Campaign )
") Sentinel-3A Product Notice STM L2 Marine ( Spring-2018 Reprocessing Campaign ) Mission Sensor Product S3-A SRAL/MWR L2 NTC (Marine Reprocessed Dataset from Spring-2018 Reprocessing Campaign ) Product Notice
Sentinel-3A Product Notice STM L2 Marine ( Spring-2018 Reprocessing Campaign ) Mission Sensor Product S3-A SRAL/MWR L2 NTC (Marine Reprocessed Dataset from Spring-2018 Reprocessing Campaign ) Product Notice
REMOTE SENSING BY RADAR ALTIMETRY
 CHARLES C. KLGUS, JOHN L. MacARTHUR, and PETER V. K. BRON REMOTE SENSNG BY RADAR ALTMETRY A satellite radar altimeter allows remote sensing of the topography of the ocean's surface with the precision of
Presented at the FIG Congress 2018, May 6-11, 2018 in Istanbul, Turkey
 Presented at the FIG Congress 2018, May 6-11, 2018 in Istanbul, Turkey Paper ID: 9253 (Peer Review) By: Amalina Izzati Abdul Hamid, Ami Hassan Md Din & Kamaludin Mohd Omar Geomatic Innovation Research
esurge A Storm Surge Demonstration Project
 esurge A Storm Surge Demonstration Project Helen Snaith British Oceanographic Data Centre, National Oceanography Centre, UK The Impact of Storm Surges Great flood in the Netherlands History: Zeeland, 31
The GOCE User Toolbox
 The GOCE User Toolbox Jérôme Benveniste - ESA Earth Observation Science and Applications Department Per Knudsen - Danish National Space Center and the GUT TEAM 37th COSPAR Scientific Assembly 2008, Montreal
CRYOSAT CYCLIC REPORT
 CRYOSAT CYCLIC REPORT CYCLE #14 12TH NOVEMBER 2011 11TH DECEMBER 2011 Prepared by/ préparé par CryoSat IDEAS Team Reference/ réference Issue/ édition 1 Revision/ révision 0 Date of issue/ date d édition
Large-scale Ocean Circulation
 Chapter 2 Large-scale Ocean Circulation Author: Gregg Jacobs 2.1 INTRODUCTION This chapter examines the observation and physics of large-scale ocean features. Physical oceanographers apply the term large-scale
New retrieval algorithm for the wet tropospheric correction of altimetry missions
 New retrieval algorithm for the wet tropospheric correction of altimetry missions A. Rahmani, E. Obligis and L. Eymard CLS/LOCEAN MicroRad Conference March 2008 Page n 1/13 Introduction Altimeters are
sentinel-3 A BIGGER PICTURE FOR COPERNICUS
 sentinel-3 A BIGGER PICTURE FOR COPERNICUS SATELLITES TO SERVE By providing a set of key information services for a wide range of practical applications, Europe s Copernicus programme has been put in place
Annual Report. LaMer, Ehime University. Principle Investigator: Include the report on the result of the project/meeting in a separate sheet.
 Form 3 Annual Report LaMer, Ehime University Date (16, 11, 2017) To Director of LaMer Principle Investigator: Affiliation Second Institute of Oceanography, SOA Position Research Assistant Name in print
Using Remote-sensed Sea Ice Thickness, Extent and Speed Observations to Optimise a Sea Ice Model
 Using Remote-sensed Sea Ice Thickness, Extent and Speed Observations to Optimise a Sea Ice Model Paul Miller, Seymour Laxon, Daniel Feltham, Douglas Cresswell Centre for Polar Observation and Modelling
Validation Report: WP5000 Regional tidal correction (Noveltis)
") Consortium Members ESA Cryosat Plus for Oceans Validation Report: WP5000 Regional tidal correction (Noveltis) Reference: Nomenclature: CLS-DOS-NT-14-083 CP4O-WP5000-VR-03 Issue: 2. 0 Date: Jun. 20, 14
Consortium Members ESA Cryosat Plus for Oceans Validation Report: WP5000 Regional tidal correction (Noveltis) Reference: Nomenclature: CLS-DOS-NT-14-083 CP4O-WP5000-VR-03 Issue: 2. 0 Date: Jun. 20, 14
EUMETSAT STATUS AND PLANS
 1 EUM/TSS/VWG/15/826793 07/10/2015 EUMETSAT STATUS AND PLANS François Montagner, Marine Applications Manager, EUMETSAT WMO Polar Space Task Group 5 5-7 October 2015, DLR, Oberpfaffenhofen PSTG Strategic
Lectures 7 and 8: 14, 16 Oct Sea Surface Temperature
 Lectures 7 and 8: 14, 16 Oct 2008 Sea Surface Temperature References: Martin, S., 2004, An Introduction to Ocean Remote Sensing, Cambridge University Press, 454 pp. Chapter 7. Robinson, I. S., 2004, Measuring
Radio Frequency Earth Science
 Radio Frequency Earth Science Overview for Committee On Radio Frequency (CORF) National Academy of Science National Research Council April 27, 2005 Bill.Watson@NASA.Gov Program Executive for Ground Networks
Near Real-Time Alongtrack Altimeter Sea Level Anomalies: Options. Corinne James and Ted Strub Oregon State University. Motivation
 Near Real-Time Alongtrack Altimeter Sea Level Anomalies: Options Corinne James and Ted Strub Oregon State University Motivation Modelers want easy access to alongtrack SSHA, SLA or ADT, with enough explanations
Comparison of Convection Characteristics at the Tropical Western Pacific Darwin Site Between Observation and Global Climate Models Simulations
 Comparison of Convection Characteristics at the Tropical Western Pacific Darwin Site Between Observation and Global Climate Models Simulations G.J. Zhang Center for Atmospheric Sciences Scripps Institution
COURSE CLIMATE SCIENCE A SHORT COURSE AT THE ROYAL INSTITUTION
 COURSE CLIMATE SCIENCE A SHORT COURSE AT THE ROYAL INSTITUTION DATE 4 JUNE 2014 LEADER CHRIS BRIERLEY Course Outline 1. Current climate 2. Changing climate 3. Future climate change 4. Consequences 5. Human
RAIES: ENVISAT RA2 INDIVIDUAL ECHOES AND S-BAND DATA FOR NEW SCIENTIFIC APPLICATIONS FOR OCEAN, COASTAL, LAND AND ICE REMOTE SENSING
 RAIES: ENVISAT RA2 INDIVIDUAL ECHOES AND S-BAND DATA FOR NEW SCIENTIFIC APPLICATIONS FOR OCEAN, COASTAL, LAND AND ICE REMOTE SENSING C. Gommenginger (1), P. Challenor (1), G. Quartly (1), J. Gomez-Enri
URSI-F Microwave Signatures Meeting 2010, Florence, Italy, October 4 8, Thomas Meissner Lucrezia Ricciardulli Frank Wentz
 URSI-F Microwave Signatures Meeting 2010, Florence, Italy, October 4 8, 2010 Wind Measurements from Active and Passive Microwave Sensors High Winds and Winds in Rain Thomas Meissner Lucrezia Ricciardulli
Course Outline CLIMATE SCIENCE A SHORT COURSE AT THE ROYAL INSTITUTION. 1. Current climate. 2. Changing climate. 3. Future climate change
 COURSE CLIMATE SCIENCE A SHORT COURSE AT THE ROYAL INSTITUTION DATE 4 JUNE 2014 LEADER CHRIS BRIERLEY Course Outline 1. Current climate 2. Changing climate 3. Future climate change 4. Consequences 5. Human
COMPARISON OF SATELLITE DERIVED OCEAN SURFACE WIND SPEEDS AND THEIR ERROR DUE TO PRECIPITATION
 COMPARISON OF SATELLITE DERIVED OCEAN SURFACE WIND SPEEDS AND THEIR ERROR DUE TO PRECIPITATION A.-M. Blechschmidt and H. Graßl Meteorological Institute, University of Hamburg, Hamburg, Germany ABSTRACT
Lecture: Inland Altimetry I
 Lecture: Inland Altimetry I Denise Dettmering (with contributions from W.Bosch, C.Schwatke, and E. Börgens) 1 Deutsches Geodätisches Forschungsinstitut (DGFI) München, Germany email: dettmering@dgfi.badw.de
NEXT GENERATION ALTIMETER SERVICE CHALLENGES AND ACHIEVEMENTS
 NEXT GENERATION ALTIMETER SERVICE CHALLENGES AND ACHIEVEMENTS M. Naeije (1), R. Scharroo (2), and E. Doornbos (1) (1) DEOS, Delft University of Technology, Kluyverweg 1, 2629 HS Delft, Netherlands (2)
Sentinels and Waves. GMES Sentinel-1 SAR GMES Sentinel-3 Altimeter
 Sentinels and Waves GMES Sentinel-1 SAR GMES Sentinel-3 Altimeter Simon Pinnock, ESA-ESRIN, Frascati, Italy with help from Craig Donlon (ESTEC) & Nuno Miranda (ESRIN) et al. GMES Space Component: dedicated
THE FUTURE ROLE OF SATELLITE ALTIMETRY EARLY RECOMMENDATIONS FROM THE GAMBLE PROJECT.
 THE FUTURE ROLE OF SATELLITE ALTIMETRY EARLY RECOMMENDATIONS FROM THE GAMBLE PROJECT. P.D. Cotton 1, Yves Menard 2, and the GAMBLE Project Team 1 Satellite Observing Systems 15, Church Street, Godalming,
Optimizing σ 0 information from the Jason-2 altimeter
 Optimizing σ information from the Jason-2 altimeter Graham D. Quartly (accepted by IEEE Geoscience & Remote Sensing Letters Dec. 28th 28) Abstract A radar altimeter's normalized backscatter, σ, is used
Goals of this Chapter
 Waves in the Atmosphere and Oceans Restoring Force Conservation of potential temperature in the presence of positive static stability internal gravity waves Conservation of potential vorticity in the presence
Effects of Unresolved High-Frequency Signals in Altimeter Records Inferred from Tide Gauge Data
 534 JOURNAL OF ATMOSPHERIC AND OCEANIC TECHNOLOGY VOLUME 19 Effects of Unresolved High-Frequency Signals in Altimeter Records Inferred from Tide Gauge Data RUI M. PONTE Atmospheric and Environmental Research,
 http://topex.ucsd.edu/gmtsar amplitude and phase coherence and pixel matching resolution: optical vs. microwave D s = 2H sinθ r = 2H λ L H = 800km. Optical : L = 1m λ = 0.5µm D s = 0.8m Microwave : L
SSH retrieval in the ice covered Arctic Ocean: from waveform classification to regional sea level maps
 ESA Climate Change Initiative SSH retrieval in the ice covered Arctic Ocean: from waveform classification to regional sea level maps CLS LEGOS PML Arctic SIE status 2 nd lowest on record with 4.14 10 6
Ocean currents from altimetry
 Ocean currents from altimetry Pierre-Yves LE TRAON - CLS - Space Oceanography Division Gamble Workshop - Stavanger,, May 2003 Introduction Today: information mainly comes from in situ measurements ocean
Satellite ALTimetry. SALT applications and use of data base for SE-Asia region. SEAMERGES kick-off meeting, Bangkok, Thailand.
 Satellite ALTimetry SALT applications and use of data base for SE-Asia region SEAMERGES kick-off meeting, Bangkok, Thailand Marc Naeije 4 March 2004 1 Faculty of Aerospace Engineering DEOS/AS SEAMERGES
Q.1 The most abundant gas in the atmosphere among inert gases is (A) Helium (B) Argon (C) Neon (D) Krypton
 Helium (B) Argon (C) Neon (D) Krypton") Q. 1 Q. 9 carry one mark each & Q. 10 Q. 22 carry two marks each. Q.1 The most abundant gas in the atmosphere among inert gases is (A) Helium (B) Argon (C) Neon (D) Krypton Q.2 The pair of variables that
Q. 1 Q. 9 carry one mark each & Q. 10 Q. 22 carry two marks each. Q.1 The most abundant gas in the atmosphere among inert gases is (A) Helium (B) Argon (C) Neon (D) Krypton Q.2 The pair of variables that
B. Loomis, D. Wiese, R. S. Nerem (1) P. L. Bender (2) P. N. A. M. Visser (3)
 P. L. Bender (2) P. N. A. M. Visser (3)") Possible mission architectures for a GRACE follow-on mission including a study on upgraded instrumentation suites, and multiple satellite pairs in moderately-inclined orbits B. Loomis, D. Wiese, R. S.
Possible mission architectures for a GRACE follow-on mission including a study on upgraded instrumentation suites, and multiple satellite pairs in moderately-inclined orbits B. Loomis, D. Wiese, R. S.
AN ASSESSMENT OF SATELLITE ALTIMETRY IN PROXIMITY OF THE MEDITERRANEAN COASTLINE
 AN ASSESSMENT OF SATELLITE ALTIMETRY IN PROXIMITY OF THE MEDITERRANEAN COASTLINE Fenoglio-Marc L. (1), Vignudelli S. (2), Humbert A. (1), Cipollini P. (3), Fehlau M. (1), Becker M. (1) (1) Institut für
Satellite Altimetry and Earth Sciences
 Satellite Altimetry and Earth Sciences Satellite Altimetry and Earth Sciences This is Volume 69 in the INTERNATIONAL GEOPHYSICS SERIES A series of monographs and textbooks Edited by RENATA DMOWSKA, JAMES
(ii) We have already found out the velocity of the satellite in orbit in part (i) (using equation (2.5)) to be km/s
 We have already found out the velocity of the satellite in orbit in part (i) (using equation (2.5)) to be km/s") Chapter 2 Questions and Solutions Question 1. Explain what the terms centrifugal and centripetal mean with regard to a satellite in orbit around the earth. A satellite is in a circular orbit around the
Chapter 2 Questions and Solutions Question 1. Explain what the terms centrifugal and centripetal mean with regard to a satellite in orbit around the earth. A satellite is in a circular orbit around the
Coastal Altimetry: recent developments and proposed use in the Agulhas region. Paolo Cipollini (NOCS, UK)
") Coastal Altimetry: recent developments and proposed use in the Agulhas region Paolo Cipollini (NOCS, UK) Coastal altimetry - the concept Satellite altimetry has been designed for the open ocean 15 years
Coastal Altimetry: recent developments and proposed use in the Agulhas region Paolo Cipollini (NOCS, UK) Coastal altimetry - the concept Satellite altimetry has been designed for the open ocean 15 years
A global high resolution mean sea surface from multi mission satellite altimetry
 BOLLETTINO DI GEOFISICA TEORICA ED APPLICATA VOL. 40, N. 3-4, pp. 439-443; SEP.-DEC. 1999 A global high resolution mean sea surface from multi mission satellite altimetry P. KNUDSEN and O. ANDERSEN Kort