Jason Lanoue. A Thesis Presented to The University Of Guelph
|
|
|
- Vernon Thornton
- 5 years ago
- Views:
Transcription
1 The Effects of Wavelength Specific Light-Emitting Diode (LED) Lighting on Net Carbon Exchange Rate, Export, and Partitioning in Tomato (Solanum lycopersicum) By Jason Lanoue A Thesis Presented to The University Of Guelph In partial fulfillment of requirements for the degree of Master of Science in Plant Agriculture Guelph, Ontario, Canada Jason Lanoue, September, 2016
2 ABSTRACT THE EFFECTS OF WAVELENGTH SPECIFIC LIGHT-EMITTING DIODE (LED) LIGHTING ON NET CARBON EXCHANGE RATE, EXPORT, AND PARTITIONING IN TOMATO (Solanum lycopersicum) Jason Lanoue University of Guelph, 2016 Advisor: Professor Bernard Grodzinski This thesis is an investigation of the effects of wavelength specific lighting on tomato growth and source leaf photosynthesis and export. Plants grown in a greenhouse during the winter months under ambient or supplemental lighting showed little difference in whole plant or leaf net carbon exchange rate nor carbon gain. However plants grown under supplemental lighting produced statistically higher biomass and flower bud production. Differences in transpiration rates and water use efficiency were determined when plants were analyzed red-blue and red-white lighting treatments. An increase in daily export rates was seen under red-blue and blue when compared to white or red light treatments of white light grown plants. These increases in export rates indicate a direct effect on the export rates solely based on spectral quality. Results from this thesis aim to increase the understanding of wavelength specific lighting effects on tomatoes and help aid in optimizing the light spectrum for greenhouse production.
3 iii Acknowledgements I would like to sincerely thank my advisor, Dr. Bernard Grodzinski, for all his support, friendship and invaluable advice throughout my Masters. I would also like to thank my advisory committee, Drs. Eric Lyons and Rong Cao for their questions and inquires which helped improve my thesis and experimental design. I would like to thank Dr. Evangelos Demosthenes Leonardos for his friendship and immense help with the technical aspects during experimental set up. Naheed Rana for her technical support in the lab with sample analysis as well as Ron Dutton for his assistance with LED lighting and growth chambers. I am grateful to my fellow graduate students for their friendship and advice throughout my masters. I would like to thank my family and friends in both Guelph and Windsor for their encouragement and support. My parents Anna and Rob, and my siblings Dana and Melissa and their families.
4 iv Table of Contents Abstract...ii Acknowledgements iii Table of Contents..iv List of Tables..vii List of Figures vii List of Abbreviations and Definitions.x Chapter 1: General Introduction Greenhouse Commercial Production and Supplemental Lighting Light Spectral Quality Red Light Blue Light Green Light Photosynthesis and Carbon Partitioning Carbon Export Hypothesis and Objectives Thesis Overview.. 15 Chapter 2: The Effect of HPS and Wavelength Specific LED Light on Whole Plant and Leaf CO2 and H2O Gas Exchange and Growth Parameters Under Long-term Acclimation of Solanum lycopersicum cv. Bonny Best Introduction Material and Methods Plant Materials and Growth Conditions Whole Plant Gas Exchange Leaf Gas Exchange Results Discussion Effects of Supplemental Lighting on Whole Plant CO2 Gas Exchange Effects of Supplemental Lighting on Whole Plant H2O Gas Exchange Effects of Supplemental Lighting on Leaf CO2 Gas Exchange Effects of Supplemental Lighting on Leaf H2O Gas Exchange..50
5 v Chapter 3: The Effect of HPS and Wavelength Specific LED Lights on Whole Plant and Leaf CO2 and H2O Gas Exchange and Growth Parameters Under Shortterm Acclimation of Solanum lycopersicum cv. Bonny Best Introduction Material and Methods Plant Materials and Growth Conditions Daily Patterns of Whole Plant Gas Exchange Induction of Leaf Photosynthesis - Wake Up Experiments Responses to Wavelength Specific Lighting - Light Curves Results Whole Plant CO2 and H2O Gas Exchange at Saturating Light Level Whole Plant CO2 and H2O Gas Exchange at Sub-Saturating Light Level Wake Up Leaf Light Curves Discussion Comparison of Wavelength Specific Lighting and HPS Lighting on Whole Plant CO2 Gas Exchange Comparison of Wavelength Specific Lighting on Leaf CO2 Gas Exchange Effects of Wavelength Specific Lighting on Plant Wake Up Effects of Wavelength Specific Lighting on H2O Gas Exchange.83 Chapter 4: Effects of Wavelength Specific Light on Carbon Fixation, Export and Partitioning in Solanum lycopersicum cv. Bonny Best Introduction Materials and Methods Plant Materials and Growth Conditions C Export Short Term 14 C Feeding Photoperiod Long Feed-Chase Export C Partitioning Results Discussion Effects of Wavelength Specific Lighting on H2O Gas Exchange Effects of Wavelength Specific Lighting on Export During 3h Illumination Effects of Wavelength Specific Lighting on 14 C Export and Partitioning During 15h Illumination and Subsequent 8h Dark Period.128 Chapter 5: Thesis Summary References Appendix I: Chapter 2 Supplemental Tables 152
6 vi Appendix II: Chapter 3 Supplemental Tables..156 Appendix III: Supplemental Lighting Spectral Quality..164 Appendix IV: Statistical Analysis 169
7 vii List of Tables Table 2.1: Physical growth measurements of greenhouse grown tomato plants under supplemental and ambient light conditions 28 Table 2.2: Whole plant daily average NCER and daily C-budgets on greenhouse grown tomato plants under supplemental and ambient lighting conditions..36 Table 2.3: Whole plant daily average transpiration rates and WUE of greenhouse grown tomato plants under supplemental and ambient lighting conditions..39 Table 3.1: Whole plant daily average NCER and C-budgets of tomato plants grown under W light and analyzed under RB LED, RW LED, or HPS lighting at 1000±25µmol m -2 s Table 3.2: Whole plant daily average transpiration rates and WUE of tomato plants grown under W light and analyzed under RB LED, RW LED, or HPS lighting at 1000±25µmol m -2 s Table 3.3: Whole plant daily average NCER and C-budgets of tomato plants grown under W light and analyzed under RB LED, RW LED, or HPS lighting at 350±10µmol m -2 s Table 3.4: Whole plant daily average transpiration rates and WUE of tomato plants grown under W light and analyzed under RB LED, RW LED, or HPS lighting at 350±10µmol m -2 s Table 3.5: Effect of wavelength on wake up time of dark adapted tomato leaves 71 Table 4.1: 15h and 23h daily average CO2 and H2O leaf gas exchange measurements for both high and low Pn rates under R, B, RB, or W light treatments 105 Table 4.2: 15h and 23h of Pn, E, 14 C partitioning, and 14 C fate measurements under high Pn leaves illuminated with RB, W, R, or B light treatments..122 Table 4.3: 15h and 23h of Pn, E, 14 C partitioning, and 14 C fate measurements under low Pn leaves illuminated with RB, W, R, or B light treatments..124 List of Figures Figure 2.1: Schematic of greenhouse light treatments and orientation.18 Figure 2.2: Overview of the whole plant gas exchange system and individual chambers lit with respective light treatments 21 Figure 2.3: Li-COR 6400 set up for greenhouse light curves with RB LED Li-COR standard chamber.24
8 viii Figure 2.4: Biomass production of greenhouse grown plants under supplemental and ambient light conditions..26 Figure 2.5: Whole plant NCER and C-budgets of greenhouse grown tomato plants grown under supplemental lighting.30 Figure 2.6: Whole plant NCER and C-budgets of greenhouse grown tomato plants grown under ambient conditions...32 Figure 2.7: Whole plant transpiration rate and WUE of greenhouse grown tomato plants under both supplemental and ambient lighting conditions 34 Figure 2.8: Light curves of greenhouse grown under both supplemental and ambient lighting conditions analyzed with a RB LED Li-COR standard. 42 Figure 2.9: Leaf transpiration rates, stomatal conductance, and internal CO2 concentration of greenhouse grown tomato plants under both supplemental and ambient lighting conditions analyzed with a RB LED Li-COR standard 44 Figure 3.1: Tomato leaf in a clear chamber of a Li-COR Figure 3.2: Whole plant NCER and C-budgets of W light grown tomato plants and analyzed under RB LED, RW LED, or HPS lighting at 1000±25µmol m -2 s Figure 3.3: Whole plant transpiration rates and WUE of tomatoes grown under W light and analyzed under RB LED, RW LED, or HPS lighting at 1000±25µmol m -2 s Figure 3.4: Whole plant NCER and C-budgets of W light grown tomato plants and analyzed under RB LED, RW LED, or HPS lighting at 350±10µmol m -2 s Figure 3.5: Whole plant transpiration rates and WUE of tomatoes grown under W light and analyzed under RB LED, RW LED, or HPS lighting at 350±10µmol m -2 s Figure 3.6: Wavelength specific lighting effect on leaf NCER 73 Figure 3.7: Wavelength specific lighting effect on leaf stomatal conductance 74 Figure 3.8: Wavelength specific lighting effect on leaf transpiration rates.75 Figure 3.9: Wavelength specific lighting effect on leaf internal CO2 concentration 76 Figure 4.1: 14 C leaf chamber setup 88 Figure 4.2: 14 C leaf extraction process 94
9 ix Figure 4.3: 15h and 23h stomatal conductance for both high and low Pn rates under R, B, RB, or W light treatments.97 Figure 4.4: 15h and 23h transpiration rates for both high and low Pn rates under R, B, RB, or W light treatments 99 Figure 4.5: 15h WUE for both high and low Pn rates under R, B, RB, or W light treatments.101 Figure 4.6: 15h and 23h internal CO2 concentration for both high and low Pn rates under R, B, RB, and W light treatments 103 Figure 4.7: 3h 14 C feeds of tomato leaves under R, B, RW, RB, W, and G light treatments..108 Figure 4.8: 15h and 23h NCER, E, and % E relative to Pn of 14 C feed leaves under high Pn from R, B, RB, or W light treatments Figure 4.9: 15h and 23h NCER, E, and % E relative to Pn of 14 C feed leaves under low Pn from R, B, RB, and W light treatments 114 Figure 4.10: 15h and 23h 14 C fraction recovery from both high and low Pn leaves illuminated with R, B, RB, or W light treatments 116 Figure 4.11: 15h and 23h 14 C fate from high Pn leaves illuminated with R, B, RB, or W light treatments.118 Figure 4.12: 15h and 23h 14 C fate from low Pn leaves illuminated with R, B, RB, or W light treatments.120
10 x List of Abbreviations and Definitions ATP AtSUC3 B Ba 14 CO3 BB Adenosine triphosphate Sucrose transporter found in Arabidopsis Blue light treatment Radioactive barium with radiolabelled 14 C Bonny Best; Tomato cultivar 14 C Isotope of carbon; Radiolabelled carbon 14 CO2 Carbon dioxide radiolabelled with 14 C CC Chl Companion cell Chlorophyll Ci Internal CO2 concentration measured in µmol of carbon m -2 s -1 CRY DAP DHAP DLI G GA GGPP G-3-P H + H + -ATPase HCl HID HPS H2SO4 Cryptochrome Days after planting Dihydroxyacetone phosphate Daily light integral Green light treatment Gibberellin; Factor in seed germination Geranylgeranyl pyrophosphate; Intermediate in the biosynthetic pathway of carotenoids Glyceraldehyde 3-phosphate Proton An enzyme which catalyzes a dephosphorylation of ATP in order to move H + against it concentration gradient Hydrochloric acid High-intensity discharge High pressure sodium Sulfuric acid
11 xi IC IRGA LED LSC MC MH NADPH NaH 14 CO3 Intermediary cell Infrared gas analyzer Light emitting diode Liquid scintillation counter Mesophyll cell Metal halide Nicotinamide adenine dinucleotide phosphate Sodium bicarbonate radiolabelled with 14 C NCER Net carbon exchange rate; units of measure are µmol of carbon m -2 s -1 O PAR PHY Pn PPC Ppm PSI PSII R RB RBG RFO Rubisco RuBP RW QTL SPS SPS-PP SUC Orange light treatment Photosynthetically active radiation Phytochrome Photosynthetic rate Phloem parenchyma cell Parts per million Photosystem I Photosystem II Red light treatment Red and blue light treatment Red, blue, and green light in a mixture Raffinose family oligosaccharide Ribulose-1,5-bisphosphate carboxylase oxygenase Ribulose-1,5-bisphosphate Red and white light treatment Quantitative trait locus Sucrose-phosphate synthase Sucrose phosphate synthase protein phosphatase Sucrose transporter; Also found in literature as SUT
12 xii SWEET TC TP TPT WP-NCER WUE 3-PGA Sugars will eventually be exported transporter Transfer cell Triose phosphate Triose phosphate translocator Whole plant net carbon exchange rate Water use efficiency; the rate of NCER to transpiration (µmol CO2/mmol H2O) 3-phosphoglycerate
13 1 CHAPTER 1 General Introduction 1.1 Greenhouse Commercial Production and Supplemental Lighting The tomato (Solanum lycopersicum) resides in the Solanaceae or nightshade family of plants and is classified as a berry on the basis of molecular phylogeny (Knapp, 2002). Tomato fruits vary in size drastically due to the expression of one quantitative trait locus (QTL), fw2.2, and can range from 20 grams to over one kilogram (Frary et al. 2000). While tomatoes are generally seen as red in colour, they can also be found as purple, yellow, orange, or green which is again, controlled by various QTLs (Liu et al. 2003). The commercialization of tomatoes has become of vast important as they are a staple in many foods and provide a great nutritional profile. In 2013, upwards of 163 million tonnes of tomatoes were produced worldwide (FAO United Nations, 2016). In 2016 there were 987 acres of greenhouses across Ontario dedicated to the production of tomatoes (Ontario Greenhouse Vegetable Growers, 2016). Production of all vegetables, not only tomatoes, has drastically improved in Canada and other northern countries with the implementation of greenhouses and supplemental lighting which allow for year round growth and increased yields (Ontario Greenhouse Vegetable Growers, 2016). Currently, greenhouse lighting is comprised of high-intensity discharge (HID) lamps such as Metal Halide (MH) or, mostly, high pressure sodium (HPS) lights. The addition of lights as an alternative or supplement to ambient sunlight have seen a drastic increase in production of greenhouse crops and ornamentals as it allows for the increase in the daily light integral (DLI) (McAvoy & Janes, 1984; Oh et al., 2009). During the January months, the
14 2 addition of 150 µmol m -2 s -1 of light from HPS lamps was shown to increase fruit yield, weight of tomatoes, and total biomass (McAvoy & Janes, 1984). HPS lights have the added advantage of producing heat, which in the winter months can aid in greenhouse temperature regulation (Brault et al., 1989). This excessive thermal waste is able to provide 25-41% of the heating requirements a greenhouse may need in the cold winter months in order to maintain optimal growing conditions (Brault et al., 1989). However, HPS lights also have disadvantages to their use. The excessive thermal energy can also cause damage to the plants when in close proximity (Cathey & Campbell, 1977). This excessive heat and damage associated with it, perturbs the use of HPS lights in close proximity to plant canopies. In recent studies the introduction of intracanopy lighting has shown increases in fruit biomass, however an alternative to HPS lights will be needed for this type of lighting (Gomez et al., 2013). HPS lights are not the most photosynthetically activating lights as they lack high percentages of red and blue and are stronger in the orange and green regions of photosynthetically active radiation (PAR) (Nelson, 2012) (Appendix III). Light-emitting diodes (LEDs) are a possible solution to the problems HPS lights have in greenhouses. LEDs are a solid-state light source which have been increasingly thought of as a potential supplement or replacement to HPS lights in greenhouses (Bula et al., 1991; Morrow, 2008). LED lighting has an added advantage over HPS lighting in the fact that they are more energy efficient (Bergh et al., 2001; Nelson & Bugbee, 2014). LED lighting systems have also grabbed the attention of growers for their possible use as intracanopy lighting due to their cool face emitting light source (Massa et al., 2008). This temperature regulation by the LED light
15 3 source allows them to be placed very close to the plant tissue without causing harm such as burning which has been identified with HPS lights. Unlike the broad spectrum properties of HPS lighting, LED lights are able to have either broad spectrum light quality, or very narrow, wavelength specific spectral quality (Nakamura et al., 1994; Goins et al., 1997; Nakamura, 1997) (Appendix III). Having the capability to provide very narrow wavelengths to plants is one of the most useful properties of LED lights as it is known photosynthesis is driven by certain colours better than others, as described previously (Mackinney, 1940; Sæbø et al., 1995). Light quality and its effects of plant function will be discussed in the sections below. LED lighting systems have already been shown to be sufficient to grow plants in growth chambers, greenhouses, and in tissue cultures (Hoenecke et al., 1992; Tanaka et al., 1998; Jao et al., 2005). However, the way in which LED lights are best used, and their usefulness in different crops is still undetermined. Some studies have found that the combination of LED and HPS overhead lighting is most cost effective when taking into account heating cost, while others say there is no effect of production while using overhead HPS lighting and intracanopy LED lighting (Touwborst et al., 2010; Dueck et al., 2012). Newer generations of LED lighting systems are being designed continuously. One of the many attributes of LED light is its decreased energy consumption over the conventional HPS lighting system. However, LED lighting fixtures are relatively expensive to purchase running upwards of five times that of an HPS light (Nelson & Bugbee, 2014). This cost, however, is seen to reduce due to three key factors of the LED lighting systems: 1) longevity, 2) energy efficiency, and 3) light placement (Nelson & Bugbee, 2014). It is reported by Nelson & Bugbee
16 4 (2014), that LED lights can last a predicted life of up to 50,000 hours of operation while still maintaining 70% of their original light output. HPS lighting on the other hand, are only reported to last between 10,000 and 17,000 hours (Nelson & Bugbee, 2014). 1.2 Light Spectral Quality Certain wavelengths of light have already been shown to preferentially activate photosynthesis (Mackinney, 1940). Specific wavelengths of light have also been shown to change morphologies, genetic response, and chemical compound formation in plants, bacteria, and mammals (Liu et al., 2011b; Liu et al., 2012; Bellasio & Griffiths, 2014; Kim et al., 2014; Deniz et al., 2015). In this section, the effects of the main LED wavelengths which are currently being produced for plant growth, red, blue, and green, will be discussed Red Light Red (R) light is the region of visible light between approximately nm and thus, has the lowest energy associated with any colour of the visible spectrum. Red light is readily absorbed by Chl a and Chl b (Mackinney, 1941). Red light has been used to study plant growth on a wide variety of plants including peppers, lettuce, cucumber and tomatoes with varying results (Brazaityte et al., 2010; Hogewoning et al., 2010; Lin et al., 2013; Gomez & Mitchell, 2015). Grown under an all R light, cucumber plants showed a reduced photosynthetic rate, stomatal conductance and internal leaf CO2 concentration compared to plants subjected to R and blue (B) light treatments. Similar results were also found when using rice and wheat when grown under solely red light (Goins et al., 1997; Matsuda et al., 2004). These findings lead to the conclusion that growing plants solely under R light is not an optimal light treatment (Hogewoning et al., 2010). However, a more recent study has
17 5 shown that Komeett tomatoes seedlings grown in ambient conditions with R supplemental lights, grew normally (Hernandez & Kubota, 2012). Red light has also known to affect tomato morphology. It has been reported to increase stem elongation but decrease overall plant biomass and leaf area from white (W) light control tomato plants (Liu et al., 2011a; Liu et al., 2012). Leaf colour has also been noted to change when under different lighting sources leaving R illuminated tomato leaves to be a lighter green (G) colour as well as visibly different leaf anatomy. This lighter colour was likely due to a decrease in both Chl a and Chl b content found in those leaves under certain light treatments (Liu et al., 2012). In addition to a change in overall leaf morphology and chlorophyll content, leaf antomy was also changed by light. Red light produced statistically less stomata/mm 2 than B, G, redblue (RB) and red-blue-green (RBG) light and produced roughly the same amount of stomata as a dysprosium light control and orange (O) light grown plants (Liu et al., 2012). However, the area covered by a stomata was statistically among the highest values determined under all light treatments suggesting larger individual stomata (Stomatal area= π((length of stomata)(width of stomata))/4) (Liu et al., 2011b). Plants grown under R light were also seen to have among the thinnest leaves out of the possible light treatments and also have significantly shorter palisade cells then all other light treatments tested (Liu et al., 2011b). Studies using R light irradiated Arabidopsis seedlings have also shown changes in gene transcription levels (Tepperman et al., 2004; Casal & Yanovsky, 2005). Tepperman et al., (2004) have done an extensive study on gene repression and induction in Arabidopsis. It was determined that multiple genes coding for a range of cellular machinery from transcription
18 6 factors to chloroplast to cell defense are effected by R light (Tepperman et al., 2004). Not only did they show that R light effected different families of genes differently, it was also shown that genes within the same family are effected differently (Tepperman et al., 2004). For example, it was shown that of genes transcribing for members of the cell defense family, 21 were induced by R light, while one was repressed (Tepperman et al., 2004). Time under irradiance also effected transcriptions levels and it was found that of those same cell defense genes increased to 43 induced and 27 repressed under longer irradiance times (Tepperman et al., 2004) Blue Light Blue light ( nm), like R light has been known for decades to be a highly absorbed colour by Chl a and Chl b (Mackinney, 1940). The addition of B light to a light treatment has shown an increase in carbon assimilation as well as stomatal conductance with even very low B light input (Hogewoning et al., 2010; Lee et al., 2013). This increase was possibly due to the increase in chlorophyll production by leaves under only B lights or in combination with other colours such as R or G (Liu et al., 2012). This increase was also evident by a darker G colour found in the leaf visually showing a higher chlorophyll content. Morphologically, tomato plants grown strictly under B light, or in combination with B light tend to be shorter than light treatments which are lacking B light (Liu et al., 2010; Liu et al., 2012; Lee et al., 2013). However, these same plants showed significantly higher fresh and dry weights than other light treatments (Takemiya et al., 2005; Liu et al., 2010; Liu et al., 2012). Blue light, whether in combination with other colours or by itself was also seen to significantly increase leaf thickness and specifically increase the palisade cell length (Liu et
19 7 al., 2011b). However, it was noted by the authors that spongy mesophyll layers in the B and RBG treatments were observed to be disorganized compared to other light treatments (Liu et al., 2011b). Light intensity has been known to increase the number of palisade layers with a high light intensity (360 µmol m -2 s -1 ) producing two or three levels and a low light intensity (60 µmol m -2 s -1 ) only producing one (Yano & Terashima, 2001; Tsukaya, 2005). However, in the study done by Liu et al., (2011b) light levels between the treatments were the same (320±15 µmol m -2 s -1 ) so it is unlikely light intensity played a factor in palisade cell length. Thus, there may have been a transcription induction which was causing longer palisade cells to be produced. Also noted by Xiaoying et al. (2012), was the increased production and area covered by stomata. The addition of B light, even in minimal quantities is essential for normal plant growth (Hogewoning et al., 2010). Some studies have shown that yield response in wheat, Arabidopsis, spinach and lettuce plants, increased with even a 1% addition of B light (Goins et al., 1998; Yorio et al., 1998). These results have also been seen in fruit producing crops such as tomatoes and cucumbers (Menard et al., 2006). However, supplemental B light was introduced via intra-canopy lighting and no statistical evidence was provided to prove that increases in yield were produced due to the B light supplementation or due to the position of lights (Menard et al., 2006).
20 Green Light Green light ( nm) and its use in plant systems has been debated for some time. It has been known that it is among the least absorbed wavelength by plants and chlorophyll and due to this reflectance, we perceive plants as green (Mackinney, 1941). However, recent studies using G lighting have begun to challenge conventional thinking on what role it plays in plant growth. Plants do in fact have G light absorbing molecules. Phytochromes (Phy), Cryptochromes (Cry), and Chl are mainly B and R light absorbing molecules but studies have also found they are able to absorb G light (Steintiz et al., 1985; Banerjee et al., 2007). Tomato plants which are grown solely under G light show evidence that it does not efficiently excite chlorophyll by having an extremely low rate of photosynthesis (Liu et al., 2010; Liu et al., 2012). However, both of these studies also show that when G light is in combination with R and B, photosynthetic rates are at their highest, which in there lies the potential value of G light (Liu et al., 2010; Liu et al., 2012). Green light also produces the thinnest leaves when compared to other light treatments (Liu et al., 2011b). However when mixed with R and B, this effect was negated and in fact, the RBG treatment produced the thickest leaves (Liu et al., 2011b). On a stomatal basis, tomato plants solely grown under G light produced the smallest stomata on an area basis (Liu et al., 2011b). This feature was reflected in the stomatal conductance of plants grown under G light as they have a drastically lower rate than all other treatments (Liu et al., 2011b). A decrease in stomatal conductance was also seen in the RBG treatment when
21 9 compared to the RB treatment however there was no evidence of a decrease in photosynthetic rate (Liu et al., 2011b). Where G light has found its niche was when used as a supplemental source with R and B light. When used in combination, G light has been shown to increase plant biomass and leaf area in lettuce but this was not seen in young tomatoes plants (Kim et al., 2004a; Liu et al., 2010; Liu et al., 2012). In the young tomato plants, the canopy was not very dense thus all leaves may be illuminated by R or B light. However, the mature lettuce and tomato canopies cause shading or dark spots on the lettuce which will not be reached by R or B light. Since G light was reflected more than other lights, it may be able to bounce around the canopy and be absorbed by these dark spots (Kim et al., 2004a; Liu et al., 2010). Another theory deals with the transmission of light though multiple layer of cells or light scattering and bouncing around within cells in a leaf. In spinach and alfalfa leaves, it was seen that R and B light were absorbed in early stages of the leaf (<150µm) (Vogelmann et al., 1989; Vogelmann, 1993; Sun et al., 1998). This allows G light to reach a whole other layer of chloroplast which R and B light treatments are not able to adequately reach (Sun et al.,1998). 1.3 Photosynthesis and Carbon Partitioning Photosynthesis is the process in which all plants and some bacteria are able to convert light energy from the sun or an artificial light source into chemical energy, adenosine triphosphate (ATP) and nicotinamide adenine dinucleotide phosphate (NADPH) with the end goal of forming carbohydrates needed for plant growth. Leaves are usually thought of as the only photosynthetically active tissue in a plant system however, it has been known for quite some time that any chlorophyll containing tissue is able to photosynthesize (Steer &
22 10 Pearson, 1976). Although, leaves have been shown to provide approximately 80% of all photosynthetic activity, stems, petioles, and even the fruits of some plants have been shown to provide anywhere from 1-14% of photosynthetic activity depending on plant species (Steer & Pearson, 1976; Chauhan & Pandey, 1984; Hetherington et al., 1998). In Arabidopsis the inflorescence, or the non-leafy shoot area, has been shown to contribute approximately 70% of the photosynthetic activity when the plant is at a mature stage (Leonardos et al., 2014) In tomatoes, about 15% of the total photosynthetic rate has been seen to be produced by non-leaf structures (Hetherington et al., 1998). In tomatoes specifically, the main components produced via carbon fixation are starch and sucrose (Osorio et al., 2014). Along with the these main carbohydrates, tomato leaves are also able to produce hexose sugars such as glucose and fructose, sugar alcohols such as mannitol and inositol, as well as other simple sugars such as arabinose and mannose (Schauer et al., 2005). Previous literature indicates carbon partitioning to be a highly regulated process but it also varies wildly between species and even within species based on environmental factors such as salinity, temperature, and nutrient availability (Balibrea et al., 2000; Lemoine et al., 2013; Sung et al., 2013). Light period has shown a significant effect in starch accumulation rate in tomato leaves once beyond a 16h light period (Logendra et al., 1990). Once the tomato plants were illuminated for 20h, the rate of starch accumulation was halved when compared to a 16h or 8h light period (Logendra et al., 1990). This drop in accumulation rate was not seen in hexose or sucrose during these time periods with the exception of a slight drop in the hexose accumulation rate from 8h to 16h (Logendra et al., 1990).
23 11 However, there is a lack of research comparing different light qualities (wavelengths) and the partitioning rates of carbohydrates. One study using radish plants which were grown under different light treatments with the addition of far-red light produced higher values of sucrose, hexose and other soluble sugars when compared to plants grown under just white light (Keiller & Smith, 1989). However, starch followed the opposite pattern and a higher level of starch was seen in plants grown solely under W light which correlates with the total dry weights of the plants which shows white light producing larger plants (Keiller & Smith, 1989). These results held true for both 14 days and 26 days after the treatment was started (Keiller & Smith, 1989). There is a very clear knowledge gap in the literature about how wavelength specific lighting is able to effect sugar partitioning in tomato leaves. 1.4 Carbon Export Export of carbohydrates made from source tissue to growing sink tissue is a major factor controlling plant development (Osorio et al., 2014). According to some studies, 80% of fixed carbon can be exported by a mature leaf (Lemoine et al., 2013). This can happen via immediate export of sucrose from the source leaf during the day, from the breakdown and mobilization of starch under low irradiance or during the night period, or the mobilization of sucrose fromm storage (Grange, 1985). Sugar export was shown to not be consistent between species, however, evidence has shown that tomatoes, cotton, and sugarbeet carbon export is closely correlated with the source sucrose pools (Ho, 1976; Hendrix & Huber, 1986; Fondy et al., 1989). Export is able to happen via two pathways: symplastic loading which does not need facilitator proteins and apoplastic loading which does require enzymatic help. Several factors determine the method of phloem loading which is used by a plant (i) the organization of cells surrounding the
24 12 phloem, (ii) the existence of transporter proteins, (iii) the existence of sucrose uptake transporters in the phloem, (iv) and the existence of a concentration gradient between the mesophyll cells (MCs) and the phloem itself (Zimmermann & Ziegler, 1975; Gamalei, 1989; Sauer & Stolz, 1994; Nadwondnik & Lohaus, 2008). Tomatoes have been determined to be apoplastic loaders via the use of invertase, an enzyme which is able to hydrolyze sucrose, stopping the transport of sucrose into the phloem (Dickinson et al., 1991). The absence of phloem loading while invertase was present was determined to be due to the fact that the sucrose specific transporter involved was not able to recognize the hydrolyzed sucrose and thus not able to transport it and thus determining that tomatoes are apoplastic loaders (Dickinson et al., 1991). During both apoplastic and symplastic loading, sucrose moves through plasmodesmata from the MCs to the phloem parenchyma cells (PPCs) (Aoki et al., 2011). Until recently, the mechanism of sucrose transport into the apoplast from the PPCs has been unknown (Aoki et al., 2011). An enzyme from the family known as sugars will eventually be exported transporters (SWEET) has been determined to be responsible for the transport of sucrose from the PPCs to the apoplast (Chen et al., 2012). These SWEET proteins have been found in tomatoes via a structurally conserved domain analysis of its genome which leads more evidence to identify tomatoes as an apoplastic loading species (Feng et al., 2015). Once sucrose has been moved into the apoplast by a SWEET enzyme, it has two routes to enter the phloem. Both pathways involve a membrane bound sucrose transporter enzyme (SUC; also found in literature as SUT) in order to pump sucrose against its concentration gradient with the end goal being phloem loading. SUC was found to be ubiquitous in all apoplastic loading plants (Sauer et al., 2004; Hackel et al., 2006; Sauer, 2007). Structurally,
25 13 SUC has been studied with the use of antibody detection, and hydrophobicity analysis to show that it contains 12 hydrophobic regions which allows it to form a porin like structure for sucrose to be moved through (Stolz et al., 1999). These SUC transporters can be found either on the phloem allowing sucrose to directly enter, or be on a transfer cell (TC) where sucrose then moves through plasmodesmata into the phloem (Aoki et al., 2011). Whichever route was taken, sucrose will be pumped against its concentration gradient and was coupled with the movement of a proton (H + ) in a 1:1 stoichiometry (Boorer et al., 1996; Aoki et al., 2011). In order to keep the H + gradient higher in the apoplast, H + -ATPase was also found on TC membrane and the phloem membrane which hydrolyze an ATP molecule in order to transport H + from the cytoplasm of the cell against its concentration gradient, making apoplastic loading an energy consuming process (Sondergaard et al., 2004; Aoki et al., 2011). Export rates have been shown to change in response to multiple factors. They have been shown to follow a similar function as photosynthetic rates, that is, as photosynthetic rate increases, as does export and vice versa (Jiao & Grodzinski, 1996; Leonardos et al., 1996). Export rates have also been shown to fluctuate with temperature. At physiological conditions (400 µmol m -2 s -1 and 21% O2) export was seen to decrease as temperature increased above 20 C and in a study involving Alstroemeria, export was virtually non-existent at temperatures greater than 35 C (Jiao & Grodzinski, 1996; Leonardos et al., 1996). This phenomena was likely due to the increase of the oxygenase activity of Rubisco due to the lowering of the CO2/O2 specificity of the enzyme when temperatures increase (Stitt & Grosse, 1988). Cooling of plants also has an effect on export rates. Studies have shown that when plants are transferred from a normal growth temperature of 20 C to a 12h period of 5 C, export rates were drastically decreased from control plants which was mirrored by a drastic
26 14 decrease in photosynthetic rate (Jiao & Grodzinski, 1996; Leonardos et al., 1996; Leonardos et al., 2003). Multiple studies have also dealt with modifications or environmental factors which can effect components within the apoplastic phloem loading pathway which was found in tomatoes. Wounding of Arabidopsis plants has shown to produce an increased expression of the sucrose transporter AtSUC3; while under water stress, spinach leaves showed an increase in sucrose synthesis by activating sucrose-phosphate synthase (SPS) (Quick et al., 1989; Meyer et al., 2004). However, neither study tries to identify whether these results lead to a change in the export rate from either plant species. One notable gap in the literature is the effect light quality has on carbon partitioning and export. Research which will be discussed in this dissertation will try to elucidate this relationship. 1.5 Hypothesis and Objectives The processes which happens during photosynthesis and phloem loading leading to carbon export are well established. However, knowledge on how these processes are affected by light quality is sparse, especially for carbon partitioning and export. My hypothesis is that using wavelength specific LED lighting, photosynthesis and export can be altered solely due to spectral quality and light intensity. The main objectives of my thesis was to examine the response of young tomato seedlings on the basis of whole plant gas exchange and water use when exposed to various LED treatments and a standard HPS light. Also, to examine the effects wavelength specific lighting has on carbon export and partitioning ratios within tomatoes. By accumulating knowledge on these topics, the effect of spectral quality on greenhouse tomato production can be determined.
27 Thesis Overview In order to test the effect of spectral quality on tomato production, whole plant gas exchange was conducted which allowed for the diurnal patterns of whole tomatoes to be determined when exposed to different spectral qualities of light. Also, 14 C labelling studies were performed on a sole source tomato leaf when illuminated with various wavelength specific LEDs at a wide range of light intensities to determine carbon export as a function of photosynthesis and carbon partitioning patterns. In chapter 2, the objective was on whole plant net carbon exchange rate (NCER) and leaf gas exchange measurements on greenhouse grown plants under supplemental or no supplemental lighting during the winter months in Guelph, ON, Canada. Tomatoes were grown under either 100±25 µmol m -2 s -1 of light from HPS, RB LED, or RW LED or an ambient control. Whole plant and leaf gas exchange experiments helped to elucidate the effects of different types of supplemental lighting on diurnal gas exchange. Leaf studies helped determine the effects of the different types of supplemental lighting on the main photosynthetic machinery of the plant. In Chapter 3, whole plant and leaf parameters such as NCER, transpiration rate, stomatal conductance, and internal CO2 concentration were examined. Plants which were grown under W light were used at a vegetative stage and two different light levels during whole plant experiments to determine direct effect of HPS, RW LED, and RB LED lights on nonacclimated plants. Plants grown in the same way were subject to leaf light curves with wavelength specific LEDs. Using various monochromatic and dichromatic LED lights allowed
28 16 for the determination of any differences between the aforementioned parameters under short term illumination of the main photosynthetic machinery. In Chapter 4, the objective was to elucidae the effect of spectral quality on carbon export and carbon partitioning patterns. With plants grown under W light, the effects of wavelength specific LEDs were tested with the help of 14 C to trace sugar production. Individual leaves were placed in a chamber which were then illuminated with an LED light, leaving the rest of the plant in darkness to ensure that leaf was the sole source of carbohydrate pools for the plant. By varying the light intensity and creating photosynthetic vs. export graphs any differences in export over the full photosynthetic capability of the leaf can be examined. Carbon partitioning patterns as light levels increase can also be determined to elucidate whether carbon is preferentially partitioned into soluble sugars or starch by different wavelengths or light intensities. Chapter 2 The Effect of HPS and Wavelength Specific LED Lights on Whole Plant and Leaf CO2 and H2O Gas Exchange and Growth Parameters Under Longterm Acclimation of Solanum lycopersicum cv. Bonney Best 2.1 Introduction Greenhouse supplementary lighting via HID lights such as HPS lighting has shown an increase in crop productions in both vegetable and ornamental industries (McAvoy & Janes, 1984; Oh et al., 2009). During the cold winter months, the use of supplemental light allows for the DLI to be increased as well as the heat added to the greenhouse have accounted for
29 17 an increase in yield (McAvoy & Janes, 1984). Although the current staple is HID lighting, there is a strong push towards LED implementation of lighting systems in greenhouse production. LED lights have the advantage of being low heat emitting as well as more energy efficient (Nelson & Bugbee, 2014). In this chapter, tomato plants grown in a greenhouse during the winter months in Guelph, Ontario, Canada under various supplemental lighting regimes will be compared. Both whole plant, and leaf growth parameters will be determined to see the effect of the supplemental treatment has on plant growth and overall biomass production. The objective was to determine if the use of wavelength specific LED lighting systems provides an advantage during the winter growing season over conventional HPS lighting. 2.2 Materials and Methods Plant Materials and Growth Conditions Bonny Best (BB) cultivar of S. lycopersicum were purchased from William Dam Seeds (Dundas, ON, Canada). Seeds were sown into 60 cavity potting trays (The HC Companies, Middlefield, OH, USA) in Sungro professional growing mix #1 (Soba Beach, AB, Canada) containing Canadian sphagnum peat moss, coarse perlite, dolomitic limestone, and a fertilizer pre-charge on December 22 nd, 2015 and March 3 rd, Plants were transferred to larger 1L pots (The HC Companies, Middlefield, OH, USA) with Sungro growing mix and placed in the greenhouse at the University of Guelph (43 31' " N, 80 13' " W) on January 21 st, 2016 and March 23 rd, 2016 respectively. 20 plants were arranged in a complete randomized block design on growing tables under either Red-Blue LED (100±25 µmol m -2 s -1 ), Red-White LED (100±25 µmol m -2 s -1 ), or HPS (100±25 µmol m -2 s -1 )
30 18 supplemental lighting and an ambient, no supplemental light control (Appendix III; Table 2.1). Supplemental lighting from LEDs were provided from 390W fixture made by The Light Science Company (LSGC; Warwick, RI, USA) and HPS lighting from a 1000W HPS lights from Philips (Markham, ON, Canada), Plants under supplemental lighting received light from 6am to 10pm via a combination of sunlight and additional lighting whereas ambient conditions received light only during the sunlight hours. Light reaching the plants never exceeded 500±50 µmol m -2 s -1 under ambient conditions. Temperatures were held to 20 C throughout the day and night. Ambient HPS RB HPS Ambient RW RB Ambient RW RB RW HPS Figure 2.1: Schematic showing light treatment placement for both greenhouse planting dates. RB= Red-blue, HPS= High pressure sodium, RW= Red-White. Plants which were started on December 22 nd, 2015 were grown until March 3 rd, 2016 in which they were destructively analyzed leaf area using a leaf area meter (LI-3100, LI-COR, Lincoln, NE, USA). Roots were washed until dirt and particle free and were dried in an oven at 70 C in order to determine dry biomass of roots, leaves, stems, and flowers. Plants which were started on March 3 rd, 2016 we subject to leaf and whole plant parameters described below Whole Plant Gas Exchange Whole plant growth experiments began on April 7 th, 2016 and continued through April 25 th, 2016 alternating between plants from treatments under supplemental night and those under ambient conditions. Three plants were placed in each chamber on April 7 th, two plants
31 19 were placed in each chamber on April 9 th and 11 th and only one plant was placed in the chamber from the remainder of the experiments due to the growth of the plants. A whole plant gas exchange system allows the monitoring of gas exchange and water use of the whole plant system rather than just an individual leaf. The custom built system resembles an earlier design used by Dutton et al., (1988). The system is controlled by LabView 2009 (National Instruments Canada, Vaudreuil-Dorion, QC, Canada) and runs on a Dell, Precision 490 (Dell Computers, Round Rock, TX, USA) computer. This systems allows for the full control of CO2 concentration within the chambers, relative humidity control, temperature control, and light intensity. The system employs six chamber made of clear polycarbonate plant chambers which measure 32 x18 x18 with a glass top giving a total chamber volume of 200L. During experiments with smaller plants, boxes of known volume can be used to decrease chamber volumes which was needed to insure CO2 depletion is within the systems limits. Two chambers are illuminated by 390W RW LED fixtures from LSGC, two chambers are illuminated with 390W RB LED fixtures from LSGC, and two chambers are illuminated with1000w HPS lights from Philips (Apendix III; Figure 2.2A). LED lights have a dimmable setting which allows for the light intensity to be variable, HPS light intensity can be varied by lifting the lights higher away from the chambers or by adding shade clothes to the top of the chambers. Chambers which are illuminated by HPS lighting have water baths placed between the light and the chamber in order to avoid overheating of the chamber. All chambers were wrapped with aluminium foil on the outside to prevent light from other lights from entering the chambers and to prevent light loss lower in the chambers.
32 20 Light intensity was determined by placing Li-COR quantum sensors (LI-190SA, Li-COR Inc. Lincoln, NE, USA) at the top of the plant canopy. Once light intensity was set, the chambers are sealed with a clear polycarbonate door held on by 16 wing nut screws which are tightened
 Overview of the whole plant gas exchange system")

 which is responsible for")
 Individual chambers with tomato plants sealed inside.")
33 21 A CU CCR B Figure 2.2: (A) Overview of the whole plant gas exchange system showing six individual chambers with various light treatments over them. Computer control (CU) system is shown as well as the climate control radiators (CCR) which is responsible for holding temperature and humidity within the chambers. (B) Individual chambers with tomato plants sealed inside. to provide and air tight seal (Figure 2.2B). The system has two modes of use, an open and
34 22 closed mode. Firstly, Compressed air generated by the University of Guelph was scrubbed free on any CO2 by a purge gas generator (CO2 Adsorber, Puregas, Broomfield, CO, USA). CO2 was then added back into the system in the desired concentration in that particular experiment. The mixed air was then pumped through a series of stainless steel piping and solenoid valves (ASCO RedHat II, Florham Park, NJ, USA) to the chambers. CO2 and relative humidity levels are checked every 20 seconds in sequential chambers (1 to 6) by an infrared gas analyzer (IRGA; Li-COR CO2/H2O Gas analyzer 840, Lincoln, NE, USA) in the open mode meaning solenoid valves on the air inlet lines and outlet lines were in the open position allowing for the determination of adjustment levels. In the closed mode, the inlet and outlet solenoid valves are set to the close position which isolates the CO2 within the chamber. The chambers can then be sampled for the depletion of CO2 within the chamber by a second IRGA (Li-COR CO2/H2O Gas analyzer 840, Lincoln, NE, USA). The sampling takes place for 90 seconds with the first 30 seconds being used to flush the line to prevent carry over from the previous chamber. The next 60 seconds sampling period was used for the net carbon exchange rate calculation (Equation 2.1) where Vol is the chamber volume (L); Ci is the initial CO2 concentration during NCER measurement (µl L -1 ); Cf is the final CO2 concentration (µl L -1 ); s the gas constant (L K -1 mol -1 ); T is the temperature of the chamber air ( K); and Δt is the elapse time during sampling (s) (Dutton et al., 1988). Equation 2.1: NCER = Vol(Ci Cf) T t
35 23 Long term acclimation experiments using plants from the greenhouse were placed in chambers with the same spectral quality they were grown under. Plants which were the ambient light control treatment were subject to whole plant measurements under all three lighting conditions used in the whole plant system. Plants were randomly selected from the blocks for experimentation. The photoperiod was set to 16/8h with a light level of 500±10 µmol m -2 s -1 at canopy level. Relative humidity was held constant at 55±5% during the day and night period and temperature was set to 22/18 C respectively. Plants were placed in their respective chambers around 3pm and allowed to acclimate for the rest of the day and night period. The following morning, lights would come on at 6am and shut off at 10pm giving a 16h photoperiod. NCER would be recorded for that day and night and used in analysis. The next morning, plants were taken out of the chambers and their leaf area would be determined using a leaf area meter. The roots were then washed of the dirt and leaves, stems, and roots were dried in an oven at 70 C for 48h. Samples were then weight and data was normalized on a plant, dry weight, and leaf area basis.

36 Leaf Gas Exchange Leaf CO2 and H2O gas exchange studies began on April 14 th, 2016 and continued through April 17 th, Freshly watered plants were taken away from their light treatment to a neutral area for analysis. The 5 th highest, most distal leaflet was used for analysis. The leaf was placed in the chamber of a Li-COR 6400 portable unit (Lincoln, NE, USA) with a RB light source from Li-COR (Figure 2.3.). The relative humidity was held steady at 65±5% by passing the incoming air through a desiccant. The CO2 concentration was held steady at 415±10 µmol m -2 s -1 by using Soda Lime. A light curve was produced by using the Li-COR 6400 auto curve feature with a 120s minimum time and 240s maximum time starting from a high light intensity and decreasing incrementally down to no light. Figure 2.3: Li-COR 6400 portable unit set up for greenhouse leaf measurement with the red-blue light source on top of the chamber containing the leaf.
37 Results Supplemental lighting proved to provide an increase in biomass production during the winter months in tomato plants (Figure 2.4; Table 2.1). Plants grown under both RB and RW LED supplemental provided an average increase of 10g and 4g in biomass production over the HPS light treatment however this difference was not significant when analyzed with a one-way ANOVA and a Tukey-Kramer adjustment (p<0.05). Supplemental lighting also provided significant increases in both leaf area and flower bud numbers over the ambient control (Table 2.1). Plants grown under the RB treatment showed the highest number of flower buds on average and showed a 27% and 17% increase in number of buds formed compared to HPS and RW treatments respectively. Again, these results were not statistically significant (p<0.05) (Table 2.1).
38 Figure 2.4: Plant biomass measurements done on March 4 th, 2016 of plants which were planted on December 22 nd, 2015 and subject to supplemental light treatments during the winter months in Guelph, ON, Canada. RB= red-blue LED, HPS= high pressure sodium, RW= red-white LED. Each supplemental light treatment provided 100±25 µmol m -2 s -1 of light. Error bars represent ± the standard error of 6 replicates, 2 taken from each block.
39 50 40 Dry Weight (g) Ambient RB HPS RW Ambient RB HPS RW Ambient RB HPS RW Ambient RB HPS RW Ambient RB HPS RW Root Stem Leaf Flower Total
40 Table 2.1: Physical growth measurements taken from tomato plants grown under supplemental lighting in a greenhouse in Guelph, ON, Canada which were planted on December 22 nd, 2015 and analyzed on March 4 th, Each value represents the average of 6 different plants. Values in parentheses represent ± standard error and letter group (a, b) represents statistical differences within the row as determined by a one-way ANOVA and a Tukey-Kramer adjustment (p<0.05). Statistical analysis found in Appendix IV. Light Treatments Ambient Red-Blue HPS Red-White Root Weight 1.07(0.11) a 2.37(0.11) b 2.09(0.07) b 2.20(0.06) b (g) Stem Weight 9.05(0.94) a 21.13(1.27) b 17.15(1.10) b 18.54(1.11) b (g) Leaf Weight 10.63(1.07) a 25.26(1.71) b 20.21(1.24) b 22.57(1.29) b (g) Flower Weight 0.15(0.02) a 0.51(0.04) b 0.42(0.07) b 0.40(0.06) b (g) Total Weight 20.90(2.11) a 49.27(3.08) b 39.87(2.39) b 43.70(2.45) b (g) Leaf Area (m 2 ) 0.49(0.03) a 0.80(0.03) b 0.78(0.03) b 0.77(0.04) b # Flower Buds 36(5) a 127(6) b 100(5) b 118(11) b Figure 2.5A, C, and E show the diurnal gas exchange patterns of plants grown in a greenhouse under supplemental lighting when analyzed under the same light in the whole plant system. Plants grown under ambient conditions were analyzed under either RB LED, RW LED, or HPS lighting (Figure 2.6). The ambient grown tomato plants which were placed in the whole plant system under HPS lighting produced the highest average day time photosynthetic rates under a dry weight basis of normalization (Table 2.2). Plants which were grown under RW supplemental light in the greenhouse produced the lowest average day time photosynthetic rates of all treatments (Table 2.2). No statistical difference of respiration was determined from any treatment under any normalization (Table 2.2).
41 29 Although statistical differences were determined for the average day time photosynthetic rates between treatments, these did not translate into statistical differences in carbon accumulation during the 16h light period or the whole 24h day period (Table 2.2). When normalized on a per plant and leaf area basis, there was no statistical difference in day time photosynthesis or night time respiration between plants under supplemental lighting or ambient lighting when subject to the same lights during whole plant analysis (Figure 2.5A and C; Figure 2.6A and C; Table 2.2). However, when normalized on a dry weight basis, plants which were grown under the ambient control had statistically higher average day time photosynthetic rates than their counterparts grown under supplemental lighting when assessed under the same lights during whole plant analysis (Figure 2.5E; Figure 2.6E; Table 2.2). Plants grown under RB supplemental lighting provided statistically higher average day time whole plant transpiration rates than did ambient grown plants which were analyzed under HPS lighting (Table 2.3). This difference did not lead to a statistical difference in WUE under any light treatment (Table 2.3).
42 30 Figure 2.5: Whole plant NCER (A, C, and E) and C-budget (B, D, and F) of tomato plants grown in a greenhouse Guelph, ON, Canada from March 3 rd, 2016 to April 25 th, 2016 provided with 100±25 µmol m -2 s -1 of supplemental light from red-blue LED, HPS, or red-white LED lights. Plants were place in the whole plant NCER system under the same lights they were grown under with a light intensity of 500±10 µmol m -2 s -1 for 16h followed by an 8h dark period. Whole plant NCER and C-budget are normalized on a plant basis (A and B), leaf area basis (C and D), and a dry weight basis (E and F). Whole plant NCER points represent the hourly mean values ± the standard error of 9 replicates and C-budget lines represent the mean of 9 replicates.
43 31 NCER (µmol CO 2 plant -1 s -1 ) A B C-budget (C gain-c loss g C plant -1 ) NCER (µmol C m -2 s -1 ) C D C-budget (C gain-c loss g C m -2 ) NCER (µmol C g -1 s -1 ) E Red-Blue HPS Red-White F Red-Blue HPS Red-White C-budget (C gain-c loss g C g -1 ) :00:00 10:00:00 14:00:00 18:00:00 22:00:00 02:00:00 06:00:00 10:00:00 14:00:00 18:00:00 22:00:00 02:00:00 06:00:00 Time (hh:mm:ss) Time (hh:mm:ss)
44 32 Figure 2.6: Whole plant NCER (A, C, and E) and C-budget (B, D, and F) of tomato plants grown in a greenhouse in Guelph, ON, Canada from March 3 rd, 2016 to April 25 th, 2016 under no supplemental light. Plants were place in the whole plant NCER system under either red-blue LED, HPS, or red-white LED lights with a light intensity of 500±10 µmol m -2 s -1 for 16h followed by an 8h dark period. Whole plant NCER and C-budget are normalized on a plant basis (A and B), leaf area basis (C and D), and a dry weight basis (E and F). Whole plant NCER points represent the hourly mean values ± the standard error of 9 replicates and C-budget lines represent the mean of 9 replicates.
45 33 NCER (µmol CO 2 plant -1 s -1 ) A B C-budget (C gain-c loss g C plant -1 ) NCER (µmol C m -2 s -1 ) C D C-budget (C gain-c loss g C m -2 ) E F 0.4 NCER (µmol C g -1 s -1 ) Red-Blue HPS Red-White Red-Blue HPS Red-White C-budget (C gain-c loss g C g -1 ) :00:00 10:00:00 14:00:00 18:00:00 22:00:00 02:00:00 06:00:00 10:00:00 14:00:00 18:00:00 22:00:00 02:00:00 06:00:00 Time (hh:mm:ss) Time (hh:mm:ss)
46 34 Figure 2.7: Whole plant transpiration (A and C) and WUE (B and D) of in a greenhouse Guelph, ON, Canada from March 3 rd, 2016 to April 25 th, 2016 provided with 100±25 µmol m - 2 s -1 of supplemental light from red-blue LED, HPS, or red-white LED lights (A and B) or a no supplemental light control (C and D). Plants were place in the whole plant NCER system under either red-blue LED, HPS, or red-white LED lights with a light intensity of 500±10 µmol m -2 s -1 for 16h followed by an 8h dark period. Plants which were grown under supplementary light were placed under chambers which provided the same spectral quality of light. Transpiration and WUE points represent the hourly mean values ± the standard error of 7 replicates for plants grown under red-blue supplemental lighting, 6 replicates for plants grown under HPS, red-white supplemental lighting, and control plants placed under redwhite lighting during whole plant experiments, 4 replicates for control plants placed under red-blue lighting during whole plant experiments, 3 replicates for control plants placed under HPS lighting during whole plant experiments.
47 0.6 A B Transpiration (mmol H 2 O m -2 s -1 ) C D WUE (µmol CO 2 /mmol H 2 O) Red-Blue White Red-White Red-Blue White Red-White 0 06:00:00 10:00:00 14:00:00 18:00:00 22:00:00 02:00:00 06:00:00 10:00:00 14:00:00 18:00:00 22:00:00 02:00:00 06:00:00 Time (hh:mm:ss) Time (hh:mm:ss)
48 Table 2.2: The effect on whole plant daily average NCER and daily C-budgets on greenhouse grown tomato plants in Guelph, ON, Canada with 100±25 µmol m -2 s -1 of either red-blue, HPS, or red-white supplemental light or a no light control. Plants were place in the whole plant NCER system under either red-blue LED, HPS, or red-white LED lights with a light intensity of 500±10 µmol m -2 s -1 for 16h followed by an 8h dark period. Plants which were grown under supplementary light were placed under chambers which provided the same spectral quality of light. Values represent the day and night means of each parameter. Values in parentheses are ± the standard error of each mean and its respected replicates. Letters (a, b, c, d) represent statistical significance within rows as determined by a one-way ANOVA with a Tukey s-kramer adjustment (p<0.05). Statistical analysis can be found in Appendix IV.
49 CO2 Gas Exchange on a: With Supplemental Light Ambient Control Plant Basis Red-Blue HPS Red-White Red-Blue HPS Red-White Photosynthesis 1.44(0.03) c 1.64(0.03) ab 1.46(0.03) c 1.52(0.04) bc 1.70(0.04) a 1.44(0.03) c (µmol C plant -1 s - 1 ) Respiration -0.32(0.01) a -0.33(0.02) a -0.33(0.02) a -0.34(0.02) a -0.34(0.02) a -0.34(0.02) a (µmol C plant -1 s - 1 ) C-Gain (g C 3.66(0.43) a 4.15(0.50) a 3.70(0.45) a 3.84(0.42) a 4.30(0.58) a 3.65(0.40) a plant -1 ) C-Loss (g C 0.40(0.05) a 0.42(0.05) a 0.41(0.05) a 0.42(0.05) a 0.43(0.07) a 0.43(0.06) a plant -1 ) Daily C-Gain (g C 3.26(0.38) a 3.72(0.45) a 3.29(0.41) a 3.42(0.37) a 3.86(0.51) a 3.22(0.35) a plant -1 day -1 ) Leaf Area Basis Photosynthesis 6.81(0.14) ab 6.86(0.13) ab 6.40(0.12) bc 6.50(0.14) abc 7.01(0.14) a 6.03(0.13) c (µmol C m -2 s -1 ) Respiration -1.48(0.06) a -1.40(0.09) a -1.44(0.08) a -1.34(0.07) a -1.35(0.09) a -1.31(0.07) a (µmol C m -2 s -1 ) C-Gain (g C m -2 ) 17.25(0.94) a 17.39(0.61) a 16.22(0.63) a 16.48(1.33) a 17.76(1.20) a 15.29(1.41) a C-Loss (g C m -2 ) 1.88(0.06) a 1.78(0.06) a 1.82(0.08) a 1.70(0.06) a 1.71(0.08) a 1.66(0.08) a Daily C-Gain (g C m -2 day -1 ) Dry Weight Basis Photosynthesis (µmol C g -1 s -1 ) Respiration (µmol C g -1 s -1 ) 15.38(0.88) a 15.61(0.59) a 14.40(0.59) a 14.78(1.28) a 16.05(1.14) a 13.64(1.35) a 0.13(0.003) cd 0.13(0.003) bc 0.12(0.002) d 0.15(0.003) ab 0.16(0.003) a 0.14(0.003) bc (0.001) a (0.002) a (0.002) a (0.002) a (0.002) a (0.001) a
50 38 C-Gain (g C g -1 ) 0.32(0.02) a 0.34(0.02) a 0.31(0.02) a 0.37(0.04) a 0.40(0.04) a 0.34(0.04) a C-Loss (g C g -1 ) 0.035(0.002) a 0.035(0.002) a 0.035(0.002) a 0.038(0.002) a 0.038(0.003) a 0.036(0.003) a Daily C-Gain (g C g -1 day -1 ) 0.29(0.02) a 0.31(0.02) a 0.27(0.02) a 0.33(0.03) a 0.36(0.04) a 0.31(0.04) a
51 Table 2.3: The effect on whole plant daily average transpiration and WUE on greenhouse grown tomato plants in Guelph, ON, Canada with 100±25 µmol m -2 s -1 of either red-blue, HPS, or red-white supplemental light or a no light control. Plants were place in the whole plant NCER system under either red-blue LED, HPS, or red-white LED lights with a light intensity of 500±10 µmol m -2 s -1 for 16h followed by an 8h dark period. Plants which were grown under supplementary light were placed under chambers which provided the same spectral quality of light. Values represent the day and night means of each parameter. Values in parentheses are ± the standard error of each mean and its respected replicates. Letters (a, b, c, d) represent statistical significance within rows as determined by a one-way ANOVA with a Tukey s-kramer adjustment (p<0.05). Statistical analysis can be found in Appendix IV.
52 H2O Gas Exchange Day Transpiration (mmol H2O m -2 s -1 ) Night transpiration (mmol H2O m -2 s -1 ) WUE(µmol CO2/mmol H2O) With Supplemental Lighting Ambient Control Red-Blue HPS Red-White Red-Blue HPS Red-White 0.33(0.03) a 0.27(0.03) ab 0.29(0.02) ab 0.25(0.02) ab 0.22(0.02) b 0.28(0.02) ab 0.12(0.02) a 0.065(0.01) bc 0.10(0.01) ab 0.055(0.008) c 0.095(0.009) abc 0.058(0.008) bc 5.37(1.87) a 7.96(2.97) a 7.13(2.31) a 6.57(2.50) a 7.66(2.05) a 6.38(2.17) a
53 Leaf measurements were performed on the second population of plants which were seeded on March 3 rd, Although there was an apparent difference between the tomato plants which grew under supplemental lighting and those control plants on a photosynthetic basis towards the higher light region of the graph, there is no statistical difference (Figure 2.8; Appendix I: Figure 2.1). No statistical difference was observed for stomatal conductance, transpiration rates, or internal CO2 concentration with the exception of a statistical difference in stomatal conductance between the tomato plants grown under the red-white supplemental lighting and the no light control plants at a light level of 500 µmol m -2 s -1.
54 42 Figure 2.8: Light curves produced with the Li-COR 6400 portable unit and a red-blue standard light provided by Li-COR. Plants were grown in a greenhouse in Guelph, ON, Canada under 100±25 µmol m -2 s -1 of either red-blue, HPS, or red-white supplemental light or a no light control. Light curves were started at 1500 µmol m -2 s -1 and decreased incrementally to 0 µmol m -2 s -1. Points represent the means of 6 different leaf replicates and ± standard errors represent 6 separate leafs as replicates. Statistical analysis can be found in Appendix I.
55 15 NCER (µmol m -2 s -1 ) Ambient Red-Blue HPS Red-White PAR (µmol m -2 s -1 )
56 44 Figure 2.9: Leaf transpiration rate, stomatal conductance, and internal CO2 concentration curves produced with a Li-COR 6400 portable unit and a red-blue standard light provided by Li-COR. Plants were grown in a greenhouse in Guelph, ON, Canada under 100±25 µmol m -2 s - 1 of either red-blue, HPS, or red-white supplemental light or an ambient control. Light curves were started at 1500 µmol m -2 s -1 and decreased incrementally to 0 µmol m -2 s -1. Points represent the means of 6 different leaf replicates and ± standard errors represent 6 separate leafs as replicates. Statistical analysis can be found in Appendix I.
57 Stomatal Conductance (mmol H 2 O m -2 s -1 ) Transpiration (mmol H 2 O m -2 s -1 ) A B C C i (µmol mol -1 ) Ambient Red-Blue HPS Red-White PAR (µmol m -2 s -1 )
58 Discussion Effects of Supplemental Lighting on Whole Plant CO2 Gas Exchange The addition of supplemental light during the winter months, regardless of spectral quality, was shown to increase the average biomass production and flower production, eventually leading to a higher yield, in tomato crops (Figure 2.4; Table 2.1) (McAvoy & Janes, 1984; Demers et al., 1998; Oh et al., 2009). The underlying properties of adding supplemental light, namely the increase in DLI via an increase in light intensity during low light periods or a lengthening of the photoperiod, may account for this change (Demers et al., 1998; Hao & Papadopoulos, 1999). Increasing light intensity when ambient light levels are at a subsaturating level was able to increase photosynthetic rates due to the plants ability to use additional light during this low light period which is known as quantum efficiency (Trouwborst et al., 2010). Quantum efficiency is a measure of how much more CO2 can be fixed for every additional photon of light added. During this low light period, the addition of even small quantities of light were able to increase the CO2 fixation rate in a plant (Table 2.1). For example, if you take a light level of 100 µmol m -2 s -1 from sunlight and add 100 µmol m -2 s -1 via supplemental light, the photosynthetic rate was seen to double, giving plants under supplemental light a higher growth rate during identical ambient lighting conditions (Figure 2.8) (McAvoy & Janes, 1984; Demers et al., 1998; Hao & Papadopoulos, 1999; Oh et al., 2009; Trouwborst et al., 2010). This phenomenon extrapolated over multiple days, weeks, and even month will lead to the overall increase in biomass production of the plant which is seen in table 2.1.
59 47 An increase in DLI is essentially increasing the amount of light which the plant sees within a day. This can be done by either increase light intensity which was discussed above or by lengthening the photoperiod. During the winter months, days in Guelph, ON, Canada are relatively short and are not able to provide the optimal growing conditions. Supplemental lighting allows for the extension of the photoperiod to more optimal levels. This addition of light would also contribute to an increase in biomass production from the plants which were exposed to supplemental lighting (Demers et al., 1998; Oh et al., 2009; Currey & Erwin, 2011). Whole plant gas exchange measurements allow for the analysis of how a plant works as a whole organism, accounting for the small, but significant differences added by non-laminar plant tissue (Steer & Pearson, 1976; Chauhan & Pandey, 1984; Hetherington et al., 1998; Leonardos et al., 2014). Although both biomass production and leaf area are much less from the ambient control plants, plants produced statistically equivalent values during whole plant analysis to their supplemental light counterparts when analyzed under the same light (Table 2.1; Table 2.2). Due to the mutual shading from the plants when they become larger (ie. Plants grown under supplemental lighting) the differences which are seen by end of production biomass do not translate into measureable difference with the whole plant system. Plants grown under different light intensity generally have a higher photosynthetic rate at the light intensity they were grown at then plants which are grown under higher or lower light intensity (Bjorkman et al., 1972). This was likely because plants which are grown under higher light intensities usually have a higher abundance of RUBISCO than those grown under
60 48 low light conditions (Bjorkman et al., 1972). Although the light conditions for plants grown under supplemental lighting were only approximately 100 µmol m -2 s -1 greater than plants grown under the ambient control, these differences likely persist. For this reason it was surprising to see no photosynthetic differences between the plants grown under supplemental light and those grown under the ambient control (Figure2.5; Figure 2.6; Table 2.2). However, at such close grow light intensities the differences within the plant may be so slight that the whole plant system isn t sensitive enough to pick them up. Also the mutual shading effect which was previously discussed may negate any variation due to growth conditions Effects of Supplemental Lighting on Whole Plant H2O Gas Exchange In both plants grown under supplemental lighting and ambient control conditions, there was no difference in day transpiration rates with the exception of an increase in plants grown under RB lighting when compared with ambient plants analyzed under HPS lighting (Table 2.3). At first glance, these results may seem to be counter intuitive, simply due to the high heat emitting properties of the HPS light which should, in turn, increase stomatal opening and transpiration rates in C3 plants as well as decrease WUE (Gajc-Wolska et al., 2013; Kaminski et al., 2014). However, different spectral qualities such as R and B and the combination have been known to increase stomatal density and stomatal opening which can increase transpiration rates (Kana and Miller, 1977; Liu et al., 2011b; Liu et al., 2012). B light has been determined to activate the plasma membrane K + -ATPase enzyme on the stomatal guard cells via a phosphorylation event (Kinoshita and Shimazaki, 1999). This phenomenon allows for the increase of ions, primarily K +, to enter the guard cells and increase the osmotic
61 49 pressure leading to an increase in stomatal opening (Kinoshita and Shimazaki, 1999). Red light shows a similar relationship providing an increase in stomatal opening due to an increase in ATP hydrolysis causing an increase in K + and osmotic pressure (Lurie, 1978) Effects of Supplemental Lighting on Leaf CO2 Gas Exchange Leaf growth measurements gave an indication of what the main photosynthetic unit of the plant is doing under difference conditions. Plants which were grown under supplemental lighting all had slightly higher photosynthetic rates at the near-saturating and saturating light levels, however no statistical significance was seen (Figure 2.8). These observations give some confidence to previous observations made by Bjorkman et al., (1972) indicating that plants grown under higher light intensities, in this instance the ones grown under supplemental light, were seen to higher photosynthetic rates at higher light intensities. Plants grown under RB and RW supplemental lighting showed similar or slightly higher photosynthetic rates at higher light intensity which may be due to the increase in chlorophyll content (Data not shown) (Bjorkman et al., 1972; Liu et al., 2011a; Liu et al., 2011b). An increase in chlorophyll due to being grown under the lights would also allow them to absorb more light during the leaf measurements leading to a higher photosynthetic rates (Figure 2.8). These subtle variations in plant morphology and anatomy are what would be negated by mutual shading within the whole plant experiments and are better elucidated by the leaf studies.
62 Effects of Supplemental Lighting on Leaf H2O Gas Exchange Stomatal conductance, transpiration rates, and Ci within the leaf studies showed no statistical variation between the light treatments (Figure 2.9). Although differences were seen in the transpiration rates of the whole plant studies, those plants were analyzed under different lights and not only grown under different lights. Plants which were subject to leaf studies were grown under different light treatments but all analyzed under a RB light source provided by Li-COR. Stomatal opening is known to have a relatively quick response, thus doing the leaf experiment under the same light may alter the ion flux which controls stomatal opening in a similar way under all growth conditions and negating differences between growth treatments (Lurie, 1978; Grantz & Zeiger, 1986; Kinoshita and Shimazaki, 1999). Also, since the stomatal density of tomato plants grown under RB and RW lightings have shown to be similar, it was no surprise that those plants grown under those lights have close stomatal conductance and transpiration rates (Liu et al., 2011b). In summary, plant biomass production and flower bud formation was increased with the addition of supplemental lighting. Plants grown under ambient treatments showed higher daily Pn rates when normalized on a dry weight basis when compared to plants grown under supplemental lighting which is likely due to the increase in mutual shading of the larger plants from the supplemental light treatments (Figure 2.1). An increase in the whole plant daily average transpiration rates was seen from the plants grown under RB lighting when compared to the ambient grown plants which were analyzed under HPS lighting. No statistical differences were seen between other treatments.
63 51 Chapter 3 The Effect of HPS and Wavelength Specific LED Lights on Whole Plant and Leaf Growth Parameters Under Short-term Acclimation of Solanum lycopersicum cv. Bonney Best 3.1 Introduction In Chapter 2, supplemental lighting from any source provided an increase in biomass production of greenhouse grown tomatoes during the winter months. However, when comparing plants grown under different lighting conditions, morphological changes which have come about due to the lights effectively make them different plants which doesn t allow for the comparison of what wavelength specific lighting effects in the short term (Liu et al., 2012). The use of wavelength specific LED lighting has been well documented and was shown to cause morphological and anatomical changes to plants when used as a sole or supplemental lighting source during plant growth (Liu et al.,, 2011b; Hernandez & Kubota, 2012; Lee et al., 2013). The study of such plants was extensive and have provided both CO2 and H2O gas exchange differences however the differences seen may be due to the changes enacted by long term exposure to the lights and not the lights themselves (Liu et al., 2010; Hernandez & Kubota, 2012; Liu et al., 2012; Lee et al., 2013). For this reason, it was important to study plants which have been grown under a broad spectrum W light then placed under wavelength specific lighting to determine if there was any direct effect from the light on sister plants.
64 52 In this chapter, a comparison of whole plant NCER and water use efficiency (WUE) will occur between HPS lighting, which is currently the standard for greenhouse supplementary lights, and two commercially available wavelength specific LED lights. Leaf growth parameters will also be studied on plants which have been grown in a broad spectrum W light then exposure to a variety of wavelength specific LEDs. The objective was to determine if wavelength specific lighting has a direct effect on whole plant or leaf growth parameters under short-term irradiance on plants which were identical. 3.2 Materials and Methods Plant Materials and Growth Conditions Bonny Best (BB) cultivar of S. lycopersicum were purchased from William Dam Seeds (Dundas, ON, Canada). Seeds were sown into 60 cavity potting trays (The HC Companies, Middlefield, OH, USA) in Sungro professional growing mix #1 (Soba Beach, AB, Canada) containing Canadian sphagnum peat moss, coarse perlite, dolomitic limestone, and a fertilizer pre-charge. Germination took place in a growth chamber (GC-20 Bigfoot series, Biochambers, Winnipeg, MB, Canada) with a temperature setting of 22/18 C with a 16/8h photoperiod under a clear plastic lid (The HC Companies, Middlefield, OH, USA) to aid in maintaining a high relative humidity (~85%). Plants were provided with 200±50 µmol m -2 s -1 PAR at the pot level. Once germinated, the plastic lid was removed and the relative humidity within the growth chambers was maintained 65±10%, ambient CO2 and a light level of 300±50 µmol m -2 s -1 PAR at canopy level. For the first 2 weeks after germination, plants were watered with raw water as needed and fertilized every 3 rd day with Miracle-Gro All-purpose with micronutrients (Scotts Canada Ltd., Mississauga, ON, Canada).
65 53 Plants were repotted into 2 x2 pots (The HC Companies, Middlefield, OH, USA) in Sungro professional growing mix #1, 2-3 weeks after germination and kept in the growth chamber at the same conditions stated as above. Plants were fertilized as needed with Miracle-Gro All-purpose with micronutrients. Plants were grown until the 31 day after planting (DAP) or the 50 DAP and were used for whole plant and leaf experimentation Daily Patterns of Whole Plant Gas Exchange Whole plant system design is identical to that states in chapter Two short term acclimation experiments using plants which were grown in growth chambers under W light, plants were randomly selected from a larger population. For the first experiment, four plants which were 31 DAP were put into each chamber. The photoperiod was set to 16/8h with a light level of 1000±25 µmol m -2 s -1 from either a HPS light, RB LED, or RW LED at canopy level (Appendix III). Relative humidity was held constant at 55±5% during the day and night period and temperature was set to 22/18 C. For the second experiment two plants which were 51 DAP. The photoperiod, relative humidity, and temperature were the same as the first experiment, however the light level was changed to 350±10 µmol m -2 s -1 1 from either a HPS light, RB LED, or RW LED which was the light intensity at the top of the canopy in the growth chambers at the beginning of the experiment (Appendix III). Plants were placed in their respective chambers around 3pm and allowed to acclimate for the rest of the day and night period. The following morning, lights would come on at 6am and shut off at 10pm giving a 16h photoperiod. NCER would be recorded for that day and night and used in analysis. The next morning, plants would be taken out of the chambers and their leaf area would be determined using a leaf area meter. The roots were

66 54 then washed of the dirt and leaves, stems, and roots were dried in an oven at 70 C for 48h. Samples were then weight and data was normalized on a dry weight and leaf area basis Induction of Leaf Photosynthesis - Wake Up Experiment Once plants reached the 40 DAP mark, wake up studies began. Plants were switched to an identical schedule as their growth schedule but the night period in the growth chamber was set to happen from 8am to 6pm. This was done to allow for plants to be in darkness during the time of day they were being used. Based on the knowledge from the whole plant experiments, it was known that respiration stayed constant throughout the whole night cycle so plants could be used throughout the night. However, the first hour of the night cycle was excluded and plants were not used during this period. Plants which were selected were taken out of the dark growth chamber and immediately had the most distal leaflet on the 5 th leaf from the top placed in the chamber of a Li-COR 6400 portable unit. The chamber head was equipped with a clear top which allowed for light to travel through it to the leaf. The air which was drawn into the machine is scrubbed free on CO2 by a purge gas generator. A set concentration of CO2 was Figure 3.1: Li-COR 6400 with a tomato leaf inside the chamber being illuminated by green light.
67 55 then pumped back into the air stream using liquefied CO2. The leaf temperature within the chamber was held at 22 C with a relative humidity of 50-60% and a CO2 level of 400 µmol m - 2 s -1 (Figure 3.1). w Lights which were used were PAR38 LED flood lights provided by LSGC and consisted of R, B, W, and a RB mixture (Appendix III). Lights were standardized with a Li-COR quantum sensor since the sensor which was in the Li-COR 6400 is a gallium arsenide sensor and lack the ability to detect all colours equally. With this knowledge, lights were set to a 1000 µmol m -2 s -1 light level which was deemed to be around the saturation point of each light. Leaves were left in the chamber until they reached their maximum photosynthetic rate at that light level. This experiment was repeated five time, each time using a new leaf and rotating through the different light colours Responses to Wavelength Specific Lighting - Light Curves Once plants reached the DAP stage, the generation of light curves begun. All plants were woken up in the growth chambers under a broad spectrum W light in order to fully prime the photosystems. Plants were then taken out of the growth chamber and placed into the leaf chamber of the Li-COR Again, the most distal leaf on the fifth leaf from the top was used for measurements. The chamber was set to the same parameters as that in section Wake Up Study. Each leaf will then go through a light curve under one single light without the chamber being opened. Light curves started at a 1500 µmol m -2 s -1 light level with the exception of the G light and O light (Appendix III), which due to technical issue could only reach a maximum light level of 800 µmol m -2 s -1 and 600 µmol m -2 s -1 respectively. This was done following the
68 56 protocol established for the automatic light curves in the Li-COR 6400 manual as well as those laid out by Evans & Santiago (2014). The light level was then decreased incrementally until the light was turned off. Readings were taken every 15 seconds and at each decreased light level, the leaf was allowed to acclimate to the light level until a steady photosynthetic level was achieved. At this time, the readings of approximately two minutes where averaged and taken as the photosynthetic level for that light level. These light curves were performed with three leaves for each of the different light colours (Appendix III), were averaged and those averages were used to create the light curves. 3.3 Results Whole Plant CO2 and H2O Gas Exchange at Saturating Light Level Figure 3.2 shows the diurnal whole plant net carbon exchange rates (Panels A, C, and E) and C-budgets (Panels B, D, and F) of tomato plants which were grown under identical W light conditions in a growth cabinet then subjected to a consecutive day/night period under either a 1000±25 µmol m -2 s -1 of RB LED, RW LED, or HPS light treatments in whole plant gas exchange chambers. This light level was deemed to be a saturating level via Figure 3.6. No significant differences were observed in the photosynthetic, respiration, or C-budgets between light treatments when the data was normalized on a plant, leaf area, or plant weight basis (Table 3.1). However, under all light treatments, a decrease in photosynthesis was seen to start around 4pm which provided a decrease of approximately 25% of the maximum hourly photosynthetic rate by the end of the light period (Figure 3.2A, C, and E). The average whole plant transpiration rate during the day of the RB light treatment was significantly higher than the other two treatments at a 1000±25 µmol m -2 s -1 light level
69 57 (Table 3.2). However, RB produced a significantly lower transpiration rate (35%) than the HPS treatment during the subsequent night period (Table 3.2). However, the average day time WUE was not significantly different between the treatments even though the RB treatment exhibits a 15% decrease from the other treatments (Table 3.2). Whole plant transpiration patterns follow that of photosynthesis during the day and exhibit a decreases around the 4pm mark as whole plant WUE shows the opposite trend and increases at that point in time as it is a function of the photosynthesis and transpiration (Figure 3.3).
70 58 Figure 3.2: Whole plant NCER (A, C, and E) and C-budget (B, D, and F) of tomato plants grown under W light and analyzed under RB, HPS, and RW light treatments with a light level of 1000±25 µmol m -2 s -1 respectively. Whole plant NCER and C-budget are normalized on a plant basis (A and B), leaf area basis (C and D), and a dry weight basis (E and F). Whole plant NCER points represent the hourly mean values ± the standard error of 4 replicates and C- budget lines represent the mean of 4 replicates.
71 59 NCER (µmol C plant -1 s -1 ) NCER (µmol C m -2 s -1 ) C A D B C-budget (C gain-c loss g C plant -1 ) C-budget (C gain-c loss g C m -2 ) NCER (µmol C g -1 s -1 ) E Red-Blue HPS Red-White F Red-Blue HPS Red-White C-budget (C gain-c loss g C g -1 ) :00:00 10:00:00 14:00:00 18:00:00 22:00:00 02:00:00 06:00:00 10:00:00 14:00:00 18:00:00 22:00:00 02:00:00 06:00:00 Time (hh:mm:ss) Time (hh:mm:ss)
72 Figure 3.3: Whole plant transpiration (A) and WUE (B) of tomato plants grown under white light then subject to a 16h light period under either RB, HPS, or RW light treatment with a light level of 1000±25 µmol m -2 s -1 respectively followed by an 8h dark period. Each RW point represents the hourly mean of 4 replicates ± the standard error. Each HPS and RB point represents the hourly mean of 2 replicates ± the standard error.
73 A Transpiration (mmol H 2 O m -2 s -1 ) B WUE (µmol CO 2 /mmol H 2 O) :00:00 10:00:00 14:00:00 18:00:00 22:00:00 02:00:00 06:00:00 Red-Blue HPS Red-White Time (hh:mm:ss)
74 62 Table 3.1: The effect of RB, HPS, and RW lighting at a light level of 1000±25 µmol m -2 s -1 respectively on whole plant NCER daily averages and daily C-budgets of tomatoes grown under white light. Each value for photosynthesis, respiration, and C-budget represent the mean of 4 values. Each value for transpiration and WUE represent the mean of 2 values. Values in parentheses represent ± the standard error for each mean. Letters (a, b) indicate a statistical difference (α=0.05) for the whole plant parameters within a row. Statistical analysis can be found in Appendix II. CO2 Gas Exchange Light Treatment on a: Plant Basis Red-White HPS Red-Blue Photosynthesis 0.63(0.03) a 0.64(0.02) a 0.61(0.02) a (µmol C plant -1 s -1 ) Respiration (µmol C (0.005) a (0.006) a (0.002) a plant -1 s -1 ) C-Gain (g C plant -1 ) 1.60(0.13) a 1.62(0.16) a 1.55(0.16) a C-Loss (g C plant -1 ) 0.10(0.006) a 0.10(0.004) a 0.10(0.01) a Daily C-Gain (g C plant -1 day -1 ) Leaf Area Basis 1.49(0.12) a 1.51(0.15) a 1.45(0.14) a Photosynthesis 10.84(0.4) a 10.81(0.4) a 10.19(0.4) a (µmol C m -2 s -1 ) Respiration (µmol C -1.41(0.08) a -1.46(0.09) a -1.35(0.04) a m -2 s -1 ) C-Gain (g C m -2 ) 27.47(1.9) a 27.42(1.9) a 25.78(1.6) a C-Loss (g C m -2 ) 1.76(0.2) a 1.82(0.2) a 1.68(0.2) a Daily C-Gain (g C m -2 day -1 ) Dry Weight Basis 25.69(1.7) a 25.56(1.8) a 24.11(1.4) a Photosynthesis 0.16(0.007) a 0.17(0.006) a 0.17(0.006) a (µmol C g -1 s -1 ) Respiration (µmol C (0.001) a (0.001) a (0.001) a g -1 s -1 ) C-Gain (g C g -1 ) 0.41(0.03) a 0.44(0.03) a 0.42(0.03) a C-Loss (g C g -1 ) 0.026(0.002) a 0.030(0.004) a 0.027(0.003) a Daily C-Gain (g C g -1 day -1 ) 0.38(0.03) a 0.41(0.03) a 0.39(0.03) a
75 63 Table 3.2: The effect of RB, HPS, and RW lighting at a light level of 1000±25 µmol m -2 s -1 respectively on whole plant daily average transpiration rate and WUE of tomatoes grown under white light. Each value for photosynthesis, respiration, and C-budget represent the mean of 4 values. Each value for transpiration and WUE represent the mean of 2 values. Values in parentheses represent ± the standard error for each mean. Letters (a, b) indicate a statistical difference (α=0.05) for the whole plant parameters within a row. Statistical analysis can be found in Appendix II. H2O Gas Exchange Day Transpiration (mmol H2O m -2 s-1 ) Night transpiration (mmol H2O m -2 s-1 ) WUE(µmol CO2/mmol H2O) Light Treatment Red-Blue HPS Red-White 0.42(0.03) a 0.32(0.02) b 0.32(0.02) b 0.042(0.006) b 0.065(0.004) a 0.054(0.005) ab 6.89(0.4) a 8.13(0.3) a 8.12(0.4) a Whole Plant CO2 and H2O Gas Exchange at Sub-Saturating Light Level A similar experiment was done with larger plants and a lower, sub-saturating light level (350±10 µmol m -2 s -1 ) in order to see if these observations from the above experiment held true under different conditions. Again, there was no statistical difference between NCER rates between the RB, HPS, and RW light treatments when normalized on a plant basis or a leaf area basis (Table 3.3). A significant difference was observed between the RW and RB treatments when normalized on a dry weight basis (Table 3.3). However, this difference was not seen to follow through into the C-gain throughout the day (Table 3.3). Figure 3.4A, C, and E again show a decrease in the hourly average photosynthetic rate starting around 4pm which results in approximately a 15% decrease by the end of the light period. Transpiration rates and WUE patterns follow closely with those observed in the experiment with a light level of 1000±25 µmol m -2 s -1 (Figure 3.4A and B). However, in the lower light level, the RW also produced a statistically higher transpiration rate and provides
76 64 a higher daily average transpiration rate than RB and HPS and was 18% and 27% higher respectively at the maximum transpiration rate (Table 3.4). Unlike the higher light intensity experiment, there is no significant difference in the night time transpiration rates (Table 3.4). WUE is observed to be statistically lower under both RB and RW LED treatments when compared to the HPS (Table 3.4). These difference accounted for a 35% and 38% decrease in daily average WUE respectively under those light treatments.
77 65 Figure 3.4: Whole plant NCER (A, C, and E) and C-budget (B, D, and F) of tomato plants grown under W light and analyzed under RB, HPS, and RW light treatments with a light level of 350±10 µmol m -2 s -1 respectively. Whole plant NCER and C-budget are normalized on a plant basis (A and B), leaf area basis (C and D), and a dry weight basis (E and F). Whole plant NCER points represent the hourly mean values ± the standard error of 6 replicates and C-budget lines represent the mean of 6 replicates.
78 NCER (µmol C m -2 s -1 ) NCER (µmol C plant -1 s -1 ) A C B D C-budget (C gain-c loss g C m -2 ) C-budget (C gain-c loss g C plant -1 ) NCER (µmol C g -1 s -1 ) E Red-White HPS Red-Blue :00:00 10:00:00 14:00:00 18:00:00 22:00:00 02:00:00 06:00:00 10:00:00 14:00:00 18:00:00 22:00:00 02:00:00 06:00:00 F Red-White HPS Red-Blue C-budget (C gain-c loss g C g -1 ) Time (hh:mm:ss) Time (hh:mm:ss)
79 Figure 3.5: Whole plant transpiration (A) and WUE (B) of tomato plants grown under white light then subject to a 16h light period under either RB, HPS, or RW light treatment with a light level of 350±10 µmol m -2 s -1 respectively followed by an 8h dark period. Each RB point represents the hourly mean of 6 replicates ± the standard error. Each HPS and RB point represents the hourly mean of 3 replicates ± the standard error.
80 A Transpiration (mmol H 2 O m -2 s -1 ) B WUE (µmol CO 2 /mmol H 2 O) :00:00 10:00:00 14:00:00 18:00:00 22:00:00 02:00:00 06:00:00 Red-White HPS Red-Blue Time (hh:mm:ss)
81 69 Table 3.3: The effect of RB, HPS, and RW lighting at a light level of 350±10 µmol m -2 s -1 respectively on whole plant daily average NCER and daily C-budgets of tomatoes grown under white light. Each value for photosynthesis, respiration, and C-budget represent the mean of 4 values. Each value for transpiration and WUE represent the mean of 2 values. Values in parentheses represent ± the standard error for each mean. Letters (a, b) indicate a statistical difference (α=0.05) for the whole plant parameters within a row. Statistical analysis can be found in Appendix II. CO2 Gas Exchange Light Treatment on a: Plant Basis Red-White HPS Red-Blue Photosynthesis 0.67(0.01) a 0.70(0.01) a 0.68(0.02) a (µmol C plant -1 s -1 ) Respiration (µmol C -0.17(0.006) a -0.17(0.009) a -0.16(0.007) a plant -1 s -1 ) C-Gain (g C plant -1 ) 1.77(0.04) a 1.77(0.06) a 1.73(0.05) a C-Loss (g C plant -1 ) 0.21(0.03) a 0.21(0.03) a 0.21(0.03) a Daily C-Gain (g C plant -1 day -1 ) Leaf Area Basis 1.56(0.04) a 1.56(0.06) a 1.56(0.04) a Photosynthesis 3.01(0.07) a 3.13(0.06) a 3.04(0.07) a (µmol C m -2 s -1 ) Respiration (µmol C -0.77(0.02) a -0.74(0.04) a -0.71(0.03) a m -2 s -1 ) C-Gain (g C m -2 ) 7.91(0.4) a 7.96(0.6) a 7.77(0.4) a C-Loss (g C m -2 ) 0.90(0.09) a 0.94(0.1) a 0.90(0.09) a Daily C-Gain (g C m -2 day -1 ) Dry Weight Basis 7.00(0.4) a 7.02(0.6) a 6.99(0.4) a Photosynthesis 0.025(0.0006) a 0.024(0.0004) ab 0.023(0.0005) b (µmol C g -1 s -1 ) Respiration (µmol C (0.0003) a (0.0002) a (0.0002) a g -1 s -1 ) C-Gain (g C g -1 ) 0.061(0.004) a 0.059(0.004) a 0.061(0.004) a C-Loss (g C g -1 ) (0.0006) a (0.0007) a (0.0006) a Daily C-Gain (g C g -1 day -1 ) 0.054(0.004) a 0.053(0.005) a 0.054(0.004) a
82 70 Table 3.4: The effect of RB, HPS, and RW lighting at a light level of 350±10 µmol m -2 s -1 respectively on whole plant diurnal NCER and daily C-budgets of tomatoes grown under white light. Each value for photosynthesis, respiration, and C-budget represent the mean of 4 values. Each value for transpiration and WUE represent the mean of 2 values. Values in parentheses represent ± the standard error for each mean. Letters (a, b) indicate a statistical difference (α=0.05) for the whole plant parameters within a row. Statistical analysis can be found in Appendix II. H2O Gas Exchange Day Transpiration (mmol H2O m -2 s-1 ) Night transpiration (mmol H2O m -2 s-1 ) WUE(µmol CO2/mmol H2O) Light Treatment Red-White HPS Red-Blue 0.23(0.01) a 0.16(0.01) b 0.21(0.009) a 0.075(0.004) a 0.058(0.004) a 0.066(0.007) a 3.27(0.2) b 5.26(0.5) a 3.41(0.1) b Wake Up Time to maximum photosynthesis under a set light level (1000 µmol m -2 s -1 ) varies based on the spectral quality of the light the leaf is illuminated with after a darkened period (Table 3.5). Lights containing any amount of R light were seen to cause the plants to wake up and reach their maximum photosynthetic rate in a short period of time than those lacking light in the R spectrum. White light provided the quickest time to maximum photosynthesis as the B treatment provided statistically the slowest time to maximum photosynthesis (Table 3.5).
83 71 Table 3.5: The effect of various wavelengths on the time to maximum photosynthesis. Tomato plants were grown at 22 C/18 C and were taken from a dark chamber. Each value represents 5 replicates. The values in parentheses represents the standard error (±) for each mean and the letters (a, b) indicate statistical differences (α=0.05) between the different light treatments via a means comparison with a Tukey-Kramer adjustment. Statistical analysis in appendix II. Treatment White Blue Red Red-Blue Time to Maximum Photosynthesis (min:sec) 10:12 (1:22) b 21:09 (2:13) a 15:45 (3:20) ab 13:48 (1:53) ab Leaf Light Curves The photosynthetic rates at set light levels were higher in leaf studies when lights which exhibit a large quantity of R in the treatment (Figure 3.6). The R and RB treatments consistently provided the highest photosynthetic rate at a given PAR level for most of the light curve (Appendix II: Table 3.1). At the upper saturating light levels (Greater than 800 µmol m -2 s -1 ) the RB treatment produced the highest photosynthetic rate and had an average photosynthetic rate approximately 6% higher than the R treatment and 17% higher than the B treatment. The B treatment provided one of the lowest photosynthetic rates of any treatments throughout most of the light levels (Appendix II: Table 3.1). Surprisingly, G and O provided statistically among the highest photosynthetic rates. The RW treatment also
84 72 produced the lowest photosynthetic rates during the lower PAR regions (Less than200 µmol m -2 s -1 ). Stomatal conductance and transpiration rate varied in parallel with each other based as a function of wavelength (Figures 3.6 and 3.7). Through the various light intensities, from saturating light to no light at all, there was very little statistically significant difference in both parameters between the different light treatments (Appendix II: Table 3.1). However, during the 800 and 600 µmol m -2 s -1 region, the O light treatment produced the highest stomatal conductance of any treatment and was still significantly different then the G treatment until the 400 µmol m -2 s -1 light level. Transpiration rates followed nearly identical patterns and a significant difference was seen between B and G light treatments at 800 µmol m -2 s -1 and G and O light treatments at 600 and 400 µmol m -2 s -1 (Appendix II: Table 3.2). No significant difference was seen in either parameter at any other light levels. The amount of CO2 within the leaf tissue is known as the internal CO2 concentration (Ci). This value was calculated as a function of stomatal conductance, external CO2 concentration, and carbon fixation rates. As an overall pattern, as the light intensity and photosynthetic rates decreases under each light treatment, the Ci increased due to less of the internal CO2 being fixed (Figure 3.7).
85 NCER (µmol m -2 s -1 ) PAR (µmol m -2 s -1 ) Red Blue Red-White Red-Blue Green Orange White Figure 3.6: Light curves generated with the Li-COR 6400 from white light grown tomato leaves when analyzed under various colours of LED lights. Each point represent 3 replicates each done with separate leaves without removing the leaves from the chamber between light levels. Statistics found in Appendix II.
86 Stomatal Conductance (mmol H 2 O m -2 s -1 ) PAR (µmol m -2 s -1 ) Red Blue Red-White Red-Blue Green Orange White Figure 3.7: The effects of various wavelengths and light intensity on the stomatal conductance of white light grown tomato leaves. Each point represents 3 replicates of difference leaves where the chamber was not opened between light intensities. Statistical found in Appendix II.
87 75 6 Transpiration (mmol H 2 O m -2 s -1 ) PAR (µmol m -2 s -1 ) Red Blue Red-White Red-Blue Green Orange White Figure 3.8: Effects of various wavelengths and light intensity on the transpiration rates of white light grown tomato leaves. Each point represents 3 replicates of different leaves where the chamber was not opened between light intensities. Statistics found in Appendix II.
88 C i (µmol mol -1 ) PAR (µmol m -2 s -1 ) Red Blue Red-White Red-Blue Green Orange White Figure 3.9: Effects of various wavelengths and light intensity on the C i of white light grown tomato leaves. Each point represents 3 replicates of different leaves where the chamber was not opened between light intensities. Statistics found in Appendix II.
89 3.4 Discussion Comparison of Wavelength Specific LED Lighting and HPS Lighting on Whole Plant CO2 Gas Exchange As expected, a lower light level caused a lower photosynthetic rate independent of light treatments when normalized on a leaf area and plant dry weight basis for whole plant analysis and leaf studies (Figure 3.2; Figure 3.4; Figure 3.6) (Liu et al., 2011b). This decrease lead to less carbon being accumulated within the plant under lower light levels (Table 3.1; Table 3.3). However, on a plant basis, there was no difference in the photosynthetic rates between the two light levels which was likely due to the size and canopy architecture of plants used in each experiment. The more complex leaf canopy of the plants used in the low light experiment makes it harder for light to travel to the lower leaves which was causing the average photosynthetic rate on a leaf area basis to be decreased. This mutual shading was again an example why the use of leaf photosynthetic measurements cannot be used to interpret the trends of a whole plant as a system. Tepperman et al. (2004) provided evidence that gene expression could be altered in a little as one hour by illuminated white grown plants with an R and far R light. Thus, it is quite possible that gene expression may be altered within the plants during the experiment analyzed under RB and RW treatments. However, the benefits or downfalls of such genetic control were not observed in this short term, whole plant experiments but were evidence in the end biomass production from the greenhouse experiments (Table 2.1) (Tepperman et al., 2004). These long term acclimated plants provided similar results to current literature providing evidence which indicates that long term exposure may provide advantages during
90 78 production (Goins et al., 1997; Matsuda et al., 2004; Hogewoning et al., 2010; Liu et al., 2011b). Unlike previous studies, there was no effect on photosynthesis and carbon gain provided by the different light treatments when compared within the same light intensity (Goins et al., 1997; Matsuda et al., 2004; Hogewoning et al., 2010; Liu et al., 2011b). However, previous literature only accounted for differences in leaf photosynthetic rates that did show some differences in photosynthetic rates mainly in the RB treatment (Figure 3.6). In previous experiments, researchers have used plants which were grown solely under a specific colour of light which has the ability to change the morphological and anatomical structure of the plant as evident in studies performed by Liu et al. (2011b and 2012). In the studies described in chapter 3, all plants were grown under a broad spectrum white light in a growth chamber making the plants effectively sister plants before they are subject to the different light treatments. Doing so allowed for the direct effect of the lights on plants, which have no morphological or anatomical advantage brought about by long term exposure to different light treatments, to be determined. Under these conditions no differences were determined for the whole plant NCER studies (Figure 3.2; Figure 3.4; Table 3.1; Table 3.3). However during leaf experiments, RB light provided statistically higher leaf photosynthetic rates than B light alone (Figure 3.6; Appendix II: Table 3.1). Also observed was the decrease in the photosynthetic rate which was found to be ubiquitous under all light treatments during the late afternoon period which accounted for a 25% and 15% in the 1000±25 µmol m -2 s -1 and 350±10 µmol m -2 s -1 treatments respectively (Figure 3.2 and Figure 3.4). Transcription patterns of phytochrome (PHY) and cryptochrome
91 79 (CRY) which are light absorbing molecules have been observed to follow a circadian rhythm which exhibits a decrease approximately 12 hours after being exposed to light (Facella et al., 2008). If these molecules have a decreased transcription rate as well as a decreased abundance within the leaf, this may cause a lower rate of light absorption (Facella et al., 2008). While these molecules are not the main light absorbing molecules within the leaf, they still contribute by transferring energy to Chl a helping to drive photosynthesis (Goedheer, 1969; Cogdell et al., 1981; Cogdell 1985). The decrease in photosynthesis may also be due to a feedback inhibition of RUBISCO activity by sucrose (Roh and Choi, 2004; Kasai, 2008). In soybeans, it was observed that as sucrose levels increased, there was a linear decrease in the photosynthetic rate of the leaf (Kasai, 2008). This decrease in photosynthesis was attributed to the sucrose having a negative correlation with RUBISCO as well as having a positive correlation with RuBP which both lead to a decrease in the photosynthetic rate (Brooks and Portis, 1988; Kasai, 2008). A similar phenomenon was observed in tobacco leaves which are in the same family, Solanaceae, as tomatoes. It was determined that an increase of sucrose increased the activation of RUBISCO, however at higher levels of sucrose (<4%), RUBISCO activation started to fall off which would lead to a lower photosynthetic rate. Although neither mechanism has been determined to effect tomato photosynthetic rates, Figure 3.2 and Figure 3.4 provide evidence that there is a change in the photosynthetic rate of young tomato plants during the latter hours of the afternoon.
92 Comparison of Wavelength Specific Lighting on Leaf CO2 Gas Exchange Although B light is readily absorbed by Chl a and b, previous finding have determined that B light alone was not adequate for driving a high rate of photosynthesis (Mackinney, 1940; Hogewoning et al., 2010). A slight decrease was also seen in the pure R light treatment (Figure 3.6; Appendix II: Table 3.1). This leads to the idea proposed by Hogewoning et al., (2010) of spectral deficiency syndrome. This theory states that a sole wavelength alone will not generate a high photosynthetic rate within plants (Hogewoning et al., 2010). Data presented in Figure 3.6 supports this idea. It was clear that the addition of a more complex light treatment (R + B or some combination) was able to increase photosynthetic rates without increasing the light intensity of the treatment. This was also seen in plant morphology with a complex light treatment providing healthier and more natural looking plants as seen in Liu et al., (2012). During leaf experiments, unlike reports from Liu et al., (2012), the O and G lights used in our experiments were able to produce high photosynthetic rates. The O light used in these experiments had a wavelength maximum of approximately 600nm which falls within the absorbance spectrum of Chl a and Chl b as well as some carotenoids and other light harvesting molecules (Mackinney, 1941; Andersson et al., 1991). Thus it is not unlikely that an O light on its own would be able to produce a high rate of photosynthesis. It is also fairly close in wavelength to the R light treatment which was used in experimentations adding further verification. Also of note, in an experimentation where R and B light were the most dominant lights in a light treatment, the addition of an O light of close wavelength to the one
93 81 used in this experimentation allowed for an increase in photosynthetic rates compared to treatments lacking the orange light (Brazaityte et al., 2010). Green light had been dismissed with respect to driving photosynthesis when used as a sole illumination source. However, G light is able to penetrate leaf tissue and proceed to travel further than any other visible light which allows for a different set of chloroplast to absorb light and in turn drive photosynthesis (Sun et al., 1998; Terashima et al., 2009). However, when used as a sole light source, G light changes the morphology of the whole plant producing elongated stems and causes a poor health index (Liu et al., 2012). Because G light was able to penetrate the leaf and reach a different level of chloroplast, as well as be able to bounce around the canopy of plants and drive photosynthesis, it may be useful in combination with other lights (Figure 3.2) (Sun et al., 1998; Terashima et al., 2009) Effects of Wavelength Specific Lighting on Plant Wake Up Chloroplast avoidance is a phenomenon where under high light intensities chloroplast actually move away from the light source (Inoue & Shibata, 1973; Zurzycki, 1980; Banas et al., 2012). Under the strong light which is used in this experiment (1000 µmol m -2 s -1 ) phototropins 1 and 2 (phot1 and phot2) are stimulated, but it is phot2 which enacts the avoidance response by enacting chloroplast movement via myosin and actin filaments (Banas et al., 2012). The way chloroplast avoidance has been measured in the past was by a decrease in light absorption by the leaf or cell (Zurzycki, 1980). Photosynthetic rate is increased by light absorption which may indicated that the slower time to maximum photosynthetic rate seen under the B light is really a chloroplast avoidance response to the high light reducing light
94 82 absorption (Inoue & Shibata, 1973; Zurzycki, 1980; Banas et al., 2012). Although this process is usually associated with single cells, it can be imagined to happen in multiple cells within a leaf causing a bunching effect and effectively causing mutual shading between chloroplast. The leaf will then slowly acclimatize to the high light level and the chloroplast avoidance begins to weaken allowing more chloroplast to absorb light and in turn increasing photosynthetic rates. This phenomenon has not been seen with any other wavelength of light and even under low B light intensity is not a factor (Inoue & Shibata, 1973). In fact, R light has shown to inhibit the avoidance response of chloroplast and cause a faster rate of reappearance in chloroplast post B light illumination (Ichikawa et al., 2011). It does so by being absorbed by phot1 which caused an antagonistic reaction to the actin movement of chloroplast effectively stopping the process all together and allowing for chloroplast to stay in the illuminated area (Ichikawa et al., 2011). Chloroplast leakiness may also be an explanation for the slow time to reach maximum Pn rate under B light. Triose phosphate translocator is the enzyme responsible for the export of triose phosphate (TP) and 3-PGA from the chloroplast to the cytosol for sucrose synthesis (Walters et al., 2004). If TP was exported from the chloroplast too quickly, the intermediates needed for the Calvin cycle will be depleted (Walters et al., 2004). Although there is no literature tying B light to an increase in TP efflux, it is worth noting that if B light was able to effect this rate and cause a decrease in Calvin cycle intermediates, it may results in a slow priming of the leaf which could be seen as a slower rate to reach maximum Pn (Walters et al., 2004). This theory will be revisited in chapter 4.
95 83 Evolutionarily speaking, plants may have evolved over millions of years to adapt to the high amount of R light in the atmosphere during the morning hours. During the morning hours B light, which is in the shorter wavelength region of the visible spectrum, is scattered before it s able to reach the ground via air particles and other particulate which is known as Rayleigh scattering (Bates, 1984). This scattering is the reason we perceive the sky as blue and as the day continues, more of the short wavelength B light is able to reach the ground (Bates, 1984). Thus, longer wavelength R light is able to reach the Earth during the morning hours and over millions of years plants could adapt to use this to their advantage. The result showing W light as being significantly quicker to enact maximum photosynthesis followed by RB light combination then the sole R light indicates that a broader spectrum was needed to wake up the plants. This again reinforces the need for more than a wavelength specific lighting due to the spectral deficiency syndrome (Hogewoning et al., 2010) Effects of Wavelength Specific Lighting on H2O Gas Exchange Statistical differences were observed between RB and HPS transpiration rates during the high light whole plant experiment and in the low light whole plant experiment RB and RW show statistically higher transpiration rates than the HPS treatment for whole plant experiments (Table 3.2; Table 3.4). During the low light experiment, differences in transpiration rates translated to lower WUE which proved to be a significant (Table 3.4). These results may seem to be counter intuitive, simply due to the high heat emitting properties of the HPS light which should, in turn, increase stomatal opening and transpiration rates in C3 plants as well as decrease WUE (Gajc-Wolska et al., 2013; Kaminski
96 84 et al., 2014). However, different spectral qualities such as R and B light and the combination have been known to increase stomatal opening which can increase transpiration rates (Kana and Miller, 1977; Liu et al., 2012). When looking at leaf stomatal conductance, there was an increase under the B and R lights (Figure 3.7). This increase in stomatal conductance results in generally higher transpiration rates under these lights as well (Figure 3.8). Thus during the whole plant experiments which these differences are magnified by the amount of leaf area in the chambers (Figure 3.3; Figure 3.5). As the light level decreases the difference in stomatal conductance and transpiration rate due to a higher amount of B light in the RB light treatment seems to diminish which was why at the low light level whole plant study, no difference were seen between the RB and RW light treatments (Table 3.4). As discussed in sections 2.5, the increase in stomatal conductance and opening was due to the influx of K + ions into the guard cells (Lurie, 1978; Kinoshita and Shimazaki, 1999). Unlike experiments in chapter 2, plants in this experiment were grown under white light allowing the increase in stomatal conductance and connected transpiration rates to be seen as a direct function of the lights the plants and leaves were illuminated with. Due to this stomatal opening, B light, R light and mixtures including those invoke higher Ci values from the leaf studies then those with do not contain either such as G and W to some extent. Green light has been shown to antagonize the effects B light has on plants such as increase stomatal conductance and opening (Frechilla et al., 2000; Kim et al., 2004b; Hogewoning et al., 2010). Pulses of B light were able to increase stomatal opening where as a pulse of a high intensity G light caused no response in stomatal opening (Frechilla et al., 2000). Also, when G light was added to a B and R light mixture, stomatal opening decreases (Frechilla et al., 2000). It has been proposed that the accumulation of zeaxanthin in guard
97 85 cells can decrease stomatal opening by blocking the influx of K + into the cell (Frechilla et al., 1999). Thus, it was possible that in treatments containing either pure G light, or G light in any amount, that stomatal conductance would decrease effecting the transpiration rates and Ci of the leaves. In summary, plants grown under the same conditions then analyzed under RB LED, RW LED, or HPS lighting provided no difference in whole plant NCER under saturating or subsaturating light levels. Slight differences were seen at the leaf leave with the RB light treatment providing the highest Pn rate at a light level of 1500 µmol m -2 s -1. Statistical increases in transpiration rates were seen when plants were analyzed under RB and RW LED during sub-saturating light level whole plant experiments. Statistical increases in transpiration rates were also seen under the RB light treatment at saturating light level. These differences were mirrored in the WUE at each light level. This chapter provides evidence of the short term effects of wavelength specific lighting on plants and leaves grown under identical conditions (sister plants). This evidence allows for a better understanding of the effects of short term wavelengths specific illumination which is needed for the sizing and timing of the experimental design needed to preform experiments in Chapter 4.
98 86 Chapter 4 Effects of Wavelength Specific Light on Carbon Fixation, Export and Partitioning in Source Leaves of Solanum lycopersicum cv. Bonney Best 4.1 Introduction Chapters 2 and 3 dealt with the carbon fixation under different light conditions of the whole plant and source tissue. However, this is only half of the story when it comes to carbon metabolism or plant growth (Osorio et al., 2014). CO2 drawn into the leaf from the air is quickly turned into the essential building blocks which enable plant growth via a series of chemical reactions. The partitioning of carbon into the various building blocks of plants is a highly regulated process within a plant, however it varies greatly between species (Balibrea et al., 2000; Lemoine et al., 2013; Sung et al., 2013). For tomato, the main carbohydrates are well known and are sucrose and starch (Osorio et al., 2014). Sucrose, which is made in the source leaf, is immediately exported via apoplastic phloem loading to the growing sink tissue. This is achieved via a pair of transporter proteins allowing it to pass through cell membranes. Once made in the MC, sucrose is moved through plasmodesmata into the PPC where it encounters SWEET enzymes which are responsible for the movement of sucrose into the apoplast (Chen et al., 2012; Feng et al., 2015). Once in the apoplast, the sucrose is either ushered into TCs where it can passively diffuse into the phloem or move directly into the phloem. Both processes are facilitated by SUC (Sauer et al., 2004; Hackel et al., 2006; Sauer, 2007; Aoki et al., 2011).
99 87 Certain factors are known to effect export such as temperature (Jiao & Grodzinski, 1996; Leonardos et al., 1996; Leonardos et al., 2003). Others have shown an increase in enzymes either involved in sucrose synthesis or apoplastic phloem loading, however neither study attempted to measure if export itself was actually effected (Quick et al., 1989; Meyer et al., 2004). In this chapter, the effect of light quality on the sugar partitioning ratios and carbon export rates will be elucidated during short term and photoperiod long illumination at various light intensities. 4.2 Materials and Methods Plant Materials and Growth Conditions Plants were grown in the identical fashion to the above section Plant Materials and Growth Conditions. However, three days before the experiment was set to start, the photoperiod was changed from 16h/8h to 12h/12h. This was done in order to deplete the sucrose pools within the leaves to insure isotopic equilibrium would be reached during the shorter feed experiments. These conditions were determined by Gibon et al. (2004) due to the depletion of sucrose and other soluble sugars during a 12h/12h photoperiod of Arabidopsis without harming the photosynthetic capability. A portion of the plants were also put to a delayed morning, being in the light from 11:30am-11:30pm. This was done to allow for two experiments per day when doing short term feeds, both being done with plants which had recently been woken up.
 by reacting either radioactive sodium bicarbonate (NaH 14 CO3; MP Biomedical, Sanata Ana, CA, USA) with 30% Sulfuric acid (H2SO4; Fisher Scientific, Ottawa, ON, Canada) or")
100 C Export Radioactive CO2 ( 14 CO2) was generated in a large gas tight syringe (Hamilton Co., Reno, NV, USA) by reacting either radioactive sodium bicarbonate (NaH 14 CO3; MP Biomedical, Sanata Ana, CA, USA) with 30% Sulfuric acid (H2SO4; Fisher Scientific, Ottawa, ON, Canada) or radioactive barium carbonate (Ba 14 CO3; NEC) with 30% hydrochloric acid (HCl; Fisher Scientific, Ottawa, ON, Canada). In order to pump the 14 CO2 into the leaf export system, it was drawn into a 60mL syringe and loaded onto a pump (PHD 2000 Infusion, Harvard Apparatus, Holliston, MA, USA) which then gets injected into the air stream at a set rate allowing it to get into the leaf chambers Short Term 14 C Feeding After three days under the 12h/12h photoperiod, plants were taken out of the growth chamber and the most distal leaflet on the 5 th leaf from the top was placed in a specially designed leaf chamber for gas exchange and export measurements. Leaf chambers were sealed with vacuum grease (Dow Corning, High Vacuum Grease, Auburn MI, USA) in order to provide an air tight seal to prevent radioactivity from leaking out of the chambers. Chambers Figure 4.1: 14 C leaf chamber with a tomato leaf sealed inside illuminated by a red-white PAR38 with the water jackets circulating for temperature control.
101 89 were identical to that used in Leonardos et al., (2003) which included a circulating water jacket for temperature regulation, a glass window on the top to allow light to pass through, and a Geiger-Muller (GM) detector (model 7231, LND Inc., Oceanside, NY, USA) for radioactivity monitoring (Leonardos et al., 2003). Flowrate within each chamber was held steady at 500cc m -1 with a CO2 concentration of 405±10 µmol m -2 s -1 (Figure 4.1). Only the leaf inside the chamber was illuminated by the light. This was done in order to see the effects of wavelength specific lighting on a strong source leaf. Lights used were identical PAR38 s as that use for the leaf photosynthetic measurements done with the Li-COR 6400 (Appendix III). Light levels were varied between experiments in order to produce a photosynthetic vs. export relationship. This was done in order to elucidate not only the effects wavelength specific lighting had but also to determine if light intensity played a role in export. Once the leaf was set in the chamber the light level was established by placing a Li-COR quantum sensor on top of the chamber and using a correction factor to determine the light level inside the chamber. Once the light level has been selected and the photosynthetic rate of each leaf has shown to be steady, 14 CO2 is pumped into the air stream and drawn into the leaf chamber. This radioactive feed will last for approximately three hours under steady light, CO2 and humidity conditions. The accumulation of 14 C by the leaf is monitored by the GM at the base of the chamber. The carbon export rate was calculated by using the difference between the photosynthetic rate (Pn) which is measure by an IRGA and the 14 C retention which is measured by the GM (CGM) (Equation 4.1). This CGM value is then corrected for the leaf size, the radioactivity used in that experiment, and the GM efficiency from each chamber.
102 90 Equation 4.1: Export = Pn CGM Photoperiod Long Feed-Chase Export Plants were grown identical to those above in section Short Term 14 C experiment. This experiment evaluated the photoperiod long (15h) day time export rates of plants as well as the night time (8h) export rates. In order to do so, two photosynthetic levels were chosen, 12 µmol m -2 s -1 and 6 µmol m -2 s -1. Plants were illuminated with the appropriate light level to achieve such photosynthetic rates with either R, B, RB mixture or W LED lights, again only illuminating one leaf. Plants were woken up under white light in the growth chamber in order to prime the photosystems then transferred to the leaf chambers. Once the photosynthetic rate was established, 14 CO2 was pumped into the air stream and allowed to enter the leaf chamber. Plants were either left in the chamber for 15h or a full light and dark period lasting 15h and 8h respectively. During the 15h feeds, 14 CO2 was being constantly pumped into the chamber which contained the leaves and were set to a temperature of 22 C, relative humidity of 50-60%, and a CO2 concentration of 405±10 µmol m -2 s -1. During 23h experiments, plants were under the same parameters as the 15h feeds for the day time period but at night were lowered down to 18 C with a flow rate of 150cc m -1. During the night period the lights were shut off but leaves remained inside the leaf chambers. The respired air was collected in a 40mL 20% KOH (Sigma-Aldrich, St. Louis, MO, USA) traps and was used to correct for the loss of 14 C by respiration in order to get the night time export
103 91 rates. Daytime export rates are calculated using equation 4.1 and night time rates are calculated using equation 4.2 where Rd is the respiration rate determined using the KOH traps and CGM. Equation 4.2: Export = Rd CGM C Partitioning Once the runs were done, leaves were immediately taken out of the chamber and cut to the appropriate chamber size (ie, cutting off regions which contained vacuum grease) (Figure 4.2A). Pictures were taken in order to determine the leaf size by using ImageJ (University of Wisconsin-Madison). Leaves were then cut into small pieces and extracted three times using boiling 80% ethanol for minutes each time, leaving a soluble fraction and extracted leaf tissue (Figure 4.2B and 4.2G). From this point on, soluble and extracted tissue fractions were processed separately. Tissue fractions were dried in an oven at 70 C for 24 hours. Once dried, they were placed in a 2mL flat bottom microfuge tube with two 3mm stainless steel balls. The samples were put into a grinder (Mixer Mill MM 400, Retsch, Haan, Germany). Samples were dry ground twice for 5 minutes each at 30Hz. One ml of 80% ethanol was then added to the microfuge tubes and the samples were ground again at 30Hz for 2 minutes in order to mix the ethanol with the ground tissue. The stainless steel balls were removed and washed with 80% ethanol, then the microfuge tubes were topped up to a final volume of 1.75mL (Figure 4.2H). Three 50µL subsamples were taken from each sample and placed in individual scintillation vials
104 92 with 2.8mL of scintillation cocktail (MP Biomedicals, LLC. Solon, OH, USA) and counted in a liquid scintillation counter (LSC; model LS-6800, Beckman Instruments Inc., San Ramon, CA, USA) (Figure 4.2I). Ethanol soluble fractions were vacuum dried (Model Sc210A, SpeedVac Plus, Savant) (Figure 4.2C). Samples were then suspended in a mixture of water and 99% chloroform (3:2 v/v) and thoroughly agitated. Samples were separated by centrifugation at 11,000 RPM (Figure 4.2D). Two 50µL subsamples were taken from each of the water and chloroform layers of each sample and counted in a LSC (Figures 4.2E and 4.2F). Determination of carbon partitioning within samples are calculated using equations 4.3, 4.4, and 4.5 which represent the % 14 C recovered from each portion of the leaf. In equation 4.3, the radioactivity as determined by the LSC in the ethanol insoluble faction (dpminsol) is divided by the total radioactivity in the sample (dpmtot) multiplied by 100. Equations 4.4 and 4.5 are identical with the exception of the fractions being sampled. In equation 4.4 which is to determine radioactivity in the water soluble fraction, radioactivity in that fraction is represented by dpmh20 and in equation 4.5, radioactivity determined in the chloroform fraction is represented by dpmchl. Equation 4.3: pc14insol = ( dpminsol dpmtot ) 100 Equation 4.4: pc14h2o = ( dpmh2o dpmtot ) 100
105 93 Equation 4.5: pc14chl = ( dpmchl dpmtot ) 100
106 94 Figure 4.2: Extraction process of leaves which were used for export and partitioning experiments. (A) Leaf which has been cut to the size of the chamber for extraction. (B) Ethanol soluble fraction of triple extracted leaf. (C) Dried ethanol soluble fraction. (D) Suspended soluble leaf fraction after it has been separated by centrifugation showing the water layer on the top and chloroform layer as the green bottom layer. (E) Subsample of the water fraction in a scintillation vial. (F) Subsample of the chloroform fraction in a scintillation vial. (G) Ethanol insoluble leaf fraction after being triple extracted. (H) Insoluble fraction after it had been dry ground and suspended in ethanol. (I) Subsample of insoluble fraction in a scintillation vial.


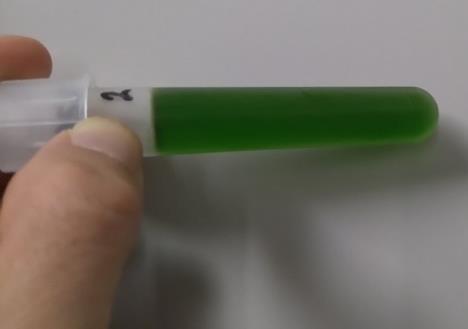
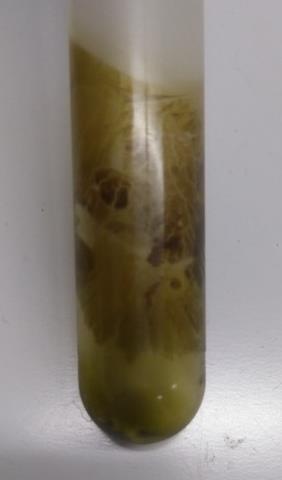

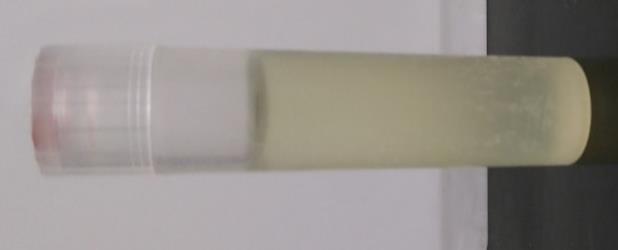
107 95 B A G C D H E F I
Effect of supplemental lighting on primary gas exchanges of Chrysanthemum morifolium Ramat cultivar White Reagan. By Xiao Ma
 Effect of supplemental lighting on primary gas exchanges of Chrysanthemum morifolium Ramat cultivar White Reagan By Xiao Ma A Thesis Presented to University of Guelph In partial fulfillment of requirements
1. What is the source of the oxygen released into the air as a product of photosynthesis? D. Both water and carbon dioxide (Total 1 mark)
") 2.9 Photosynthesis Paper 1 Possible Mult Choice Questions 1. What is the source of the oxygen released into the air as a product of photosynthesis? A. Chlorophyll B. Carbon dioxide only C. Water only D.
2.9 Photosynthesis Paper 1 Possible Mult Choice Questions 1. What is the source of the oxygen released into the air as a product of photosynthesis? A. Chlorophyll B. Carbon dioxide only C. Water only D.
The summary equation of photosynthesis including the source and fate of the reactants and products. How leaf and chloroplast anatomy relates to
 1 The summary equation of photosynthesis including the source and fate of the reactants and products. How leaf and chloroplast anatomy relates to photosynthesis. How photosystems convert solar energy to
Photosynthesis
 Student Expectations: Cellular Energy Understand that cellular energy is temporarily stored in the nucleotide ATP (adenosine triphosphate) Describe how energy is released by ATP When the outer phosphate
5/08/ :49 PM 28/02/13. Lecture 2: Photosynthesis:
 5/08/2014 10:49 PM 28/02/13 Lecture 2: Photosynthesis: Two types of chlorophyll in plants (green pigments in the thylakoids that are responsible for the absorption of Photosynthetically active radiation
Translocation 11/30/2010. Translocation is the transport of products of photosynthesis, mainly sugars, from mature leaves to areas of growth and
 Translocation Translocation is the transport of products of photosynthesis, mainly sugars, from mature leaves to areas of growth and storage. Phloem is the tissue through which translocation occurs. Sieve
1/23/2011. Grapevine Anatomy & Physiology. What is Light? WSU Viticulture Certificate Program. Photosynthesis & Respiration.
 WSU Viticulture Certificate Program Grapevine Anatomy & Physiology & Respiration Markus Keller PHOTOS: Converts sunlight to chemical energy SYNTHESIS: Uses energy to convert inorganic compounds to organic
7/31/2014 WHAT IS LIGHT? SUPPLEMENTAL LIGHTING JOHANNA OOSTERWYK DC SMITH GREENHOUSE MANAGER UW-MADISON DEPARTMENT OF HORTICULTURE
 WHAT IS LIGHT? SUPPLEMENTAL LIGHTING JOHANNA OOSTERWYK DC SMITH GREENHOUSE MANAGER UW-MADISON DEPARTMENT OF HORTICULTURE Electromagnetic radiation Energy emitted by a light source Measured in watts Visible
CHAPTER 13 : PHOTOSYNTHESIS IN HIGHER PLANTS K C MEENA PGT BIOLOGY KV VIKASPURI II SHIFT
 CHAPTER 13 : PHOTOSYNTHESIS IN HIGHER PLANTS K C MEENA PGT BIOLOGY KV VIKASPURI II SHIFT Photosynthesis is a Physic o chemical process, uses light energy to synthesis organic compounds (sugar). Importance
Photosynthesis in Detail. 3/19/2014 Averett
 Photosynthesis in Detail 1 In photosynthesis many chemical reactions, enzymes and ions work together in a precise order. Enzymes Biological catalyst Substance that initiates or speeds up the rate of a
Chapter 6. Capturing Solar Energy: Photosynthesis. Lectures by Gregory Ahearn. University of North Florida. Copyright 2009 Pearson Education, Inc.
 Chapter 6 Capturing Solar Energy: Photosynthesis Lectures by Gregory Ahearn University of North Florida Copyright 2009 Pearson Education, Inc. 6.1 What Is Photosynthesis? Life on earth depends on photosynthesis.
Chapter 10: PHOTOSYNTHESIS
 Chapter 10: PHOTOSYNTHESIS 1. Overview of Photosynthesis 2. Light Absorption 3. The Light Reactions 4. The Calvin Cycle 1. Overview of Photosynthesis Chapter Reading pp. 185-190, 206-207 What is Photosynthesis?
Greenhouse Supplemental Light Quality for Vegetable Nurseries
 Greenhouse Supplemental Light Quality for Vegetable Nurseries Chieri Kubota and Ricardo Hernández The University of Arizona LED Symposium (Feb 20, 2015) Supplemental lighting from late fall to early spring
Yield Responses to Supplemental Lighting
 Yield Responses to Supplemental Lighting Solar radiation Sunlight s full spectrum ranges from 3 to 3 nm Heat Light for plant growth and development Three dimensions Celina Gómez, PhD Environmental Horticulture
CHAPTER XI PHOTOSYNTHESIS. DMA: Chapter 11 Hartmann's 1
 CHAPTER XI PHOTOSYNTHESIS DMA: Chapter 11 Hartmann's 1 The nature of light The sun's energy travels through space to the earth as electromagnetic radiation waves at the speed of light, about 300,000 Km/s.
Chapter 10 Photosynthesis
 Chapter 10 Photosynthesis Overview: The Process That Feeds the Biosphere Photosynthesis is the process that converts solar energy into chemical energy Photosynthesis occurs in plants, algae, certain other
2015 AP Biology PRETEST Unit 3: Cellular Energetics Week of October
 Name: Class: _ Date: _ 2015 AP Biology PRETEST Unit 3: Cellular Energetics Week of 19-23 October Multiple Choice Identify the choice that best completes the statement or answers the question. 1) Which
Chapter 10. Photosynthesis
 Chapter 10 Photosynthesis Overview: The Process That Feeds the Biosphere Photosynthesis is the process that converts solar energy into chemical energy Directly or indirectly, photosynthesis nourishes almost
NOTES: CH 10, part 3 Calvin Cycle (10.3) & Alternative Mechanisms of C-Fixation (10.4)
 & Alternative Mechanisms of C-Fixation (10.4)") NOTES: CH 10, part 3 Calvin Cycle (10.3) & Alternative Mechanisms of C-Fixation (10.4) 10.3 - The Calvin cycle uses ATP and NADPH to convert CO 2 to sugar The Calvin cycle, like the citric acid cycle,
NOTES: CH 10, part 3 Calvin Cycle (10.3) & Alternative Mechanisms of C-Fixation (10.4) 10.3 - The Calvin cycle uses ATP and NADPH to convert CO 2 to sugar The Calvin cycle, like the citric acid cycle,
Photosynthesis. Chapter 10. Biology Eighth Edition Neil Campbell and Jane Reece. PowerPoint Lecture Presentations for
 Chapter 10 Photosynthesis PowerPoint Lecture Presentations for Biology Eighth Edition Neil Campbell and Jane Reece Lectures by Chris Romero, updated by Erin Barley with contributions from Joan Sharp Overview:
Energy Conversions. Photosynthesis. Plants. Chloroplasts. Plant Pigments 10/13/2014. Chapter 10 Pg
 Energy Conversions Photosynthesis Chapter 10 Pg. 184 205 Life on Earth is solar-powered by autotrophs Autotrophs make their own food and have no need to consume other organisms. They are the ultimate source
Photosynthesis. Dr. Bertolotti
 Photosynthesis Dr. Bertolotti Photosynthesis: Life from Light and Air How do plants and other organisms capture energy from the sun? What is ATP and why is it useful in cells? Plants are energy producers
AP Biology. Chloroplasts: sites of photosynthesis in plants
 The summary equation of photosynthesis including the source and fate of the reactants and products. How leaf and chloroplast anatomy relates to photosynthesis. How photosystems convert solar energy to
Photosynthesis and Cellular Respiration
 Photosynthesis and Cellular Respiration Photosynthesis and Cellular Respiration All cellular activities require energy. Directly or indirectly nearly all energy for life comes from the sun. Autotrophs:
Photosynthesis. (in C 3 plants)
") Photosynthesis (in C 3 plants) WHAT DO I REMEMBER FROM GCSE ABOUT PHOTOSYNTHESIS? PS WS Photosynthesis uses sunlight energy to create complex organic compounds, initially glucose, from inorganic compounds.
Photosynthesis (in C 3 plants) WHAT DO I REMEMBER FROM GCSE ABOUT PHOTOSYNTHESIS? PS WS Photosynthesis uses sunlight energy to create complex organic compounds, initially glucose, from inorganic compounds.
Photosynthesis. All Materials Cmassengale
 Photosynthesis All Materials Cmassengale I. Capturing the Energy of Life A. All organisms require energy B. Some organisms (autotrophs) obtain energy directly from the sun and store it in organic compounds
1. Photosynthesis is the process of making a simple organic molecule from inorganic compounds (molecules) utilizing light energy.
 utilizing light energy.") PHOTOSYNTHESIS A. INTRODUCTION 1. Photosynthesis is the process of making a simple organic molecule from inorganic compounds (molecules) utilizing light energy. a. It takes energy input for synthesis.
PHOTOSYNTHESIS A. INTRODUCTION 1. Photosynthesis is the process of making a simple organic molecule from inorganic compounds (molecules) utilizing light energy. a. It takes energy input for synthesis.
Section A2: The Pathways of Photosynthesis
 CHAPTER 10 PHOTOSYNTHESIS Section A2: The Pathways of Photosynthesis 4. The Calvin cycle uses ATP and NADPH to convert CO2 to sugar: a closer look 5. Alternative mechanisms of carbon fixation have evolved
How do cells obtain energy from food molecules? Unit 5: Cellular Respiration and Photosynthesis. It is an extremely simple cellular process.
 Unit 5: Cellular Respiration and Photosynthesis How do cells obtain energy from food molecules? 1. Cellular respiration release energy from food molecules 2. Glycolysis begins the production of Energy
Harvesting energy: photosynthesis & cellular respiration part 1
 Harvesting energy: photosynthesis & cellular respiration part 1 Agenda I. Overview (Big Pictures) of Photosynthesis & Cellular Respiration II. Making Glucose - Photosynthesis III. Making ATP - Cellular
Lecture 9: Photosynthesis
 Lecture 9: Photosynthesis I. Characteristics of Light A. Light is composed of particles that travel as waves 1. Comprises a small part of the electromagnetic spectrum B. Radiation varies in wavelength
Bio Ch 6 Photosynthesis Notes
 Bio Ch 6 Photosynthesis Notes I. Photosynthesis Basics A. What is photosynthesis? 1. Photosynthesis is a chemical reaction in which light energy is converted to chemical energy in glucose. 2. It is the
Lighting Solutions for Horticulture. The Light of Professional Knowledge
 Lighting Solutions for Horticulture The Light of Professional Knowledge Hortiled Hortiled began its activity in 2006 promoting research in the field of plant illumination in collaboration with scientists
Biology: Life on Earth
 Biology: Life on Earth Eighth Edition Lecture for Chapter 7 Capturing Solar Energy: Photosynthesis Chapter 7 Outline 7.1 What Is Photosynthesis? p. 118 7.2 Light-Dependent Reactions: How Is Light Energy
Unit 1C Practice Exam (v.2: KEY)
") Unit 1C Practice Exam (v.2: KEY) 1. Which of the following statements concerning photosynthetic pigments (chlorophylls a and b, carotenes, and xanthophylls) is correct? (PT1-12) a. The R f values obtained
Unit 1C Practice Exam (v.2: KEY) 1. Which of the following statements concerning photosynthetic pigments (chlorophylls a and b, carotenes, and xanthophylls) is correct? (PT1-12) a. The R f values obtained
PHOTOSYNTHESIS. Light Reaction Calvin Cycle
 PHOTOSYNTHESIS Light Reaction Calvin Cycle Photosynthesis Purpose: use energy from light to convert inorganic compounds into organic fuels that have stored potential energy in their carbon bonds Carbon
Name: Class: _ Date: ID: A. AP Photosynthesis Test 2012
 Name: Class: _ Date: ID: A AP Photosynthesis Test 2012 Multiple Choice (3 polnts each) _ Directions: Each of the questions or incomplete statements below is followed by four suggested answers or completions.
Photosynthesis and Cellular Respiration: Photosynthesis
 Photosynthesis and Cellular Respiration: Photosynthesis Unit Objective I can compare the processes of photosynthesis and cellular respiration in terms of energy flow, reactants, and products. During this
Photosynthesis: Life from Light and Air
 Photosynthesis: Life from Light and Air 2007-2008 Energy needs of life All life needs a constant input of energy consumers producers Heterotrophs (Animals) get their energy from eating others eat food
Chapter 10 Photosynthesis
 Chapter 10 Photosynthesis Autotrophs and Heterotrophs Autotrophs are organisms that make their own food. They obtain everything they need by using CO 2 and inorganic compounds from the environment. Heterotrophs
PHOTOSYNTHESIS Chapter 6
 PHOTOSYNTHESIS Chapter 6 5.1 Matter and Energy Pathways in Living Systems Chapter 5 Photosynthesis & Cellular Respiration 1 2 5.1 Matter and Energy Pathways in Living Systems In this section you will:
pigments AP BIOLOGY PHOTOSYNTHESIS Chapter 10 Light Reactions Visible light is part of electromagnetic spectrum
 AP BIOLOGY PHOTOSYNTHESIS Chapter 10 Light Reactions http://vilenski.org/science/safari/cellstructure/chloroplasts.html Sunlight is made up of many different wavelengths of light Your eyes see different
1. Plants and other autotrophs are the producers of the biosphere
 1. Plants and other autotrophs are the producers of the biosphere Photosynthesis nourishes almost all of the living world directly or indirectly. All organisms require organic compounds for energy and
1. Plants and other autotrophs are the producers of the biosphere
 1. Plants and other autotrophs are the producers of the biosphere Photosynthesis nourishes almost all of the living world directly or indirectly. All organisms require organic compounds for energy and
PHOTOSYNTHESIS. Chapter 10
 PHOTOSYNTHESIS Chapter 10 Modes of Nutrition Autotrophs self-feeders Capture free energy from physical sources in the environment Photosynthetic organisms = sunlight Chemosynthetic organisms = small inorganic
Physiological Ecology. Physiological Ecology. Physiological Ecology. Nutrient and Energy Transfer. Introduction to Ecology
 Physiological Ecology Outline Introduction to Ecology Evolution and Natural Selection Physiological Ecology Behavioural Ecology Physiological Ecology study of species needs and tolerances that determine
LEAF Describe the structure of A dicotyledonous leaf A Palisade cell Chloroplast 2
 Photosynthesis By: K. Foster-McFarlane L.M.S.N.; MSc.; BSc. 602 Biology 1 LEAF Describe the structure of A dicotyledonous leaf A Palisade cell Chloroplast 2 3 4 5 6 Keisha FosterFoster-McFarlane 7 8 9
Energy and Life. Lesson Overview. Lesson Overview. 8.1 Energy and Life
 8.1 Chemical Energy and ATP Energy is the ability to do work. Your cells are busy using energy to build new molecules, contract muscles, and carry out active transport. Without the ability to obtain and
Photosynthesis is the main route by which that energy enters the biosphere of the Earth.
 Chapter 5-Photosynthesis Photosynthesis is the main route by which that energy enters the biosphere of the Earth. To sustain and power life on Earth, the captured energy has to be released and used in
A. Structures of PS. Site of PS in plants: mostly in leaves in chloroplasts. Leaf cross section. Vein. Mesophyll CO 2 O 2. Stomata
 PS Lecture Outline I. Introduction A. Structures B. Net Reaction II. Overview of PS A. Rxns in the chloroplast B. pigments III. Closer looks A. LD Rxns B. LI Rxns 1. non-cyclic e- flow 2. cyclic e- flow
Photosynthesis Lecture 7 Fall Photosynthesis. Photosynthesis. The Chloroplast. Photosynthetic prokaryotes. The Chloroplast
 Photosynthesis Lecture 7 Fall 2008 Photosynthesis Photosynthesis The process by which light energy from the sun is converted into chemical energy 1 Photosynthesis Inputs CO 2 Gas exchange occurs through
Overview - the process that feeds the biosphere. Photosynthesis: transformation of solar energy into chemical energy.
 Chapter 7 Capturing Solar Energy: Photosynthesis Overview - the process that feeds the biosphere Photosynthesis: transformation of solar energy into chemical energy. Responsible for O 2 in our atmosphere
Metabolism 2 Photosynthesis
 Metabolism 2 Photosynthesis Light energy is trapped in the form of high energy electrons. High energy electrons are used to synthesize ATP and reduce CO 2 to form carbohydrates. Oxygen is produced as a
Chapter 13 Photosynthesis in Higher Plants
 Question 1: By looking at a plant externally can you tell whether a plant is C 3 or C 4? Why and how? One cannot distinguish whether a plant is C 3 or C 4 by observing its leaves and other morphological
photosynthesis notes Biology Junction Everything you need in Biology Photosynthesis All Materials Cmassengale I. Capturing the Energy of Life
 Biology Junction Everything you need in Biology photosynthesis notes Photosynthesis All Materials Cmassengale I. Capturing the Energy of Life 1. All organisms require energy 2. Some organisms (autotrophs)
Let light motivate your flowers
 Let light motivate your flowers LightDec Horticulture Light recipes from LEDIG are the best in this market. Their recommendations increased my profits in year one by 23% LED Solutions from LEDIG LED Industrial
Factors which influence plant growth
 Factors which influence plant growth Environment Irradiation, Day-length, Temperature, Water availability, Gases Soil, Nutrients Plant Hormones Growth Hormones Auxins Cytokinins Gibberellins Ethylene Abscisic
Complete the notes on photosynthesis in the spaces below.
 Section: 3.2 Name: Opening Activity: What type of energy is absorbed by pigment molecules in plant cells to start photosynthesis? Latin Root Word: Review of Old Information: ATP then provides the energy
THE BASICS OF PHOTOSYNTHESIS
 THE BASICS OF PHOTOSYNTHESIS Almost all plants are photosynthetic autotrophs, as are some bacteria and protists Autotrophs generate their own organic matter through photosynthesis Sunlight energy is transformed
Chapter 7 PHOTOSYNTHESIS
 Chapter 7 PHOTOSYNTHESIS Photosynthesis Photosynthesis is the process of harnessing energy from sunlight to produce sugars. Photosynthesis equation: Energy + 6 CO 2 + 6 H 2 O C 6 H 12 O 6 + 6 O 2 C 6 H
Photosynthesis: Life from Light AP Biology
 Photosynthesis: Life from Light Supporting a biosphere On global scale, photosynthesis is the most important process for the continuation of life on Earth u each year photosynthesis synthesizes 160 billion
8.2 Photosynthesis Draw and label a diagram showing the structure of a chloroplast as seen in electron micrographs
 8.2 Photosynthesis 8.2.1 - Draw and label a diagram showing the structure of a chloroplast as seen in electron micrographs double membrane starch grain grana thylakoid internal membrane - location of the
Photosynthesis (Chapter 7 Outline) A. For life based on organic compounds, two questions can be raised:
 A. For life based on organic compounds, two questions can be raised:") Photosynthesis (Chapter 7 Outline) Sun, Rain, and Survival A. For life based on organic compounds, two questions can be raised: 1. Where does the carbon come from? 2. Where does the energy come from to
Photosynthesis (Chapter 7 Outline) Sun, Rain, and Survival A. For life based on organic compounds, two questions can be raised: 1. Where does the carbon come from? 2. Where does the energy come from to
The table lists some functions of parts of a plant. Match the part of the plant (A, B, C or D) to its function by writing the letters in the table.
 to its function by writing the letters in the table.") Low Demand Questions QUESTIONSHEET 1 The diagram shows a flowering plant. A Name the parts labelled A, B, C and D. (c) (d) B C D A... B C... D [4] The table lists some functions of parts of a plant. Match
Low Demand Questions QUESTIONSHEET 1 The diagram shows a flowering plant. A Name the parts labelled A, B, C and D. (c) (d) B C D A... B C... D [4] The table lists some functions of parts of a plant. Match
Biology Chapter 8: The Process of Photosynthesis. Ms. Nguyen
 Biology Chapter 8: The Process of Photosynthesis Ms. Nguyen Add to a new section of IAN Left side. Chapter 8 Big Idea: Cellular Basis of Life Essential Question: How do plants and other organisms capture
AP Biology Chapter 36
 Chapter 36 Chapter 36 Transport in Plants 2006-2007 Transport in plants - Overview H2O & minerals transport in xylem transpiration evaporation, adhesion & cohesion negative pressure Sugars transport in
Photosynthesis Life Is Solar Powered!
 Photosynthesis Life Is Solar Powered! What Would Plants Look Like On Alien Planets? 1 Why Would They Look Different? Different Stars Give off Different types of light or Electromagnetic Waves The color
Environmental Plant Physiology Photosynthesis - Aging. Department of Plant and Soil Sciences
 Environmental Plant Physiology Photosynthesis - Aging krreddy@ra.msstate.edu Department of Plant and Soil Sciences Photosynthesis and Environment Leaf and Canopy Aging Goals and Learning Objectives: To
I. Energy for Life. Energy in Ecosystems Did you know you were solar powered? IN: 11/4/2018. Fill in the blanks to complete the reaction: C H O + 6 2
 11/4/2018 Energy in Ecosystems Did you know you were solar powered? IN: Fill in the blanks to complete the reaction: Light 6 2 + 6 2 Chlorophyll C H O + 6 2 Write the equation for photosynthesis in words.
Vital metabolism for survival of life in the earth. Prof Adinpunya Mitra Agricultural & Food Engineering Department
 Vital metabolism for survival of life in the earth Prof Adinpunya Mitra Agricultural & Food Engineering Department THE SUN: MAIN SOURCE OF ENERGY FOR LIFE ON EARTH THE BASICS OF PHOTOSYNTHESIS Almost all
Photosynthesis - Aging Leaf Level. Environmental Plant Physiology Photosynthesis - Aging. Department of Plant and Soil Sciences
 Environmental Plant Physiology Photosynthesis and Environment Leaf and Canopy Aging krreddy@ra.msstate.edu Department of Plant and Soil Sciences Goals and Learning Objectives: To understand the effects
PHOTOSYNTHESIS. Chapter 10
 PHOTOSYNTHESIS Chapter 10 Modes of Nutrition Autotrophs Capture from physical sources in the environment Photosynthetic organisms = sunlight Chemosynthetic organisms = small inorganic molecules (occurs
CHAPTER 8 PHOTOSYNTHESIS
 CHAPTER 8 PHOTOSYNTHESIS Con. 8.1 Photosynthesis process by which plants use light to make food molecules from carbon dioxide and water (chlorophyll) 6CO 2 + 12H 2 O + Light C 6 H 12 O 6 + 6O 2 + 6H 2
The Two Phases of Photosynthesis
 : light reactions & carbon fixation Global Importance of by green plants and algae provides nearly all of the energy and organic carbon required by living organisms. provides all of the oxygen required
Photosynthesis. Chapter 10. Biology Eighth Edition Neil Campbell and Jane Reece. PowerPoint Lecture Presentations for
 Chapter 10 Photosynthesis PowerPoint Lecture Presentations for Biology Eighth Edition Neil Campbell and Jane Reece Lectures by Chris Romero, updated by Erin Barley with contributions from Joan Sharp Copyright
Photosynthesis. I. Photosynthesis overview A. Purpose B. Location. The light vs. the dark reaction Chloroplasts pigments A. Light absorption B.
 Photosynthesis I. Photosynthesis overview A. Purpose B. Location II. III. The light vs. the dark reaction Chloroplasts pigments A. Light absorption B. Types IV. Light reactions A. Photosystems B. Photophosphorylation
Life on Earth is solar powered. Photosynthesis => conversion of light energy to chemical energy (stored in sugars and other organic molecules).
.") Photosynthesis Life on Earth is solar powered. Photosynthesis => conversion of light energy to chemical energy (stored in sugars and other organic molecules). Organisms obtain organic compounds by one
Photosynthesis Life on Earth is solar powered. Photosynthesis => conversion of light energy to chemical energy (stored in sugars and other organic molecules). Organisms obtain organic compounds by one
Chapter 8 Photosynthesis
 Chapter 8 Photosynthesis 8-1 NRG and Living Things n Where does the NRG we use come from. n Directly or indirectly from the sun n Plants get their NRG directly from the sun n How? n Plants use photosynthesis
REVIEW 3: METABOLISM UNIT RESPIRATION & PHOTOSYNTHESIS. A. Top 10 If you learned anything from this unit, you should have learned:
 Period Date REVIEW 3: METABOLISM UNIT RESPIRATION & PHOTOSYNTHESIS A. Top 10 If you learned anything from this unit, you should have learned: 1. Energy production through chemiosmosis a. pumping of H+
CBSE Quick Revision Notes (Class-11 Biology) CHAPTER-13 PHOTOSYNTHESIS IN HIGHER PLANTS
 CHAPTER-13 PHOTOSYNTHESIS IN HIGHER PLANTS") CBSE Quick Revision Notes (Class-11 Biology) CHAPTER-13 PHOTOSYNTHESIS IN HIGHER PLANTS Photosynthesis is an enzyme regulated anabolic process of manufacture of organic compounds inside the chlorophyll
CBSE Quick Revision Notes (Class-11 Biology) CHAPTER-13 PHOTOSYNTHESIS IN HIGHER PLANTS Photosynthesis is an enzyme regulated anabolic process of manufacture of organic compounds inside the chlorophyll
Plant form and function. Photosynthesis Phloem Plant Nutrition
 Plant form and function Photosynthesis Phloem Plant Nutrition Photosynthetic Water Use Efficiency Fundamental plant problem: Stomata: pathway for diffusion of CO 2 into leaves is the same as the pathway
(A) Calvin cycle (B) Cyclic electron transfer (C) Non-cyclic electron transfer (D) Photorespiration (E) Cellular respiration
 Calvin cycle (B) Cyclic electron transfer (C) Non-cyclic electron transfer (D) Photorespiration (E) Cellular respiration") AP Biology - Problem Drill 08: Photosynthesis No. 1 of 10 #01 1. What term does the statement below refer to? In a photosynthesis process, an electron is excited from P700 and delivered to its receptor,
AP Biology - Problem Drill 08: Photosynthesis No. 1 of 10 #01 1. What term does the statement below refer to? In a photosynthesis process, an electron is excited from P700 and delivered to its receptor,
Plants and Photosynthesis. Chapters 6 and 31
 Plants and Photosynthesis Chapters 6 and 31 Unit 11, Lecture 1 Topics: Introduction to Plants The Shoot System: The Flower Covers information from: Chapter 31 (PG 598 619) Terms to Describe Plants Eukaryotic
Photosynthesis. 3. We have 2 types of organisms depending on their nutrition:
 1 لجان الد فعات/تلخيص علوم حياتية 101 Key concepts 10.1 PHOTOSYNTHESIS CONVERTS LIGHT ENERGY TO THE CHEMICAL ENERGY OF FOOD. 10.2 THE LIGHT REACTIONS CONVERT SOLAR ENERGY TO THE CHEMICAL ENERGY OF ATP
Chapter 7: Photosynthesis
 Chapter 7: Photosynthesis Electromagnetic Spectrum Shortest wavelength Longest wavelength Gamma rays X-rays UV radiation Visible light Infrared radiation Microwaves Radio waves Photons Packets of light
Photosynthesis Thursday, July 7, 2011
 Photosynthesis Photosynthesis in Overview Process by which plants and other autotrophs store the energy of sunlight into sugars. Requires sunlight, water, and carbon dioxide. Overall equation: 6 CO 2
Photosynthesis. Photosynthesis is the process of harnessing the energy of sunlight to make carbohydrates (sugars).
.") Photosynthesis Photosynthesis is the process of harnessing the energy of sunlight to make carbohydrates (sugars). Plants do photosynthesis to make their own food (sugars) and are called, photoautotrophs.
Photosynthesis Photosynthesis is the process of harnessing the energy of sunlight to make carbohydrates (sugars). Plants do photosynthesis to make their own food (sugars) and are called, photoautotrophs.
Photosynthesis in Higher Plants
 Photosynthesis in Higher Plants Very Short Answers Questions: 1. Name the processes which take place in the grana and stroma regions of chloroplasts? A: Grana Light reactions. Trapping light energy, synthesizing
Photosynthesis (Outline)
") Photosynthesis (Outline) 1. Overview of photosynthesis 2. Producers, consumers, and decomposers of the ecosystem (source of carbon and energy) 3. Plant structures: organ, tissue, cells, sub-cellular organelle,
Photosynthesis (Outline) 1. Overview of photosynthesis 2. Producers, consumers, and decomposers of the ecosystem (source of carbon and energy) 3. Plant structures: organ, tissue, cells, sub-cellular organelle,
CHLOROPLASTS, CALVIN CYCLE, PHOTOSYNTHETIC ELECTRON TRANSFER AND PHOTOPHOSPHORYLATION (based on Chapter 19 and 20 of Stryer )
") CHLOROPLASTS, CALVIN CYCLE, PHOTOSYNTHETIC ELECTRON TRANSFER AND PHOTOPHOSPHORYLATION (based on Chapter 19 and 20 of Stryer ) Photosynthesis Photosynthesis Light driven transfer of electron across a membrane
CHLOROPLASTS, CALVIN CYCLE, PHOTOSYNTHETIC ELECTRON TRANSFER AND PHOTOPHOSPHORYLATION (based on Chapter 19 and 20 of Stryer ) Photosynthesis Photosynthesis Light driven transfer of electron across a membrane
Unit 4 Bioenergetics Test Review
 Section A: Adenosine Triphosphate Unit 4 Bioenergetics Test Review Adenosine triphosphate (ATP) is the energy molecule used by all cells to do work. It is a nucleotide consisting of adenine (a base), ribose
Chapter 10 Photosynthesis. Photosynthesis
 Chapter 10 Photosynthesis Photosynthesis The process which feeds the Biosphere! Recall that all forms of life require energy Some forms of life have the ability to sustain themselves without eating anything
Where does most of our society s energy come from (think of fossil fuels), how does that energy become fixed for human use?
, how does that energy become fixed for human use?") Where does most of our society s energy come from (think of fossil fuels), how does that energy become fixed for human use? The Photosynthesis equation 6 CO 2 + 12 H 2 O + Light energy C 6 H 12 O 6 +
Where does most of our society s energy come from (think of fossil fuels), how does that energy become fixed for human use? The Photosynthesis equation 6 CO 2 + 12 H 2 O + Light energy C 6 H 12 O 6 +
Pearson Biology Chapter 8 Class Notes
 Pearson Biology Chapter 8 Class Notes Photosynthesis Chemical Energy and ATP Why is ATP useful to cells? Energy is the Ability to do Work. Cells use Adenosine Triphosphate (ATP) to Store and Release Energy
PHOTOSYNTHESIS. https://www.youtube.com/watch?v=pme blshpbsu
 PHOTOSYNTHESIS https://www.youtube.com/watch?v=pme blshpbsu Energy needs of life All life needs a constant input of energy Heterotrophs (Animals) get their energy from eating others eat food = other organisms
Chapter 8 Photosynthesis Lecture Outline. Copyright The McGraw-Hill Companies, Inc. Permission required for reproduction or display.
 Chapter 8 Photosynthesis Lecture Outline Copyright The McGraw-Hill Companies, Inc. Permission required for reproduction or display. 1 8.1 Overview of Photosynthesis Photosynthesis converts solar energy
Basic stoichiometric equation on photosynthesis and the production of sugar and oxygen via the consumption of CO2, water, and light
 1 2 Basic stoichiometric equation on photosynthesis and the production of sugar and oxygen via the consumption of CO2, water, and light 3 Several pathways exist for fixing CO2 into sugar 4 Photosynthesis
The conversion of usable sunlight energy into chemical energy is associated with the action of the green pigment chlorophyll.
 Photosynthesis Photosynthesis is the process by which plants, some bacteria and some protistans use the energy from sunlight to produce glucose from carbon dioxide and water. This glucose can be converted
Q1. The diagram shows a summary of the light-independent reaction of photosynthesis.
 Q1. The diagram shows a summary of the light-independent reaction of photosynthesis. (a) (i) Complete the boxes to show the number of carbon atoms in the molecules. (ii) In which part of a chloroplast
C MPETENC EN I C ES LECT EC UR U E R
 LECTURE 7: SUGAR TRANSPORT COMPETENCIES Students, after mastering the materials of Plant Physiology course, should be able to: 1. To explain the pathway of sugar transport in plants 2. To explain the mechanism