Variable Chlorophyll Fluorescence Overview (2013)
|
|
|
- Lauren Malone
- 5 years ago
- Views:
Transcription

1 Variable Chlorophyll Fluorescence Overview (2013) Chlorophyll absorbs light most effectively in the red and blue parts of the visible spectrum. Chlorophyll fluorescence is light that is re-emitted at a longer wavelength after being absorbed by chlorophyll molecules at a shorter wavelengths. Variable chlorophyll fluorescence is only observed in chlorophyll a in photosystem II. By measuring the intensity and nature of variable chlorophyll fluorescence, and using protocols that have been developed, plant physiology can be investigated (Baker 2004). The variable nature of chlorophyll fluorescence allows research into the light reaction of plants, plant photo-protection mechanisms, heat dissipation, correlation with photosynthesis carbon assimilation, and measurement of most types of plant stress at usable levels (Baker 2004). As stated earlier, the sole origin of variable chlorophyll fluorescence is chlorophyll a in photosystem II (Zhu 2005). Light energy entering photosystem II can be converted to chemical energy by photochemistry. It can also be re-emitted as chlorophyll fluorescence or it can be re-emitted as heat. These three processes are in competition, so that when photochemistry output is high, chlorophyll fluorescence and heat are lower. Conversely, if fluorescence is maximized, then the other two paths are minimized. While photosystem I does emit chlorophyll fluorescence as well, it is at a much lower level and it is not variable. For that reason, chlorophyll fluorescence of photosystem II is of much greater interest. (Schreiber 2004) Photosynthesis is comprised of a light reaction and a dark reaction. The light reaction converts light energy into chemical energy that can be used in the dark reaction. The dark reaction uses the energy molecules NADPH and ATP, created by the light reaction, to produce simple sugars in conjunction with the assimilation of CO 2 from the air. The relationship between the two is related, and may be correlated, but it is not always straightforward (Rosequist and van Kooten). Correlation of variable chlorophyll fluorescence in the light reaction, and carbon assimilation in the dark reaction has a linear relationship in C 4 plants, and a curve-linear relationship in C 3 plants (Schrieber 2004). This correlation in C 3 plants can break down under special conditions that create photorespiration such as drought and heat stress. Under photorespiratory conditions, oxygen and possibly other electron sinks, alternatively use the energy molecules generated in the light reaction, even after leaf carbon assimilation has been reduced. Under these conditions, chlorophyll fluorescence levels may be unchanged until severe plant stress occurs (Baker 2008), (Flexas 1999). In C 4 plants, there is no significant photorespiration. Fortunately, special chlorophyll fluorescence assays or methods have been developed to overcome the most interesting problem areas including drought stress in C 3 plants, nitrogen stress in C 3 plants and C 4 plants, and heat stress in C 3 and C 4 plants (Desk Top Plant Stress Guide). How does the variable chlorophyll fluorescence work? Upon illumination of a leaf that is dark-adapted overnight, or dark adapted by artificial means, there is a rapid rise in fluorescence from Photosystem II (PSII), followed by a slow decline. This displays the variable nature of chlorophyll fluorescence in photosystem II. It was first detailed by Kautsky in 1931, and this is called the Kautsky Effect. (Govindgee 2004) (Kautsky 1931)
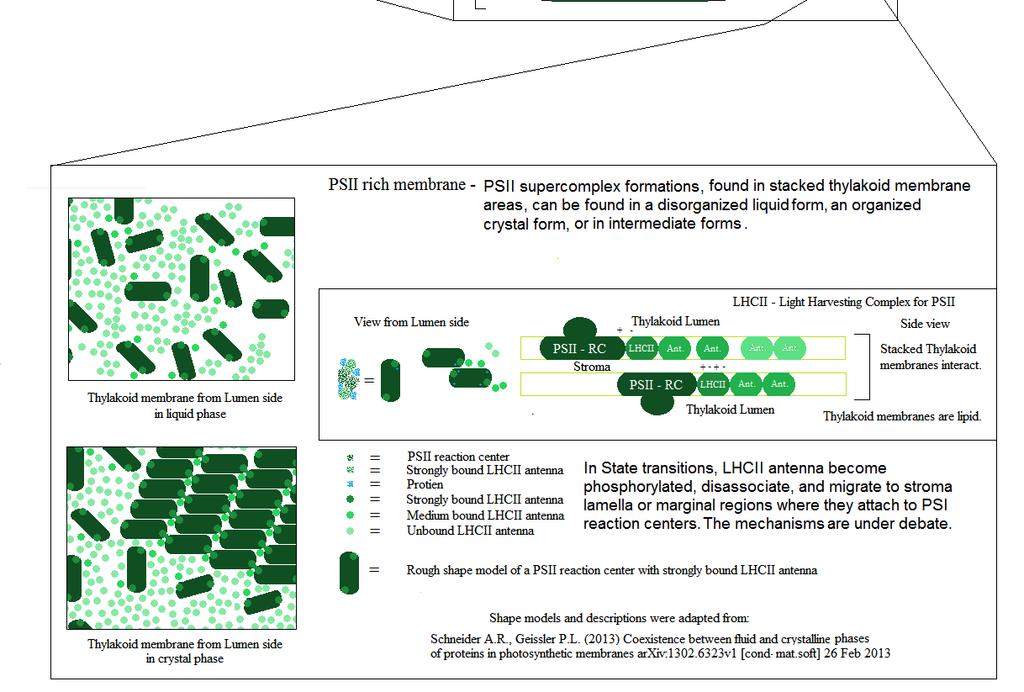
2 In Photosystem II, light is absorbed by accessory pigment-protein complex molecules called antenna (Zhu 2005), and transferred to PSII reaction centers. Zhu divides antenna into peripheral antenna and core antenna. Core antenna are tightly bound chemically and adjacent to the reaction center. Peripheral antenna are near the core and chemically bound strongly, at a medium level, or loosely. They are; however, in close proximity to either photosystem II or photosystem I reaction centers (Schneider 2013). In the photosystem II reaction center are D 1 and D 2 pigment-protein complexes that coordinate the specialized chlorophyll a photoactive reaction center structure, P680. (Papageorgiou 2004). There are different models that show P680 acting as various types of dimer (Papageorgiou 2004), (van Gronelle 2004), (Razewski 2008), or a monomer (Takehashi 2009); however, the Zhu (2005, 2012) papers, written by some of the most prominent chlorophyll fluorescence researchers, focus on fluorescence and provide a conservative approach that is currently the most accepted. The core antenna complexes are known as CP43 and CP47. They are chlorophyll-protein complexes that are adjacent and associated with the D 1 D 2 P680 PSII reaction center. (For more details concerning these structures see Diagrams C & D). There are several different pigment types associated with peripheral antenna including: Chlorophyll a, Chlorophyll b, lutein, xanthophylls, beta carotene, and lycopene. The antenna absorb light in different wavelength ranges, and transfer the energy to nearby photosystem I and II reaction centers. As the energy transfer occurs to the reaction center, a small amount of energy is lost to passive heat loss. The antennas transfer energy to photosytem II reaction centers and to photosystem I reaction centers. Both photosystems are located in thylakoid membranes. Thylakoids are lumened structures stacked, inside plant chloroplasts. They are pictured in the drill down diagrams below ( Diagram B). There are two basic types of photosystems called either photosystem II, or photosystem I. (Diagram C). While it has been shown that chorophyll b can show a slight fluorescence when energy can not be transferred to chlorophyll a, the emission spectrum in the 660 nm to 665nm range, is normally filtered out by chlorophyll fluorometers and it does not directly affect F O, or F V /F M (Govingee 1978). There has been no fluorescence observed in chlorophyll b when energy transfer to chlorophyll a is normal. (Govingee 1978). There are also two varieties of photosystem II reaction centers that affect variable chlorophyll fluorescence. Energy is transferred to either Q B - reducing reaction centers, that are capable of being used in photochemistry, or to Q B - non-reducing reaction centers, that are not capable of photochemistry. Q B - nonreducing reaction centers do not transfer their energy to other reaction centers, and the absorbed energy is reemitted as either heat or non-variable chlorophyll fluorescence at a low level. Q B - non-reducing reaction centers have smaller core antenna, an oxygen evolving complex, and no peripheral antenna. There is also no electron transfer beyond Quinone A or Q A. (Quinone B is designated Q B ). A higher number of Q B - nonreducing reaction centers in the leaf therefore increase the minimum fluorescence, F O, which is measured in a dark adapted state, and decreases the F V /F M measurement parameter to be discussed in detail later (Zhu 2005). Q B - reducing reaction centers that can be used in photochemistry, can be either opened or closed. They are open if they are chemically oxidized, and they are closed if they have been chemically reduced. Closed Q B - reducing reaction centers can transfer additional energy to other open Q B - reducing reaction centers. In a properly dark adapted state, most or all Q B - reducing reaction centers will be open (Zhu 2005). When a, Photosystem II, Q B - reducing reaction centers receive an adequate threshold of light energy, it drives something called charge separation that occurs in photosystem II (Zhu 2005). This, and the electron transfer to the A O molecule in photosystem I are the only steps where light energy is converted into chemical energy (Zhu 2005). At charge separation in photosystem II, an electron is transferred from P 680, the primary electron donor, to the primary electron acceptor, pheophytin. The chemical process for charge separation is shown in diagram
3 A. During this process, an electron is added from Tyrozine, Y Z, generated from the Oxygen Evolving Complex, through the Mehler reaction. The oxygen evolving complex involved in this process is also shown in the diagram C below (Zhu 2005). The energy levels of the remaining steps in the light reaction of photosystem II are all down hill in oxidation-reduction reactions (Zhu 2005). Measuring fluorescence in a dark adapted state, starts by measuring minimum fluorescence generated by peripheral and core antenna before any Q A has been chemically reduced (Zhu 2005). This is commonly done using a modulated chlorophyll fluorometer that excites minimum fluorescence. The modulated light source is adjusted high enough to allow minimum antenna fluorescence measurement, but it is set low enough to prevent the reduction of any Q A. Additional sources of minimum fluorescence also include Photosystem I, and PSII Q B - non-reducing reaction centers (Zhu 2005), (Opti-Sciences F V /F M checklist application note). The rise of variable chlorophyll fluorescence starts at charge separation and continues through the reduction of Q A, Q B, and the reduction of the Plastoquinone Pool. Evidence shows that the rise ends with the reoxidation of PQH 2 (Plastoquinol) to PQ (plastoquinone) by the Cytochrome b 6 f complex. Maximum variable fluorescence or F M, occurs when Q A Q B 2- and PQH 2 are at a maximum (Zhu 2005). The height of F M is affected by the size of the Plastoquinone pool and the rate constant for reoxidation of PQH 2 to PQ. A higher, k ox, reoxidation constant, or a larger plastoquinone pool reduces the F M value (Zhu 2005). Measuring screens from the OS30p+ and the OS1p F O represents minimum chlorophyll fluorescence before any Q A has been reduced. F M is maximum variable chlorophyll fluorescence when Q A Q B 2- and PQH 2 are at a maximum. F O is affected by the number of the number of Q B - non-reducing reaction centers. Higher numbers raise F O. It is also affected by the ratio of PSII to PSI reaction centers. In C 4 plants, where the ratio of PSI reaction centers is higher than in C 3 plants, PSI non-variable fluorescence can represent up to 50% of F O (Shreiber 2004). It is also affected by dark adaptation status and setting the modulated light correctly. PSI gives off a low non-variable chlorophyll fluorescence. The height of F M is affected by the size of the Plastoquinone pool and the rate constant for reoxidation of PQH 2 to PQ. A higher, k ox, reoxidation constant, or a larger plastoquinone pool reduces the F M value (Zhu 2005). It is also affected by using a proper dark adapted state to relax the xanthophyll cycle, )ph of the thylakoid lumen, and state transitions. In addition it can also be affected by light history as it applies to acute photoinhibition and chronic photoinhibition (Lichtenthaller 2004). Acute photoinhibition, caused by high light levels for an hour or two, relaxes or repairs in 30 minute or less, while chronic photoinhibition, caused by several hours of high light levels, starts to relax or repair after 40 minutes, and may take from 40 to 60 hours to relax or repair (Lichtenthaller 2004). This means that there will likely be some photoinhibition that is built into field plant measurements after a sunny day. For this reason, it is important to compare samples with a similar light history, or take this variable into account when designing experiments. See the Opti-Sciences quenching application note for more details. See the Opti-Sciences Desk Top Plant Stress Guide for using F V /F M along with recommendations and references regarding specific types of plant stress.

4 (Diagram A) This diagram is adapted from Zhu 2005 page 116, with more in-depth descriptions for purposes of understanding. It represents one reducing Q B - PSII unit.
")
5 (Diagram B)


6 (Diagram C) This is a drill down diagram of the mechanisms that affect variable chlorophyll fluorescence. It designed as a more visual representation of the most accepted understanding of the sources of chlorophyll fluorescence and variable chlorophyll fluorescence. Chlorophyll fluorescence generating sources for Photosystem II were taken from Zhu 2005, & Photosystem I information was taken from Schreiber (2004)

7 (Diagram D) OJIP and F V /F M - Understanding the fluorescence rise and steps. If the rise in chlorophyll fluorescence is examined with high speed time resolution in the range of microseconds, and milliseconds, specific steps appear during the rise. The following descriptions represent a synopsis of information available from a paper written by Xin-Guang Zhu, Govindjee, Neil R. Baker, Eric desturler Donald R. Ort, and Stephen P. Long in The information was reaffirmed in a second paper in 2012 by Xin-Guang Zhu,Yu Wang, Donald R. Ort, and Stephen P. Long. These are some of most respected names in chlorophyll fluorescence and photosynthesis. While there is still some debate regarding some of the details of the OJIP fluorescence rise, this approach is the one that is most accepted.
8 O is commonly measured at 20 :sec. after the start of actinic illumination in continuous fluorometers, and is not equal to F O measured by modulated fluorometers. Continuous fluorometers use linear regression analysis to estimate F O, or minimum fluorescence in a dark adapted state, before any Q A has been chemically reduced. Logarithmic time scale Logarithmic time scale The height of both O and F O are affected by the ratio of the size of peripheral antenna to core antenna. A larger ratio of peripheral antenna causes O and F O to be lower. Both O and F O are affected by the ratio of Q B - nonreducing reaction centers to Q B - reducing reaction centers. As the ratio of Q B - non-reducing reaction centers increases, both O and F O values increase. This is shown in the bottom diagram. The green line represents a sample with significantly fewer Q B - non-reducing reaction centers, and the red line represents a much higher percentage of Q B - non-reducing reaction centers. O to J The slope of the rise in fluorescence is affected by the probability that excitation energy will migrate from a closed Q B - reducing reaction center to an open Q B - reducing reaction center. Higher probability delays the rise as shown in the lower diagram in dark blue. Q B - non-reducing reaction centers do not transfer energy to open Q B - reducing reaction centers. Energy absorbed by these reaction centers is converted to heat and fluorescence only. They are not involved in photochemistry. The O-J rise represents the photochemical reduction of pheophytin and Q A. J represents maximum values for Q A Q B - and Q A - Q B -. J becomes more defined and lower if the dark adapted Oxygen Evolving Complex ratio of the specific states of S 1 to S 0 move from 1:0 to 0:1. The Dip after J becomes more defined with a higher S 0 value. It provides a greater P concentration that is a strong fluorescence quencher. This dip is shown in the lower diagram in light blue. A separate new step called the K step can appear at 300 :sec. It only appears at high light levels (Vredenberg 2004), when there is severe nitrogen, iron, or sulfur deficiency (Strasser 2004). The Zhu 2005 paper show that the timing of J is somewhat variable. However, in the Strasser JIP protocol, used for plant stress measurement, it is fixed at 2 msec.
9 Logarithmic time scale J to I - This rise represents the photochemical reduction of Q B. I represents the first shoulder in the Q A Q B 2- chemical equation that ends at P with a maximum for Q A - Q B 2-. If properly dark adapted, the J to I rise starts with the ratio of Q B : Q B - = 1:0 and ends with the ratio at 0:1.The dark adapted ratio prior to light exposure of Q B : Q B - affects the slope and height of I as shown in the lower diagram by the yellow line. Again, the Zhu group shows that the time to reach I is also somewhat variable. However, in the Strasser JIP protocol, used for plant stress measurement, it is fixed at 30 msec. Logarithmic time scale P = F M or Maximum variable chlorophyll fluorescence. This value represents a maximum for chemical values of Q A - Q B 2-, & PQH 2. The rise in fluorescence ends with the cytochrome b 6 f complex re-oxidizing PQH 2 to PQ. The height and slope of the rise to P or F M are affected by the reoxidation rate constant of PQ, k ox, and by the size of the plastoquinone pool. A higher rate constant and a larger PQ pool reduce the value for P. The time to reach P is variable in the Zhu paper and in the Strasser JIP protocol. A high rate constant reduces the time to reach P, and a larger PQ pool extends the time to reach P. The time to reach P is reported in the Strasser protocol. A larger PQ pool is shown in the lower diagram in dark red crimson. In 2004, Wim Vredenberg discovered that the OJIP graph changes dramatically at different actinic light levels. In fact, the K step only appears under very high light levels, and under specific severe plant stress conditions. For this reason, it is common to calibrate the light source of OJIP instruments, to ensure comparable results. The OS30p + provides automatic actinic light calibration when the instrument is turned on. (Vredenberg 2004) The quality of light can also be a factor. It has been found that red actinic light penetrates the entire leaf, while blue light does not. For this reason, it has been common to compare work done using the same type of saturating actinic light sources. The OS30p+ offers a red calibrated light source with intensities that may be set at 3,500 :mols for the Strasser protocol and up to 6,000 :mols for other work. Various light sources are used for measurement of F V /F M. Industry options include, red, red and blue, and white light halogen, LED, and Xenon light sources. A paper comparing xenon and red light saturating light sources provided results that correlated well with slightly lower values using a red light source (Cessna 2010). The paper found poorer correlation with blue saturating light. For longer measuring protocols used in quenching measurements, and light curves, or for extended preillumination of shorter light adapted tests, white actinic light sources have advantages, or at least illumination with red and blue actinic light. The apertures of plant stoma are mediated by blue actinic light (Kinoshita 2001). The absorption ratio of red to blue light changes with light intensity (Bernacchi 2002).
10 Photochemical and Non-photochemical quenching. After proper dark adaptation to a known state, a leaf is exposed to a photosystem saturating light. Initially, a maximum amount of the saturating light, absorbed by the leaf, and used in F V /F M, goes to variable chlorophyll fluorescence with smaller amounts going to unregulated heat dissipation and photochemistry. The same thing is true when using a saturating actinic light in OJIP protocols for the initial rise of fluorescence. There are other mechanisms, that are slower reacting, that affect variable chlorophyll fluorescence. After dark adaptation, and the initial rise in chlorophyll fluorescence, these mechanisms begin to respond. Depending on the type of plant, peak fluorescence is maintained from 0.5 seconds to 1.5 seconds in land plants (Schreiber 1995), and from 25 milliseconds, to 50 milliseconds in algae (Schreiber 1995). The fluorescence output then begins to drop due to the initiation of photosynthesis where more light is used in photochemistry, a process called photochemical quenching. This, and photo-protective mechanisms, start to adapt to existing actinic light levels. The xanthophyll cycle and the ) Ph of the thylakoid lumen convert absorbed light into regulated heat dissipation, a form of non-photochemical quenching, considered to work as photoprotective mechanisms. At higher light levels, there is more non-photochemical quenching. This process takes about four minutes in greenhouse plants (Lichtenthaler 2004), but it can take up to seven minutes in field plants (Baker 2008). q E is a parameter that is used to measure the non-photochemical quenching photoprotective mechanisms. This parameter is used in conjunction with quenching relaxation protocols (Muller 2001). q L from the lake model and q P from the puddle model are parameters designed to measure photochemical quenching or a measure of open PSII reaction centers. There are still other slower acting mechanism that continues to lower fluorescence output after the initial fluorescence rise. A mechanism called state transitions continue to adjust for between for fifteen to twenty minutes to finally reach steady state photosynthesis at a specific actinic light level. (Maxwell and Johnson 2000). State transitions State transitions, are thought to be a low light survival mechanism. This process can take between fifteen to twenty minutes at a fixed light level in field plants. It therefore overlaps somewhat with photoprotection mechanisms in q E. (Ruban, Johnson 2009) (Maxwell and Johnson 2000). They act to balance light distribution between the two photosystems in an attempt to utilize all available light. State transitions are a larger component of light adapted fluorescence measurements taken at low light levels than at higher light levels. Lichtenthaler found that state transition adjustment of fluorescence levels represented 67% of nonphotochemical quenching at 10 :mols PAR actinic levels, and only 5% of non-photochemical quenching at 2000 :mols PAR actinic levels, on the plants tested (Lichtenthaler 1999). q T is the parameter used to measure the effects of state transitions (Muller 2001), (Ruban, Johnson 2009). This parameter is also part of quenching relaxation protocols. Photophosphorylation changes the affinity of some of these antenna from photosystem II to photosystem I. This causes some of these complexes to detach, migrate to Photosystem I and serve as antennae for Photosystem I. When the plastoquinone pool is more oxidized, it activates a second enzyme to dephosphorylate these transient antennae and cause migration to PSII reaction centers. Kinase enzymes that are associated with phosphorylation and the phosphotase enzyme is associated with dephosphorylation (Ruban, Johnson 2009) (Tikkanen 2011). As a result, the emitted chlorophyll fluorescence drops until steady state photosynthesis is reached. The initial rise in fluorescence levels, in land plants, can take from 0.3 seconds to 1.5 seconds. Subsequently, fluorescence decreases due to photochemical quenching, non-photochemical quenching, and state transitions can occur for between 15 to 20 minutes, until steady state photosynthesis is reached (Maxwell and Johnson 2000). While state transitions
11 are not really a form of non-photochemical quenching, they are both reflected in NPQ and q N measuring values at steady state photosynthesis.(muller 2001). Photoinhibition Photoinhibition is a process that can occur at high light levels for extended periods of time. It has been shown that the effects of acute photo-inhibition caused by exposure to high light intensities for an hour or two, can be reversed with 20 to 30 minutes of dark adaption (Theile, Krause & Winter 1998). Where as reversal of chronic photo-inhibition, caused by several hours of exposure, starts to relax or repair at about 40 minutes and may take 30 to 60 hours to fully relax or repair under dark adaptation (Lichtenthaler H. & Babani F. (2004) (Theile, Krause & Winter 1998). When making longer quenching and quenching relaxation parameter measurements related to photo-inhibition and photo-damage mechanisms that are common in chronic high light stress, high heat stress, cold stress and over wintering stress, one should understand that it can take days for full relaxation or repair of the non-photochemical quenching parameters, q I, to pre-stress conditions. To get an accurate control value for Fm and Fo under chronic photo-inhibition conditions (components of nonphotochemical quenching parameters) it is common to dark-adapt for a full night, or 24 hours. (Maxwell and Johnson 2000). It is expected and accepted that there is some residual unrelaxed photoinhibition or NPQ in field plants using dark adapted samples, after sunny days, in the summer time. For this reason, it is important to compare samples with similar light history (Light history application note). Never compare any of the nonphotochemical quenching value in samples that do not have the same F V /F M ecause F V /F M is the yard or meter stick used to determine these values. For more information on quenching measurements, refer to the OSI application note on quenching measurement. Other plant pigments Carotenoids are present in the antenna systems and reaction cores and in other locations. They include alpha and beta carotene, and xanthophylls: lutien, zeazanthin, violaxanthin, antheraxanthin and neozanthin. Carotenoids are involved in a number of processes including: Acting as antenna in the transfer of energy to PS II and PSI reaction centers; the xanthophyll cycle is used in plant photo-protection to dissipate excess light energy, the blocking of free oxygen and organic radical, and the quenching of chlorophyll excited states as well as singlet oxygen (Gitelson 2002). The ratio of red light leaf absorption to blue light leaf absorption changes with actinic light intensity level (Bernacchi 2002). There is significant evidence to show that violazanthin converts to zeaxanthin as light levels increase, and that zeazanthin binds with the protein PcbS in a photoprotective role that shifts the absorption spectrum (Aspinall-O Dea 2002). In addition, zeaxanthin, in stoma guard cells, has been linked to stoma aperture size and appears to be mediated by blue light Kinoshita (2001) Ziegler (1998). The function of anthocyanins in leaves, has been the subject of debate. They have been found most commonly in cell vacuoles but may be found in all plant tissues. There is evidence to show that they function as longer term photo-protective mechanisms, help serve in the protection of shade leaves from high intensity sunflecks, help provide protection against UV-B, function in antioxidant activity, act as attractors to animals for pollen and seed distribution, or act indirectly in signaling mechanisms involved in plant growth, and development, plant stress response, and gene expression. The affects can vary from one species to the next (Gould 2009).

12 Assessing plant physiology and plant stress with chlorophyll fluorescence Chlorophyll fluorescence measurement has become a widely used technique for measuring plant stress, it is used for investigating the light reaction of photosynthesis, and its interaction with the dark reaction. It is important to use the correct measuring protocol for a specific type of plant stress as each protocol has limitations for specific types of plant stress measurement (Desk Top Plant Stress Guide). Some protocols will work for usable early detection of some types of plant stress, and on other types of plant stress, that same protocol may not work until the plant stress type is severe. The most used protocols, F V /F M, and Y(II),are fast tests that normally take only seconds. This allows the measurement of statistically significant plant populations in the field, or in the laboratory. The other factors that have made these techniques popular include light weight portable instrumentation, and the relatively inexpensive pricing of instrumentation. Longer protocols also exist including: Quenching measuring protocols for the measurement of plant photoprotective mechanisms, state transitions, photoinhibiton, and the fraction of open reaction centers at a given actinic light level. It is also possible to create fluorescence light curves to measure plant responses to different steady state PAR light levels, and to use rapid light curves to measure plant responses to rapidly changing PAR (photosynthetically active radiation) light levels. Chlorophyll fluorescence can also be used in combination with photosynthesis gas- exchange instrumentation to study both the light and dark reaction. This combination now allows the measurement of additional photosynthesis parameters that are unavailable without the combined use of gas-exchange and chlorophyll fluorescence. They include mesophyll conductance or g m, and CO 2 at the sight of carboxilation or C c. The combination is also useful for cold stress measurement where J or retr values are about three times higher than expected when compared to gas exchange measurements (Desk top Plant Stress Guide). It is also useful in the study of C 3 plants under photorespiratory conditions found in plant drought stress, and in heat stress measurements (Desk top Plant Stress Guide).
13 Measuring fluorescence The most common ways to measure chlorophyll fluorescence involve modulated fluorometers, continuous fluorometers and fluorometers that use ratios of fluorescence values. F V /F M protocol F V /F M is a normalized ratio that allows comparison of plant samples at a known dark adapted state. For this reason, and because the cost of instruments that just measure F V /F M are lower than instruments that measure multiple measuring protocols, F V /F M is the most used chlorophyll fluorescence measuring parameter in the world. F V /F M is measured with a modulated fluorometer and can be estimated with a continuous fluorometer. This is a fast test that requires adequate dark adaptation (Desk Top Plant Stress guide). F V /F M = (F M F O ) / F M F M is maximum fluorescence, or the peak fluorescent value from the Kautsky curve. It represents measurement of a sample after proper dark adaptation, when all available PSII reaction centers are in an oxidized, open condition. The sample is then exposed to a saturating light that closes, or chemically reduces, all available PSII reaction centers. With a saturation light, F M is the highest fluorescence value or an average of the highest values. F O is minimum fluorescence. It represents fluorescence emitted from antennae before the any Q A (quinone A) has been chemically reduced in the leaf. Using a modulated light fluorometer, a very weak modulated light, < 1 :mol, is used to excite this minimum fluorescence. It must be high enough to allow measurement, but low enough so that it does not drive the charge separation reaction of the light reaction. F O is then prephotosynthetic fluorescence before any Q A has been reduced (Zhu 2005). In continuous fluorometers, F O is estimated using linear regression analysis from the initial slope of the fluorescent increase. It has been found that for many types of plant stress, the number of Q B - non-reducing centers increase, raising F O, and reducing F V /F M. F M can also be reduced by larger plastoquinoe pools and higher plasotoquinoe reoxidation constants (Zhu 2005). The maximum F V /F M value for a healthy plant under ideal conditions is between 0.79 and for most species. Lower values indicate plant stress. While F V /F M may be used for all types of plant stress, it can best be used where the technique is capable of measuring plant stress at usable levels. For some types of plant stress, other chlorophyll fluorescence protocols and assays are available to measure (Desk Top Plant Stress Guide) F V /F M was developed by Kitajima and Butler in Results have been shown to correlate well with photosynthesis measurements for many types of plant stress. (Desk Top Plant Stress Guide) These are the graphic displays of the OS30p + and the OS1p using the F V /F M measuring protocol. The OS30p+ is on the left and the OS1p is on the right. Saturation pulse duration time is the same for both, but the graphic display is set up to scale differently here.

14 Y(II) protocol Y(II) also known as )F/FM, and M PSII Y(II) = (F M F S ) / F M This is a fast light adapted measurement taken only when the plant is at steady state photosynthesis. Developed in 1989 and 1990 by Bernard Genty, this test requires a modulated fluorometer. F S is the chlorophyll fluorescence intensity value emitted by a plant at steady state photosynthesis. It is also known as F. F M is the maximum fluorescence measurement when a saturating light is applied to the leaf at steady state photosynthesis. It takes between 15 to 20 minutes at a fixed light level to reach steady state photosynthesis (Maxwell and Johnson 2000). Y(II) varies with PAR light intensity, therefore it is important to measure PAR with a meter near the leaf and at the same angle as the leaf, while it reached steady state. Y(II) has been shown to correlate to photosynthesis measurements under many plant stress conditions. It has also been shown to be more sensitive to more types of plant stress or, in some cases, detect plant stress conditions earlier than F V /F M. For example F V /F M will only detect heat stress above 45 o C, while Y(II) has been shown to detect plant heat stress at 35 o C. (Haldiman P, 2004) Y(II) works very well for most types of plant stress measurement in C 4 plants, including drought stress. In C 3 plants, photorespiration can create problems for drought stress measurement unless it is severe (Flexas 1999, 2000). In this case, a special assay, called the Burke assay, can be used to detect early drought or water stress. (Desk Top Plant Stress Guide). This is a graphic display of the OS1p using the Y(II) measuring protocol. retr or J- Electron Transport Rate retr is relative electron transport rate and J is the equivalent value used by gas exchange experts. In its basic form, it is an estimate of the number of electrons transported through photosystem II under steady state photosynthetic conditions. It has also been shown to correlate well to gas exchange photosynthesis measurements under many types of plant stress conditions. retr = 0.84 x 0.5 x PAR is a relative equation using average values. or retr = the leaf absorptance x decimal fraction of PSII reaction centers x PAR (Photosythetically Active Radiation).

 and under carbon deficiency (Zell 2010), (Anderson 1999)")
15 Leaf absorbance can vary for 0.70 to (Eichelman H. 2004), and the ratio of PSII reaction centers can vary from 0.4 to 0.6 (Edwards GE.1993), (Laisk A. 1996). C 4 plants tend to be in the ratio range of 0.4 PSII reaction centers, and C 3 plants tend to be closer to a 0.5 PSII ratio range. Eichelman, Edwards and Laisk are good sources for information on individual species and conditions. The ratio of PSII reaction centers to PSI reaction centers is different for leaves grown in shade than grown in the sun (Anderson 1995) and under carbon deficiency (Zell 2010), (Anderson 1999) (Elgass 2011). It has been stated that ETR or J should only be used for comparisons on leaves where the leaf absorptance and ratio of PSII to PSI reaction centers have been measured (Baker 2008). The ratio of red light absorptance to blue light absorptance changes with light intensity (Bernacchi 2002). It has been common to measure leaf absorbtance using an integrating sphere (Baker 2008), (Bernacchi 2002); however, estimates have been made using less exacting methods. For measuring the ratio of PSII to PSI, it has been common to use spectral analysis of samples at 77 o K, however, a new method uses spectral analysis in vivo at room temperature (Elgass 2011). Quenching measurement protocols There are two types of fluorescence quenching measurements, non-photochemical quenching and photochemical quenching. The uses of a modulated fluorometer is required for these measurements. Photochemical quenching is a measure of the fraction of still open PSII reaction centers. Non-photochemical quenching is a measure of heat dissipation impacted by photo-protection mechanisms, state transitions, and photoinhibition that can be affected by different types of plant stress. Most of parameters used for measuring quenching must be made at steady state photosynthesis to be valid by definition; however, Y(NO) in the lake model does not need to be at steady state. (OSI quenching application note) When making quenching measurements, samples should only be compared if they have the same F V /F M values, since F V /F M is the measuring reference for quenching values (Baker 2008). The display on the left shows the OS1p using the Hendrickson lake model quenching protocol with NPQ resurrected from the puddle model. These three graphs represent the display screens from the OS5p using three different quenching protocols. The graph on the left is using the Hendrickson lake model protocol with NPQ resurrected from the puddle model. The center display shows the Kramer lake model protocol and the display on the right shows the puddle model protocol with quenching relaxation protocol.
16 Lake model and puddle model quenching parameters. Understanding of the organization of antennae and reaction centers has changed over the years. It is now understood that a single antennae does not link only to a single reaction center as was previously described in the puddle model. Current evidence indicates that reaction centers are connected with shared antennae in terrestrial plants. qp, the parameter that has been used in the past to represent the fraction of PSII reaction centers that are open, is a puddle model parameter. Dave Kramer (2004) has come up with a set of fluorescence parameters that represent the newer shared antennae paradigm called the lake model. Others have also come up with more simplified equations that eliminate the need for the measurement of Fo and approximate the measurements made by Kramer. Fo is a controversial parameter is some circles. Hendrickson s (2004) work offered an alternative lake model solution with Y(NPQ) measurements that are consistently and only marginally lower values than Kramer s work, and Y(NO) measurements that are consistently and marginally lower except at high light levels and low temperatures than Kramer s work. He speculates that the differences in values between Kramer and his own were possibly due to the difficulties in making Fo (or Fod) measurements. Furthermore, Hendrickson does not provide a photochemical quenching parameter like ql to estimate the fraction of open PSII centers. From Hendrickson s work, earlier works by Cailly (1996), and Genty (1989, 1990), Klughammer and Schreiber derive simplified equations that allow NPQ to be reconciled with the lake model. Since there is a large volume of work that has been done investigating large numbers of plant species and plant mechanisms using NPQ, it allows the transition from puddle model to lake model measurement to occur in less painful way. Furthermore Hendickson s equations provide lake model parameters without the use of the controversial parameter Fo. Today, all of these methods are still in use. Kramer s lake model equations: Y(II) = (F M - Fs)/F M or )F M / F M Y(NO) = 1/(NPQ+1+qL (F M /F O -1)) Hendrickson s Y(NPQ) = 1 - Y(II) lake -Y(NO) model equations: Y(II) ql = = qp(f M O /Fs) - Fs)/F or M ql or = )F qp(f M / O /F) F M Y(NO) = Fs/F M or F /F M Y(NPQ) =( Fs/F M )-Y(NO) or (F/F M ) - Y(NO) Klughammer and Schreiber s lake model NPQ, determined from Hendrickson s equations. NPQ= Y(NPQ)/Y(NO) or NPQ = (F M -F M )/F M
17 Puddle model equations: q P = (F M - Fs)/(F M -F O ) or qp = F M -F )/(F M -F O ) Above 0.4, F O should replace F O q N = 1- ((F M -F O ) / (F M -F O )) Above 0.4, F O or F O should replace F O NPQ = (F M -F M )/F M or NPQ = (F M -F M )/F M NPQ = qe+qt+qi qe = ((F ME -F M )/(F M -F M )) F ME is the relaxation saturation value at four to ten minutes in the dark. FM is the last light adapted F M value at steady state fluorescence. Field plants require the longer times to measure q E. Times of up to ten minutes have been reported. qt = ((F MT -F ME )/ (F M -F M )) F MT is the relaxation saturation value at twenty minutes in the dark. qi = ((F M -F MT ) / F M -F M )) Relaxation of q I starts at about forty minutes and can take up to sixty hours. qi can be determined from the dark adapted F M measurement and the saturation pulse after 20 minutes used for q T Since NPQ has been resurrected for the lake model, the quenching parameters q E, q T, and q I are also valid in the lake model. Measurement of q E, q T and q I q E, q T and q I require a quenching relaxation measuring protocol that is only available on the most advanced chlorophyll fluorometers. A stable light source is required to achieve a reliable steady state photosynthesis level. These measurements take time. It is common to dark adapt overnight, and then expose the leaf to a stable light source at a specific intensity for twenty minutes, the time required to reach steady state photosynthesis in many plants. It then requires the use of saturation pulses in the dark to measure quenching relaxation for another twenty minutes while q E, and q T relax. A modulated light is also used (see the quenching app note for more details). Quenching parameter definitions, advantages, and limitations: Puddle model NPQ (puddle model and Henrickson lake model parameter) is non-photochemical quenching and is a measure of heat dissipation. NPQ is an alternate expression of non-photochemical quenching. It provides an estimate of quenching without knowledge of F O. The advantage of NPQ over q N depends on the specific application. NPQ is more heavily affected by non-photochemical quenching that reflects heat-dissipation of excitation energy in the antenna system. So, it may be thought of as an indicator of 'excess excitation energy'. Alternatively, NPQ is relatively insensitive to the part of nonphotochemical quenching associated with q N values lower than 0.6. The range of NPQ is affected by )ph of the thylakoid lumen which is an important aspect of photosynthetic regulation, state transitions and photoinhibition. Numbers range from zero to infinity with typical samples measuring in the 0.5 to 3.5 range (Maxwell and Johnson 2000). (Bilger & Björkman, 1990), (Muller P., Xiao-Ping L., Niyogi K. 2001).
18 q N (puddle model quenching protocol parameter) is similar to NPQ but requires Fod or Fo in the calculation. qn is defined as the coefficient of non-photochemical fluorescence quenching. The original definition of this term implied that fluorescence quenching affects primarily the 'variable fluorescence' (Fv) and not the minimal fluorescence (Fo). In cases where qn is greater than 0.4 this may not be a good assumption. When qn is above 0.4, Fo (or Fod) should replace Fo in q P equations. qn is less sensitive than NPQ at higher values (Maxwell and Johnson 2000). By using the Far-Red source after actinic illumination is turned off, the PSII acceptors re-oxidized and PSI is reduced. A new Fo value is measured and used for corrections to the quenching coefficients. Numbers range from zero to one. (puddle model) (Van Kooten & Snel, 1990) q P (puddle model protocol parameter) is the quenching parameter that represents photochemical quenching. It is a measure of the fraction of still open PSII reaction centers. qp is defined as the coefficients of photochemical fluorescence quenching. The original definition of this term implied that fluorescence quenching affects primarily the 'variable fluorescence' (Fv) and not the minimal fluorescence (Fo). In cases where qn is greater than 0.4 this may not be a good assumption. When qn is above 0.4, Fo (or Fod) should replace Fo in qp equations. By using the Far-Red source for post illumination, the PSII acceptors may be reoxidized through the illumination affect on PSI. A new Fod value may be measured and used for corrections to the quenching coefficients. This assumes the PSI acceptors are properly activated, which may not be the case in a dark adapted sample. Therefore, the Fod determination should be done after induction of photosynthesis has been done for several minutes. Numbers range from zero to one. (Puddle model) (Van Kooten & Snel, 1990) q E (puddle model or Hendrickson lake model quenching relaxation protocol parameter) is the quenching parameter that represents the photo-protective mechanisms in the leaf that allow rapid compensation for changes in light levels due to cloud cover and increased light intensity. It is directly related to )ph of the thylakoid lumen and the xanthophyll cycle. (Muller P., Xiao-Ping L., Niyogi K. 2001) This process is completed in two to four minutes after an actinic light is turned on. (Lichtenthaler 1999). It is delineated from NPQ by using a quenching relaxation method. Some researchers in the past have also divided qn into qe, qt, and qi instead of NPQ (Lichtenthaler 1999) The relaxation characteristics of field plants can vary with changing environmental conditions (Baker 2008). q T (puddle model or Hendrickson lake model quenching relaxation protocol parameter) is not true quenching. Instead, the parameter represents state 1 and state 2 transitions. This value is negligible in higher plants at high light levels but may be substantial at low light levels (Lichtenthaler 1999) (Baker 2008). According to Ruban (2008) state transitions require between fifteen and twenty minutes to complete. It can be delineated from NPQ by using a quenching relaxation method (Muller P., Xiao-Ping L., Niyogi K. 2001). For more information on state transitions, and how they affect fluorescence measurement contact Opti- Sciences for the application note on state transitions. The relaxation characteristics of field plants can vary with changing environmental conditions (Baker 2008). q I (puddle model or Hendrickson lake model quenching relaxation protocol parameter) is the quenching parameter that represents photo-inhibition and photo-damage. (Puddle model) (Muller P., Xiao- Ping L., Niyogi K. 2001) According to Lichtenthaler (1999, 2004) chronic photoinhibition starts to relax after forty minutes in the dark and may take up to sixty hours. It can be delineated from NPQ by using a quenching relaxation method. The relaxation characteristics of field plants can vary with changing environmental conditions (Baker 2008).

19 This is an OS5p quenching relaxation protocol graph with captions. All of these parameters except F V /F M and its components are, by definition, only valid at steady state photosynthesis. Because it takes state transitions between fifteen to twenty minutes to adjust in land plants, a stable actinic light source is used to radiate light on a leaf for twenty minutes. At this point, the actinic light is turned off and saturation pulses are used in the dark to show the relaxation of the various plant mechanisms. Saturation pulses must be at least one to two minutes apart to prevent saturation pulse NPQ (Roseqvist and van Kooten 2006). Acute photoinhibition takes up to 30 min to relax or repair, and it can take up to sixty hours for chronic photoinhibition to relax or repair. Notice that F M is the reference for these values. For that reason, one should never compare nonphotochemical quenching measurements on samples that have a different F V /F M. Since NPQ has been resurrected to the lake model in the Hendrickson equations, q E, q T, and q I can also be used with lake model. q E and q T Kramer overlap to lake some model degree quenching (Muller 2001). parameters Y(NPQ) (lake model quenching parameter) It represents heat dissipation related to all photo-protective mechanisms also called regulated heat dissipation. (David M. Kramer, Giles Johnson, Olavi Kiirats & Gerald E. Edwards 2004) (Klughammer and Schreiber 2008). A low Y(NPQ) at high light levels is an indication of sub-optimal photoprotective mechanisms. (Klughammer and Schreiber 2008). Y(NO) (lake model quenching parameter) It represents all other components of non-photochemical quenching that are not photo-protective. They include non-radiative decay, and fluorescence. Part of Y(NO) includes photoinhibition (David M. Kramer, Giles Johnson, Olavi Kiirats & Gerald E. Edwards 2004). Klughammer and Schrieber define Y(NO) as the fraction of energy that is passively dissipated in the form of heat and fluorescence mainly due to closed PSII reaction centers. Hendrickson calls Y(NO) constitutive heat dissipation. A high Y(NO) value after dark adaptation is an indication of photodamage. (Klughammer and Schreiber 2008). q L (Kramer lake model quenching parameter) It represents photochemical quenching. It is a measure of the fraction of still open PSII reaction centers. (David M. Kramer, Giles Johnson, Olavi Kiirats & Gerald E. Edwards 2004). Y(II) = (lake model) quantum yield of photosynthetic energy. The equation is the same as for Y, or )F/Fm.
20 Hendrickson lake model quenching parameters Y(NPQ) (lake model quenching parameter) It represents heat dissipation related to all photo-protective mechanisms also called regulated heat dissipation. (David M. Kramer, Giles Johnson, Olavi Kiirats & Gerald E. Edwards 2004) (Klughammer and Schreiber 2008). A low Y(NPQ) at high light levels is an indication of sub-optimal photoprotective mechanisms. (Klughammer and Schreiber 2008). Y(NO) (lake model quenching parameter) It represents all other components of non-photochemical quenching that are not photo-protective. They include non-radiative decay, and fluorescence. Part of Y(NO) includes photoinhibition (David M. Kramer, Giles Johnson, Olavi Kiirats & Gerald E. Edwards 2004). Klughammer and Schrieber define Y(NO) as the fraction of energy that is passively dissipated in the form of heat and fluorescence mainly due to closed PSII reaction centers. Hendrickson calls Y(NO) constitutive heat dissipation. A high Y(NO) value after dark adaptation is an indication of photodamage. (Klughammer and Schreiber 2008). Y(II) = (lake model) quantum yield of photosynthetic energy. The equation is the same as for Y, or )F/Fm. (F M Fs) / F M or (F M F ) / F M NPQ (puddle model and Henrickson lake model parameter resurrected to Hendrickson s lake model by Klughammer.) is non-photochemical quenching and is a measure of heat dissipation. NPQ is an alternate expression of non-photochemical quenching. It provides an estimate of quenching without knowledge of F O. The advantage of NPQ depends on the specific application. NPQ is more heavily affected by non-photochemical quenching that reflects heat-dissipation of excitation energy in the antenna system. So, it may be thought of as an indicator of 'excess excitation energy'. Alternatively, NPQ is relatively insensitive to the part of nonphotochemical quenching associated with low values. The range of NPQ is affected by )ph of the thylakoid lumen, and the xanthophyll cycle which are an important aspect of photosynthetic regulation. State transitions and photoinhibition also affect NPQ. Numbers range from zero to infinity with typical samples measuring in the 0.5 to 3.5 range (Maxwell and Johnson 2000). (Bilger & Björkman, 1990), (Muller P., Xiao-Ping L., Niyogi K. 2001). NPQ is by far, the most used quenching parameter. As a result, there are a large number of published papers that can be referenced for most applications. Light Curves Light Curves. These are protocols that step through different light levels to find the Y(II), retr, and other values at different PAR levels. Measurement is only made after the plant has reached steady state photosynthesis. They can start low and move higher or start high and go lower. It takes between 15 minutes to 20 minutes at a given light level to reach steady state photosynthesis (Maxwell and Johnson 2000). Plants grown in low light conditions are structurally different than plants grown under high light condition. Plants grown under low light conditions will saturate at much lower PAR (photosynthetically active radiation) intensities.
. Rapid light curves are an attempt to provide measuring solutions for plant samples that are under variable light conditions (Ralph 2005).")

21 This is a light curve graph from the OS5p Rapid light curves Almost all other light adapted chlorophyll fluorescence measuring parameters require steady state photosynthesis, by definition, to provide reliable results except Y(NO). Rapid light curves are an attempt to provide measuring solutions for plant samples that are under variable light conditions (Ralph 2005). Plants that are under other plant canopies, and aquatic plants are subject to changing light conditions. With this type of test, plants are subjected to stepped PAR light conditions much like light curves, but for very short period of time. It is common to use ten second steps, but times up to minutes have been used. It is also common to use momentary dark adaptation before starting the RLC, but longer times have been used. (Ralph 2005), ( Rascher U. 2000). OS1p Rapid Light Curves. Eilers and Peeters curve fitting software algorithms are resident on the instrument for curve display. Results vary with the time of day. Research shows that RLCs correlate well with rubisco activity under changing light conditions. (MacIntyre H. L 1996, 1997) The parameters provided are, retr MAX - relative maximum electron transport rate, V is the initial slope of the line at low PAR values, I K is the point of minimum saturation level = retr MAX / V, and I M is the retr MAX PAR level. It is common to use curve fitting software to graph the protocol and determine the values. (Application note on RLC)
22 Ratio fluorescence and ratio fluorometers Ratio fluorescence has been explored to further understand plant physiology, and extend the uses of chlorophyll fluorescence into areas that have proved difficult to measure in the past. Nitrogen stress has been a particularly difficult stress to measure, at usable levels, using chlorophyll fluorescence. However, ratio chlorophyll fluorescence has shown great success in this area. Most solutions have been relatively expensive in the past, but now, the CCM-300 ratio fluorometer, using the Gitelson protocol, offers a cost effective solution to nitrogen stress, and chlorophyll content. According to Neil Baker, chlorophyll fluorescence is not normally capable of measuring nitrogen plant stress until it is severe, and sulfur plant stress until starvation levels have been reached. (Baker 2004) Several research groups have worked on various fluorescent ratios in an attempt to measure chlorophyll content, that can be used for nitrogen and sulfur stress, measure general plant stress, or other specific types of plant functions. Researchers that include Gitelson, Lichtenthaler, Buschmann, Sampson and Cerovic have spent a great deal of time working in this area. Using fluorescence emission ratios of multiple fluorescence excitation wavelengths, and ratios of different fluorescence emission wavelengths using the same excitation wavelength have been used, with various results. Some of the ratios have been successful. In 2000, Samson used two excitation wavelengths and one emission wavelength to measure nitrogen stress at effective levels. The ratio was called FEX365/FEX440. Nitrogen Stress in plants was determined by the ratio of UV excited and blue excited far red fluorescence. Unlike leaf absorption techniques used for nitrogen testing, nitrogen stress can be distinguished from sulfur stress with this measurement (Sampson 2000). FRFex360/FRFex440 measures the concentration of UV absorbing compounds in the leaf epidermis which are higher in nitrogen stressed plants. In 1999, Gitelson, Lichtenthaler, and Buschmann developed a refined technique from earlier fluorescent ratios that allowed a maximum reliable chlorophyll content measuring range. By limiting the emission spectrum of red fluorescence, the reliable measuring range of chlorophyll content was more than doubled compared to leaf absorption techniques that have been commonly used for nutrient plant stress measurement and nitrogen management. The Gitelson emission fluorescence ratio was F735/F700. It offered several advantages. It could be used on very small leaves, conifers, grasses, fruit, stems, petioles, moss on rocks or recently germinated Arabidopsis leaves. It also allowed reliable direct readout of chlorophyll content in mg/m -2. Gittleson, Cerovic and Buschmann have worked with various ratios in an attempt to determine everything from plant stress to anthocyanin content.

23 These are graphs to show how the CCM-300 chlorophyll content meter works, using the Gitelson protocol for ratio chlorophyll fluorescence. The sample is exited using blue light, and the ratio of emission fluorescence is measured, along with direct readout in chlorophyll content using the formula from Gitelson This is the CCM-300, ratio fluorescence, chlorophyll content meter measuring a white pine needle
State Transitions Affect Fv/Fm & Yield Measurements
 State Transitions Affect Fv/Fm & Yield Measurements The photosynthetic state transitions are a process of changing the balance of energy flows into the photosystem I and photosystem II reaction centers
Plant Leaf Dark Adaptation - How long is long enough?
 Plant Leaf Dark Adaptation - How long is long enough? Dark adaptation is a technique used in some chlorophyll fluorescence measurements to fix a reference point under known, stable and repeatable conditions.
Photo-Phosphorylation. Photosynthesis 11/29/10. Lehninger 5 th ed. Chapter 19
 1 Photo-Phosphorylation Lehninger 5 th ed. Chapter 19 2 Photosynthesis The source of food, and therefore life on earth. It uses water to produce O 2. However E 0 of water is 0.816V (NADH s is -0.32V).
Photosynthesis 05/03/2012 INTRODUCTION: Summary Reaction for Photosynthesis: CO 2 : H 2 O: chlorophyll:
 Photosynthesis INTRODUCTION: metabolic process occurring in green plants, algae, some protists and cyanobacteria Photosynthesis is an PROCESS (building organic molecules which store radiant energy as chemical
WJEC UNIT 3. ATP & Photosynthesis. Tyrone. R.L. John
 WJEC UNIT 3 ATP & Photosynthesis 1 Adenosine Triphosphate (ATP) Revision from unit 1 1. ATP is a nucleotide. Label the components of the ATP molecule below: In the space below draw a simplified diagram
PHOTOSYNTHESIS. The Details
 PHOTOSYNTHESIS The Details Photosynthesis is divided into 2 sequential processes: 1. The Light Dependent Reactions (stages 1 & 2) 2. The Light Independent Reactions (stage 3) a.k.a. the Calvin Cycle THE
Harvest Network Courses. Innovation Strategies & Systems Biology of Photosynthesis by Photon Systems Instruments April 1-6, 2010, Brno, Czech Republic
 Harvest Network Courses Innovation Strategies & Systems Biology of Photosynthesis by Photon Systems Instruments April 1-6, 2010, Brno, Czech Republic Modeling of the Fast Chlorophyll a Fluorescence Rise
Life Sciences For NET & SLET Exams Of UGC-CSIR. Section B and C. Volume-10. Contents A. PHOTOSYNTHESIS 1 B. RESPIRATION AND PHOTORESPIRATION 33
 Section B and C Volume-10 Contents 6. SYSTEM PHYSIOLOGY-PLANTS A. PHOTOSYNTHESIS 1 B. RESPIRATION AND PHOTORESPIRATION 33 C. NITROGEN METABOLISM 51 D. PLANT HORMONES 73 0 6. SYSTEM PHYSIOLOGY-PLANTS A.
LIGHT DEPENDENT & INDEPENDENT REACTIONS
 LIGHT DEPENDENT & INDEPENDENT REACTIONS Photosynthesis is a two stage process Light dependent reactions o requires DIRECT light energy omakes energy carrier molecules that are used in the dark reaction
Name AP Biology Photosynthesis Notes Mrs. Laux Photosynthesis: Capturing Energy I. Chloroplasts A. Facts: 1. double membrane 2.
 Photosynthesis: Capturing Energy I. Chloroplasts A. Facts: 1. double membrane 2. not part of endomembrane system 3. semi-autonomous organelles, grow and reproduce 4. found in plants, algae, cyanobacteria,
A. Structures of PS. Site of PS in plants: mostly in leaves in chloroplasts. Leaf cross section. Vein. Mesophyll CO 2 O 2. Stomata
 PS Lecture Outline I. Introduction A. Structures B. Net Reaction II. Overview of PS A. Rxns in the chloroplast B. pigments III. Closer looks A. LD Rxns B. LI Rxns 1. non-cyclic e- flow 2. cyclic e- flow
Lecture-17. Electron Transfer in Proteins I
 Lecture-17 Electron Transfer in Proteins I The sun is main source of energy on the earth. The sun is consumed by the plant and cyanobacteria via photosynthesis process. In this process CO2 is fixed to
The summary equation of photosynthesis including the source and fate of the reactants and products. How leaf and chloroplast anatomy relates to
 1 The summary equation of photosynthesis including the source and fate of the reactants and products. How leaf and chloroplast anatomy relates to photosynthesis. How photosystems convert solar energy to
Heterotrophs: Organisms that depend on an external source of organic compounds
 Heterotrophs: Organisms that depend on an external source of organic compounds Autotrophs: Organisms capable of surviving on CO2 as their principle carbon source. 2 types: chemoautotrophs and photoautotrophs
4.1. Photosynthesis Light-Dependent Reactions
 4.1 Photosynthesis Light-Dependent Reactions Photosynthesis Each year, Canada s boreal forest convert 12.5 million tonnes of carbon into energy-rich compounds for billions of organisms Photosynthesis
Photosynthesis. Chapter 10. Biology Eighth Edition Neil Campbell and Jane Reece. PowerPoint Lecture Presentations for
 Chapter 10 Photosynthesis PowerPoint Lecture Presentations for Biology Eighth Edition Neil Campbell and Jane Reece Lectures by Chris Romero, updated by Erin Barley with contributions from Joan Sharp Overview:
Photosynthesis Overview
 Photosynthesis 1 2 Photosynthesis Overview Energy for all life on Earth ultimately comes from photosynthesis 6CO 2 + 12H 2 O C 6 H 12 O 6 + 6H 2 O + 6O 2 Oxygenic photosynthesis is carried out by Cyanobacteria
Photosynthesis 1. Light Reactions and Photosynthetic Phosphorylation. Lecture 31. Key Concepts. Overview of photosynthesis and carbon fixation
 Photosynthesis 1 Light Reactions and Photosynthetic Phosphorylation Lecture 31 Key Concepts Overview of photosynthesis and carbon fixation Chlorophyll molecules convert light energy to redox energy The
Lecture 9: Photosynthesis
 Lecture 9: Photosynthesis I. Characteristics of Light A. Light is composed of particles that travel as waves 1. Comprises a small part of the electromagnetic spectrum B. Radiation varies in wavelength
The light reactions convert solar energy to the chemical energy of ATP and NADPH
 10.2 - The light reactions convert solar energy to the chemical energy of ATP and NADPH Chloroplasts are solar-powered chemical factories The conversion of light energy into chemical energy occurs in the
Chapter 10 Photosynthesis
 Chapter 10 Photosynthesis Autotrophs and Heterotrophs Autotrophs are organisms that make their own food. They obtain everything they need by using CO 2 and inorganic compounds from the environment. Heterotrophs
5/08/ :49 PM 28/02/13. Lecture 2: Photosynthesis:
 5/08/2014 10:49 PM 28/02/13 Lecture 2: Photosynthesis: Two types of chlorophyll in plants (green pigments in the thylakoids that are responsible for the absorption of Photosynthetically active radiation
Photosynthesis is the main route by which that energy enters the biosphere of the Earth.
 Chapter 5-Photosynthesis Photosynthesis is the main route by which that energy enters the biosphere of the Earth. To sustain and power life on Earth, the captured energy has to be released and used in
Just Like the Guy From Krypton Photosynthesis
 Just Like the Guy From Krypton Photosynthesis An Overview of Photosynthesis Most of the energy used by almost all living cells ultimately comes from the sun plants, algae, and some bacteria capture the
PHOTOSYNTHESIS. Light Reaction Calvin Cycle
 PHOTOSYNTHESIS Light Reaction Calvin Cycle Photosynthesis Purpose: use energy from light to convert inorganic compounds into organic fuels that have stored potential energy in their carbon bonds Carbon
Sunday, August 25, 2013 PHOTOSYNTHESIS
 PHOTOSYNTHESIS PREFACE The sun is the ultimate source of energy. The sun powers nearly all life forms. Photosynthesis converts solar energy into chemical energy. Photoautotrophs use solar energy to synthesize
A procedure for maize genotypes discrimination to drought by chlorophyll fluorescence imaging rapid light curves
 DOI 10.1186/s13007-017-0209-z Plant Methods METHODOLOGY ARTICLE Open Access A procedure for maize genotypes discrimination to drought by chlorophyll fluorescence imaging rapid light curves Carlos Antônio
AP Biology. Chloroplasts: sites of photosynthesis in plants
 The summary equation of photosynthesis including the source and fate of the reactants and products. How leaf and chloroplast anatomy relates to photosynthesis. How photosystems convert solar energy to
Chapter 6. Capturing Solar Energy: Photosynthesis. Lectures by Gregory Ahearn. University of North Florida. Copyright 2009 Pearson Education, Inc.
 Chapter 6 Capturing Solar Energy: Photosynthesis Lectures by Gregory Ahearn University of North Florida Copyright 2009 Pearson Education, Inc. 6.1 What Is Photosynthesis? Life on earth depends on photosynthesis.
Algal Physiology. I. Photosynthesis in algae II. Characteristics to distinguish algal divisions. I. Photosynthesis
 Algal Physiology I. Photosynthesis in algae II. Characteristics to distinguish algal divisions 1 I. Photosynthesis 2 1 PSU : Photosynthetic Unit = Antennae + rxn center Light reactions: solar energy is
pigments AP BIOLOGY PHOTOSYNTHESIS Chapter 10 Light Reactions Visible light is part of electromagnetic spectrum
 AP BIOLOGY PHOTOSYNTHESIS Chapter 10 Light Reactions http://vilenski.org/science/safari/cellstructure/chloroplasts.html Sunlight is made up of many different wavelengths of light Your eyes see different
I. Photosynthesis. Algal Physiology. I. Photosynthesis in algae II. Characteristics to distinguish algal divisions
 Algal Physiology I. Photosynthesis I. Photosynthesis in algae II. Characteristics to distinguish algal divisions 1 2 PSU : Photosynthetic Unit = Antennae + rxn center Light reactions: solar energy is harvested
Determining the limitations and regulation of photosynthetic energy transduction in leaves
 Plant, Cell and Environment (2007) 30, 1107 1125 doi: 10.1111/j.1365-3040.2007.01680.x Determining the limitations and regulation of photosynthetic energy transduction in leaves NEIL R. BAKER 1, JEREMY
CHAPTER 8 PHOTOSYNTHESIS
 CHAPTER 8 PHOTOSYNTHESIS Con. 8.1 Photosynthesis process by which plants use light to make food molecules from carbon dioxide and water (chlorophyll) 6CO 2 + 12H 2 O + Light C 6 H 12 O 6 + 6O 2 + 6H 2
Overall, photosynthesis is the conversion of the Sun s energy to stored chemical energy. (glucose) The overall reaction for photosynthesis:
 The overall reaction for photosynthesis:") A.P. Biology Chapter 10- Photosynthesis Scale: 0 - No understanding of the concept and chemical process of photosynthesis. 1- With help, a partial understanding of the reactants and products of the photosynthesis
A.P. Biology Chapter 10- Photosynthesis Scale: 0 - No understanding of the concept and chemical process of photosynthesis. 1- With help, a partial understanding of the reactants and products of the photosynthesis
The conversion of usable sunlight energy into chemical energy is associated with the action of the green pigment chlorophyll.
 Photosynthesis Photosynthesis is the process by which plants, some bacteria and some protistans use the energy from sunlight to produce glucose from carbon dioxide and water. This glucose can be converted
Photosynthesis Lecture 7 Fall Photosynthesis. Photosynthesis. The Chloroplast. Photosynthetic prokaryotes. The Chloroplast
 Photosynthesis Lecture 7 Fall 2008 Photosynthesis Photosynthesis The process by which light energy from the sun is converted into chemical energy 1 Photosynthesis Inputs CO 2 Gas exchange occurs through
Energy Conversions. Photosynthesis. Plants. Chloroplasts. Plant Pigments 10/13/2014. Chapter 10 Pg
 Energy Conversions Photosynthesis Chapter 10 Pg. 184 205 Life on Earth is solar-powered by autotrophs Autotrophs make their own food and have no need to consume other organisms. They are the ultimate source
Chapter 10 Photosynthesis
 Chapter 10 Photosynthesis Photosynthesis Process by which plants use light energy to make food. A reduction process that makes complex organic molecules from simple molecules. Ps General Equation 6 CO
Lecture Series 13 Photosynthesis: Energy from the Sun
 Lecture Series 13 Photosynthesis: Energy from the Sun Photosynthesis: Energy from the Sun A. Identifying Photosynthetic Reactants and Products B. The Two Pathways of Photosynthesis: An Overview C. Properties
Question Answer Mark Guidance 1 (a) (i) 2 max
 (i) 2 max") Question Answer Mark Guidance 1 (a) (i) Mark the first answer on each prompt line. If the answer is correct and an additional answer is given that is incorrect or contradicts the A inner membrane (of,
Question Answer Mark Guidance 1 (a) (i) Mark the first answer on each prompt line. If the answer is correct and an additional answer is given that is incorrect or contradicts the A inner membrane (of,
CHAPTER 13 : PHOTOSYNTHESIS IN HIGHER PLANTS K C MEENA PGT BIOLOGY KV VIKASPURI II SHIFT
 CHAPTER 13 : PHOTOSYNTHESIS IN HIGHER PLANTS K C MEENA PGT BIOLOGY KV VIKASPURI II SHIFT Photosynthesis is a Physic o chemical process, uses light energy to synthesis organic compounds (sugar). Importance
(A) Calvin cycle (B) Cyclic electron transfer (C) Non-cyclic electron transfer (D) Photorespiration (E) Cellular respiration
 Calvin cycle (B) Cyclic electron transfer (C) Non-cyclic electron transfer (D) Photorespiration (E) Cellular respiration") AP Biology - Problem Drill 08: Photosynthesis No. 1 of 10 #01 1. What term does the statement below refer to? In a photosynthesis process, an electron is excited from P700 and delivered to its receptor,
AP Biology - Problem Drill 08: Photosynthesis No. 1 of 10 #01 1. What term does the statement below refer to? In a photosynthesis process, an electron is excited from P700 and delivered to its receptor,
Detection of Chlorophyll fluorescence at crop canopies level: Remote Sensing of Photosynthesis
 Detection of Chlorophyll fluorescence at crop canopies level: Remote Sensing of Photosynthesis Part I : Background, central and alternative photosynthetic electron transport pathways and active fluorescence
Chapter 13 Photosynthesis in Higher Plants
 Question 1: By looking at a plant externally can you tell whether a plant is C 3 or C 4? Why and how? One cannot distinguish whether a plant is C 3 or C 4 by observing its leaves and other morphological
Photosynthesis in Detail. 3/19/2014 Averett
 Photosynthesis in Detail 1 In photosynthesis many chemical reactions, enzymes and ions work together in a precise order. Enzymes Biological catalyst Substance that initiates or speeds up the rate of a
Photosynthesis. I. Photosynthesis overview A. Purpose B. Location. The light vs. the dark reaction Chloroplasts pigments A. Light absorption B.
 Photosynthesis I. Photosynthesis overview A. Purpose B. Location II. III. The light vs. the dark reaction Chloroplasts pigments A. Light absorption B. Types IV. Light reactions A. Photosystems B. Photophosphorylation
Photosynthesis. light
 Photosynthesis light 6CO + 6H 0 C 6 H 1 O 6 + 6O light Carbon dioxide + water sugar + oxygen Chlorophyll pigment that absorbs light energy Absorbs red and blue light Reflects green and yellow light Chlorophyll
Chapter 10. Photosynthesis
 Chapter 10 Photosynthesis Overview: The Process That Feeds the Biosphere Photosynthesis is the process that converts solar energy into chemical energy Directly or indirectly, photosynthesis nourishes almost
Photosynthesis: Life from Light AP Biology
 Photosynthesis: Life from Light Supporting a biosphere On global scale, photosynthesis is the most important process for the continuation of life on Earth u each year photosynthesis synthesizes 160 billion
Variable Fluorescence 4/13/10. Fluorescence HEAT
 Fluorescence HEAT Variable Fluorescence 1 F Start with a pulse of weak light--this will cause weak (background) fluorescence and is called the probe flash 0 Time 1 Variable Fluorescence 1 F 0 Time Turn
Life on Earth is solar powered. Photosynthesis => conversion of light energy to chemical energy (stored in sugars and other organic molecules).
.") Photosynthesis Life on Earth is solar powered. Photosynthesis => conversion of light energy to chemical energy (stored in sugars and other organic molecules). Organisms obtain organic compounds by one
Photosynthesis Life on Earth is solar powered. Photosynthesis => conversion of light energy to chemical energy (stored in sugars and other organic molecules). Organisms obtain organic compounds by one
Light and Photosynthesis. Supplemental notes Lab 4 Horticultural Therapy
 Light and Photosynthesis Supplemental notes Lab 4 Horticultural Therapy Light The Electromagnetic Spectrum is a continuum of all electromagnetic waves arranged according to frequency and wavelength, the
Photosynthesis. Dr. Bertolotti
 Photosynthesis Dr. Bertolotti Photosynthesis: Life from Light and Air How do plants and other organisms capture energy from the sun? What is ATP and why is it useful in cells? Plants are energy producers
Photosynthesis. From Sunlight to Sugar
 Photosynthesis From Sunlight to Sugar What is Photosynthesis? Photosynthesis is a process that captures energy from sunlight to make sugars used as food for producers. The light energy is stored as chemical
Photosynthesis 6CO 2 + 6H 2 O C 6 H 12 O 6 + 6O 2
 PHOTOSYNTHESIS Photosynthesis An anabolic, endergonic, carbon dioxide (CO 2 ) requiring process that uses light energy (photons) and water (H 2 O) to produce organic macromolecules (glucose). photons SUN
Photosynthesis (Outline)
") Photosynthesis (Outline) 1. Overview of photosynthesis 2. Producers, consumers, and decomposers of the ecosystem (source of carbon and energy) 3. Plant structures: organ, tissue, cells, sub-cellular organelle,
Photosynthesis (Outline) 1. Overview of photosynthesis 2. Producers, consumers, and decomposers of the ecosystem (source of carbon and energy) 3. Plant structures: organ, tissue, cells, sub-cellular organelle,
LECTURE PRESENTATIONS
 LECTURE PRESENTATIONS For CAMPBELL BIOLOGY, NINTH EDITION Jane B. Reece, Lisa A. Urry, Michael L. Cain, Steven A. Wasserman, Peter V. Minorsky, Robert B. Jackson Chapter 10 Photosynthesis Lectures by Erin
Photosynthesis and Life
 7-1 Chapter 7 Photosynthesis and Life During photosynthesis Organisms use the energy of light to build highenergy organic molecules. Plants, algae, and some bacteria can do this. Can make their own food
Bio 111 Study Guide Chapter 10 Photosynthesis
 Bio 111 Study Guide Chapter 10 Photosynthesis BEFORE CLASS: Reading: Read the whole chapter from p. 185-207. You can skip the topic of cyclic electron flow on p. 196-197. Figure 10.18 puts all of the light
AP Biology
 Chapter 10. Photosynthesis: Life from Light Energy needs of life All life needs a constant input of energy Heterotrophs get their energy from eating others consumers of other organisms consume organic
AP Biology
 Chapter 10. Photosynthesis: Life from Light Energy needs of life All life needs a constant input of energy Heterotrophs get their energy from eating others consumers of other organisms consume organic
Photosynthesis Harness light energy and use it to move electrons through an electron transport chain. Electron carriers are arranged, in order of
 Photosynthesis Harness light energy and use it to move electrons through an electron transport chain. Electron carriers are arranged, in order of increasing electro positivity within a membrane. Through
CLASS 11 th. Photosynthesis
 CLASS 11 th 01. Introduction Autotrophic organisms have the ability to synthesise organic food from inorganic raw materials. In this process, they consume physical and chemical forms of energy. One such
Chapter 7. Introduction. Introduction. Photosynthesis: Using Light to Make Food. Plants, algae, and certain prokaryotes
 Chapter 7 hotosynthesis: Using to Make Food oweroint Lectures for Campbell Biology: Concepts & Connections, Seventh Edition Reece, Taylor, Simon, and Dickey Lecture by Edward J. Zalisko Introduction lants,
Photosynthesis: Life from Light and Air
 http://www.youtube.com/watch?v=wi60tqa8jfe Photosynthesis: Life from Light and Air 2011-2012 Energy needs of life All life needs a constant input of energy consumers producers Heterotrophs (Animals) obtain
Chapter 7: Photosynthesis
 Chapter 7: Photosynthesis Electromagnetic Spectrum Shortest wavelength Longest wavelength Gamma rays X-rays UV radiation Visible light Infrared radiation Microwaves Radio waves Photons Packets of light
CH 8: Photosynthesis Overview Photosynthesis is the process that converts solar energy into chemical energy
 CH 8: Photosynthesis Overview Photosynthesis is the process that converts solar energy into chemical energy Directly or indirectly, photosynthesis nourishes almost the entire living world Autotrophs sustain
Photosynthesis and Cellular Respiration: Photosynthesis
 Photosynthesis and Cellular Respiration: Photosynthesis Unit Objective I can compare the processes of photosynthesis and cellular respiration in terms of energy flow, reactants, and products. During this
Photosynthesis: Using Light to Make Food
 Chapter 7 Photosynthesis: Using Light to Make Food Lectures by Chris C. Romero, updated by Edward J. Zalisko PowerPoint Lectures for Campbell Essential Biology, Fourth Edition Eric Simon, Jane Reece, and
Study questions Test 3. Plant Structure Cntd. Photosynthesis
 Study questions Test 3 Plant Structure Cntd. 1. Describe the internal structure of typical leaf and functions of each tissue in it. 2. How are guard cells different from other leaf epidermal cells? 3.
Photosynthesis. The Sun powers life. capture about 5% of the Sun s energy and, through the process of, provide energy to.
 Photosynthesis The Sun powers life. capture about 5% of the Sun s energy and, through the process of, provide energy to. Photosynthesis is carried out by : 1. 2. 3. 4. These organisms all contain the pigment.
PHOTOSYNTHESIS. Botany Department B.N.D. College
 PHOTOSYNTHESIS Botany Department B.N.D. College Photosynthesis An anabolic, endergonic, carbon dioxide (CO 2 ) requiring process that uses light energy (photons) and water (H 2 O) to produce organic macromolecules
2015 AP Biology PRETEST Unit 3: Cellular Energetics Week of October
 Name: Class: _ Date: _ 2015 AP Biology PRETEST Unit 3: Cellular Energetics Week of 19-23 October Multiple Choice Identify the choice that best completes the statement or answers the question. 1) Which
Photosynthesis in Higher Plants
 Photosynthesis in Higher Plants PHOTOSYNTHIS It is the synthesis of organic food molecules l like glucose (C 6 H 12 O 6 ) by utilizing inorganic compounds like CO 2 and H 2 O in the presence of sun light
The Two Phases of Photosynthesis
 : light reactions & carbon fixation Global Importance of by green plants and algae provides nearly all of the energy and organic carbon required by living organisms. provides all of the oxygen required
Ch. 10- Photosynthesis: Life from Light and Air
 Ch. 10- Photosynthesis: Life from Light and Air 2007-2008 Ch. 10 Photosynthesis: Life from Light and Air 2007-2008 Energy needs of life All life needs a constant input of energy consumers Heterotrophs
Chapter 10 Photosynthesis
 Chapter 10 Photosynthesis Overview: The Process That Feeds the Biosphere Photosynthesis is the process that converts solar energy into chemical energy Photosynthesis occurs in plants, algae, certain other
Topic 9. Exercises on Photosynthesis. I. Where Photosynthesis Occurs in Plant Cells
 Topic 9. Exercises on Photosynthesis The pathways of photosynthesis and respiration are quite different. However, at the global level, one is perfectly complementary to the other as the end products of
Photosynthesis Part I: Overview & The Light-Dependent Reac<ons
 Photosynthesis Part I: Overview & The Light-Dependent Reac
CO 7. Cell Process Photosynthesis
 CO 7 Cell Process Photosynthesis Cell Process - Photosynthesis Photosynthesis is used to build carbohydrates (the main energy source of all life.) - - Producers (like plants) use carbon dioxide and water
AN OVERVIEW OF PHOTOSYNTHESIS. Copyright 2009 Pearson Education, Inc.
 AN OVERVIEW OF PHOTOSYNTHESIS Copyright 2009 Pearson Education, Inc. Introduction: Plant Power Plants use water and atmospheric carbon dioxide to produce a simple sugar and liberate oxygen Earth s plants
9- #60 5. Photosynthesis. Sixth edition. D. O. Hall. and. K. K. Rao. Published in association with the Institute of Biology CAMBRIDGE UNIVERSITY PRESS
 9- #60 5 Photosynthesis Sixth edition D. O. Hall and K. K. Rao Published in association with the Institute of Biology CAMBRIDGE UNIVERSITY PRESS Contents General preface to the series Preface to the sixth
BIOLOGY. Photosynthesis CAMPBELL. Concept 10.1: Photosynthesis converts light energy to the chemical energy of food. Anabolic pathways endergonic
 10 Photosynthesis CAMPBELL BIOLOGY TENTH EDITION Reece Urry Cain Wasserman Minorsky Jackson Lecture Presentation by Nicole Tunbridge and Kathleen Fitzpatrick energy ECOSYSTEM CO 2 H 2 O Organic O 2 powers
Introduction. 1 Photosynthesis. Chapter 1
 Introduction 1 Photosynthesis Oxygenic photosynthesis is one of the most fundamental processes on our planet. It is employed by cyanobacteria, algae and plants to power themselves for growing and proliferating.
CBSE Quick Revision Notes (Class-11 Biology) CHAPTER-13 PHOTOSYNTHESIS IN HIGHER PLANTS
 CHAPTER-13 PHOTOSYNTHESIS IN HIGHER PLANTS") CBSE Quick Revision Notes (Class-11 Biology) CHAPTER-13 PHOTOSYNTHESIS IN HIGHER PLANTS Photosynthesis is an enzyme regulated anabolic process of manufacture of organic compounds inside the chlorophyll
CBSE Quick Revision Notes (Class-11 Biology) CHAPTER-13 PHOTOSYNTHESIS IN HIGHER PLANTS Photosynthesis is an enzyme regulated anabolic process of manufacture of organic compounds inside the chlorophyll
Light reaction. Dark reaction
 Photosynthesis Light reaction Dark reaction Electro-magnetic irradiance and sunlight CO 2 and O 2 fixation by Rubisco Oxygenic photosynthesis was established in Cyanobacteria Localisation of the
PHOTOSYNTHESIS Chapter 6
 PHOTOSYNTHESIS Chapter 6 5.1 Matter and Energy Pathways in Living Systems Chapter 5 Photosynthesis & Cellular Respiration 1 2 5.1 Matter and Energy Pathways in Living Systems In this section you will:
Bio 111 Study Guide Chapter 8 Photosynthesis
 Bio 111 Study Guide Chapter 8 Photosynthesis BEFORE CLASS: Reading: Read the whole chapter from pp. 161-179. Figure 8.16 puts all of the light reactions together for you. Study it and understand it well!
Transduction of Light Energy in Chloroplasts
 Module 0210101: Molecular Biology and Biochemistry of the Cell Lecture 16 Transduction of Light Energy in Chloroplasts Dale Sanders 9 March 2009 Objectives By the end of the lecture you should understand
Photosynthesis (Outline)
") Photosynthesis (Outline) 1. Overview of photosynthesis 2. Producers, consumers, and decomposers of the ecosystem (source of carbon and energy) (Autotrophs: photo-autotrophs, chemo-autotrophs, electro-autotrophs,
Photosynthesis (Outline) 1. Overview of photosynthesis 2. Producers, consumers, and decomposers of the ecosystem (source of carbon and energy) (Autotrophs: photo-autotrophs, chemo-autotrophs, electro-autotrophs,
Photosynthesis. Chapter 8
 Photosynthesis Chapter 8 Photosynthesis Overview Energy for all life on Earth ultimately comes from photosynthesis 6CO 2 + 12H 2 O C 6 H 12 O 6 + 6H 2 O + 6O 2 Oxygenic photosynthesis is carried out by
Unit 1 Matter & Energy for Life. Biology Photosynthesis
 Unit 1 Matter & Energy for Life Biology 2201 3.2 The Process of Photosynthesis Photosynthesis The process by which an organism captures the energy of the sun to convert CO 2 and water into glucose. Light
PHOTOSYNTHESIS. https://www.youtube.com/watch?v=pme blshpbsu
 PHOTOSYNTHESIS https://www.youtube.com/watch?v=pme blshpbsu Energy needs of life All life needs a constant input of energy Heterotrophs (Animals) get their energy from eating others eat food = other organisms
Phytoplankton Photosynthesis
 Phytoplankton Photosynthesis RedOx Reactions Some more history Quantum Yields Photosynthetic Units Physical Structure The Z-Scheme The Calvin-Benson Cycle Measuring Photosynthesis Phytoplankton Zooplankton
Photosynthesis. Chapter 10. Biology Eighth Edition Neil Campbell and Jane Reece. PowerPoint Lecture Presentations for
 Chapter 10 Photosynthesis PowerPoint Lecture Presentations for Biology Eighth Edition Neil Campbell and Jane Reece Lectures by Chris Romero, updated by Erin Barley with contributions from Joan Sharp Copyright
Photosynthesis Life Is Solar Powered!
 Photosynthesis Life Is Solar Powered! What Would Plants Look Like On Alien Planets? 1 Why Would They Look Different? Different Stars Give off Different types of light or Electromagnetic Waves The color
Photosynthesis: Using Light to Make Food
 Chapter 7 Photosynthesis: Using Light to Make Food Lectures by Chris C. Romero, updated by Edward J. Zalisko 2010 Pearson Education, Inc. PowerPoint Lectures for Campbell Essential Biology, Fourth Edition
PHOTOSYNTHESIS Autotrophs Heterotrophs ENERGY
 Did You Know? How Plants Make Food That most of the Oxygen in the air is thought to be from PHOTOSYNTHESIS Nutrition Autotrophs (make their own food) Ex) Green plants, protists, algae, phytoplankton Nutrition
Photosynthesis in Higher Plants
 Photosynthesis in Higher Plants Very Short Answers Questions: 1. Name the processes which take place in the grana and stroma regions of chloroplasts? A: Grana Light reactions. Trapping light energy, synthesizing