2016 Annual Report for South Texas Weather Modification Association
|
|
|
- Alison Flynn
- 5 years ago
- Views:
Transcription


1 2016 Annual Report for South Texas Weather Modification Association South Texas Weather Modification Association 110 Wyoming Blvd. Pleasanton, TX 78064
2 No part of this document may be edited or reproduced without written permission from the author or the South Texas Weather Modification Association.
3 South Texas Weather Modification Association 2016 Operations Summary The 2016 cloud seeding operational season is the 19 th consecutive season of weather modification operations in the south Texas region with rainfall enhancement as the only goal. The season began on April 25 in Frio and McMullen counties, and ended on November 7 in Atascosa, Bee, Frio, Karnes, and McMullen counties. There were 41 operation days (average is 39 operational days), 60 seeding flights, 7 recon flights with no seeding, and a total of hours of flight time. Both glaciogenic and hygroscopic flares were used, with a total of 2,026 glaciogenic used and 202 hygroscopic flares used this season. Most of the staff remained the same with one change. Mr. Craig Funke remained as the Project Manager while full time pilots Mr. Butch Card and Mr. Mark Opiela remained. New to this program was Mr. Kendell LaRoche who became the new Project Meteorologist. The 2016 season saw above average precipitation for almost the entire operational region. Most of the heavy precipitation took place in May, August, and September. The weather pattern across south Texas seemed to alternate back and forth between mostly sunny with no rain to cooler with many consecutive days of rain during the season. The global weather pattern for 2016 started off with a strong El Nino in January, which decreased to a neutral pattern by November Cloud seeding operations were suspended a few weeks between May through August due to the risk of flooding. The annual evaluation conducted by Dr. Arquímedes Ruiz-Columbié showed the total number of seeded clouds during the 2016 season at 120. The number of small clouds seeded was 81, while 27 large clouds were seeded, and 12 type B clouds were seeded. Large clouds are defined as having a precipitation mass greater than 10,000 kilotons, and type B clouds are clouds which were seeded when they were one hour old or older. Seeded small clouds provided an additional ~79,365 acre-feet of water, large clouds provided an additional ~426,328 acre-feet of water, and type B clouds proved an additional ~67,677 acre-feet of water, respectively. Spread across the entire operational region, cloud seeding activities brought an additional 573,370 acrefeet of water; along with an average 0.96 inches of additional precipitation, or an average 3.6 % increase over the seasonal value. Dual seeding (both glaciogenic and hygroscopic flares) on small clouds had a precipitation flux increase of 40% and a precipitation mass increase of 127%. Large clouds (dual-seeded) had a precipitation flux increase of 20% and a precipitation mass increase of 54%. Type B clouds, also dual-seeded, had precipitation flux increases of 7% and precipitation mass increases of 14%. Pure glaciogenic seeding in small clouds provided increases of 53% in precipitation flux and an increase of 109% for precipitation mass. Dual-seeding was conducted most of the time, except toward the end of the season when the supply of hygroscopic flares at the airport was depleted. For Kendell LaRoche, January through April was spent training for the job demands and reviewing past seeding events and scientific research. After successful cloud seeding missions in April and May, Kendell received his cloud seeding license in June. New computer systems were acquired in December 2015, and various problems and issues were resolved from January to September. In November, Kendell made a presentation to the University of Texas at San Antonio Civil Engineering department about the South Texas Weather Modification Association. This presentation included details about when the association does, different types of weather modification, how rain forms, how cloud seeding works, the value of water across the region, and included example cloud seeding events.
4 Kendell LaRoche Project Meteorologist, South Texas Weather Modification Association ANNUAL EVALUATION REPORT 2016 STWMA (Pleasanton) Dr. Arquímedes Ruiz-Columbié Active Influence & Scientific Management Cloud seeding operations for 2016 began over South Texas Weather Modification Association target area in April. This annual report serves as a summary of results. A total of 120 clouds were seeded and identified by TITAN in 44 operational days. Table 1 in page 1 summarizes the general figures: Table 1: Generalities First operational day: April 25 th, 2016 Last operational day: November 11 th, 2016 Number of operational days: 44 (One in April, four in May, seven in June, thirteen in July, nine in August, five in September, three in October, and two in November) According to the daily reports operational days were qualified as: Twenty-seven with excellent performance Twelve with very good performance Five with good performance Number of seeded clouds: 120 (81 small seeded clouds, 27 large seeded clouds, 12 type B seeded clouds) Missed Opportunities: none (with lifetime longer than 45 minutes)
5 Small Clouds Evaluations were done using TITAN and NEXRAD data. Table 2 shows the results from the classic TITAN evaluation for the 81 small seeded clouds which obtained proper control clouds. Table 2: Seeded Sample versus Control Sample (81 couples, averages) Variable Seeded Sample Control Sample Simple Ratio Increases (%) Lifetime 65 min 40 min (44) Area 65.6 km km (36) Volume km km (36) Top Height 7.6 km 7.3 km (3) Max dbz (1) Top Height of max dbz 3.5 km 3.5 km (0) Volume Above 6 km 33.4 km km (30) Prec. Flux m 3 /s m 3 /s (40) Prec. Mass kton kton (127) CloudMass kton kton (39) η (63) Bold values in parentheses are modeled values, whereas η is defined as the quotient of Precipitation Mass divided by Cloud Mass, and is interpreted as efficiency. A total of 667 silver iodide burn-in-place (AgI-BIP) flares and 62 Hygroscopic flares were used in this sub-sample with an excellent timing (93 %) for an average effective silver iodide dose about 90 ice-nuclei per liter. The seeding operation for small clouds lasted about 8 minutes on average. An excellent increase of 127 % in precipitation mass together with an increase of 63 % in cloud mass illustrates that the seeded clouds grew at expenses of the environmental moisture (they are open systems)
6 and used only a fraction of this moisture for their own maintenance. The increases in lifetime (44 %), in area (36 %), in volume (36 %), in volume above 6 km (30 %), and in precipitation flux (40 %) are notable. There were slight increases in top height (3 %) and in maximum reflectivity (1 %). The seeded sub-sample was 63 % more efficient than the control sub-sample. Results are evaluated as excellent for this subsample. An increase of 127 % in precipitation mass for a control value of kton in 81 cases means: Δ 1 = 81 x 1.27 x kton 97,860 kton 79,365 ac-f (layer: 18.4 mm 0.72 in)
7 Large Clouds The sub-sample of 27 large seeded clouds received a synergetic analysis. On average, the seeding operations on these large clouds affected 80 % of their whole volume with an excellent timing (99 % of the material went to the clouds in their first half-lifetime). A total of 927 AgI-BIP and 97 Hygroscopic flares were used in this sub-sample for an average effective silver iodide dose about 120 ice-nuclei per liter. Also on average, large clouds were 24 minutes old when the operations took place; the operation lasted about 30 minutes, and the large seeded clouds lived 230 minutes. Table 3 shows the corresponding results: Table 3: Large Seeded Sample versus Virtual Control Sample (27 couples, averages) Variable Seeded Sample Control Sample Simple Ratio Increases (%) Lifetime 230 min 195 min Area 1108 km km Volume 3804 km km Volume Above 6 km 1054 km km Prec. Flux m 3 /s m 3 /s Prec. Mass kton kton An increase of 54 % in precipitation mass for a control value of 36,055 kton in 27 cases may mean: Δ 2 = 27 x 0.54 x 36,055 kton 525,682 kton 426,328 ac-f (layer: 17.6 m 0.69 in)
8 Type B Clouds The sub-sample of 12 type B seeded clouds also received a synergetic analysis. On average, the seeding operations on these type B clouds affected 23 % of their whole volume with a satisfactory timing (81 % of the material went to the clouds in their first half-lifetime). A total of 291 AgI-BIP and 34 Hygroscopic flares were used in this sub-sample for an average effective silver iodide dose about 115 ice-nuclei per liter. Also on average, type B clouds were 110 minutes old when the operations took place; the operation lasted about 20 minutes, and the type B seeded clouds lived 280 minutes. Table 4 shows the results: Table 4: Type B Seeded Sample versus Virtual Control Sample (12 couples, averages) Variable Seeded Sample Control Sample Simple Ratio Increases (%) Lifetime 280 min 270 min Area 1095 km km Volume 7405 km km Volume Above 6 km 1059 km km Prec. Flux m 3 /s 9410 m 3 /s Prec. Mass kton kton An increase of 14 % in precipitation mass for a control value of 49,672 kton in 12 cases may mean: Δ 3 = 12 x 0.14 x 49,672 kton 83,449 kton 67,677 ac-f (layer: 6.35 mm 0.25 in) The total increase: = = 573,370 ac-f (~ 980 ac-f per small, 15,790 per large, 5640 per type B)
9 Micro-regionalization Increases in precipitation mass were analyzed county by county in an attempt to better describe the performance and corresponding results. Table 5 below offers the details: County Initial Extended Acre-feet Inches Rain Gage % Seeding Seeding (increase) (increase) (increase) (season value) (increase) Uvalde , in 4.2 Bandera , in (*) 4.6 Medina , in 2.5 Bexar , in 1.1 Frío , in 3.1 Atascosa , in (*) 4.7 McMullen , in 5.0 Wilson , in 2.7 Karnes , in 4.3 Bee , in (*) 4.0 Outside ,400 Total ,400 Average in 3.6 (Initial seeding means the counties were the operations began, whereas extended seeding means the counties favored by seeding after the initial operations took place). (*) Interpolated value of seasonal precipitation
10 Glaciogenic cases (small clouds) For the small cases, it was possible to make a comparison between pure glaciogenic seeding (22 cases, the majority of cases) and all the small cases (81 cases, table 2). Table 6 shows the results for the former: Table # 6 Seeded Sample versus Control Sample (22 couples, averages) Variable Seeded Sample Control Sample Simple Ratio Increases (%) Lifetime 60 min 40 min (36) Area 67.6 km km (33) Volume km km (35) Top Height 7.5 km 7.4 km (2) Max dbz (1) Top Height of max dbz 3.5 km 3.5 km (1) Volume Above 6 km 28.2 km km (27) Prec. Flux m 3 /s m 3 /s (53) Prec. Mass kton kton (109) Cloud smass kton kton (39) η (50) A total of 156 AgI-flares were used in this sub-sample with an excellent timing (95 %) for an effective AgI-average dose about 95 ice-nuclei per liter, although some over-seeded cases were detected. The increases indicate a dynamic response. The vertical reflectivity gradient index for this sample was dbz/km, indicating slightly maritime value (the neutral value is -4.0 dbz/km). The comparison of these results with those shown on table 2 points out to the existence of a synergy between glaciogenic and hygroscopic materials which favors the use of dual seeding when it is possible. The increase from this sample: Δ = 22 x 1.09 x kton 23,563 kton 19,109 ac-f (~ 869 ac-f per storm; layer: 15.8 mm 0.62 in)
11 Final Comments 1) Results are evaluated as excellent;. 2) The micro-regionalization analysis showed increases per county; different zones received downwind benefits; the average increase in precipitation, referred to rain gage seasonal value, is about 4 %; 3) Radar estimations of precipitation should be considered as measurements of trend. Nevertheless, seeding operations improved the dynamics of seeded clouds. 4) In 2016, the total increase in the region, estimated in about 0.55 million acre-feet, should be considered as a great help to fresh water natural resources. Hygroscopic seeding was properly used in the operations, as the following small table indicates: Type of storm AgI-flares used Hygroscopic flares used Small 667 (~ 8.2 per storm) 62 (~ 0.8 per storm) Large 927 (~ 34.3 per storm) 97 (~ 3.6 per storm) Type B 291 (~ 24.3 per storm) 34 (~ 2.8 per storm) Those data show that Large storms received a more dual treatment than the other two types. However, the comparison between tables 2 and 6 indicates that a the use of hygroscopic seeding implies a clear improvement of the cloud dynamics. Note: Some over-seeding situations were detected, especially on small storms during the last third of the season, when the volumes above 6 km were smaller than the corresponding spring values. The over-seeding did not hurt the clouds, but an estimate of about 60 AgI flares might have been saved. It is suggested to check the volume above 6 km of each target cloud in order to avoid over-seeding. Grammar corrections by Kendell LaRoche, Project Meteorologist, South Texas Weather Modification Association
12 South Texas Weather Modification 2016 Flight Summary April Date No. Call Takeoff Landing Dur. GL HY AgI Seeded Pilot Sign (UTC) 4/25/ AA 21:13 23: FR, MC Mark SubTotal Total May Date No. Call Takeoff Landing Dur. GL HY AgI Seeded Pilot Sign (UTC) 5/17/ AA 21:14 00: LS, MC Mark 5/17/ P 22:06 23: RECON Butch 5/21/ AA 22:15 23: BE Mark 5/27/ P 23:22 00: BE, KA Butch 5/28/ AA 22:58 00: RECON Mark 5/31/ AA 19:14 21: AT, MC Mark SubTotal Total June Date No. Call Sign Takeoff (UTC) Landing Dur. GL HY AgI Seeded Pilot 6/8/2016 AT, LS, 8 160P 20:16 22: MC Butch 6/19/ AA 20:34 22: FR, UV Mark 6/20/ P 19:00 20: KA, WI Butch 6/20/2016 AT, LS, 11 57AA 19:46 23: UV Mark 6/25/2016 AT, KA, P 18:20 23: ME, WI Butch 6/25/ AA 19:25 22: AT, ME Mark 6/26/2016 AT, FR, P 18:30 23: ME Butch 6/26/2016 AT, BA, 15 57AA 19:42 23: ME Mark 6/28/ P 23:10 00: KA, WI Butch 6/28/2016 BX, ME, 17 57AA 21:44 00: UV Mark 6/30/ P 21:45 23: BE, MC Butch SubTotal Total July Date No. Call Takeoff Landing Dur. GL HY AgI Seeded Pilot Sign (UTC) 7/18/ P 21:05 22: AT, KA Butch
13 7/19/ P 18:00 20: BE, GL, KA, LO Butch 7/19/ P 21:05 23: AT, BX, WI Butch 7/19/ P 23:20 00: AT Butch 7/25/ P 00:00 01: AT, KA, WI Butch 7/26/ AA 22:24 00: AT, MC Mark 7/26/ P 00:15 01: BE Butch 7/27/ AA 21:12 00: KA, MC Mark 7/28/ P 19:35 22: AT, BX, LO, KA, Butch MC, WI 7/28/ AA 21:52 00: AT, KA, LO, ME Mark 7/29/ P 20:20 23: AT, BE, GN, KA, Butch WI 7/29/ AA 21:40 23: AT, KA, WI Mark SubTotal Total August Date No. Call Takeoff Landing Dur. GL HY AgI Seeded Pilot Sign (UTC) 8/5/ AA 23:18 00: AT, WI Mark 8/13/ P 21:00 22: BE Butch 8/13/ P 22:50 00: UV Butch 8/14/ AA 18:33 20: RECON Mark 8/14/ P 19:55 22: BE, KA Butch 8/14/ AA 21:17 23: AT, FR, ZA Mark 8/15/ P 19:40 22: BE, KA, LO Butch 8/15/ AA 21:29 23: MC Mark 8/18/ AA 22:10 00: AT, BX Mark 8/25/2016 BE, GL, P 20:10 22: LO Butch 8/29/ P 22:40 01: AT, BE, KA, LO, Butch MC, WI 8/30/ P 19:20 22: BX, ME, UV, WI Butch 8/30/ AA 21:47 22: RECON Mark
14 8/31/ P 21:25 23: AT, BE, KA, LO Butch 8/31/ AA 20:34 23: AT, ME Mark 8/31/ AA 23:30 00: RECON Mark SubTotal Total September Date No. Call Takeoff Landing Dur. GL HY AgI Seeded Pilot Sign (UTC) 9/1/ AA 20:34 00: BA, ME, UV Mark 9/2/ AA 19:35 22: AT, BX, KA, ME, Mark WI 9/2/ P 20:05 21: AT, BE, LO Butch 9/2/ P 22:40 23: AT Butch 9/3/ P 22:15 23: AT, KA, WI Butch 9/4/ AA 21:35 23: AT, BX, FR, ME Mark 9/6/ P 19:15 22: AT, BX, KA Butch 9/14/ P 23:30 00: RECON Butch 9/22/ P 19:30 21: BE, GL, KA Butch 9/22/ AA 23:03 23: RECON Mark 9/24/ AA 23:21 00: UV Mark 9/25/ P 18:10 19: BX, KA, WI Butch 9/25/ AA 18:36 20: FR, ME Mark 9/25/ AA 21:22 23: AT, MC Mark SubTotal Total October Date No. Call Sign Takeoff (UTC) Landing Dur. GL HY AgI Seeded Pilot 10/6/ P 23:15 00: AT, BE, GL Butch 10/7/ P 17:40 19: AT, KA, MC, WI Butch 10/7/ P 20:35 22: AT, FR Butch 10/20/ P 18:25 20: MC Butch SubTotal
15 Total November Date No. Call Sign Takeoff (UTC) Landing Dur. GL HY AgI Seeded Pilot 11/3/2016 AT, KA, P 22:05 23: WI Butch 11/7/ P 19:10 21: AT, BE, KA, MC Butch 11/7/ P 22:10 23: FR Butch SubTotal Total Month 2016 Monthly Temperature and Precipitation Summary for San Antonio Monthly Normal Normal Temp. Total Month Month Monthly Departure Precipitation Precip. Temp. (F) from Normal (In.) (In.) (F) Average Monthly Temp. (F) Month Precip. Departure from Normal (In.) April May June July Aug Sept Oct Nov Month Average Monthly Temp. (F) 2016 Monthly Temperature and Precipitation Summary for Del Rio Monthly Normal Normal Temp. Total Month Month Monthly Departure Precipitation Precip. Temp. (F) from Normal (In.) (In.) (F) Month Precip. Departure from Normal (In.) April May June July Aug Sept Oct Nov Monthly Temperature and Precipitation Summary for Corpus Christi
16 Month Average Monthly Temp. (F) Normal Monthly Temp. (F) Monthly Temp. Departure from Normal (F) Total Month Precipitation (In.) Normal Month Precip. (In.) Month Precip. Departure from Normal (In.) April May June July Trace Aug Sept Oct Nov
17 April 2016 Operations Report April 25, Seeding operations were conducted over Frio (11 + 1H), La Salle (2 + 0H), Atascosa (2 + 0H), and McMullen (9 + 3H) counties. 24 flares plus 4 hygroscopic flares were burned within 8 clouds. The month of April contained 1 day of operations: Date Flares Counties Seeded H Atascosa, Frio, La Salle, McMullen TOTAL 24+4H While a few storms were present in early to mid April, most of these storms were after sunset or cloud bases were too low for pilots to safely fly. Most of the operational area received average to below average monthly rain for the month of April, while northern Bandera, Bexar, Medina, Uvalde and parts of Atascosa county received above average rain (radar/rain gauge multisensor field amounts) 1. April 2016 was not a very active month for cloud seeding which had only one operation day with 24 glaciogenic and 4 hygroscopic flares burned. One flight recorded 2.35 hours across the operational area. Fog, drizzle, low clouds, and storms after sunset were the main difficulties for seeding operations during April. Severe weather with very large hail in San Antonio was present on April 12, however those storms occurred outside the target area, or well after dark. The only mission flown was on April 25 when strong heating and high moisture caused scattered showers and storms along a weak dryline in the afternoon. Pilot had success finding storms across the region, however Severe Thunderstorm Warnings limited the number of storms we could cloud seed. The cloud seeding season started off with near average temperatures and above average precipitation for Corpus Christ, Del Rio, and San Antonio. Gauges in Medina, TX in Bandera county and San Antonio International Airport reported 5 to 6 inches of rain for during April. April 2016 Reported Gauge Measurements 2 Recorded Precipitation for Month (In.) Garner Field Airport Station near Uvalde 1.61 Hondo Municipal Airport Station 2.87 CoCoRaHS Station TX-BND-55 south of Medina, TX 5.10 San Antonio International Airport Station 6.19 Stinson Municipal Airport Station 2.64 CoCoRaHS Station TX-FR-10 in northwestern Frio County 2.89 Pleasanton Municipal Airport Station 1.01 CoCoRaHS Station TX-WO-29 south of Floresville 1.79 CoCoRaHS Station in TX-KS-3 western Karnes county 1.48 CoCoRaHS Station TX-BEE-10 northwest of Beeville 0.54 CoCoRaHS Station TX-MCM-3 in Tilden 0.83
18 May 2016 Operations Report May 17, Seeding operations were conducted over McMullen (2 + 0H), and La Salle (8 + 2H) counties. 10 flares plus 2 hygroscopic flares were burned within 2 clouds. May 21, Seeding operations were conducted over Bee (13 + 1H) county. 13 flares plus 1 hygroscopic flares were burned within 2 clouds. May 27, Seeding operations were conducted over Karnes (6 + 0H) and Bee (30 + 3H) counties. 36 flares plus 3 hygroscopic flares were burned within 1 cloud. May 31, Seeding operations were conducted over Atascosa (13 + 2H) and McMullen (10 + 1H) counties. 23 flares plus 3 hygroscopic flares were burned within 3 clouds. The month of May contained 4 days of operations: Date Flares Counties Seeded H La Salle, McMullen H Bee H Bee, Karnes H Atascosa, McMullen TOTAL 82+9H May was a very stormy month, however of fog and low cloud bases made flying unsafe for pilots on multiple occasions. In addition, cloud cover from storms over Mexico increased the CIN across the region multiple days, resulting in fewer convective storms, and many storms also occurred after dark. Most of the operational area received above average amounts of rain. Parts of Bandera, Bexar, and Medina counties were estimated to be 8+ inches of rain above normal for the month 1. May 2016 had 4 operational days with 82 glaciogenic and 9 hygroscopic flares burned. Four flights recorded hours across the operational area. The first half of May started off with many rainy, foggy, and cloudy days. Pilots were unable to fly due to unsafe conditions. Storms also formed in the early afternoon over the mountains in Mexico nearly everyday, with cloud cover reducing the heating over the operational area. Near the middle of the month, a series of cold fronts began moving through the region. The first was on May 17 when a strong cold front moved through, helping scattered thunderstorms form across the region. Limited seeding began in the late afternoon, however the storms were either too weak or severe. A few Severe Thunderstorm Warnings reduced which storms could be seeded, and storms begin dissipating in the early evening when cloud cover reduced surface heating. A weak warm front moved from south to north across the region on May 21. A few storms formed cross the operational area, however most of the storms were very weak and only a limited number of flares were burned. Later on, multiple individual storms began forming along a strong outflow boundary moving south. Pilot was able to add flares to these storms before storms consolidated into a large complex. The complex became Severe Thunderstorm warned until after sunset.
19 Finally, numerous storms formed on May 31 from surface heating, plentiful moisture, and an mesoscale convective system moving across the region. Multiple Severe Thunderstorm and Flash Flood warnings restricted which storms we could work on. Seeding material was added to various storms throughout the early afternoon in Atascosa and McMullen counties before conditions became unsafe for the pilot to fly. For the month of May, Del Rio and San Antonio both reported below average temperatures and above average temperature for Corpus Christi. Corpus Christi and San Antonio both reported above average precipitation, while recorded precipitation at Del Rio was below average. Substantial rain still fell across the operational area, with the CoCoRaHS station near Medina recording over 11 inches of rain for the month of May. May 2016 Reported Gauge Measurements 2 Recorded Precipitation for Month (In.) Garner Field Airport Station near Uvalde 6.01 Hondo Municipal Airport Station 7.03 CoCoRaHS Station TX-BND-55 south of Medina, TX San Antonio International Airport Station 9.15 Stinson Municipal Airport Station 7.75 CoCoRaHS Station TX-FR-10 in northwestern Frio County 7.23 Pleasanton Municipal Airport Station 4.22 CoCoRaHS Station TX-WO-30 northwest of Floresville 8.05 CoCoRaHS Station in TX-KS-3 western Karnes county 3.47 CoCoRaHS Station TX-BEE-10 northwest of Beeville 8.48 CoCoRaHS Station TX-MCM-3 in Tilden 4.11
20 June 2016 Operations Report June 8, Seeding operations were conducted over McMullen (10 + 0H), Atascosa (19 + 1H), and Frio (5 + 1H) counties. 34 flares plus 2 hygroscopic flares were burned within 4 clouds. June 19, Seeding operations were conducted over Uvalde (4 + 0H), and Frio (0 + 1H) counties. 4 flares plus 1 hygroscopic flares were burned within 2 clouds. June 20, Seeding operations were conducted over Karnes (6 + 0H), Wilson (30 + 2H), Atascosa (4 + 0H), Uvalde (2 + 1H), and La Salle (10 + 1H) counties. 52 flares plus 4 hygroscopic flares were burned within 6 clouds. June 25, Seeding operations were conducted over Atascosa (44 + 5H), Karnes (12 + 1H), Medina (22 + 3H), and Wilson (4 + 1H) counties. 82 flares plus 10 hygroscopic flares were burned within 11 clouds. June 26, Seeding operations were conducted over Atascosa (32 + 4H), Bandera (12 + 3H), Frio (8 + 1H), and Medina (24 + 3H) counties. 76 flares plus 11 hygroscopic flares were burned within 6 clouds. June 28, Seeding operations were conducted over Bexar (6 + 1H), Karnes (6 + 1H), Medina (16 + 3H), Uvalde (13 + 2H), and Wilson (16 + 1H) counties. 57 flares plus 8 hygroscopic flares were burned within 11 clouds. June 30, Seeding operations were conducted over Bee (4 + 1H), and McMullen (4 + 0H) counties. 8 flares plus 1 hygroscopic flares were burned within 3 clouds. The month of June contained 7 days of operations: Date Flares Counties Seeded H Atascosa, Frio, McMullen H Frio, Uvalde H Atascosa, Karnes, La Salle, Uvalde, Wilson H Atascosa, Karnes, Medina, Wilson H Atascosa, Bandera, Medina H Bexar, Karnes, Medina, Uvalde, Wilson H Bee, McMullen TOTAL H June started off slow then picked up near the end of the month. In late May / early June, the Association decided to suspend seeding operations for a few days because of flood risk. Most of the operational area had below average estimated rain, while parts of Atascosa, Bexar, Frio, Karnes, McMullen, Medina, and Wilson counties saw some above average rain amounts 1.
21 June 2016 had 7 operational days with 313 glaciogenic and 37 hygroscopic flares burned. Eleven flights recoded hours across the operational area. By early June the summer pattern started to dominate the rain activity. The pattern included convection from surface heating, and afternoon seabreeze showers/storms moving inland from the coast. Most of the seeding from this point on was done in the early afternoon to early evening hours. June 8 had scattered storms form along and ahead of a seabreeze boundary in the afternoon. Most of the rain occurred south of San Antonio, and seeding commenced in McMullen county. Some seeding was done in southern Frio county, however seeding was halted when storms crossed into northern Frio county, where seeding was suspended due to flood risk. The next seeding operation took place on June 19 when only a few flares were burned within a weak updraft from surface heating storms. Storms within the operational area were disorganized and did not last long. A more active pattern started on June 20 when an upper level ridge over the Southwest was drawing in ample moisture across south TX. June 20 saw the launch of both pilots, and seeding taking place simultaneously on different storms. Most of the storms throughout the day did not last long, however a few seeded storms did last longer than others not seeded. By June 25, an upper level low pressure system was slowly moving northeast across eastern Texas. This pattern was drawing very high moisture across the area, with precipitable water values 2+ inches. Storms started forming across the region in the early morning, then became scattered by early afternoon. Both pilots conducted seeding missions across the operational area until storms dissipated in the late afternoon. Similar conditions continued on June 26, with storms forming in the early morning and both pilots seeding until the late afternoon hours. June 28 saw a weak front move south across Texas. Storms initially formed well north of the operational area, and entered Bandera county in the mid afternoon. Cloud seeding began in the mid afternoon with storms remaining relatively isolated. Both pilots conducted seeding operations into the late evening through Bexar, Karnes, Medina, Uvalde, and Wilson counties, before both had to land. The afternoon storms became one large complex and this complex was making flying conditions unsafe. The month ended with a seeding attempt on weak storms generated from surface heating. Nine flares were burned within Bee and McMullen counties, however storms were very weak and did not last long. For June, San Antonio reported below average monthly temperature and precipitation, while Del Rio reported above average temperature and precipitation. Corpus Christi reported above average temperature and below average precipitation. Of the recorded precipitation across the operational area for June, the CoCoRaHS station in western Karnes county recorded the most rain with over 6 inches. June 2016 Reported Gauge Measurements 2 Recorded Precipitation for Month (In.) Garner Field Airport Station near Uvalde 2.74 Hondo Municipal Airport Station 1.74 CoCoRaHS Station TX-BND-55 south of Medina, TX 3.51 San Antonio International Airport Station 2.39 Stinson Municipal Airport Station 2.75 CoCoRaHS Station TX-FR-10 in northwestern Frio County 2.69
22 Pleasanton Municipal Airport Station 1.20 CoCoRaHS Station TX-WO-30 northwest of Floresville 4.84 CoCoRaHS Station in TX-KS-3 western Karnes county 6.73 CoCoRaHS Station TX-BEE-10 northwest of Beeville 4.32 CoCoRaHS Station TX-MCM-3 in Tilden 1.90
23 July 2016 Operations Report July 18, Seeding operations were conducted over Atascosa (3 + 0H), and Karnes (15 + 2H) counties. 18 flares plus 2 hygroscopic flares were burned within 2 clouds. July 19, Seeding operations were conducted over Atascosa (24 + 4H), Bee (2 + 0H), Bexar (2 + 0H), Goliad (10 + 2H), Karnes (2 + 0H), Live Oak (4 + 0H), and Wilson (8 + 2H) counties. 52 flares plus 8 hygroscopic flares were burned within 8 clouds. July 25, Seeding operations were conducted over Atascosa (2 + 1H), Karnes (6 + 1H), and Wilson (6 + 0H) counties. 14 flares plus 2 hygroscopic flares were burned within 8 clouds. July 26, Seeding operations were conducted over Atascosa (3 + 0H), Bee (12 + 2H), and McMullen (15 + 2H) counties. 30 flares plus 4 hygroscopic flares were burned within 2 clouds. July 27, Seeding operations were conducted over Karnes (14 + 3H), and McMullen (8 + 2H) counties. 22 flares plus 5 hygroscopic flares were burned within 4 clouds. July 28, Seeding operations were conducted over Atascosa (46 + 7H), Bexar (4 + 0H), Karnes (28 + 0H), Live Oak (4 + 2H), Medina (10 + 1H), McMullen (11 + 1H), and Wilson (18 + 1H) counties. 121 flares plus 12 hygroscopic flares were burned within 5+ clouds. July 29, Seeding operations were conducted over Atascosa (8 + 3H), Bee (4 + 1H), Gonzales (10 + 1H), Karnes (21 + 3H), Live Oak (4 + 0H), and Wilson (16 + 2H) counties. 63 flares plus 10 hygroscopic flares were burned within 8 clouds. The month of July contained 7 days of operations: Date Flares Counties Seeded H Atascosa, Karnes H Atascosa, Bee, Bexar, Goliad, Karnes, Live Oak, Wilson H Atascosa, Karnes, Wilson H Atascosa, Bee, McMullen H Karnes, McMullen H Atascosa, Bexar, Karnes, Live Oak, Medina, McMullen Wilson H Atascosa, Bee, Gonzales, Karnes, Live Oak, Wilson TOTAL H
24 July started off very slow, then became very busy towards the end of the month. Scattered areas of Atascosa, Bee, Bexar, Frio, McMullen, Medina, Uvalde, and Wilson counties recorded above average precipitation for the month of July. Elsewhere across the operational area recorded average to below average monthly precipitation, with Bandera county having the greatest precipitation reduction for the month of July 1. July 2016 had 7 operational days with 320 glaciogenic and 43 hygroscopic flares burned. Twelve flights recorded hours across the operational area. A strong ridge of high pressure dominated the south TX weather for the first half of July. The ridge began to weaken and move off to the east around mid July. By July 18, moisture from the Gulf began moving into south TX, where afternoon heating and a weak seabreeze helped generate afternoon showers and storms southeast of San Antonio. Eventually a few storms were seeded during the afternoon in Atascosa and Karnes county before the storms dissipated. As higher moisture values moved onshore on July 19, scattered weak storms began forming in the early afternoon. Most of these storms were too weak to effectively seed, and those which were seeded did not last very long. In the late afternoon, a few scattered storms seemed to respond better to our cloud seeding, before all storms dissipated in the evening. An upper level system began to move into Texas on July 25, however moisture was very limited across the region. Relatively dry air meant storms did not form until late in the afternoon and limited seeding took place in the evening. Most storms in the operational area were weak and did not last long, even with seeding. By July 26, the upper low moved out over the Gulf, which helped move substantial amounts of very moist air from the Gulf over south TX. Scattered showers and storms had already formed from daytime heating across the operational area by early afternoon, however fog and very low cloud bases prevented any flights until late in the afternoon. Both pilots were able to conduct a few seeding operations within a few evening storms in Atascosa, Bee, and McMullen counties. Abundant moisture and surface heating helped scattered showers and storms form across the area by early afternoon on July 27; however, fog and technical issues prevented any pilot launch until late in the afternoon. The first storms across the southern end of the operational area were very small and weak, with little to no updraft. After a few flares were burned on a short lived storm in McMullen, multiple flares were used on a stronger storm in Karnes county. A few more flares were burned within storms which redeveloped in McMullen that evening, before all storms dissipated across the area. July 27 overnight into July 28 saw a very strong low level jet across south TX, bringing in very high moisture across the region. Strong CAPE values and very little CIN combined with surface heating meant scattered showers and storms started forming across the region by the early afternoon. After seeding was attempted on weak, short lived storms north of Beeville, many flares were burned within a strong storm which traveled through Atascosa county all the way through Wilson county and beyond. Shortly after, a broken north-south line of storms formed west of San Antonio. Both pilots were in the air so one pilot seeded the northern half of the line, while the other concentrated on the southern half. Both pilots reported very strong inflow along most of the line of storms, at times inflow was so strong the updraft instruments on the airplanes could not register. With the help of a strengthening low level jet, and some weak upper level support, the line of storms consolidated into a large complex of storms by the early evening hours, and both pilots returned when all the flares their planes could carry were depleted. Over 100 flares were burned this day.
25 The final seeding day for July occurred on the 29 th. Extensive surface moisture remained in the lower levels, while in the upper levels of the atmosphere drier air was moving in. Scattered showers and storms started forming in the afternoon, as a strong seabreeze boundary began moving onshore. Both pilots conducted seeding operations throughout the afternoon and early evening before storms dissipated. For July, Corpus Christi, Del Rio, and San Antonio all reported above average monthly temperatures, and below average precipitation. A few stations across the operational area reported modest rainfall recordings, with the CoCoRaHS Station near Floresville recording over 4 inches of rain during July. July 2016 Reported Gauge Measurements 2 Recorded Precipitation for Month (In.) Garner Field Airport Station near Uvalde 1.03 Hondo Municipal Airport Station 1.56 CoCoRaHS Station TX-BND-55 south of Medina, TX 0.42 San Antonio International Airport Station 0.33 Stinson Municipal Airport Station 4.19 CoCoRaHS Station TX-FR-10 in northwestern Frio County 0.36 Pleasanton Municipal Airport Station 0.52 CoCoRaHS Station TX-WO-30 northwest of Floresville 4.47 CoCoRaHS Station in TX-KS-3 western Karnes county 0.17 CoCoRaHS Station TX-BEE-18 south of Beeville 1.49 CoCoRaHS Station TX-MCM-4 WNW of Tilden 2.05
26 August 2016 Operations Report August 5, Seeding operations were conducted over Atascosa (5 + 1H), and Wilson (2 + 0H) counties. 7 flares plus 1 hygroscopic flares were burned within 2 clouds. August 13, Seeding operations were conducted over Bee (8 + 1H), and Uvalde (5 + 0H) counties. 13 flares plus 1 hygroscopic flares were burned within 2 clouds. August 14, Seeding operations were conducted over Atascosa (28 + 4H), Bee (10 + 1H), Frio (2 + 1H), Karnes (30 + 3H), and Zavala (2 + 0H) counties. 72 flares plus 9 hygroscopic flares were burned within 13 clouds. August 15, Seeding operations were conducted over Bee (12 + 2H), Karnes (48 + 4H), Live Oak (4 + 0H), and McMullen (54 + 6H) counties. 118 flares plus 12 hygroscopic flares were burned within 6 clouds. August 18, Seeding operations were conducted over Atascosa (6 + 1H), and Bexar (4 + 1H) counties. 10 flares plus 2 hygroscopic flares were burned within 3 clouds. August 25, Seeding operations were conducted over Bee (14 + 1H), Goliad (12 + 1H), and Live Oak (10 + 1H) counties. 36 flares plus 3 hygroscopic flares were burned within 3 clouds. August 29, Seeding operations were conducted over Atascosa (10 + 1H), Bee (10 + 1H), Karnes (22 + 2H), Live Oak (2 + 0H), McMullen (10 + 1H), and Wilson (10 + 1H) counties. 64 flares plus 6 hygroscopic flares were burned within 8 clouds. August 30, Seeding operations were conducted over Bexar (6 + 0H), Medina (10 + 2H), Uvalde (32 + 3H), and Wilson (4 + 1H) counties. 52 flares plus 6 hygroscopic flares were burned within 3 clouds. August 31, Seeding operations were conducted over Atascosa (22 + 2H), Bee (6 + 0H), Karnes (10 + 1H), Live Oak (14 + 2H), and Medina (35 + 6H) counties. 87 flares plus 11 hygroscopic flares were burned within 10 clouds. The month of August contained 9 days of operations: Date Flares Counties Seeded 5 7+1H Atascosa, Wilson H Bee, Uvalde H Atascosa, Bee, Frio, Karnes, Zavala H Bee, Karnes, Live Oak, McMullen H Atascosa, Bexar
27 H Bee, Goliad, Live Oak H Atascosa, Bee, Karnes, Live Oak, McMullen, Wilson H Bexar, Medina, Uvalde, Wilson H Atascosa, Bee, Karnes, Live Oak, Medina TOTAL H August was a relatively busy month with the most days seeding per month this season. The entire operational area saw above average monthly precipitation for the month of August, with vast areas receiving 8+ inches of precipitation above the monthly normal 1. August 2016 had 9 operational days with 459 glaciogenic and 51 hygroscopic flares burned. Thirteen flights, plus 3 recon flights recorded hours across the operational area. Seeding operations in August begin on the 5 th when seeding operations took place late in the late afternoon. However, the pilot reported the rain would fall back through the updraft with every storm he saw, and even with seeding material, the storms did not last long. After this operational day, high pressure and strong CIN would settle over the area, eliminating any chances for cloud seeding for over a week. The next day for seeding came on August 13. A stationary front was present southwest to northeast across the region, with widespread morning rain ending by noon. A few week storms developed in Bee county in the afternoon, however these storms dissipated even with the addition of a few flares. A few more flares were added to another weak storm in Uvalde county, however that storm also dissipated. Plentiful moisture, along with strong surface heating, lead to scattered showers and storms developing in the early afternoon on August 14. Low clouds and visibility delayed any seeding attempts in the early afternoon. Cloud seeding operations began in Bee county with the first pilot before heading north to other storms in Karnes county. The second pilot was launched, then began seeding storms which formed in Atascosa county. Operations continued through the afternoon until a large area of rain and low clouds forced both pilots to land for safety issues. Similar conditions continued on August 15. The stationary front moved a little further west, however high surface moisture values remained. Widespread showers and storms were present throughout the morning, with seeding operations beginning near Beeville in the early afternoon. Additional storms formed over McMullen county, and remained very strong and relatively stationary throughout the late afternoon. Seeding continued in these regions until one pilot ran out of flares, and the other had to stop when there became a potential for flooding. By August 18, high pressure moved over the southeast US, with moisture again moving from the Gulf inland over south TX. Because of recent heavy rain and elevated rivers, seeding was not done in Bee or Karnes counties due to flooding potential. Multiple weak storms were investigated, and seeding was done on a few storms in Atascosa and Bexar counties; however, all storms were weak and did not last long. Flood risk ended all seeding operations across the operational area until August 25. On the 25 th, one stable storm in Goliad county had a decent updraft and was moving towards the operational area. Seeding began on that storm and then moved on to other weak storms in Bee and Live Oak counties. All storms dissipated by the evening hours. On August 29, an area of low pressure near Houston was slowly moving southwest along the coast, bringing scattered, short lived showers and storms with it. Seeding began in the early
28 afternoon when storms started forming southeast of San Antonio. Seeding operations were conducted across the eastern counties within the operational area through the late afternoon through late evening hours. August 30 saw a morning mesoscale convective system help generate afternoon showers and storms over the eastern operational area. Some seeding was done in Bexar and Wilson counties, before storms formed in Uvalde county. Operations then took place in Uvalde east to Medina from the early to late afternoon. All possible storms dissipated by evening. Finally August ended with a busy day on the 31 st, even though the region was under the presence of a strong upper level ridge. Strong daytime heating lead to storms developing west of San Antonio in the early afternoon. Seeding began in Medina county, then moved on to Karnes and Atascosa counties. As the afternoon developed, storms formed into broken lines, with storms over Medina county moving very slowly. Seeding ended in the late afternoon after one pilot seeded storms near Beeville, and the other retuned from storms in Medina and Atascosa counties. All storms dissipated by evening. The month of August recorded below average monthly temperature values for Del Rio and San Antonio, while Corpus Christi recorded an above average monthly temperature. All three locations reported above average monthly precipitation, with Del Rio recording over 8 inches of rain above normal. High rain amounts were also recorded across most of the operational area, with the CoCoRaHS Station in western Karnes county recording over 11 inches of precipitation in August. August 2016 Reported Gauge Measurements 2 Recorded Precipitation for Month (In.) Garner Field Airport Station near Uvalde 6.31 Hondo Municipal Airport Station 4.81 CoCoRaHS Station TX-BND-55 south of Medina, TX 5.38 San Antonio International Airport Station 4.91 Stinson Municipal Airport Station CoCoRaHS Station TX-FR-10 in northwestern Frio County 8.46 Pleasanton Municipal Airport Station 1.98 CoCoRaHS Station TX-WO-30 northwest of Floresville 9.31 CoCoRaHS Station in TX-KS-3 western Karnes county CoCoRaHS Station TX-BEE-10 northwest of Beeville CoCoRaHS Station TX-MCM-3 in Tilden 9.93
29 September 2016 Operations Report September 1, Seeding operations were conducted over Bandera (24 + 5H), Medina (12 + 0H), and Uvalde (6 + 1H) counties. 42 flares plus 6 hygroscopic flares were burned within 2 clouds. September 2, Seeding operations were conducted over Atascosa (16 + 2H), Bee (20 + 2H), Bexar (10 + 2H), Karnes (24 + 3H), Live Oak (10 + 1H), Medina (2 + 0H), and Wilson (9 + 0H) counties. 91 flares plus 10 hygroscopic flares were burned within 7 clouds. September 3, Seeding operations were conducted over Atascosa (10 + 1H), Karnes (32 + 4H), and Wilson (10 + 1H) counties. 52 flares plus 6 hygroscopic flares were burned within 4 clouds. September 4, Seeding operations were conducted over Atascosa (15 + 3H), Bexar (10 + 1H), Frio (12 + 2H), and Medina (1 + 0H) counties. 38 flares plus 6 hygroscopic flares were burned within 2+ clouds. September 6, Seeding operations were conducted over Atascosa (10 + 1H), Bexar (26 + 3H), and Karnes (22 + 2H) counties. 58 flares plus 6 hygroscopic flares were burned within 5 clouds. September 22, Seeding operations were conducted over Bee (10 + 1H), Goliad (10 + 1H), and Karnes (20 + 2H) counties. 40 flares plus 4 hygroscopic flares were burned within 2 clouds. September 24, Seeding operations were conducted over Uvalde (10 + 1H) county. 7 flares plus 2 hygroscopic flares were burned within 1 cloud. September 25, Seeding operations were conducted over Atascosa (20 + 1H), Bexar (20 + 2H), Frio (32 + 5H), Karnes (10 + 1H), McMullen (28 + 2H), Medina (10 + 1H), and Wilson (30 + 3H) counties. 150 flares plus 15 hygroscopic flares were burned within 9+ clouds. The month of September contained 8 days of operations: Date Flares Counties Seeded H Bandera, Medina, Uvalde H Atascosa, Bee, Bexar, Karnes, Live Oak, Medina, Wilson H Atascosa, Karnes, Wilson H Atascosa, Bexar, Frio, Medina H Atascosa, Bexar, Karnes H Bee, Goliad, Karnes
30 24 7+2H Uvalde H Atascosa, Bexar, Frio, Karnes, McMullen, Medina, Wilson TOTAL H September was a relatively busy month with operations occurring at the beginning and ending of the month. September saw the most flares per month burned during the season. Most of Bexar and Uvalde counties saw above average precipitation during September, while parts of Atascosa, Bandera, McMullen, Medina, and Wilson also saw above average monthly precipitation. The rest of the operational area saw average to below average precipitation 1. September 2016 had 8 operational days with 479 glaciogenic and 55 hygroscopic flares burned. Twelve flights, plus 2 recon flights recorded hours across the operational area. September operations began on the 1 st, with seeding beginning on a weak storm in Uvalde county in the afternoon. Strong heating helped small storms form in the early afternoon, and outflow boundaries from these storms helped initiate storms across the region. Seeding continued on another storm in Bandera county which seemed to respond well with the added seeding material. This storm lasted longer, and eventually the pilot ran out of flares just before sunset. After a late start on September 2, strong heating and abundant moisture lead to numerous thunderstorms across the region through the afternoon and evening. Both pilots were able to intercept and seed many storms across the region, before flood risk and darkening skies ended the day. A weak stationary front helped initiate storms in the late afternoon on September 3. Multiple storms within a broken line were seeded in Atascosa, Karnes, and Wilson counties through the afternoon and evening. Surface heating and outflow boundaries helped initiate scattered storms across the region on the afternoon of the September 4. Multiple storms from Atascosa through Wilson counties were seeded before widespread heavy rain and low clouds forced the pilot to return for safety. By September 6, drier air was beginning to move into the region, however multiple afternoon storms still developed, and seeded operations took place. Most of the storms seemed to respond well to the seeding, with seeding taking place across Atascosa, Bexar, and Karnes counties through the late afternoon. No other seeding operations took place until September 22 when a weak low pressure system moved onshore from the Gulf. Surface heating helped multiple storms develop around the low center, which was east of the operational area. A few weak storms were seeded across the eastern counties of the operational area in the early afternoon, however weakening storms and low clouds prevented any operations into the late afternoon. September 24 saw only weak afternoon storms over Uvalde county. Even with the added material, the only seeded storm did not last long. The final seeding event for September was a busy one. A strong low pressure and cold front were heading towards the region from the west, while warm, humid air was being drawn in from the Gulf. Early afternoon storms from surface heating developed southeast of San Antonio, where the first pilot began seeding operations. Shortly after, the second pilot was launched began seeding storms from the approaching low pressure west of San Antonio. Both pilots returned when they ran out of flares. Eventually the cold front moved through from west to east, forming a long north-south line of storms. One pilot continued seeding the line of storms until Flash Flood warnings and darkening skies ended the operational day.
31 Corpus Christi, Del Rio and San Antonio recorded above average monthly temperatures during September, while Del Rio and San Antonio recorded above average precipitation. Only Corpus Christi had below average precipitation. Across the operational area, some locations received significant amounts of rain, such as San Antonio International Airport with 6.30 inches; while other regions reported much smaller amounts, such as the CoCoRaHS Station in northwestern Frio County. September 2016 Reported Gauge Measurements 2 Recorded Precipitation for Month (In.) Garner Field Airport Station near Uvalde 2.78 Hondo Municipal Airport Station 1.65 CoCoRaHS Station TX-BND-55 south of Medina, TX 3.37 San Antonio International Airport Station 6.30 Stinson Municipal Airport Station 7.65 CoCoRaHS Station TX-FR-10 in northwestern Frio County 1.00 Pleasanton Municipal Airport Station 1.73 CoCoRaHS Station TX-WO-30 northwest of Floresville 0.78 CoCoRaHS Station in TX-KS-3 western Karnes county 1.75 CoCoRaHS Station TX-BEE-10 northwest of Beeville 1.19 CoCoRaHS Station TX-MCM-3 in Tilden 4.40
32 October 2016 Operations Report October 6, Seeding operations were conducted over Atascosa (16 + 1H), Bee (16 + 1H), and Goliad (4 + 1H) counties. 36 flares plus 3 hygroscopic flares were burned within 3 clouds. October 7, Seeding operations were conducted over Atascosa (46 + 0H), Frio (22 + 0H), Karnes (20 + 0H), McMullen (22 + 0H), and Wilson (18 + 0H) counties. 128 flares plus 0 hygroscopic flares were burned within 10 clouds. October 20, Seeding operations were conducted over McMullen (48 + 0H) county. 48 flares plus 0 hygroscopic flares were burned within 1+ cloud. The month of October contained 3 days of operations: Date Flares Counties Seeded H Atascosa, Bee, Goliad H Atascosa, Frio, Karnes, McMullen, Wilson H McMullen TOTAL 212+3H October was not a very busy month with two seeding operations near the beginning and one operation near the end of the month. Our stock of hygroscopic flares was depleted after the first flight in October. Precipitation accumulation across the entire operational area was below normal for October. The counties with the lowest recorded precipitation for the month were parts of Bandera and Bexar counties 1. October 2016 had 3 operational days with 212 glaciogenic and 3 hygroscopic flares burned. Four flights recorded 7.95 hours across the operational area. Even with cold fronts beginning to move into the region more frequently in October, the month was still warmer than average. Towards the beginning of the month, a weak low pressure moved onshore bringing ample moisture to south Texas. On October 6 enough surface heating took place for isolated showers and storms to form along a seabreeze boundary late in the afternoon. The seabreeze was the main storm generator, and the storms did not last long once they moved off the boundary. A few storms were seeded, however most of the storms were weak and did not last long. A very warm and humid air mass, for early October, was in place on the 7 th. Early afternoon storms were weak to moderate and usually did not last long even with seeding. Still pilot burned enough flares for the need to land and reflare by mid afternoon. Later in the day a cold front moved south and additional storms formed along the front. Pilot continued seeding until storms dissipated in the late evening. High pressure and cooler temperatures remained over south Texas until October 20. A weak, slow moving cold front was moving south throughout the day. Warm humid air was present south of San Antonio, however storms were weak and short lived until they reached McMullen county. Stronger, slow moving storms formed in McMullen county in the early afternoon, and were seeded throughout the afternoon until the storms dissipated or moved out of the operational area. As the weather pattern shifted during the Fall season, Corpus Christi, Del Rio and San Antonio reported above average temperatures and below average precipitation. Most of the
33 operational area recorded little precipitation, with the most October precipitation recorded at the CoCoRaHS Station near Beeville. October 2016 Reported Gauge Measurements 2 Recorded Precipitation for Month (In.) Garner Field Airport Station near Uvalde 0.00 Hondo Municipal Airport Station Trace CoCoRaHS Station TX-BND-55 south of Medina, TX 0.00 San Antonio International Airport Station 0.16 Stinson Municipal Airport Station 0.04 CoCoRaHS Station TX-FR-10 in northwestern Frio County 0.00 Pleasanton Municipal Airport Station 0.03 CoCoRaHS Station TX-WO-30 northwest of Floresville 0.27 CoCoRaHS Station in TX-KS-3 western Karnes county 0.36 CoCoRaHS Station TX-BEE-10 northwest of Beeville 1.05 CoCoRaHS Station TX-MCM-6 northwest of Tilden 1.23
34 November 2016 Operations Report November 3, Seeding operations were conducted over Atascosa (22 + 0H), Karnes (30 + 0H), and Wilson (4 + 0H) counties. 56 flares plus 0 hygroscopic flares were burned within 4 clouds. November 7, Seeding operations were conducted over Atascosa (28 + 0H), Bee (19 + 0H), Frio (12 + 0H), Karnes (20 + 0H), and McMullen (2 + 0H) counties. 81 flares plus 0 hygroscopic flares were burned within 7 clouds. The month of November contained 2 days of operations: Date Flares Counties Seeded H Atascosa, Karnes, Wilson Atascosa, Bee, Frio, Karnes, McMullen TOTAL 137+0H November was not a very busy month with only 2 flights near the beginning of the month. November 2016 had 2 operational days with 137 glaciogenic and 0 hygroscopic flares burned. The operational area saw below average precipitation amounts for the month of November, with the northern counties have the largest precipitation deficit 1. Three flights recorded 5.68 hours across the operational area. November started off with above average temperatures across the region. These warmer than average temperatures, along with moisture values higher than usual for November, helped initiate showers and thunderstorms across the region when a cold front moved through on November 3. Enough surface heating, in addition to the southward moving cold front, were enough for isolated thunderstorms to develop. Most storms only lasted about one hour even with seeding, however a few evening storms which stayed close to the cold front lasted longer. No cold fronts were present on November 7, however enough surface heating was in place for scattered showers and storms to begin developing in the early afternoon across the region. Storms moved very slowly in various directions due to weak upper level winds. Due to the earlier launch time and slow movement speeds, more storms were seeded than on November 3. Many of the late afternoon storms formed from outflow boundaries generated by earlier convection. For the month of November, Corpus Christi, Del Rio and San Antonio reported above average temperatures. Corpus Christi and San Antonio reported below average precipitation, while Del Rio reported more than one inch above normal precipitation for November. November 2016 Reported Gauge Measurements 2 Recorded Precipitation for Month (In.) Garner Field Airport Station near Uvalde 1.99 Hondo Municipal Airport Station 0.99 CoCoRaHS Station TX-BND-55 south of Medina, TX 1.93 San Antonio International Airport Station 1.79 Stinson Municipal Airport Station 2.17 CoCoRaHS Station TX-FR-10 in northwestern Frio County 0.30
35 Pleasanton Municipal Airport Station 0.02 CoCoRaHS Station TX-WO-30 northwest of Floresville 1.95 CoCoRaHS Station in TX-KS-3 western Karnes county 3.08 CoCoRaHS Station TX-BEE-10 northwest of Beeville 0.10 CoCoRaHS Station TX-MCM-6 northwest of Tilden 0.31
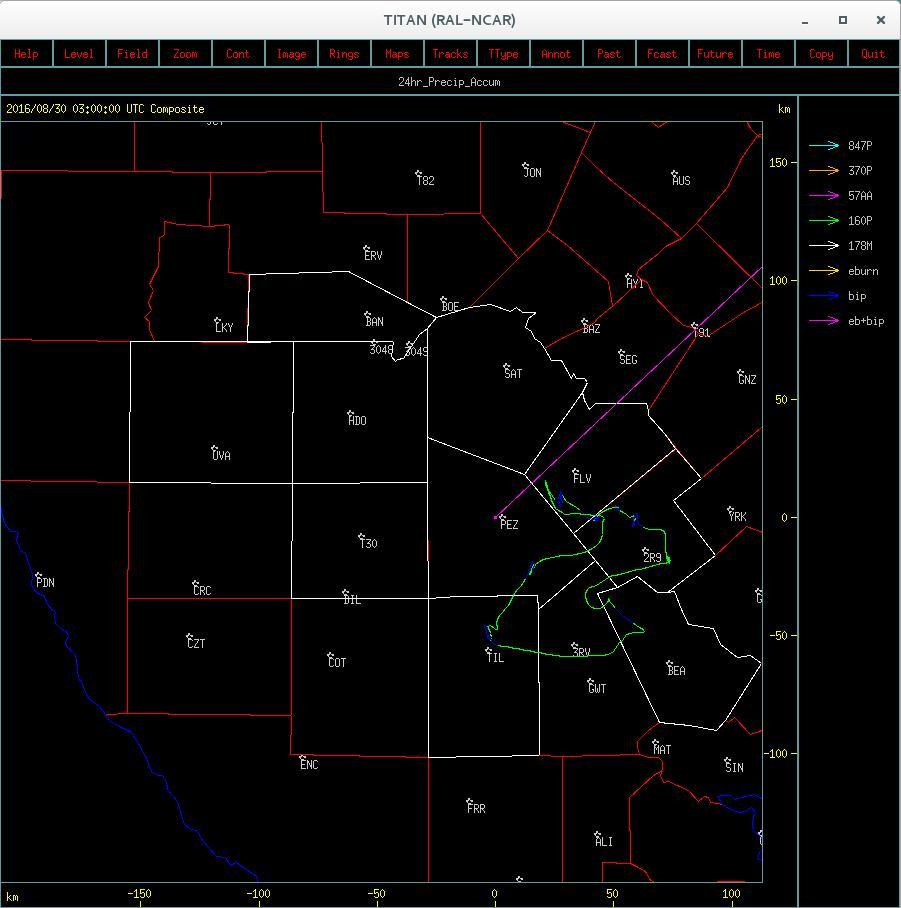
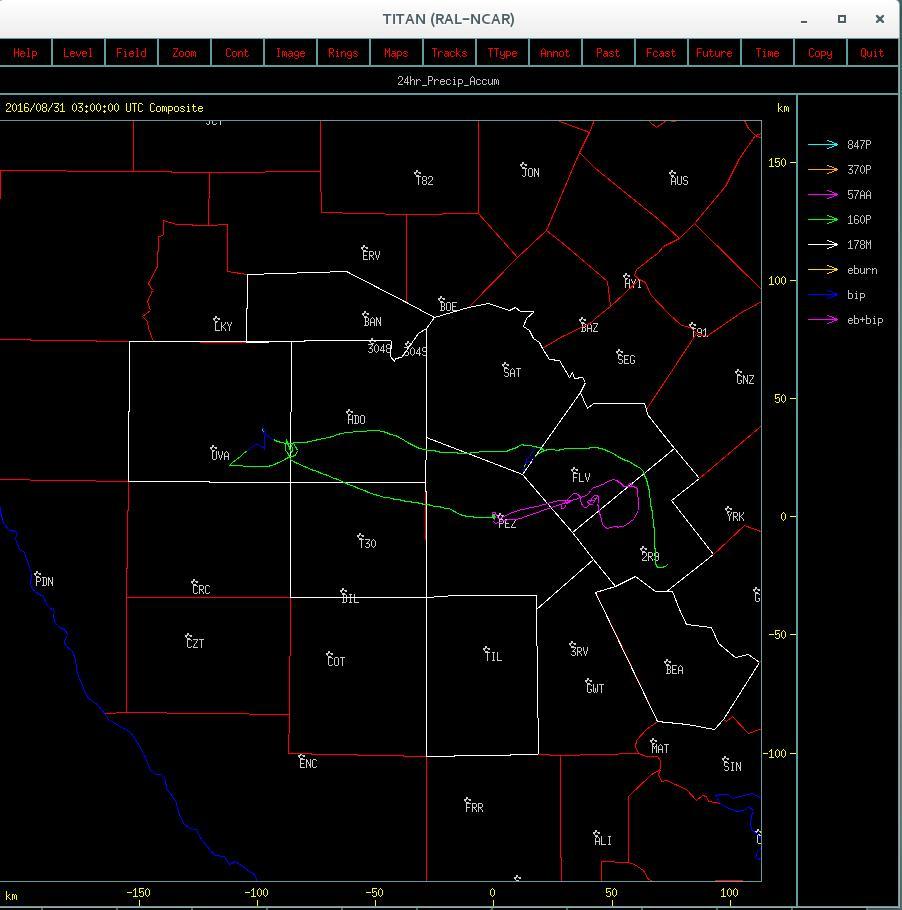
36 Operational TITAN Images


37 April 25, 2016

38 May 17, 2016


39 May 21, 2016

40 May 27, 2016


41 May 31, 2016


42 June 8, 2016


43 June 19, 2016


44 June 20, 2016

45 June 25, 2016


46 June 26, 2016


47 June 28, 2016


48 June 30, 2016


49 July 18, 2016


50 July 19, 2016


51 July 25, 2016


52 July 26, 2016


53 July 27, 2016


54 July 28, 2016


55 July 29, 2016


56 August 5, 2016

57 August 13, 2016

58 August 14, 2016


59 August 15, 2016


60 August 18, 2016

61 August 25, 2016

62 August 29, 2016

63 August 30, 2016


64 August 31, 2016


65 September 1, 2016


66 September 2, 2016


67 September 3, 2016


68 September 4, 2016


69 September 6, 2016

70 September 22, 2016


71 September 24, 2016


72 September 25, 2016


73 October 6, 2016

74 October 7, 2016

75 October 20, 2016


76 November 3, 2016


77 November 7, 2016
78 Monthly Rainfall Images: Observed and Percent of Normal Precipitation

")
79 April Observed Precipitation (inches) Percent of normal

")
80 May Observed Precipitation (inches) Percent of normal

")
81 June 2016 Observed Precipitation (inches) Percent of normal

")
82 July 2016 Observed Precipitation (inches) Percent of normal

")
83 August 2016 Observed Precipitation (inches) Percent of normal

")
84 September 2016 Observed Precipitation (inches) Percent of normal

")
85 October 2016 Observed Precipitation (inches) Percent of normal

")
86 November 2016 Observed Precipitation (inches) Percent of normal

87 Fig. 1. Plot of flare burn locations over STWMA operational area dependent on which aircraft burned the flare and day the flare was burned. Different colors represent different days which operations took place. Circle means flare was burned by 57AA and square indicates flare was burned by 160P.
SOUTH TEXAS WEATHER MODIFICATION ASSOCIATION
 SOUTH TEXAS WEATHER MODIFICATION ASSOCIATION Mammatus clouds hanging from thunderstorm anvil. Looking north from Pleasanton Municipal Airport, July 26, 2010. 2010 REPORT 2010 FINAL REPORT for the SOUTH
Snapshot of Seeding Operations. Number of Flares (total) 2 August 1.0 2H, 0G Rio Grande de Loiza 13:07 2 August 0.6 0H, 0G Reconnaissance 16:10
 2 August 1.0 2H, 0G Rio Grande de Loiza 13:07 2 August 0.6 0H, 0G Reconnaissance 16:10") 9..25 Monthly Report August 25 Project Puerto Rico Cloud Seeding Program Project Manager Gary L. Walker 9 missions this month 8:48 flight time this month 6 this month this month Snapshot of Seeding Operations
9..25 Monthly Report August 25 Project Puerto Rico Cloud Seeding Program Project Manager Gary L. Walker 9 missions this month 8:48 flight time this month 6 this month this month Snapshot of Seeding Operations
24: Monthly Report September Seeding Operations & Atmospheric Research (SOAR) Snapshot of Seeding Operations
 Snapshot of Seeding Operations") 0.3.05 Monthly Report September 05 Project Puerto Rico Cloud Seeding Program Project Manager Gary L. Walker Snapshot of Seeding Operations Date Flight Time (hours) Number of Flares (total) September 0:04
0.3.05 Monthly Report September 05 Project Puerto Rico Cloud Seeding Program Project Manager Gary L. Walker Snapshot of Seeding Operations Date Flight Time (hours) Number of Flares (total) September 0:04
January 2006 Climate Summary
 Ashley Brooks (765) 494-6574 Feb 9, 2006 http://www.iclimate.org January 1-3 January 2006 Climate Summary Unseasonably warm conditions welcomed in the New Year with highs in the 40s across the northern
SOUTH TEXAS WEATHER MODIFICATION ASSOCIATION EDWARDS AQUIFER AUTHORITY TARGET AREA 2008 REPORT
 SOUTH TEXAS WEATHER MODFCATON ASSOCATON EDWARDS AQUFER AUTHORTY TARGET AREA 2008 REPORT 2008 FNAL REPORT for the SOUTH TEXAS WEATHER MODFCATON ASSOCATON EDWARDS AQUFER AUTHORTY TARGET AREA by Todd Flanagan
Champaign-Urbana 1998 Annual Weather Summary
 Champaign-Urbana 1998 Annual Weather Summary ILLINOIS STATE WATER SURVEY Audrey Bryan, Weather Observer 2204 Griffith Dr. Champaign, IL 61820 wxobsrvr@sparc.sws.uiuc.edu The development of the El Nìno
NATIONAL WEATHER SERVICE
 January 2016 February 9, 2016 This was a dry month across the HSA despite one large and several smaller snowfalls. Most locations ended up 1-2 inches below normal for the month. The driest locations at
but 2012 was dry Most farmers pulled in a crop
 After a winter that wasn t, conditions late in the year pointed to a return to normal snow and cold conditions Most farmers pulled in a crop but 2012 was dry b y M i k e Wr o b l e w s k i, w e a t h e
September 2005 Climate Summary
 Ashley Brooks (765) 494-6574 Oct 5, 2005 http://iclimate.org September 2005 Climate Summary September 1-7 A cold front came through on the 1 st of the month, however little moisture was associated with
2011 Year in Review TORNADOES
 2011 Year in Review The year 2011 had weather events that will be remembered for a long time. Two significant tornado outbreaks in April, widespread damage and power outages from Hurricane Irene in August
National Wildland Significant Fire Potential Outlook
 National Wildland Significant Fire Potential Outlook National Interagency Fire Center Predictive Services Issued: September, 2007 Wildland Fire Outlook September through December 2007 Significant fire
The hydrologic service area (HSA) for this office covers Central Kentucky and South Central Indiana.
 for this office covers Central Kentucky and South Central Indiana.") January 2012 February 13, 2012 An X inside this box indicates that no flooding occurred within this hydrologic service area. January 2012 continued the string of wet months this winter. Rainfall was generally
January 2012 February 13, 2012 An X inside this box indicates that no flooding occurred within this hydrologic service area. January 2012 continued the string of wet months this winter. Rainfall was generally
Monthly Long Range Weather Commentary Issued: May 15, 2014 Steven A. Root, CCM, President/CEO
 Monthly Long Range Weather Commentary Issued: May 15, 2014 Steven A. Root, CCM, President/CEO sroot@weatherbank.com APRIL 2014 REVIEW Climate Highlights The Month in Review The average temperature for
Champaign-Urbana 1999 Annual Weather Summary
 Champaign-Urbana 1999 Annual Weather Summary ILLINOIS STATE WATER SURVEY 2204 Griffith Dr. Champaign, IL 61820 wxobsrvr@sws.uiuc.edu Maria Peters, Weather Observer A major snowstorm kicked off the new
Weather and Climate Summary and Forecast Summer 2017
 Weather and Climate Summary and Forecast Summer 2017 Gregory V. Jones Southern Oregon University August 4, 2017 July largely held true to forecast, although it ended with the start of one of the most extreme
Weather and Climate Summary and Forecast August 2018 Report
 Weather and Climate Summary and Forecast August 2018 Report Gregory V. Jones Linfield College August 5, 2018 Summary: July 2018 will likely go down as one of the top five warmest July s on record for many
The Weather Wire. Contents: Summer 2018 Outlook. Summer 2018 Outlook Drought Monitor May Summary/Statistics June Preview Rainfall Totals
 The Weather Wire June 2018 Volume 25 Number 6 Contents: Summer 2018 Outlook Drought Monitor May Summary/Statistics June Preview Rainfall Totals Summer 2018 Outlook June 1 st marked the first day of meteorological
What a Hurricane Needs to Develop
 Weather Weather is the current atmospheric conditions, such as air temperature, wind speed, wind direction, cloud cover, precipitation, relative humidity, air pressure, etc. 8.10B: global patterns of atmospheric
July 2007 Climate Summary
 Dan Bowman (765) 494-6574 Sep 3, 2007 http://www.iclimate.org Summary July 2007 Climate Summary The month of July ended as a very unusual month. Many events occurred during the month of July that is not
Arizona Climate Summary September 2017 Summary of conditions for August 2017
 August 2017 Temperature and Precipitation Summary Arizona Climate Summary September 2017 Summary of conditions for August 2017 August 1 st 15 th : The monsoon activity that ended July continued into the
DEPARTMENT OF EARTH & CLIMATE SCIENCES Name SAN FRANCISCO STATE UNIVERSITY Nov 29, ERTH 360 Test #2 200 pts
 DEPARTMENT OF EARTH & CLIMATE SCIENCES Name SAN FRANCISCO STATE UNIVERSITY Nov 29, 2018 ERTH 360 Test #2 200 pts Each question is worth 4 points. Indicate your BEST CHOICE for each question on the Scantron
The Pennsylvania Observer
 The Pennsylvania Observer October 1, 2015 September 2015 - Pennsylvania Weather Recap By: Quinn Lease The month of September will be remembered for its above normal temperatures and dry conditions that
The Pennsylvania Observer
 The Pennsylvania Observer The Pennsylvania Observer September 16, 2004 Recap of Pennsylvania's weather from August 6 - September 12, 2004. http://pasc.met.psu.edu/pa_climatologist/nl/archive/20040916/sec1.php
May 2005 Climate Summary
 Ashley Brooks (765) 494-6574 Jun 7, 2005 http://iclimate.org May 2005 Climate Summary May 1-5 Early May was characterized by an upper-level trough that was in place over Indiana that brought in very cool
Issued by: National Weather Service San Joaquin Valley - Hanford CA. Issue time: 409 AM PST Wed Jan
 Forecast Information Location: New_Exchequer_Dam Updated: January 16, 2019, 11:45 am NWS Weather Discussion: Issued by: National Weather Service San Joaquin Valley - Hanford CA Issue time: 409 AM PST Wed
Monthly Long Range Weather Commentary Issued: SEPTEMBER 19, 2016 Steven A. Root, CCM, Chief Analytics Officer, Sr. VP,
 Monthly Long Range Weather Commentary Issued: SEPTEMBER 19, 2016 Steven A. Root, CCM, Chief Analytics Officer, Sr. VP, sroot@weatherbank.com SEPTEMBER 2016 Climate Highlights The Month in Review The contiguous
DEPARTMENT OF GEOSCIENCES SAN FRANCISCO STATE UNIVERSITY. Metr Fall 2012 Test #1 200 pts. Part I. Surface Chart Interpretation.
 DEPARTMENT OF GEOSCIENCES SAN FRANCISCO STATE UNIVERSITY NAME Metr 356.01 Fall 2012 Test #1 200 pts Part I. Surface Chart Interpretation. Figure 1. Surface Chart for 1500Z 7 September 2007 1 1. Pressure
Monthly Long Range Weather Commentary Issued: February 15, 2015 Steven A. Root, CCM, President/CEO
 Monthly Long Range Weather Commentary Issued: February 15, 2015 Steven A. Root, CCM, President/CEO sroot@weatherbank.com JANUARY 2015 Climate Highlights The Month in Review During January, the average
Arizona Climate Summary
 August 2015 Temperature and Precipitation Summary Arizona Climate Summary September 2015 Summary of conditions for August 2015 August 1 st 16 th : August was a wet month across the state with only 3 days
TFS WEATHER BRIEF. Monday, March 25
 TFS WEATHER BRIEF Monday, March 25 Review: The leading edge of cooler and drier air was pushing through Central and East TX this morning. A few lingering thunderstorms were in progress south of I-20 in
Weekly Weather Briefing. NWS Albuquerque. Severe Threat Central & East through Tonight, then Drying. NWS Albuquerque September 29, 2014
 Severe Threat Central & East through Tonight, then Drying September 29, 2014 Today s Max Temp Departure from Normal Notable Severe Weather Events in September* September 30, 1998 Los Lunas: 4.5 Hail*
The Pennsylvania Observer
 The Pennsylvania Observer September 3, 2008 Summer 2008 Weather Summary Written by: Brian Thompson The opening days of June started dry, but a warm front brought a widespread rain a couple of days into
MDA WEATHER SERVICES AG WEATHER OUTLOOK. Kyle Tapley-Senior Agricultural Meteorologist May 22, 2014 Chicago, IL
 MDA WEATHER SERVICES AG WEATHER OUTLOOK Kyle Tapley-Senior Agricultural Meteorologist May 22, 2014 Chicago, IL GLOBAL GRAIN NORTH AMERICA 2014 Agenda Spring Recap North America Forecast El Niño Discussion
May 2016 Volume 23 Number 5
 The Weather Wire May 2016 Volume 23 Number 5 Contents: Winter Summary Current Colorado and West-wide Snow Pack Drought Monitor April Summary/Statistics May Preview Snowfall Totals Winter Summary The Front
Arizona Climate Summary
 May 2015 Temperature and Precipitation Summary Arizona Climate Summary June 2015 Summary of conditions for May 2015 May 1 st 14 th : May began with high pressure in the west, and May 1 st was dry statewide,
Investigation of the Arizona Severe Weather Event of August 8 th, 1997
 Investigation of the Arizona Severe Weather Event of August 8 th, 1997 Tim Hollfelder May 10 th, 2006 Abstract Synoptic scale forcings were very weak for these thunderstorms on August 7-8, 1997 over the
Arizona Climate Summary May 2012
 Arizona Climate Summary May 2012 Summary of conditions for April 2012 April 2012 Temperature and Precipitation Summary April 1 st 16 th : Although April began with another low pressure system sweeping
TROPICAL STORM HARVEY BRIEFING
 TROPICAL STORM HARVEY BRIEFING 10:00 AM CDT Sunday, August 27, 2017 Prepared by: NWS LIX NWSNewOrleans www.weather.gov/neworleans Situation Overview New Information Tropical Storm Winds 40mph Immediate
Weather and Climate Summary and Forecast October 2017 Report
 Weather and Climate Summary and Forecast October 2017 Report Gregory V. Jones Linfield College October 4, 2017 Summary: Typical variability in September temperatures with the onset of fall conditions evident
Mid-Latitude Cyclones and Fronts. Lecture 12 AOS 101
 Mid-Latitude Cyclones and Fronts Lecture 12 AOS 101 Homework 4 COLDEST TEMPS GEOSTROPHIC BALANCE Homework 4 FASTEST WINDS L Consider an air parcel rising through the atmosphere The parcel expands as it
Pacific Decadal Oscillation ( PDO ):
:") Time again for my annual Winter Weather Outlook. Here's just a small part of the items I considered this year and how I think they will play out with our winter of 2015-2016. El Nino / La Nina: When looking
Time again for my annual Winter Weather Outlook. Here's just a small part of the items I considered this year and how I think they will play out with our winter of 2015-2016. El Nino / La Nina: When looking
Weather and Climate Summary and Forecast October 2018 Report
 Weather and Climate Summary and Forecast October 2018 Report Gregory V. Jones Linfield College October 4, 2018 Summary: Much of Washington, Oregon, coastal California and the Bay Area and delta region
August 2006 Summary. August 1-5
 Ashley Brooks (765) 494-6574 Sep 8, 2006 http://www.iclimate.org August 1-5 August 2006 Summary The heat wave that started during the end of July continued into the beginning parts of August with temperatures
California 120 Day Precipitation Outlook Issued Tom Dunklee Global Climate Center
 California 120 Day Precipitation Outlook Issued 11-01-2008 Tom Dunklee Global Climate Center This is my second updated outlook for precipitation patterns and amounts for the next 4 s of the current rainy
October 2011 Climate Summary
 Ken Scheeringa and Kayla Hudson Nov 4, 2011 http://www.iclimate.org October 2011 Climate Summary Month Summary October weather evolved as a two part story. Weather conditions the first half of the month
UPDATE OF REGIONAL WEATHER AND SMOKE HAZE (December 2017)
") UPDATE OF REGIONAL WEATHER AND SMOKE HAZE (December 2017) 1. Review of Regional Weather Conditions for November 2017 1.1 In November 2017, Southeast Asia experienced inter-monsoon conditions in the first
UPDATE OF REGIONAL WEATHER AND SMOKE HAZE (December 2017) 1. Review of Regional Weather Conditions for November 2017 1.1 In November 2017, Southeast Asia experienced inter-monsoon conditions in the first
Type of storm viewed by Spotter A Ordinary, multi-cell thunderstorm. Type of storm viewed by Spotter B Supecell thunderstorm
 ANSWER KEY Part I: Locating Geographical Features 1. The National Weather Service s Storm Prediction Center (www.spc.noaa.gov) has issued a tornado watch on a warm spring day. The watch covers a large
Climate. Annual Temperature (Last 30 Years) January Temperature. July Temperature. Average Precipitation (Last 30 Years)
 January Temperature. July Temperature. Average Precipitation (Last 30 Years)") Climate Annual Temperature (Last 30 Years) Average Annual High Temp. (F)70, (C)21 Average Annual Low Temp. (F)43, (C)6 January Temperature Average January High Temp. (F)48, (C)9 Average January Low Temp.
Climate Annual Temperature (Last 30 Years) Average Annual High Temp. (F)70, (C)21 Average Annual Low Temp. (F)43, (C)6 January Temperature Average January High Temp. (F)48, (C)9 Average January Low Temp.
Thai Meteorological Department, Ministry of Digital Economy and Society
 Thai Meteorological Department, Ministry of Digital Economy and Society Three-month Climate Outlook For November 2017 January 2018 Issued on 31 October 2017 -----------------------------------------------------------------------------------------------------------------------------
Weekly Weather Briefing. NWS Albuquerque. Tuesday Soaker. NWS Albuquerque August 25, Weekly Weather Briefing
 Weekly Weather Briefing Weekly Weather Briefing Tuesday Soaker August 25, 2014 August 2014 vs. 2013 Precipitation Percent of Average August 1-24, 2014 August 2013 Weekly Weather Briefing ABQ **Preliminary**
Office of the Washington State Climatologist
 Office of the Washington State Climatologist May 3, 2013 April Event Summary Average April temperatures were below normal for a majority of the state. Total precipitation was above normal for western and
Foundations of Earth Science, 6e Lutgens, Tarbuck, & Tasa
 Foundations of Earth Science, 6e Lutgens, Tarbuck, & Tasa Weather Patterns and Severe Weather Foundations, 6e - Chapter 14 Stan Hatfield Southwestern Illinois College Air masses Characteristics Large body
Monthly Long Range Weather Commentary Issued: SEPTEMBER 19, 2015 Steven A. Root, CCM, Chief Analytics Officer, Sr. VP, sales
 Monthly Long Range Weather Commentary Issued: SEPTEMBER 19, 2015 Steven A. Root, CCM, Chief Analytics Officer, Sr. VP, sales sroot@weatherbank.com AUGUST 2015 Climate Highlights The Month in Review The
Arizona Climate Summary February 2012
 Arizona Climate Summary February 2012 Summary of conditions for January 2012 January 2012 Temperature and Precipitation Summary January 1 st 20 th : The New Year has started on a very dry note. The La
Arizona Climate Summary
 April 2016 Temperature and Precipitation Summary Arizona Climate Summary May 2016 Summary of conditions for April 2016 April 1 st 15 th : April 1 st saw the tail end of a low pressure system move out of
ANSWER KEY. Part I: Synoptic Scale Composite Map. Lab 12 Answer Key. Explorations in Meteorology 54
 ANSWER KEY Part I: Synoptic Scale Composite Map 1. Using Figure 2, locate and highlight, with a black dashed line, the 500-mb trough axis. Also, locate and highlight, with a black zigzag line, the 500-mb
RR#4 - Multiple Choice
 1. The map below shows the amount of snowfall, in inches, produced by a lake-effect snowstorm in central New York State. The wind that produced this snowfall pattern most likely came from the 1) northeast
Weather and Climate Summary and Forecast February 2018 Report
 Weather and Climate Summary and Forecast February 2018 Report Gregory V. Jones Linfield College February 5, 2018 Summary: For the majority of the month of January the persistent ridge of high pressure
The hydrologic service area (HSA) for this office covers Central Kentucky and South Central Indiana.
 for this office covers Central Kentucky and South Central Indiana.") MONTH YEAR January 2011 February 15, 2011 X An X inside this box indicates that no flooding occurred within this hydrologic service area. January 2011 was drier than normal in all locations in the area.
MONTH YEAR January 2011 February 15, 2011 X An X inside this box indicates that no flooding occurred within this hydrologic service area. January 2011 was drier than normal in all locations in the area.
Fort Lewis, Washington (47 05'N, 'W)
") Fort Lewis, Washington (47 05'N, 122 35'W) Full Year Climatology CONVENTIONS: The spelling of place names and geographical features are those used by the National Imagery and Mapping Agency (NIMA). All
Fort Lewis, Washington (47 05'N, 122 35'W) Full Year Climatology CONVENTIONS: The spelling of place names and geographical features are those used by the National Imagery and Mapping Agency (NIMA). All
Flood Risk Assessment
 Flood Risk Assessment February 14, 2008 Larry Schick Army Corps of Engineers Seattle District Meteorologist General Assessment As promised, La Nina caused an active winter with above to much above normal
Name Period 4 th Six Weeks Notes 2013 Weather
 Name Period 4 th Six Weeks Notes 2013 Weather Radiation Convection Currents Winds Jet Streams Energy from the Sun reaches Earth as electromagnetic waves This energy fuels all life on Earth including the
A summary of the weather year based on data from the Zumwalt weather station
 ZUMWALT PRAIRIE WEATHER 2016 A summary of the weather year based on data from the Zumwalt weather station Figure 1. An unusual summer storm on July 10, 2016 brought the second-largest precipitation day
Monthly Long Range Weather Commentary Issued: July 18, 2014 Steven A. Root, CCM, President/CEO
 Monthly Long Range Weather Commentary Issued: July 18, 2014 Steven A. Root, CCM, President/CEO sroot@weatherbank.com JUNE 2014 REVIEW Climate Highlights The Month in Review The average temperature for
Champaign-Urbana 2000 Annual Weather Summary
 Champaign-Urbana 2000 Annual Weather Summary ILLINOIS STATE WATER SURVEY 2204 Griffith Dr. Champaign, IL 61820 wxobsrvr@sws.uiuc.edu Maria Peters, Weather Observer January: January started on a mild note,
Air Masses, Fronts, Storm Systems, and the Jet Stream
 Air Masses, Fronts, Storm Systems, and the Jet Stream Air Masses When a large bubble of air remains over a specific area of Earth long enough to take on the temperature and humidity characteristics of
Final Report. COMET Partner's Project. University of Texas at San Antonio
 Final Report COMET Partner's Project University: Name of University Researcher Preparing Report: University of Texas at San Antonio Dr. Hongjie Xie National Weather Service Office: Name of National Weather
The Pennsylvania Observer
 The Pennsylvania Observer August 3, 2015 July 2015 - Pennsylvania Weather Recap By: Arthur Person Although this seventh month of 2015 was fairly normal across Pennsylvania as a whole, the details reveal
Storm and Storm Systems Related Vocabulary and Definitions. Magnitudes are measured differently for different hazard types:
 Storm and Storm Systems Related Vocabulary and Definitions Magnitude: this is an indication of the scale of an event, often synonymous with intensity or size. In natural systems, magnitude is also related
NIDIS Intermountain West Drought Early Warning System April 18, 2017
 1 of 11 4/18/2017 3:42 PM Precipitation NIDIS Intermountain West Drought Early Warning System April 18, 2017 The images above use daily precipitation statistics from NWS COOP, CoCoRaHS, and CoAgMet stations.
Weather Systems Study Guide:
 Weather Systems Study Guide: 1. Draw a diagram of Earth s water cycle and label each part. 2. Explain how the water cycle works. 3. What happens in the troposphere and stratosphere? Atmosphere Level What
MSG FOR NOWCASTING - EXPERIENCES OVER SOUTHERN AFRICA
 MSG FOR NOWCASTING - EXPERIENCES OVER SOUTHERN AFRICA Estelle de Coning and Marianne König South African Weather Service, Private Bag X097, Pretoria 0001, South Africa EUMETSAT, Am Kavalleriesand 31, D-64295
CHAPTER 11 THUNDERSTORMS AND TORNADOES MULTIPLE CHOICE QUESTIONS
 CHAPTER 11 THUNDERSTORMS AND TORNADOES MULTIPLE CHOICE QUESTIONS 1. A thunderstorm is considered to be a weather system. a. synoptic-scale b. micro-scale c. meso-scale 2. By convention, the mature stage
Chapter 12 Fronts & Air Masses
 Chapter overview: Anticyclones or highs Air Masses o Classification o Source regions o Air masses of North America Fronts o Stationary fronts o Cold fronts o Warm fronts o Fronts and the jet stream o Frontogenesis
Weather Related Factors of the Adelaide floods ; 7 th to 8 th November 2005
 Weather Related Factors of the Adelaide floods ; th to th November 2005 Extended Abstract Andrew Watson Regional Director Bureau of Meteorology, South Australian Region 1. Antecedent Weather 1.1 Rainfall
Minnesota s Climatic Conditions, Outlook, and Impacts on Agriculture. Today. 1. The weather and climate of 2017 to date
 Minnesota s Climatic Conditions, Outlook, and Impacts on Agriculture Kenny Blumenfeld, State Climatology Office Crop Insurance Conference, Sep 13, 2017 Today 1. The weather and climate of 2017 to date
25.1 Air Masses. Section 25.1 Objectives
 Section 25.1 Objectives Explain how an air mass forms. List the four main types of air masses. Describe how air masses affect the weather of North America. Air Masses 25.1 Air Masses Differences in air
Here s what a weak El Nino usually brings to the nation with temperatures:
 Time again for my annual Winter Weather Outlook. Here's just a small part of the items I considered this year and how I think they will play out with our winter of 2018-2019. El Nino / La Nina: When looking
1. Which weather map symbol is associated with extremely low air pressure? A) B) C) D) 2. The diagram below represents a weather instrument.
 B) C) D) 2. The diagram below represents a weather instrument.") 1. Which weather map symbol is associated with extremely low air pressure? 2. The diagram below represents a weather instrument. Which weather variable was this instrument designed to measure? A) air pressure
1. Which weather map symbol is associated with extremely low air pressure? 2. The diagram below represents a weather instrument. Which weather variable was this instrument designed to measure? A) air pressure
Weather Report 04 April 2018
 Weather Report 04 April 2018 South Africa - Weather Alternating periods of rain and sunshine will evolve across South Africa during the coming week. Moisture totals through next Tuesday morning will range
ATS 351, Spring 2010 Lab #11 Severe Weather 54 points
 ATS 351, Spring 2010 Lab #11 Severe Weather 54 points Question 1 (10 points): Thunderstorm development a) Sketch and describe the stages of development of a single cell thunderstorm. About how long does
Arizona Climate Summary
 Arizona Climate Summary April 2014 Summary of conditions for March 2014 March 2014 Temperature and Precipitation Summary March 1 st 16 th : We started off the month of March with a significant precipitation
WeatherManager Weekly
 Issue 288 July 14, 2016 WeatherManager Weekly Industries We Serve Agriculture Energy/Utilities Construction Transportation Retail Our Weather Protection Products Standard Temperature Products Lowest Daily
Monthly Long Range Weather Commentary Issued: NOVEMBER 16, 2015 Steven A. Root, CCM, Chief Analytics Officer, Sr. VP, sales
 Monthly Long Range Weather Commentary Issued: NOVEMBER 16, 2015 Steven A. Root, CCM, Chief Analytics Officer, Sr. VP, sales sroot@weatherbank.com OCTOBER 2015 Climate Highlights The Month in Review The
NIDIS Weekly Climate, Water and Drought Assessment Summary. Upper Colorado River Basin
 NIDIS Weekly Climate, Water and Drought Assessment Summary Upper Colorado River Basin August 3, 2010 Precipitation and Snowpack Fig. 1: July precipitation in inches Fig. 2: July precip as percent of average
Unit: Weather Study Guide
 Name: Period: Unit: Weather Study Guide Define each vocabulary word on a separate piece of paper or index card. Weather Climate Temperature Wind chill Heat index Sky conditions UV index Visibility Wind
An Introduction to Weather Modification in West Texas
 An Introduction to Weather Modification in West Texas JONATHAN A. JENNINGS West Texas Weather Modification Association, San Angelo, TX Sonora Water Conference, 18 April 2013 Sonora, Texas What to expect:
Anthony A. Rockwood Robert A. Maddox
 Anthony A. Rockwood Robert A. Maddox An unusually intense MCS produced large hail and wind damage in northeast Kansas and northern Missouri during the predawn hours of June 7 th, 1982. Takes a look at
The hydrologic service area (HSA) for this office covers Central Kentucky and South Central Indiana.
 for this office covers Central Kentucky and South Central Indiana.") NWS Form E-5 (04-2006) NATIONAL OCEANIC AND ATMOSPHERIC ADMINISTRATION (PRES. BY NWS Instruction 10-924) NATIONAL WEATHER SERVICE MONTHLY REPORT OF HYDROLOGIC CONDITIONS HYDROLOGIC SERVICE AREA (HSA) Louisville
NWS Form E-5 (04-2006) NATIONAL OCEANIC AND ATMOSPHERIC ADMINISTRATION (PRES. BY NWS Instruction 10-924) NATIONAL WEATHER SERVICE MONTHLY REPORT OF HYDROLOGIC CONDITIONS HYDROLOGIC SERVICE AREA (HSA) Louisville
Weather and Climate Summary and Forecast April 2018 Report
 Weather and Climate Summary and Forecast April 2018 Report Gregory V. Jones Linfield College April 4, 2018 Summary: A near Miracle March played out bringing cooler and wetter conditions to the majority
November 28, 2017 Day 1
 November 28, 2017 Day 1 Air Masses & Fronts Teachers- please out the sheet (right) for the students to fill in as we go! Review: Clouds & Precipitation? What are the 4 different clouds? Status, Cumulus,
North Carolina Full Year Climatology
 North Carolina Full Year Climatology CONVENTIONS: The spelling of place names and geographical features are those used by the National Imagery and Mapping Agency (NIMA). All distances are in nautical miles
Arizona Climate Summary October 2015 Summary of conditions for September 2015
 September 2015 Temperature and Precipitation Summary Arizona Climate Summary October 2015 Summary of conditions for September 2015 September 1 st 18 th : September began with high pressure over southern
LOCAL CLIMATOLOGICAL DATA FOR FREEPORT ILLINOIS
 Climatological Summary: LOCAL CLIMATOLOGICAL DATA FOR FREEPORT ILLINOIS 1905-1990 Freeport (Stephenson County) has a temperate continental climate, dominated by maritime tropical air from the Gulf of Mexico
Page 1. Name:
 Name: 1) As the difference between the dewpoint temperature and the air temperature decreases, the probability of precipitation increases remains the same decreases 2) Which statement best explains why
Local Ctimatotogical Data Summary White Hall, Illinois
 SWS Miscellaneous Publication 98-5 STATE OF ILLINOIS DEPARTMENT OF ENERGY AND NATURAL RESOURCES Local Ctimatotogical Data Summary White Hall, Illinois 1901-1990 by Audrey A. Bryan and Wayne Armstrong Illinois
Arizona Climate Summary November 2016 Summary of conditions for October 2016
 Arizona Climate Summary November 2016 Summary of conditions for October 2016 October 2016 Temperature and Precipitation Summary October 1 st 16 th : October began with high pressure over Mexico, bringing
Illinois Drought Update, December 1, 2005 DROUGHT RESPONSE TASK FORCE Illinois State Water Survey, Department of Natural Resources
 Illinois Drought Update, December 1, 2005 DROUGHT RESPONSE TASK FORCE Illinois State Water Survey, Department of Natural Resources For more drought information please go to http://www.sws.uiuc.edu/. SUMMARY.
A) B) C) D) 2) The diagrams below show the phases of the Moon as viewed by an observer in New York State at different times in August.
 B) C) D) 2) The diagrams below show the phases of the Moon as viewed by an observer in New York State at different times in August.") Name: 1) Which weather station model indicates the highest relative humidity? 8605-1 - Page 1 A) B) C) D) 2) The diagrams below show the phases of the Moon as viewed by an observer in New York State at
Name: 1) Which weather station model indicates the highest relative humidity? 8605-1 - Page 1 A) B) C) D) 2) The diagrams below show the phases of the Moon as viewed by an observer in New York State at
Arizona Climate Summary
 Arizona Climate Summary June 2012 Summary of conditions for May 2012 May 2012 Temperature and Precipitation Summary May 1 st 16 th : May began with a surface cold front sweeping across the western states