1. Which weather map symbol is associated with extremely low air pressure? A) B) C) D) 2. The diagram below represents a weather instrument.
|
|
|
- John Marshall
- 6 years ago
- Views:
Transcription

 air pressure B) dewpoint C) relative humidity D) amount of")
1 1. Which weather map symbol is associated with extremely low air pressure? 2. The diagram below represents a weather instrument. Which weather variable was this instrument designed to measure? A) air pressure B) dewpoint C) relative humidity D) amount of precipitation

2 Base your answers to questions 3 through 5 on the weather map below and on your knowledge of Earth Science. The map shows a low-pressure system with two fronts extending from its center (L). Points A, B, C, and D represents locations on Earth's surface. Two different air masses are labeled. 3. Which locations are most likely experiencing precipitation? A) A and B B) B and C C) C and D D) D and B 4. Which cross section best represents the frontal boundary (fb) and general pattern of air movements between locations C and D? 5. Which atmospheric conditions describe the air mass that is influencing weather conditions at location C? A) cool and dry B) cool and moist C) warm and dry D) warm and moist 6. A large rainstorm follows the usual direction of movement of a weather system across the United States. Which part of New York State will receive rain from the storm first? A) northwestern B) northeastern C) southwestern D) southeastern


3 7. The weather map below shows a portion of a low-pressure system. Which front will most likely pass over location A during the next two hours'? A) warm B) stationary C) occluded D) cold 8. The cross section of the atmosphere below represents the air motion near two frontal boundaries along reference line XY on Earth's surface. Which weather map correctly identifies these fronts and indicates the direction that these fronts are moving?
4 9. Base your answer to the following question on the graph below, which shows air temperature, dewpoint, and present weather conditions for a 23-hour period at Dallas, Texas. The thunderstorm that occurred between 11 p.m. and 12 midnight was most likely the result of A) the arrival of a warm front B) the arrival of a cold front C) an increase in the difference between air temperature and dewpoint D) an increase in both air temperature and dewpoint 10. Weather along most fronts is usually cloudy with precipitation because the warm air along most fronts is usually A) sinking and cooling, causing water to evaporate B) sinking and warming, causing water to evaporate C) rising and cooling, causing water vapor to condense D) rising and warming, causing water vapor to condense
5 Base your answers to questions 11 through 14 on the weather map below. The map shows a low-pressure system and some atmospheric conditions at weather stations A, B, and C. 11. Which cross section best represents the air masses, air movement, clouds, and precipitation occurring behind and ahead of the warm front located between stations A and B? 12. Which type of weather is usually associated with a cp air mass, as shown near weather station C? A) moist and cool B) moist and warm C) dry and cool D) dry and warm
6 13. The arrows on which map best represent the direction of surface winds associated with this low-pressure system? 14. If this weather system follows a normal storm track, the low-pressure center (L) will generally move toward the A) northeast B) northwest C) southeast D) southwest
7 15. Base your answer to the following question on the weather map below. Points A, B, C, and D are locations on Earth's surface. 19. In winter, a cold, dry air mass from Canada moves across Lake Ontario. The air over the lake is warmer and more humid than the air over the land. Which weather condition is most likely to occur as the air mass reaches Oswego? A) lake-effect snowstorm B) tornado C) warm, sunny weather D) hurricane Which type of front extends southward from the center of the low? A) occluded B) warm C) stationary D) cold 16. An airmass originating over north central Canada would most likely be A) warm and dry B) warm and moist C) cold and dry D) cold and moist 17. An air mass originating over the North Pacific Ocean would most likely be A) continental polar B) continental tropical C) maritime polar D) maritime tropical 18. Tornadoes occur when a very cold, dry air mass meets a very warm, wet air mass. Which two air masses would most likely form a tornado when they meet? A) cp and ca B) ct and mp C) cp and mt D) mp and mt
 0 and 30 N B) 0 and 60 S C) 30 N and 30 S D) 60 N and 60 S 22.")
8 20. Which map shows normal paths followed by low-pressure storm centers as they pass across the United States? 21. Dry areas caused by sinking air and diverging surface winds are located at which two latitudes? A) 0 and 30 N B) 0 and 60 S C) 30 N and 30 S D) 60 N and 60 S 22. In which map does the arrow show the general direction that most low-pressure storm systems move across New York State?
9 Base your answers to questions 23 through 25 on the weather map below and on your knowledge of Earth science. The weather map shows a typical low-pressure system and associated weather fronts labeled A and B. The L indicates the center of the low-pressure system. A few New York State cities are shown. Symbols cp and mt represent different air masses. The wind direction at Utica and Rochester is shown on the station models.
10 23. Which map shows the regions that are most likely experiencing the precipitation associated with this weather system? 24. Which front symbols are drawn correctly, based on the air masses shown? 25. If this weather system is following a normal storm track, the center of this low is most likely moving toward which city? A) Buffalo B) Ithaca C) Utica D) Plattsburgh
11 Base your answers to questions 26 through 28 on the weather map below, which shows a high-pressure center (H) and a low-pressure center (L), with two fronts extending from the low-pressure center. Points X and Y are locations on the map connected by a reference line. 26. Which type of front is located between Buffalo and Detroit? A) stationary B) warm C) occluded D) cold 27. Which cross section best represents the fronts and air movements in the lower atmosphere along line XY?


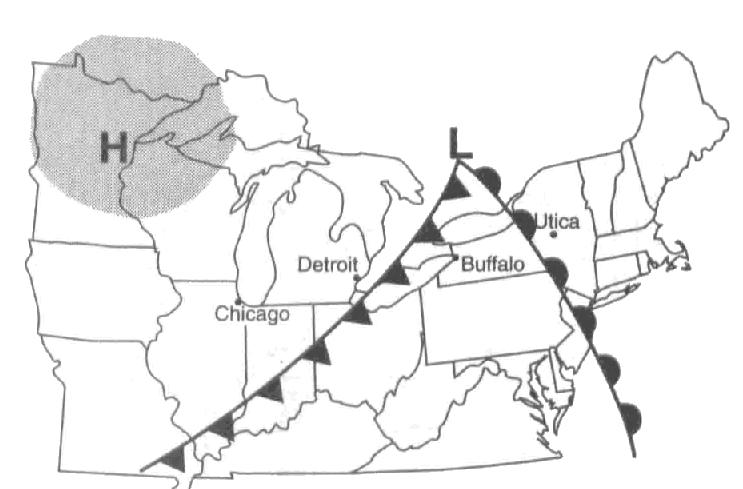
12 28. Which map best shows the most probable areas of precipitation associated with these weather systems?

13 29. In the cartoon below, the large arrows represent surface winds. What feature is found at the location to which the meteorologist is pointing? A) an anticyclone B) an area of divergence C) a low-pressure center D) a high-pressure center

14 30. A cross section of a weather front is shown below. Which symbol would be used to represent this front on a weather map? 31. Which weather map symbol represents air masses that normally form just south of the United States over the Caribbean Sea? A) cp B) ct C) mp D) mt


15 32. On which weather map do the front symbols best represent the direction of movement of the cold front and warm front associated with the low-pressure system shown on the map? 33. An air mass classified as mp usually forms over which type of Earth surface? A) warm land B) warm ocean C) cool land D) cool ocean

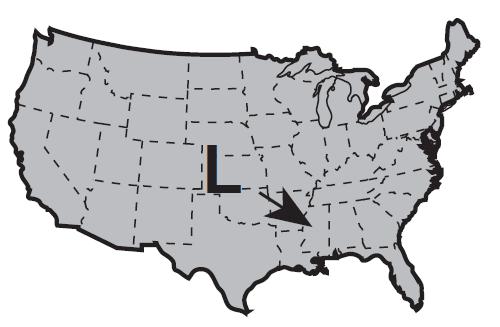
16 34. The map below shows a low-pressure system located over an area in the south-central United States. Base your answers to questions 37 through 39 on the weather map of North America below. The map shows the location of a front and the air mass influencing its movement. In the next few days, because of the prevailing winds, the air mass will probably move toward the A) southeast B) northeast C) southwest D) northwest 35. The weather map below shows a frontal system that has followed a typical storm track. The air mass located over point X most likely originated over the A) northern Atlantic Ocean B) central part of Canada C) Gulf of Mexico D) Pacific Northwest 36. The properties of an airmass depend mainly on the A) wind speed within the airmass B) characteristics of the surface over which the airmass was formed C) size of the airmass D) rotation of the Earth 37. The cp air mass is identified on the basis of its temperature and A) wind direction B) cloud cover C) moisture content D) windspeed 38. Which type of front and frontal movement is shown on the weather map? A) cold front moving northwestward B) cold front moving southeastward C) warm front moving northwestward D) warm front moving southeastward 39. Which region is the probable source of the air mass labeled cp on the map? A) central Canada B) southwestern United States C) North Atlantic Ocean D) Gulf of Mexico
 The cp air mass is warmer and less humid. B) The cp air mass is colder and more humid.")
17 40. Base your answer to the following question on the map below, which shows the position of the jet stream relative to two air masses and a low-pressure center (L) over the United States. What is the difference in the air temperature and humidity between the cp and mt air masses? A) The cp air mass is warmer and less humid. B) The cp air mass is colder and more humid. C) The mt air mass is warmer and more humid. D) The mt air mass is colder and less humid. 41. Which area is the most common source region for cold, dry air masses that move over New York State? A) North Atlantic Ocean B) Gulf of Mexico C) central Canada D) central Mexico 42. The weather map below shows two air pressure systems covering a large geographic area. Points A through D identify four locations on the map. At which location is precipitation most likely occurring? A) A B) B C) C D) D
 15 B) 25 C) 35 D) 45 44.")
18 43. The map below shows the average number of thunderstorms each year in the continental United States. The average number of thunderstorms that occur each year in Albany, New York is approximately A) 15 B) 25 C) 35 D) The map of North America below shows the source region of an air mass forming mostly over Mexico. This air mass originating over Mexico is classified as A) continental polar B) continental tropical C) maritime polar D) maritime tropical
19 Base your answers to questions 45 through 49 on the weather map and barogram below. The weather map shows a hurricane that was located over southern Florida. The isobars show air pressure in inches of mercury. Letter A represents a point near the west coast of Florida. The barogram shows the recorded air pressure in inches of mercury as the hurricane passed near Miami, Florida. 45. Which type of air mass would most likely be the source of the moisture that causes the strong winds and heavy rain associated with this hurricane? A) cp B) ct C) mp D) mt 46. What is the latitude and longitude at the center of the hurricane? A) 26 N 81 W B) 26 N 89 W C) 34 N 81 W D) 34 N 89 W
 27.30 in B) 27.60 in C) 27.75 in D) 28.")

 cooler and contains less moisture B) cooler and contains more")
20 47. Which map shows the most likely track of this hurricane? 48. Which station model best represents the weather conditions at point A? 49. What was the lowest air pressure recorded on the barogram as the hurricane passed near Miami? A) in B) in C) in D) in 50. Which symbol would be used to identify an airmass originating in central Canada? A) mt B) mp C) ct D) cp 51. The winds shift from southwest to northwest as heavy rains and hail begin to fall in Albany, New York. These changes are most likely caused by the arrival of A) an mt air mass B) a ct air mass C) a cold front D) a warm front 52. Compared to a maritime tropical air mass, a continental polar air mass is A) cooler and contains less moisture B) cooler and contains more moisture C) warmer and contains less moisture D) warmer and contains more moisture
 and a low-pressure center (L), frontal boundaries, and present weather conditions. 53.")
21 Base your answers to questions 53 through 55 on the weather map below and on your knowledge of Earth science. The map of a portion of eastern North America shows a high-pressure center (H) and a low-pressure center (L), frontal boundaries, and present weather conditions. 53. The general surface wind circulation associated with the high-pressure center (H) is most likely A) clockwise and outward B) clockwise and inward C) counterclockwise and outward D) counterclockwise and inward 54. What was the most likely source region for the air mass over Pennsylvania? A) New York State B) Pacific Ocean C) Gulf of Mexico D) Canada 55. Which weather condition is shown along the cold front? A) fog B) snow C) haze D) thunderstorms


 The air near the center of this low-pressure")
 rise and form clouds D)")
22 56. Which map best shows the general surface wind pattern in a low-pressure system located over the eastern United States? A) 57. A map view of surface air movement in a low-pressure system is shown below. B) The air near the center of this low-pressure system usually will A) evaporate into a liquid B) reverse direction C) rise and form clouds D) squeeze together to form a high-pressure system C) D)
 Cold fronts move slower than warm fronts.")
23 58. The weather map below shows a portion of the United States. Line AB represents a frontal boundary between two air masses. The two large arrows indicate the direction that a cp air mass is moving. Which symbol correctly represents the frontal boundary at line AB? 59. Which statement best explains why precipitation occurs at frontal boundaries? A) Cold fronts move slower than warm fronts. B) Cold fronts move faster than warm fronts. C) Warm, moist air sinks when it meets cold, dry air. D) Warm, moist air rises when it meets cold, dry air.
24 60. Which map shows the two correctly labeled air masses that frequently converge in the central plains to cause tornadoes? 61. Air masses are identified on the basis of temperature and A) type of precipitation B) wind velocity C) moisture content D) atmospheric transparency 62. Compared to a maritime tropical air mass, a maritime polar air mass has a A) higher temperature and more water vapor B) higher temperature and less water vapor C) lower temperature and more water vapor D) lower temperature and less water vapor 63. The properties of an air mass are mostly determined by the A) rate of Earth s rotation B) direction of Earth s surface winds C) source region where the air mass formed D) path the air mass follows along a land surface

25 64. The map below shows surface air temperatures, in degrees Fahrenheit, reported by weather stations in the north-central United States. Letter X represents an air mass moving in the direction shown by the arrow. A line marks a frontal boundary advancing in a southeasterly direction. Which weather-map symbols best represent air-mass X and the frontal boundary shown on the map? 65. In the Northern Hemisphere, surface winds around the center of a hurricane move A) clockwise and inward B) clockwise and outward C) counterclockwise and inward D) counterclockwise and outward

26 Base your answers to questions 66 through 69 on the weather map below, which shows a weather system that is affecting part of the United States. 66. Which diagram shows the surface air movements most likely associated with the fronts? 67. Which map best shows the areas in which precipitation is most likely occurring? [Darkened areas represent precipitation.] 68. What is the total number of different kinds of weather fronts shown on this weather map? A) 1 B) 2 C) 3 D) Compared to the air over most of the map region, the air mass centered over Alabama is A) warmer and more humid B) warmer and drier C) colder and more humid D) colder and drier
27 70. The map below represents a section of a weather map for locations in the eastern United States. The map shows a low-pressure system, fronts, and weather stations A, B, C, and D. At which weather station are weather conditions probably most unstable? A) A B) B C) C D) D 71. What is the dewpoint when the dry-bulb temperature is 8 C and the wet-bulb temperature is 2 C? A) 28 C B) 6 C C) 3 C D) 9 C 72. Why do clouds usually form at the leading edge of a cold airmass? A) Cold air flows over warm air, causing the warm air to descend and cool. B) Cold air flows under warm air, causing the warm air to rise and cool. C) Cold air contains more dust than warm air does. D) Cold air contains more water vapor than warm air does. 73. Jet stream winds over the United States generally move from A) east to west B) west to east C) north to south D) south to north 74. Which geographic area is a common source region for cp air masses that move into New Jersey? A) southwestern United States B) central Canada C) the north Pacific Ocean D) the Gulf of Mexico 75. An air mass entering Alaska from the northern Pacific Ocean would most likely be labeled on a weather map as A) cp B) ct C) mp D) mt 76. An air mass classified as ct usually forms over which type of Earth surface? A) cool water B) cool land C) warm water D) warm land 77. If a low-pressure system follows a typical storm track across New York State, it will move toward the A) southeast B) southwest C) northeast D) northwest 78. An mp air mass is located over the northwestern part of the United States. The source region of this air mass is most likely A) central Mexico B) the Gulf of Mexico C) northern Canada D) the North Pacific Ocean 79. Which type of air mass is associated with warm, dry atmospheric conditions? A) cp B) ct C) mp D) mt 80. Which type of air mass would most likely have low humidity and high air temperature? A) ct B) cp C) mt D) mp


28 81. The map below shows a position of the polar jet stream over North America in January. Which map best shows the air-mass movements associated with this jet stream position?
 a cyclone B) a cold front C) a stationary front D) a high-pressure center 83. An air mass classified as mt usually forms over which type of Earth surface?")
29 82. The photograph below shows a spiral pattern of clouds in the Earth's atmosphere. The spiral is hundreds of miles across. Which type of weather does this photograph show? A) a cyclone B) a cold front C) a stationary front D) a high-pressure center 83. An air mass classified as mt usually forms over which type of Earth surface? A) cool land B) cool water C) warm land D) warm water 84. Most of the air in the lower troposphere at the equatorial low-pressure belt is A) warm, moist, and rising B) warm, dry, and rising C) cool, moist, and sinking D) cool, dry, and sinking


30 85. Base your answer to the following question on the weather map below, which shows a low-pressure system over the central United States. Isobars are labeled in millibars. Points A, B, C, and D represent locations on Earth's surface. Which map shows the most likely path this low-pressure center will follow during the next 12 hours? A)
31 B) C) D)
 warm front B) cold front C) occluded front D) stationery front 87.")
32 86. The cross section below shows a weather front. The large arrow shows the direction of the movement of the cool air mass. 89. The map below shows the boundary between two air masses. The arrows show the direction in which the boundary is moving. Which type of weather front is shown? A) warm front B) cold front C) occluded front D) stationery front 87. The weather characteristics of air mass result primarily from its A) geographic origin B) size and shape C) rate of movement D) direction of movement 88. The diagram below represents a cross section of air masses and frontal surfaces along line AB. The dashed lines represent precipitation. Which weather map uses the correct weather front symbol to illustrate this information? 90. In Connecticut, dry, cool air masses (cp) often interact with moist, warm air masses (mt). Which statement correctly matches each air mass with its usual geographic source region? A) cp is from the North Atlantic Ocean and mt is from the deserts of the southwestern United States. B) cp is from northern Canada and mt is from the deserts of the southwestern United States. C) cp is from northern Canada and mt is from the Gulf of Mexico. D) cp is from the North Atlantic Ocean and mt is from the Gulf of Mexico. Which weather map best represents this frontal system?


33 91. The graph below shows changes in the atmosphere occurring above typical air-mass source regions A, B, C, and D. Changes in air temperature and altitude are shown as the graphed lines. Changes in water-vapor content, in grams of vapor per kilogram of air, are shown as numbers on each graphed line. 94. An airmass originates with its center located at 25 N and 90 W. Which list best identifies each air-mass source region? A) A ct, B cp, C mp, D mt B) A cp, B mp, C mt, D ct C) A mp, B mt, C ct, D cp D) A mt, B ct, C cp, D mp 92. The diagram below represents a cross-sectional view of airmasses associated with a low-pressure system. The cold frontal interface is moving faster than the warm frontal interface. What usually happens to the warm air that is between the two frontal surfaces? A) The warm air is forced over both frontal interfaces. B) The warm air is forced under both frontal interfaces. C) The warm air is forced over the cold frontal interface but under the warm frontal interface. D) The warm air is forced under the cold frontal interface but over the warm frontal interface. 93. On a weather map, an airmass that is very warm and dry would be labeled A) mp B) mt C) cp D) ct Based on the map, this air mass would be classified as A) cp B) mp C) ct D) mt 95. Which type of air mass most likely has high humidity and high temperature? A) cp B) ct C) mt D) mp 96. Which air mass is associated with low relative humidity and high air temperature? A) maritime polar B) maritime tropical C) continental polar D) continental tropical 97. Locations A and B on the map of North America below are source regions for air masses. Compared to the air mass formed at location B, the air mass formed at location A will normally be A) cooler and drier B) cooler and wetter C) warmer and drier D) warmer and wetter 98. In which geographic region are air masses most often warm with a high moisture content? A) Central Canada B) Central Mexico C) Gulf of Mexico D) North Pacific Ocean


 cp B) ct C) mt D) mp 103.")
34 99. Which weather instrument is used to determine wind direction? 100. The diagram below shows a cross section of a cumulus cloud. Line AB indicates the base of the cloud. Which graph best represents the temperature measured along line AB? 101. An Earth science student observed the following weather conditions in Albany, New York, for 2 days: The first day was warm and humid with southerly winds. The second day, the temperature was 15 degrees cooler, the relative humidity had decreased, and wind direction was northwest. Which type of air mass most likely had moved into the area on the second day? A) continental tropical B) continental polar C) maritime tropical D) maritime polar 102. Which abbreviation indicates a warm air mass that contains large amounts of water vapor? A) cp B) ct C) mt D) mp 103. The map below represents a section of a surface weather map showing weather stations A through D. At which weather station are the most unstable weather conditions occurring? A) A B) B C) C D) D
35 104. Cities A, B, C, and D on the weather map below are being affected by a low-pressure system (cyclone) The diagram below represents a cross section of air masses and frontal surfaces along line AB. The dashed lines represent precipitation. Which weather map best represents this frontal system? A) Which city would have the most unstable atmospheric conditions and the greatest chance of precipitation? A) A B) B C) C D) D 105. Base your answer to the following question on the map below which represents a section of a surface weather map. Letters A through F represent weather stations. B) C) D) 107. An air mass that originates over the northern Pacific Ocean and moves southward over the United States would most likely be labeled on a weather map as A) mp B) mt C) cp D) ct The warm front is moving toward the A) northeast B) northwest C) southeast D) southwest
36 108. Base your answer to the following question on the weather map below, which shows the location of fronts and the temperature field on a given day in the United States. The passage of a cold front most recently influenced the weather of which two cities? A) Chicago and Boise B) Las Vegas and Salt Lake City C) Kansas City and Minneapolis D) Detroit and Cincinnati 109. A weather station model for a location in New 111. Which geographic region is the most common York State is shown below. source region for the mt air masses that move into New York State? The air mass over this location is best described as A) cold with low humidity and high air pressure B) cold with high humidity and low air pressure C) warm with high humidity and low air pressure D) warm with low humidity and high air pressure 110. Which type of air mass usually contains the most moisture? A) mt B) mp C) ct D) cp A) northern Canada B) Gulf of Mexico C) Arctic Ocean D) southwestern United States 112. As a cold front passes a New York weather station, which changes will usually be observed in barometric pressure and air temperature? A) Pressure rises and temperature falls. B) Both pressure and temperature rise. C) Both pressure and temperature fall. D) Pressure falls and temperature rises.

 cold, dry air mass B) warm, dry air mass C) low-pressure system D)")
37 113. The satellite photograph below shows a Northern Hemisphere cloud pattern Base your answer to the following question on the image below. Locations A and B on the map of North America below are source regions for air masses. The center of this cloud pattern is most likely the center of a A) cold, dry air mass B) warm, dry air mass C) low-pressure system D) high-pressure system Compared to the air mass formed at location B, the air mass formed at location A will normally be A) cooler and drier B) cooler and wetter C) warmer and drier D) warmer and wetter
SEVERE WEATHER AND FRONTS TAKE HOME QUIZ
 1. Most of the hurricanes that affect the east coast of the United States originally form over the A) warm waters of the Atlantic Ocean in summer B) warm land of the southeastern United States in summer
RR#4 - Multiple Choice
 1. The map below shows the amount of snowfall, in inches, produced by a lake-effect snowstorm in central New York State. The wind that produced this snowfall pattern most likely came from the 1) northeast
ALL PRESSURE VARIABLES AND STATION MODELS MEGA PACKET
 NAME: MEGA PACKET 1. A change in the type and location of large high-pressure systems (H) and large low-pressure systems ( L) over Asia creates shifts in prevailing winds that cause a rainy summer season
Page 1. Name:
 Name: 1) As the difference between the dewpoint temperature and the air temperature decreases, the probability of precipitation increases remains the same decreases 2) Which statement best explains why
Weather and Energy Review
 Weather and Energy Review Name 1. Base your answer to the following question on the diagram below, which represents the greenhouse effect in which heat energy is trapped in Earth's atmosphere Which type
Weather Unit Part 2: Meteorology
 Name: Earth Science Date: Period: Weather Unit Part 2: Meteorology 1 The map below shows North America and its surrounding bodies of water. Country borders are shown. On the map, label the following locations:
Name: Regents Earth Science. Weather and Climate - Review Questions
 Name: Regents Earth Science Weather and Climate - Review Questions Date: Thayer - 279 1. People sometimes release substances into the atmosphere to increase the probability of rain by A) raising the air
3. As warm, moist air moves into a region, barometric pressure readings in the region will generally 1. decrease 2. increase 3.
 Teacher: Mr. Prizzi Castle Learning Review 1 1. Which process most directly results in cloud formation? 1. condensation 3. precipitation 2. transpiration 4. radiation 2. An air mass originating over north
L.O Students will learn about factors that influences the environment
 Name L.O Students will learn about factors that influences the environment Date 1. At the present time, glaciers occur mostly in areas of A) high latitude or high altitude B) low latitude or low altitude
Weather and Climate A B1
 Weather and Climate A B1 1. What causes the Coriolis effect? (1) Earth s tilt on its axis (2) the spin of Earth on its axis (3) the orbital motion of the Moon around Earth (4) the orbital motion of Earth
Forecasting Weather: Air Masses and Fronts
 Forecasting Weather: Air Masses and Fronts Weather is a combination of local conditions at any one time. It's what's happening outside right now, right here. Weather includes: Temperature Humidity Air
Weather Practice Test
 Name: Weather Practice Test 1. The diagram below shows weather instruments A and B. Which table correctly indicates the name of the weather instrument and the weather variable that it measures? A) B) C)
Pressure System Circulation
 NAME 1. Base your answer to the following question on the surface weather map shown below. The map shows weather systems over the United States and weather station data for cities A, B, C, and D. Note
4. Which map best represents the type of fronts and direction of movement of these fronts in relation to the low-pressure center?
 1. Adjacent water and landmasses are heated by the morning Sun on a clear, calm day. After a few hours, a surface wind develops. Which map best represents this wind's direction? 2. An air pressure of 29.47
Air Masses, Fronts, Storm Systems, and the Jet Stream
 Air Masses, Fronts, Storm Systems, and the Jet Stream Air Masses When a large bubble of air remains over a specific area of Earth long enough to take on the temperature and humidity characteristics of
Air Masses of North America cp and ca air masses Air mass characterized by very cold and dry conditions
 Chapter 8: Air Masses, Fronts, and Middle-Latitude Cyclones Air masses Fronts Middle-latitude cyclones Air Masses Air mass an extremely large body of air whose properties of temperature and humidity are
NAME: Log onto YouTube and search for jocrisci channel.
 NAME: Log onto YouTube and search for jocrisci channel. REFERENCE TABLES (Videos 8.1 & 8.2 ESRT 12, 13a, 14b) 1. Use the temperature scales on page 13. (notes-air temperature conversions) a. 80 C to F
3. The map below shows an eastern portion of North America. Points A and B represent locations on the eastern shoreline.
 1. Most tornadoes in the Northern Hemisphere are best described as violently rotating columns of air surrounded by A) clockwise surface winds moving toward the columns B) clockwise surface winds moving
Weather Practice. 4. As wind velocity decreases, the distance between isobars on a weather map will A) decrease B) increase C) remain the same
 decrease B) increase C) remain the same") 1. The chart below shows the air temperature and the dewpoint temperature near the ground at a given location for four consecutive days. All temperatures were recorded at noon. Which statement is best
1. The chart below shows the air temperature and the dewpoint temperature near the ground at a given location for four consecutive days. All temperatures were recorded at noon. Which statement is best
Mid-latitude Cyclones & Air Masses
 Lab 9 Mid-latitude Cyclones & Air Masses This lab will introduce students to the patterns of surface winds around the center of a midlatitude cyclone of low pressure. The types of weather associated with
Page 1. Name: 4) State the actual air pressure, in millibars, shown at Miami, Florida on the given weather map.
 State the actual air pressure, in millibars, shown at Miami, Florida on the given weather map.") Name: Questions 1 and 2 refer to the following: A partial station model and meteorological conditions table, as reported by the weather bureau in the city of Oswego, New York, are shown below. 1) Using
Name: Questions 1 and 2 refer to the following: A partial station model and meteorological conditions table, as reported by the weather bureau in the city of Oswego, New York, are shown below. 1) Using
Key. Name: OBJECTIVES
 Name: Key OBJECTIVES Correctly define: air mass, air pressure, anemometer, barometer, cyclone, dew point, front, isobar, isotherm, meteorology, precipitation, psychrometer, relative humidity, saturated,
Guided Notes Weather. Part 1: Weather Factors Temperature Humidity Air Pressure Winds Station Models
 Guided Notes Weather Part 1: Weather Factors Temperature Humidity Air Pressure Winds Station Models. 1. What is weather? Weather: short-term atmospheric conditions in a specific area at a specific time
Weather, Air Masses, Fronts and Global Wind Patterns. Meteorology
 Weather, Air Masses, Fronts and Global Wind Patterns Meteorology Weather is what conditions of the atmosphere are over a short period of time. Climate is how the atmosphere "behaves" over long periods
True or false: The atmosphere is always in hydrostatic balance. A. True B. False
 Clicker Questions and Clicker Quizzes Clicker Questions Chapter 7 Of the four forces that affect the motion of air in our atmosphere, which is to thank for opposing the vertical pressure gradient force
Page 1. Name: 1) The graph below shows air temperature for an area near the Earth's surface during a 12-hour period.
 The graph below shows air temperature for an area near the Earth's surface during a 12-hour period.") Name: 1) The graph below shows air temperature for an area near the Earth's surface during a 12-hour period. Which graph best illustrates the probable change in air pressure during the same time period?
Name: 1) The graph below shows air temperature for an area near the Earth's surface during a 12-hour period. Which graph best illustrates the probable change in air pressure during the same time period?
Weather and Climate Review
 Weather and Climate Review STUFF YOU NEED TO KNOW and to UNDERSTAND! 1) Because water has a higher specific heat than land, water will warm and cool more slowly than the land will. Because of this: a)
Chapter22 Weather Maps
 Name Teacher Period Date hapter22 Weather Maps hapter 22 Skill Sheet 1: Fronts Air masses are bodies of air that are relatively uniform in temperature and humidity. These bodies of air take on the characteristic
Weather & Atmospheric Variables Review
 Weather & Atmospheric Variables Review Words that are bold, italicized and/or underlined are vocabulary you must KNOW! A) Atmospheric variables: a) Temperature as it relates to: 1) duration of insolation...longer
A) B) C) D) 2) The diagrams below show the phases of the Moon as viewed by an observer in New York State at different times in August.
 B) C) D) 2) The diagrams below show the phases of the Moon as viewed by an observer in New York State at different times in August.") Name: 1) Which weather station model indicates the highest relative humidity? 8605-1 - Page 1 A) B) C) D) 2) The diagrams below show the phases of the Moon as viewed by an observer in New York State at
Name: 1) Which weather station model indicates the highest relative humidity? 8605-1 - Page 1 A) B) C) D) 2) The diagrams below show the phases of the Moon as viewed by an observer in New York State at
A. Weather - the conditions of the variables of the atmosphere for any short period of time
 WEATHER & THE ATMOSPHERE A. Weather - the conditions of the variables of the atmosphere for any short period of time Meteorology - the study of weather and weather related variables - the variables: Topic
also known as barometric pressure; weight of the air above the surface of the earth; measured by a barometer air pressure, high
 Weather Vocabulary Vocabulary Term Meaning/Definition air mass * large bodies of air that have the similar properties throughout such as temperature, humidity, and air pressure; causes most of the weather
What a Hurricane Needs to Develop
 Weather Weather is the current atmospheric conditions, such as air temperature, wind speed, wind direction, cloud cover, precipitation, relative humidity, air pressure, etc. 8.10B: global patterns of atmospheric
Lecture #14 March 29, 2010, Monday. Air Masses & Fronts
 Lecture #14 March 29, 2010, Monday Air Masses & Fronts General definitions air masses source regions fronts Air masses formation types Fronts formation types Air Masses General Definitions a large body
b. The boundary between two different air masses is called a.
 NAME Earth Science Weather WebQuest Part 1. Air Masses 1. Find out what an air mass is. http://okfirst.mesonet.org/train/meteorology/airmasses.html a. What is an air mass? An air mass is b. The boundary
Ch 7 Weather Practice Questions
 Practice Questions 1. Base your answer to the following question on the cross section below, which shows two weather fronts moving across New York State. Lines X and Y represent frontal boundaries. The
air masses and Fronts 2013.notebook January 29, 2013
 1/4/12 Notes 1 Weather Data Log.docx 2 Air Masses Uniform bodies of air An air mass is a large body of air that has similar temperature and moisture throughout. How to name an air mass: first write the
Weather Final Review Page 1
 Weather Final Review Name 1. Which change would cause a decrease in the amount of insolation absorbed at Earths surface? A) a decrease in cloud cover B) a decrease in atmospheric transparency C) an increase
Foundations of Earth Science, 6e Lutgens, Tarbuck, & Tasa
 Foundations of Earth Science, 6e Lutgens, Tarbuck, & Tasa Weather Patterns and Severe Weather Foundations, 6e - Chapter 14 Stan Hatfield Southwestern Illinois College Air masses Characteristics Large body
Guided Notes Weather. Part 2: Meteorology Air Masses Fronts Weather Maps Storms Storm Preparation
 Guided Notes Weather Part 2: Meteorology Air Masses Fronts Weather Maps Storms Storm Preparation The map below shows North America and its surrounding bodies of water. Country borders are shown. On the
Chapter 12 Fronts & Air Masses
 Chapter overview: Anticyclones or highs Air Masses o Classification o Source regions o Air masses of North America Fronts o Stationary fronts o Cold fronts o Warm fronts o Fronts and the jet stream o Frontogenesis
25.1 Air Masses. Section 25.1 Objectives
 Section 25.1 Objectives Explain how an air mass forms. List the four main types of air masses. Describe how air masses affect the weather of North America. Air Masses 25.1 Air Masses Differences in air
Go With the Flow From High to Low Investigating Isobars
 Go With the Flow From High to Low Investigating Isobars Science 10 Mrs. Purba Air Masses The air over a warm surface can be heated, causing it to rise above more dense air. The result is the formation
Weather Packet 10. Your Name Group Members. Score. Minutes
 Weather Packet 10 Your Name Group Members Score Minutes Standard 4 Key idea 2 Performance Indicator: 2.1 Use the concepts of density and heat energy to explain observations of weather patterns, seasonal
Fig Major air masses of the world
 Fig. 9.3 Major air masses of the world CLASSIFICATION FOUR BASIC CATEGORIES OF AIR MASSES: POLAR - P ARCTIC - A TROPICAL - T EQUATORIAL - E TWO DESIGNATIONS OF SURFACE IN SOURCE REGION MARITIME - m. CONTINENTAL
- air masses. Further Reading: Chapter 08 of the text book. Outline. - air masses of the world and of N. America. - fronts: warm, cold and occluded
 (1 of 10) Further Reading: Chapter 08 of the text book Outline - air masses - air masses of the world and of N. America - fronts: warm, cold and occluded (2 of 10) Previously, Introduction We discussed
WATER IN THE ATMOSPHERE
 WATER IN THE ATMOSPHERE I. Humidity A. Defined as water vapor or moisture in the air (from evaporation and condensation). B. The atmosphere gains moisture from the evaporation of water from oceans, lakes,
5. Which type of front is represented by letter X?
 Name Weather Regents Review ased your answers to questions 1 through 4 on the four weather station models,,,, and D, below. D 82 012 56 999 78 978 32 002 62 75 24 1. List the letters of the four station
12/22/2018. Water and the Atmosphere. 8 th Grade. Lesson 1 (Water in the Atmosphere) Chapter 4: Weather. Lesson 2 (Clouds) Clouds
 Chapter 4: Weather. Lesson 2 (Clouds) Clouds") Lesson 1 (Water in the Atmosphere) Water cycle the continual movement of water among Earth s atmosphere, oceans, and land surface through evaporation, condensation, and precipitation Water and the Atmosphere
Lesson 1 (Water in the Atmosphere) Water cycle the continual movement of water among Earth s atmosphere, oceans, and land surface through evaporation, condensation, and precipitation Water and the Atmosphere
ATSC 2000 Final Fall 2005
 ATSC 2000 Final Fall 2005 true/false /25 multiple choice /25 short answer /23 essay /10 total /83 or % True/False Indicate whether the sentence or statement is true or false. (25 questions 1% each) 1.
November 28, 2017 Day 1
 November 28, 2017 Day 1 Air Masses & Fronts Teachers- please out the sheet (right) for the students to fill in as we go! Review: Clouds & Precipitation? What are the 4 different clouds? Status, Cumulus,
Global Wind Patterns
 Name: Earth Science: Date: Period: Global Wind Patterns 1. Which factor causes global wind patterns? a. changes in the distance between Earth and the Moon b. unequal heating of Earth s surface by the Sun
Name: C) wind speed D) visibility 3) The diagram below represents a weather instrument.
 wind speed D) visibility 3) The diagram below represents a weather instrument.") Name: 1) An increase in the transparency of Earth's atmosphere is often caused by A) a decrease in solar radiation B) an increase in airborne dust particles C) an increase in the duration of insolation
Name: 1) An increase in the transparency of Earth's atmosphere is often caused by A) a decrease in solar radiation B) an increase in airborne dust particles C) an increase in the duration of insolation
Global Winds AOSC 200 Tim Canty
 Global Winds AOSC 200 Tim Canty Class Web Site: http://www.atmos.umd.edu/~tcanty/aosc200 Topics for today: Air Masses Fronts Lecture 18 Oct 31 2017 1 Air Masses What is an air mass? Large body of air whose
AIR MASSES SOURCE REGION CHARACTERISTICS Continental Arctic (ca) Greenland, Antarctica, Highest latitudes of Asia and North America
 Greenland, Antarctica, Highest latitudes of Asia and North America") GEOGRAPHY CLIMATOLOGY AIRMASS, FRONT AND TEMPERATE CYCLONE AIRMASS A large body of air having little horizontal variation in temperature and moisture is called an airmass. Airmass acquires its properties
GEOGRAPHY CLIMATOLOGY AIRMASS, FRONT AND TEMPERATE CYCLONE AIRMASS A large body of air having little horizontal variation in temperature and moisture is called an airmass. Airmass acquires its properties
1. Base your answer to the following question on the weather map below, which shows a weather system that is affecting part of the United States.
 1. Base your answer to the following question on the weather map below, which shows a weather system that is affecting part of the United States. Which sequence of events forms the clouds associated with
Ch. 3: Weather Patterns. Sect. 1: Air Mass & Fronts Sect. 2: Storms Sect. 3: Predicting the Weather
 Ch. 3: Weather Patterns Sect. 1: Air Mass & Fronts Sect. 2: Storms Sect. 3: Predicting the Weather Sect. 1: Air Masses & Fronts An air mass is a huge body of air that has similar temperature, humidity,
Mr. Lanik Practice Test Name:
 Mr. Lanik Practice Test Name: 1. New York State s Catskills are classified as which type of landscape region? mountain plateau Adirondacks Catskills lowland plain 2. In which New York State landscape region
Deliverable 4-2: Assessment items. Activity-oriented Quiz for Weather or Not? Investigation in Exploring the Environment
 Deliverable 4-2: Assessment items Activity-oriented Quiz for Weather or Not? Investigation in Exploring the Environment In Weather or Not? you predicted the weather using satellite images and other kinds
Use the terms from the following list to complete the sentences below. Each term may be used only once.
 Skills Worksheet Directed Reading Section: Air Masses Use the terms from the following list to complete the sentences below. Each term may be used only once. high pressure poles low pressure equator wind
Weather Notes. Chapter 16, 17, & 18
 Weather Notes Chapter 16, 17, & 18 Weather Weather is the condition of the Earth s atmosphere at a particular place and time Weather It is the movement of energy through the atmosphere Energy comes from
AIR MASSES. Large bodies of air. SOURCE REGIONS areas where air masses originate
 Large bodies of air AIR MASSES SOURCE REGIONS areas where air masses originate Uniform in composition Light surface winds Dominated by high surface pressure The longer the air mass remains over a region,
Global Weather Trade Winds etc.notebook February 17, 2017
 Global Weather 1 north pole northern hemisphere equator southern hemisphere south pole 2 We have seasons because of the Earth's tilt The seasons are opposite in the northern and southern hemispheres winter
Fronts. Direction of Front
 Fronts Direction of Front Direction of Front Warm Front A cold air mass meets and displaces a warm air mass. Because the moving cold air is more dense, it moves under the less-dense warm air, pushing it
Unit 5 Part 2 Test PPT
 Unit 5 Part 2 Test PPT Standard 1: Air Masses Air Mass An air mass is an immense body of air that is characterized by similar temperatures and amounts of moisture at any given altitude When an air mass
Earth Science Chapter 16 and 17. Weather and Climate
 Earth Science Chapter 16 and 17 Weather and Climate Prediction Old way Groundhog Color of the sky Modern way satellites instruments computers Goal Weather Factors Studied by meteorologists Several factors
Figure 1. Idealized global atmospheric circulation (C= surface convergence, D= surface divergence).
.") page - 1 Laboratory Exercise #8 - Introduction to Atmospheric Science: Global Circulation and Weather Makers Section A - Global Atmospheric Circulation: To understand weather you need to understand how
page - 1 Laboratory Exercise #8 - Introduction to Atmospheric Science: Global Circulation and Weather Makers Section A - Global Atmospheric Circulation: To understand weather you need to understand how
Unit 8: Meteorology. How is Earth s weather influenced by different atmospheric variables? How can we predict weather?
 Unit 8: Meteorology How is Earth s weather influenced by different atmospheric variables? How can we predict weather? Regent s Earth Science Name: Topics Weather Structure of Earth s atmosphere Air Temperature
2. What are the four most common gasses in the atmosphere and their percentages?
 Meteorology Review Directions: Answer the following open ended review questions. Utilize a diagram where appropriate and do make sure that you label and describe the drawing. Atmospheric Composition 1.
Figure 1. Idealized global atmospheric circulation (C = surface convergence, D = surface divergence).
.") page - Laboratory Exercise #8 - Introduction to Atmospheric Science: Global Circulation and Weather Makers Section A - Global Atmospheric Circulation: To understand weather you need to understand how the
page - Laboratory Exercise #8 - Introduction to Atmospheric Science: Global Circulation and Weather Makers Section A - Global Atmospheric Circulation: To understand weather you need to understand how the
Weather is the of the Earth s atmosphere at a place and time. It is the movement of through the atmosphere o Energy comes from the
 Weather Notes Weather Weather is the of the Earth s atmosphere at a place and time It is the movement of through the atmosphere o Energy comes from the The sun is the force that weather The sun s energy
MOISTURE IN THE ATMOSPHERE MEGA PACKET
 NAME: MEGA PACKET 1. A psychrometer is used to determine which weather variables? A) wind speed and wind direction B) percentage of cloud cover and cloud height C) air pressure and air temperature D) relative
AOSC 200 Tim Canty. Class Web Site: Topics for today: Air Masses. Fronts. Lecture 19 Apr
 Air Masses AOSC 200 Tim Canty Class Web Site: http://www.atmos.umd.edu/~tcanty/aosc200 Topics for today: Air Masses Fronts Lecture 19 Apr 11 2019 1 Today s Weather Map http://www.wpc.ncep.noaa.gov/#page=sfc
Weather Patterns and Severe Storms
 Weather Patterns and Severe Storms 20.1 Air Masses Air Masses and Weather Air Masses An air mass is an immense body of air that is characterized by similar temperatures and amounts of moisture at any given
A) its rotation D) Sun, the Moon, and some stars C) an oblate sphere D) troposphere B) hydrosphere and troposphere B) less dense and more felsic
 its rotation D) Sun, the Moon, and some stars C) an oblate sphere D) troposphere B) hydrosphere and troposphere B) less dense and more felsic") 1. The Earth is slightly flattened from a perfect spherical shape because of A) its rotation B) the pull of the sun and moon C) storms on the sun's surface D) its molten core 2. The Earth's actual shape
1. The Earth is slightly flattened from a perfect spherical shape because of A) its rotation B) the pull of the sun and moon C) storms on the sun's surface D) its molten core 2. The Earth's actual shape
Tuesday, September 13, 16
 Weather Weather State Objectives 4.c, 4.d, 4.h. Discussion What are some ways in which weather affects your everyday life? Discussion What are some ways in which weather affects your everyday life? What
Unit: Weather Study Guide
 Name: Period: Unit: Weather Study Guide Define each vocabulary word on a separate piece of paper or index card. Weather Climate Temperature Wind chill Heat index Sky conditions UV index Visibility Wind
FORMATION OF AIR MASSES
 Chapter 24: Weather (air mass, fronts, Weather instruments, and forecasting the weather) Name: Period: Due Date: Air Mass Use the terms from the following list to complete the sentences below. Each term
Lecture Outlines PowerPoint. Chapter 19 Earth Science 11e Tarbuck/Lutgens
 Lecture Outlines PowerPoint Chapter 19 Earth Science 11e Tarbuck/Lutgens 2006 Pearson Prentice Hall This work is protected by United States copyright laws and is provided solely for the use of instructors
Earth Science, 11e. Weather Patterns and Severe Storms Chapter 19. Air masses. A cold Canadian air mass Figure Air masses. Air masses 9/5/2012
 2006 Pearson Prentice Hall Lecture Outlines PowerPoint Chapter 19 Earth Science 11e Tarbuck/Lutgens This work is protected by United States copyright laws and is provided solely for the use of instructors
Ch. 3: Weather Patterns
 Ch. 3: Weather Patterns Sect. 1: Air Mass & Fronts Sect. 2: Storms Sect. 3: Predicting the Weather Sect. 4: Weather forecasters use advanced technologies Ch. 3 Weather Fronts and Storms Objective(s) 7.E.1.3
Grade 9 Geography Chapter 11 - Climate Connections
 Grade 9 Geography Chapter 11 - Climate Connections 1. Define: Weather. 2. In what way has weather affected your activities in the last two weeks? 3. Define: Climate. 4. Canada s climate is a function of
1 What Is Climate? TAKE A LOOK 2. Explain Why do areas near the equator tend to have high temperatures?
 CHAPTER 17 1 What Is Climate? SECTION Climate BEFORE YOU READ After you read this section, you should be able to answer these questions: What is climate? What factors affect climate? How do climates differ
Objectives. Vocabulary
 The Causes of Weather Objectives Compare and contrast weather and climate. Analyze how imbalances in the heating of Earth s surface create weather. Describe how and where air masses form. Vocabulary meteorology
COMPOSITION OF THE ATMOSPHERE
 Name Air COMPOSITION OF THE ATMOSPHERE 1. What are the two most abundant gases in the atmospherere? 2. Why do you think the percentage of water vapor in the air varies? 3. Would you classify carbon dioxide
Science Olympiad Meteorology Quiz #2 Page 1 of 8
 1) The prevailing general direction of the jet stream is from west to east in the northern hemisphere: 2) Advection is the vertical movement of an air mass from one location to another: 3) Thunderstorms
Chapter 18/19. Ch 18
 Chapter 18/19 Ch 18 Pressure Force of the weight of the air above At sea level: 14.7 lbs/in2 Decreases with altitude Inches of mercury (29.92 @ sea level) Barometer - instrument used to measure air pressure
Chapter 21. Weather Patterns and Severe Storms
 Chapter 21 Weather Patterns and Severe Storms 20.1 Air Masses Air Masses and Weather Air Masses An air mass is an immense body of air that is characterized by similar temperatures and amounts of moisture
Meteorology Unit Study Guide
 Name: Key Pd. Date: 1. Define meteorology Meteorology Unit Study Guide Study of the atmosphere including weather and weather patterns 2. The most abundant gas in the atmosphere by volume is. This gas comprises
Science 1206 Chapter 1 - Inquiring about Weather
 Science 1206 Chapter 1 - Inquiring about Weather 1.1 - The Atmosphere: Energy Transfer and Properties (pp. 10-25) Weather and the Atmosphere weather the physical conditions of the atmosphere at a specific
How Can You Predict Weather Changes?
 How Can You Predict Weather Changes? How to Predict Weather Meteorologists make weather predictions daily. They use the same processes that you will. They collect weather data. They plot the data on maps.
Chapter 12: Meteorology
 Chapter 12: Meteorology Section 1: The Causes of Weather 1. Compare and contrast weather and climate. 2. Analyze how imbalances in the heating of Earth s surface create weather. 3. Describe how and where
KEY. 7th Grade Science: Weather and Climate Core Assessment Study Guide
 KEY 7th Grade Science: Weather and Climate Core Assessment Study Guide Ch. 1 The Air Around You (pg. 6-26) 1. The chart on the right shows the percentage of gases that comprise our atmosphere. Use the
Atmospheric Layers. Earth s atmosphere is divided into several different atmospheric layers extending from Earth s surface outward.
 6-4.1 Compare the composition and structure of Earth s atmospheric layers (including the gases and differences in temperature and pressure within the layers). Taxonomy level: 2.6-B Understand Conceptual
Condensation is the process by which water vapor changes from a gas to a liquid. Clouds form by this process.
 CHAPTER 16 1 Water in the Air SECTION Understanding Weather BEFORE YOU READ After you read this section, you should be able to answer these questions: What is weather? How does water in the air affect
Weather. Temperature is the degree of hotness or coldness of the air. Air temperature is measured using a thermometer.
 Weather Weather Weather describes the conditions in Earth's atmosphere at a given place at a given time. Temperature, precipitation, humidity, and cloud formation are aspects of weather, and they can be
Climate versus Weather
 Climate versus Weather What is climate? Climate is the average weather usually taken over a 30-year time period for a particular region and time period. Climate is not the same as weather, but rather,
May 17, earthsciencechapter24.notebook. Apr 8 10:54 AM Review. Grade:9th. Subject:Earth Science. Date:4/8.
 Apr 8 10:54 AM 24.1 Review Grade:9th Subject:Earth Science Date:4/8 Apr 8 9:29 AM 1 1 As lower layers of air are warmed... A the air rises B winds form C the air dries D the air sinks Apr 8 9:49 AM 2 What
Class Notes: Weather
 Name: Date: Period: Weather The Physical Setting: Earth Science I. Cyclonic Weather Hurricane - Hurricane Statistics Largest of all the storms Approximately per year Nearly deaths per year Saffir-Simpson
Unit Three Worksheet Meteorology/Oceanography 2 WS GE U3 2
 Unit Three Worksheet Meteorology/Oceanography 2 WS GE U3 2 Name Period Section 17.3 1. 2. 3. 4. 5. 6. 7. 8. Of the following, which is NOT a factor that controls temperature? (C) latitude (D) longitude