Detection of Sea Ice/ Melt Pond from Aerial Photos through Object-based Image Classification Scheme
|
|
|
- Peregrine Townsend
- 6 years ago
- Views:
Transcription


1 NEMC 213 August 5-9, San Antonio, TX Detection of Sea Ice/ Melt Pond from Aerial Photos through Object-based Image Classification Scheme Xin Miao 12, Hongjie Xie 2, Zhijun Li 3, Ruibo Lei 4 1 Department of Geography, Geology and Planning, Missouri State University 2 Department of Geology, University of Texas at San Antonio 3 Dalian University of Technology 4 Polar Research Institute of China

2 Introduction 1 Sea Ice and Climate Change The lowest Arctic summer sea ice extents with a new record summer minimum (3.4 million km2) set on 13 September 212. The shrinking summer sea ice extent could be the first of the tipping points of the climate dominos. Consequences: higher water temperature due to the positive feedback of albedo (melt ponds), more powerful and frequent storms, rising sea levels, diminished habitats for polar animals, and more pollution due to fossil fuel exploitation and/ or increased traffic. (Yohe et al., 27; Marshall, 213; Parkinson and Comiso, 213)
3 Introduction 2 High Spatial Resolution Image Processing Arctic sea ice models: e.g. Los Alamos Sea Ice (CICE) model coupled with POP (Parallel Ocean Program) in the NCAR CESM. Require high spatial resolution image data in the Arctic area to calibrate and verify the model, e.g. USGS Global Fiducials Library (GFL), and Survey aerial photos such as CHINARE 21 et al. Manually delineating of sea ice/ melt pond is timeconsuming and labor-intensive, need a reliable and efficient image batch processing scheme. (Kim et al., 26; Hunke, 21; Hunke and Lipscomb, 21)

4 Study Area Introduction 3

 Altitude > 8 m, Lag")
 Aug 22, 21")
5 Altitude Introduction 4 Geotagging And Photo Selection July 26, 21 Aug 13/16/17/19, 21 Photo Selection Criteria F>4.5 (Stray light) Altitude > 8 m, Lag distance >12 m Lag Speed >72 kph = 2 m/s (Altitude exaggerated 3 times) Aug 22, 21 Lag distance 9 degree

6 Objectives Objectives Use object-based remote sensing classification scheme to extract melt ponds efficiently from 1,727 aerial photos taken during the Chinese Arctic Exploration in 21. Classification scheme: water, ice/snow, submerged ice, shadow and melt ponds. Evaluate the classification accuracy. Estimate the sea ice physical properties.


7 Flow Chart Literature review, data explore/ collection Statement of the project Method 1 Preprocessing Stray light calibration Resample photos Geotagging Photo selection Object feature extraction Image segmentaton Mean and SD of BV of RGB channels Texture: Variance/ Entropy Band ratio: Normalized Blue Index Shape: Area /Compact Photo interpretation Training Random Forest ensemble classifiers Calibration Accuracy assessment Accept Polygon neighbor analysis Calibration Final accuracy assessment Accept Output map


8 Method 2 Red Stray Light Removal test_ _12 test_ _92 Resolution: 12.1 megapixels CCD Size: 1/1.7 Zoom lens: 7.4 mm mm - F/ Focal Length Equivalent to 35mm Camera: mm Max Shutter Speed: 1/25 sec

9 Method 3 Resize Photos 3 * 4 pixels 75 *1 pixels
10 Image Segmentation (1) Method 4

11 Image Segmentation (2) Method 5

12 Image Segmentation (3) Method 6
/(B+R) BR2= (B-G)/(B+G) BR3=(G-R)/(2B-R-G) True Area/ Compact used in morphological")
13 Method 7 Feature Extraction Image segmentaton Mean and SD of BV of RGB channels Texture: Variance/ Entropy Band ratio: Normalized Blue Index Shape: Area /Compact Extract 13 Spectral, Texture, Band Ratio and Shape Features BR1= (B-R)/(B+R) BR2= (B-G)/(B+G) BR3=(G-R)/(2B-R-G) True Area/ Compact used in morphological analysis
14 Classification scheme Method 8 # Class Name Class Description 1 Water Arctic ocean, objects are rather dark and smooth. 2 Submerged ice Ice submerged under water along the edge, usually shown as color cyan or blue due to mixed reflection from ice surface and water. 3 Shadow Darker objects on the ice/snow caused by ridges and low solar elevation angle. Shadow will be combined into Ice/snow for calculation of ice concentration. Shadow will also be used for calculation of ridge height. 4 Ice/snow Bright white objects due to high reflectance of ice/snow. 5 Melt pond Pools of open water formed on sea ice. Melt pond will be used for calculation of fresh water volume.
15 Method 9 Random Forest: A Ensemble Method Feature extraction Classification Voting Output Image segmentaton DT1 Output 1 Mean and SD of BV of RGB channels 6 Texture: Variance/ Entropy Band ratio: Normalized Blue Index Shape: Area /Compact DT2 5 decision trees Output 2... m:: DTn Output n......

16 Polygon Neighbors Analysis (PNA) Method 1 Difficult to separate melt ponds from dark ice ; Melt pond should not be adjacent to water or submerged ice; Vector operation, good match for image segmentation; Still time consuming (14 h).

17 Method 11 Aerial photo processing & classification

18 Shadow Features Method 12

19 Major steps of shadow analysis Method 13
20 Blue BR3 Results 1 Cluster Analysis (Step 2 ) 25 2 Water Sub I ce Shadow Ice Water Sub I ce Shadow Ice Red 2 4 Green BR1.2.1 BR2
21 Out-of-Bag classification error Output Class Results 2 Classification (Step 2 ) Accuracy Sea Ice Classification Confusion Matrix Confusion Matrix % 1% % 1% % % 94.4% 5.6% % % 97.7% 2.3% Number of grown trees 1% 95.3% 4.7% 1% 1% Target Class 98.3% 1.7%
22 Feature Importance Results 3

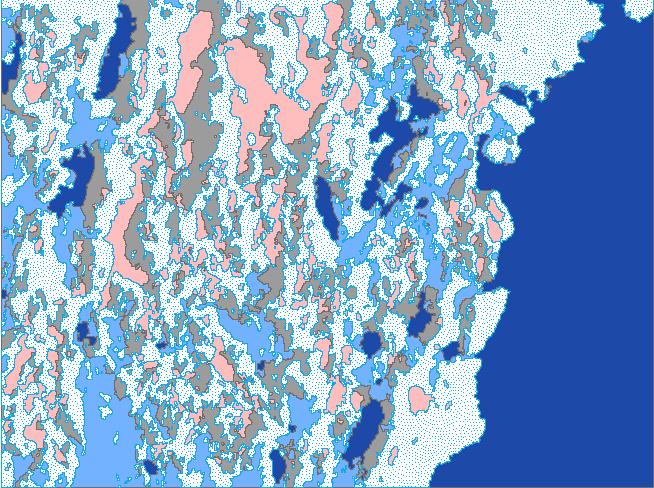
23 Classification Result 1 Results 4


24 Classification Result 2 Results 5


25 Classification Result 3 Results 6

26 Classification Result 4 Results 7
27 Derivable Sea Ice Physical Properties Results 9 # Name Description 1 Ice concentration Fraction of ice-cover in a given area 2 Ice edge Boundary between an area of ice and open ocean 3 Floe size distribution Probability Density Function of ice floe diameters (or areas) 4 Melt pond distribution Probability Density Function of melt pool diameters(or areas) 5 Fresh water of melt Product of the areas and depths of melt ponds ponds 5 Lateral melting Melt rate of ice at the edges of ice floes 6 Surface roughness Probability Density Function of the elevation of ice above level ice 7 Ridge height Height of the (usually) linear features above the surrounding level or undeformed ice 8 Fractional heat transferring into the ocean Cumulative fraction of solar heat incident on ice/snow, submerged ice, melt ponds, and open water, weighted by the area and transmittance of each component
28 Conclusion 1 Conclusions Object-based classification is an efficient and accurate strategy to classify sea ice. Random forest can largely increase classification accuracy. Polygon neighbor analysis can extract spatial relationship between objects, providing further information to separate submerged ice and melt ponds. Sea ice roughness can be derived automatically from shadow. Errors often happen when a mixture of shadow, submerged ice and melt ponds.
Evaluating the Discrete Element Method as a Tool for Predicting the Seasonal Evolution of the MIZ
 DISTRIBUTION STATEMENT A. Approved for public release; distribution is unlimited. Evaluating the Discrete Element Method as a Tool for Predicting the Seasonal Evolution of the MIZ Arnold J. Song Cold Regions
Spectral Albedos. a: dry snow. b: wet new snow. c: melting old snow. a: cold MY ice. b: melting MY ice. d: frozen pond. c: melting FY white ice
 Spectral Albedos a: dry snow b: wet new snow a: cold MY ice c: melting old snow b: melting MY ice d: frozen pond c: melting FY white ice d: melting FY blue ice e: early MY pond e: ageing ponds Extinction
Sea Ice Modeling for Climate Applications. Marika M Holland (NCAR) David Bailey (NCAR), Cecilia Bitz (U. Washington), Elizabeth Hunke (LANL)
 David Bailey (NCAR), Cecilia Bitz (U. Washington), Elizabeth Hunke (LANL)") Sea Ice Modeling for Climate Applications Marika M Holland (NCAR) David Bailey (NCAR), Cecilia Bitz (U. Washington), Elizabeth Hunke (LANL) Surface albedo > 0.8 < 0.1 Why do we care about sea ice? Surface
Sea Ice Modeling for Climate Applications Marika M Holland (NCAR) David Bailey (NCAR), Cecilia Bitz (U. Washington), Elizabeth Hunke (LANL) Surface albedo > 0.8 < 0.1 Why do we care about sea ice? Surface
HOW GEOGRAPHY AND GEOLOGY AFFECT BIOLOGICAL DIVERSITY
 HOW GEOGRAPHY AND GEOLOGY AFFECT BIOLOGICAL DIVERSITY Factors Affecting Extinction Rates Natural Factors Climate change Cataclysmic event (volcano, earthquake) Human Activities Habitat Loss/Fragmentation
Fundamentals of Photographic Interpretation
 Principals and Elements of Image Interpretation Fundamentals of Photographic Interpretation Observation and inference depend on interpreter s training, experience, bias, natural visual and analytical abilities.
CLIMATE CHANGE AND OIL IN THE ARCTIC
 CLIMATE CHANGE AND OIL IN THE ARCTIC What is Climate Change? Rising temperatures Changes in weather Warm acidic oceans Melting ice caps Rising sea levels Photo from uab.edu A Way Forward: Facing Climate
Annual September Arctic Sea ice extent
 Annual September Arctic Sea ice extent 1979-2012 Annual September Arctic Sea ice extent 1979-2012 Notes: The month of September has the minimum sea ice cover each year. Passive microwave instruments on
Delineating Climate Relevant Structures for the Beijing Metropolitan Area
 Delineating Climate Relevant Structures for the Beijing Metropolitan Area 1,2 3,4 1 Austrian Academy of Sciences GIScience, Salzburg 2 Insitute for Geography, University of Bamberg, Germany 3 ispace, Austrian
Monitoring Sea Ice with Space-borne Synthetic Aperture Radar
 Monitoring Sea Ice with Space-borne Synthetic Aperture Radar Torbjørn Eltoft UiT- the Arctic University of Norway CIRFA A Centre for Research-based Innovation cirfa.uit.no Sea ice & climate Some basic
Outline: Introduction - Data used - Methods - Results
 Mapping of land covers in South Greenland using very high resolution satellite imagery Menaka Chellasamy, Mateja Ogric, Mogens H. Greve and René Larsen Outline: Introduction - Data used - Methods - Results
Lower Stratospheric Cooling. and. Abrupt Change in Arctic Sea Ice
 Lower Stratospheric Cooling and Abrupt Change in Arctic Sea Ice Carl Drews March 16, 2007 ATOC 7500-002 Human Influences on Weather and Climate University of Colorado at Boulder Dr. Roger Pielke Sr, Instructor
Radiative Climatology of the North Slope of Alaska and the Adjacent Arctic Ocean
 Radiative Climatology of the North Slope of Alaska and the Adjacent Arctic Ocean C. Marty, R. Storvold, and X. Xiong Geophysical Institute University of Alaska Fairbanks, Alaska K. H. Stamnes Stevens Institute
2. Fargo, North Dakota receives more snow than Charleston, South Carolina.
 2015 National Tournament Division B Meteorology Section 1: Weather versus Climate Chose the answer that best answers the question 1. The sky is partly cloudy this morning in Lincoln, Nebraska. 2. Fargo,
Sea-Ice Prediction in the GFDL model framework
 Sea-Ice Prediction in the GFDL model framework NGGPS Sea Ice Model Workshop February 3, 2016 Mitch Bushuk Princeton University and GFDL With contributions from: Michael Winton, Robert Hallberg, Rym Msadek,
Experimental and Theoretical Studies of Ice-Albedo Feedback Processes in the Arctic Basin
 LONG TERM GOALS Experimental and Theoretical Studies of Ice-Albedo Feedback Processes in the Arctic Basin D.K. Perovich J.A. Richter-Menge W.B. Tucker III M. Sturm U. S. Army Cold Regions Research and
Hierarchical models for the rainfall forecast DATA MINING APPROACH
 Hierarchical models for the rainfall forecast DATA MINING APPROACH Thanh-Nghi Do dtnghi@cit.ctu.edu.vn June - 2014 Introduction Problem large scale GCM small scale models Aim Statistical downscaling local
Changing predictability characteristics of Arctic sea ice in a warming climate
 Changing predictability characteristics of Arctic sea ice in a warming climate Marika Holland 1 Laura Landrum 1, John Mioduszewski 2, Steve Vavrus 2, Muyin Wang 3 1. NCAR, 2. U. Wisconsin-Madison, 3. NOAA
Light Up Your World Adapted from Reflecting on Reflectivity,
 Climate Change I m Supposed To Know What That Is? Light Up Your World Adapted from Reflecting on Reflectivity, http://www.climatechangenorth.ca Overview: Students often confuse global warming and the depletion
The Seasonal Evolution of Sea Ice Floe Size Distribution
 DISTRIBUTION STATEMENT A. Approved for public release; distribution is unlimited. The Seasonal Evolution of Sea Ice Floe Size Distribution Jacqueline A. Richter-Menge and Donald K. Perovich CRREL 72 Lyme
Record low sea ice concentration in the central Arctic during the summer of Jinping Zhao Ocean University of China
 Record low sea ice concentration in the central Arctic during the summer of 2010 Jinping Zhao Ocean University of China Expedition to the north pole in 1995 Sea ice retreat in the Arctic 3 Replacement
The Seasonal Evolution of Sea Ice Floe Size Distribution
 DISTRIBUTION STATEMENT A. Approved for public release; distribution is unlimited. The Seasonal Evolution of Sea Ice Floe Size Distribution Jacqueline A. Richter-Menge and Donald K. Perovich CRREL, 72 Lyme
DEPENDENCE OF URBAN TEMPERATURE ELEVATION ON LAND COVER TYPES. Ping CHEN, Soo Chin LIEW and Leong Keong KWOH
 DEPENDENCE OF URBAN TEMPERATURE ELEVATION ON LAND COVER TYPES Ping CHEN, Soo Chin LIEW and Leong Keong KWOH Centre for Remote Imaging, Sensing and Processing, National University of Singapore, Lower Kent
Object Based Imagery Exploration with. Outline
 Object Based Imagery Exploration with Dan Craver Portland State University June 11, 2007 Outline Overview Getting Started Processing and Derivatives Object-oriented classification Literature review Demo
Nonlinear atmospheric response to Arctic sea-ice loss under different sea ice scenarios
 Nonlinear atmospheric response to Arctic sea-ice loss under different sea ice scenarios Hans Chen, Fuqing Zhang and Richard Alley Advanced Data Assimilation and Predictability Techniques The Pennsylvania
Spectral reflectance: When the solar radiation is incident upon the earth s surface, it is either
 Spectral reflectance: When the solar radiation is incident upon the earth s surface, it is either reflected by the surface, transmitted into the surface or absorbed and emitted by the surface. Remote sensing
Trimble s ecognition Product Suite
 Trimble s ecognition Product Suite Dr. Waldemar Krebs October 2010 Trimble Geospatial in the Image Processing Chain Data Acquisition Pre-processing Manual/Pixel-based Object-/contextbased Interpretation
Using Remote-sensed Sea Ice Thickness, Extent and Speed Observations to Optimise a Sea Ice Model
 Using Remote-sensed Sea Ice Thickness, Extent and Speed Observations to Optimise a Sea Ice Model Paul Miller, Seymour Laxon, Daniel Feltham, Douglas Cresswell Centre for Polar Observation and Modelling
The Arctic Sea Ice Cover
 The Arctic Sea Ice Cover From the Living Earth Interface, Impediment, Integrator Frozen ocean 8-15 million km 2 Size of U.S. Meters thick Floating, moving ice Highly variable Large albedo Climate change!
Evidence of Current Climate Change in the Polar Regions
 Evidence of Current Climate Change in the Polar Regions Dr. Mary Albert Cold Regions Research and Engineering Laboratory Thayer School of Engineering, Dartmouth College Hanover, NH Overview How do we detect
Which graph best shows the relationship between intensity of insolation and position on the Earth's surface? A) B) C) D)
 B) C) D)") 1. The hottest climates on Earth are located near the Equator because this region A) is usually closest to the Sun B) reflects the greatest amount of insolation C) receives the most hours of daylight D)
1. The hottest climates on Earth are located near the Equator because this region A) is usually closest to the Sun B) reflects the greatest amount of insolation C) receives the most hours of daylight D)
Early Student Support to Investigate the Role of Sea Ice-Albedo Feedback in Sea Ice Predictions
 DISTRIBUTION STATEMENT A. Approved for public release; distribution is unlimited. Early Student Support to Investigate the Role of Sea Ice-Albedo Feedback in Sea Ice Predictions Cecilia M. Bitz Atmospheric
Spatial Decision Tree: A Novel Approach to Land-Cover Classification
 Spatial Decision Tree: A Novel Approach to Land-Cover Classification Zhe Jiang 1, Shashi Shekhar 1, Xun Zhou 1, Joseph Knight 2, Jennifer Corcoran 2 1 Department of Computer Science & Engineering 2 Department
Ice-Albedo Feedback Process in the Arctic Ocean
 Ice-Albedo Feedback Process in the Arctic Ocean Donald K. Perovich John Weatherly Mark Hopkins Jacqueline A. Richter-Menge U. S. Army Cold Regions Research and Engineering Laboratory 72 Lyme Road Hanover
KNOWLEDGE-BASED CLASSIFICATION OF LAND COVER FOR THE QUALITY ASSESSEMENT OF GIS DATABASE. Israel -
 KNOWLEDGE-BASED CLASSIFICATION OF LAND COVER FOR THE QUALITY ASSESSEMENT OF GIS DATABASE Ammatzia Peled a,*, Michael Gilichinsky b a University of Haifa, Department of Geography and Environmental Studies,
Mario Flores, Graduate Student Department of Applied Mathematics, UTSA. EES 5053: Remote Sensing
 Mario Flores, Graduate Student Department of Applied Mathematics, UTSA Miguel Balderas, E.I.T., Graduate Student Department of Civil/Environmental Engineering, UTSA EES 5053: Remote Sensing REMOTE SENSING
Wave processes in Arctic Seas, observed from TerraSAR-X
 DISTRIBUTION STATEMENT A. Approved for public release; distribution is unlimited. Wave processes in Arctic Seas, observed from TerraSAR-X Susanne Lehner DLR German Air and Space Research Center Earth Observation
Website Lecture 3 The Physical Environment Part 1
 Website http://websites.rcc.edu/halama Lecture 3 The Physical Environment Part 1 1 Lectures 3 & 4 1. Biogeochemical Cycling 2. Solar Radiation 3. The Atmosphere 4. The Global Ocean 5. Weather and Climate
Basic cloud Interpretation using Satellite Imagery
 Basic cloud Interpretation using Satellite Imagery Introduction Recall that images from weather satellites are actually measurements of energy from specified bands within the Electromagnetic (EM) spectrum.
Activity 2.2: Recognizing Change (Observation vs. Inference)
") Activity 2.2: Recognizing Change (Observation vs. Inference) Teacher Notes: Evidence for Climate Change PowerPoint Slide 1 Slide 2 Introduction Image 1 (Namib Desert, Namibia) The sun is on the horizon
Activity 2.2: Recognizing Change (Observation vs. Inference) Teacher Notes: Evidence for Climate Change PowerPoint Slide 1 Slide 2 Introduction Image 1 (Namib Desert, Namibia) The sun is on the horizon
Airborne sea ice thickness sounding
 Airborne sea ice thickness sounding 1, Christian Haas 2, Lasse Rabenstein 1, John Lobach 3 1. Alfred Wegener Institute for Polar and Marine Research, Germany 2. University of Alberta, Canada 3. Ferra Dynamics
Land cover/land use mapping and cha Mongolian plateau using remote sens. Title. Author(s) Bagan, Hasi; Yamagata, Yoshiki. Citation Japan.
 Bagan, Hasi; Yamagata, Yoshiki. Citation Japan.") Title Land cover/land use mapping and cha Mongolian plateau using remote sens Author(s) Bagan, Hasi; Yamagata, Yoshiki International Symposium on "The Imp Citation Region Specific Systems". 6 Nove Japan.
Title Land cover/land use mapping and cha Mongolian plateau using remote sens Author(s) Bagan, Hasi; Yamagata, Yoshiki International Symposium on "The Imp Citation Region Specific Systems". 6 Nove Japan.
Principals and Elements of Image Interpretation
 Principals and Elements of Image Interpretation 1 Fundamentals of Photographic Interpretation Observation and inference depend on interpreter s training, experience, bias, natural visual and analytical
Day Snow-Fog RGB Detection of low-level clouds and snow/ice covered area
 JMA Day Snow-Fog RGB Detection of low-level clouds and snow/ice covered area Meteorological Satellite Center, JMA What s Day Snow-Fog RGB? R : B04 (N1 0.86) Range : 0~100 [%] Gamma : 1.7 G : B05 (N2 1.6)
Object-based feature extraction of Google Earth Imagery for mapping termite mounds in Bahia, Brazil
 OPEN ACCESS Conference Proceedings Paper Sensors and Applications www.mdpi.com/journal/sensors Object-based feature extraction of Google Earth Imagery for mapping termite mounds in Bahia, Brazil Sunhui
Classification of High Spatial Resolution Remote Sensing Images Based on Decision Fusion
 Journal of Advances in Information Technology Vol. 8, No. 1, February 2017 Classification of High Spatial Resolution Remote Sensing Images Based on Decision Fusion Guizhou Wang Institute of Remote Sensing
Changing Arctic: climate, environment, metocean conditions, with a special focus on sea ice
 Changing Arctic: climate, environment, metocean conditions, with a special focus on sea ice (IPCC AR4, WG II, Ch.15) Julienne Stroeve National Snow and Ice Data Center (NSIDC), Cooperative Institute for
Simulation of the melt season using a resolved sea ice model with snow cover and melt ponds
 Simulation of the melt season using a resolved sea ice model with snow cover and melt ponds Skyllingstad, E. D., Shell, K. M., Collins, L., & Polashenski, C. (2015). Simulation of the melt season using
Mapping Coastal Change Using LiDAR and Multispectral Imagery
 Mapping Coastal Change Using LiDAR and Multispectral Imagery Contributor: Patrick Collins, Technical Solutions Engineer Presented by TABLE OF CONTENTS Introduction... 1 Coastal Change... 1 Mapping Coastal
ESTIMATING SNOWMELT CONTRIBUTION FROM THE GANGOTRI GLACIER CATCHMENT INTO THE BHAGIRATHI RIVER, INDIA ABSTRACT INTRODUCTION
 ESTIMATING SNOWMELT CONTRIBUTION FROM THE GANGOTRI GLACIER CATCHMENT INTO THE BHAGIRATHI RIVER, INDIA Rodney M. Chai 1, Leigh A. Stearns 2, C. J. van der Veen 1 ABSTRACT The Bhagirathi River emerges from
3. Which color of the visible light has the shortest wavelength? A) violet B) green C) yellow D) red
 violet B) green C) yellow D) red") Name: Topic 6 Test 1. Which process is responsible for the greatest loss of energy from Earth's surface into space on a clear night? A) condensation B) conduction C) radiation D) convection 2. Base your
Name: Topic 6 Test 1. Which process is responsible for the greatest loss of energy from Earth's surface into space on a clear night? A) condensation B) conduction C) radiation D) convection 2. Base your
Object-Oriented Oriented Method to Classify the Land Use and Land Cover in San Antonio using ecognition Object-Oriented Oriented Image Analysis
 Object-Oriented Oriented Method to Classify the Land Use and Land Cover in San Antonio using ecognition Object-Oriented Oriented Image Analysis Jayar S. Griffith ES6973 Remote Sensing Image Processing
Sea ice: physical properties, processes and trends. Stephen Howell Climate Research Division, Environment and Climate Change Canada July 18, 2017
 Sea ice: physical properties, processes and trends Stephen Howell Climate Research Division, Environment and Climate Change Canada July 18, 2017 3-Part Sea Ice Lecture Overview 1. Physical properties,
Exemplar for Internal Achievement Standard. Mathematics and Statistics Level 3
 Exemplar for internal assessment resource Mathematics and Statistics for Achievement Standard 91580 Exemplar for Internal Achievement Standard Mathematics and Statistics Level 3 This exemplar supports
Algorithm User Guide:
 Algorithm User Guide: Nuclear Quantification Use the Aperio algorithms to adjust (tune) the parameters until the quantitative results are sufficiently accurate for the purpose for which you intend to use
Combined Airborne Profiling over Fram Strait Sea Ice: Fractional Sea-Ice Types, Albedo and Thickness Measurements
 Paper III Christina A. Pedersen, Richard Hall, Sebastian Gerland, Agnar H. Sivertsen, T. Svenøe and Christian Haas, Combined Airborne Proling over Fram Strait Sea Ice: Fractional Sea-Ice Types, Albedo
The Climatology of Clouds using surface observations. S.G. Warren and C.J. Hahn Encyclopedia of Atmospheric Sciences.
 The Climatology of Clouds using surface observations S.G. Warren and C.J. Hahn Encyclopedia of Atmospheric Sciences Gill-Ran Jeong Cloud Climatology The time-averaged geographical distribution of cloud
Satellite Type Estination from Ground-based Photometric Observation
 Satellite Type Estination from Ground-based Photometric Observation Takao Endo, HItomi Ono, Jiro Suzuki and Toshiyuki Ando Mitsubishi Electric Corporation, Information Technology R&D Center Takashi Takanezawa
World Geography Chapter 3
 World Geography Chapter 3 Section 1 A. Introduction a. Weather b. Climate c. Both weather and climate are influenced by i. direct sunlight. ii. iii. iv. the features of the earth s surface. B. The Greenhouse
o 3000 Hannover, Fed. Rep. of Germany
 1. Abstract The use of SPOT and CIR aerial photography for urban planning P. Lohmann, G. Altrogge Institute for Photogrammetry and Engineering Surveys University of Hannover, Nienburger Strasse 1 o 3000
Experimental and Theoretical Studies of Ice-Albedo Feedback Processes in the Arctic Basin
 LONG TERM GOALS Experimental and Theoretical Studies of Ice-Albedo Feedback Processes in the Arctic Basin D.K. Perovich J.A. Richter-Menge W.B. Tucker III M. Sturm U. S. Army Cold Regions Research and
Ice Observations on the Churchill River using Satellite Imagery
 CGU HS Committee on River Ice Processes and the Environment 15 th Workshop on River Ice St. John s, Newfoundland and Labrador, June 15-17, 2009 Ice Observations on the Churchill River using Satellite Imagery
IMPACTS OF A WARMING ARCTIC
 The Earth s Greenhouse Effect Most of the heat energy emitted from the surface is absorbed by greenhouse gases which radiate heat back down to warm the lower atmosphere and the surface. Increasing the
CHARACTERIZATION OF THE LAND-COVER AND LAND-USE BY SHAPE DESCRITORS IN TWO AREAS IN PONTA GROSSA, PR, BR. S. R. Ribeiro¹*, T. M.
 CHARACTERIZATION OF THE LAND-COVER AND LAND-USE BY SHAPE DESCRITORS IN TWO AREAS IN PONTA GROSSA, PR, BR S. R. Ribeiro¹*, T. M. Hamulak 1 1 Department of Geography, State University of Ponta Grossa, Brazil
Operational sea ice forecasting and navigation service for Chinese National Antarctic Research Expedition (CHINARE)
") Operational sea ice forecasting and navigation service for Chinese National Antarctic Research Expedition (CHINARE) Lin Zhang, Chunhua Li, Qinghua Yang, Shang Meng, Ming Li, Qizhen Sun and Jiechen Zhao
Operational sea ice forecasting and navigation service for Chinese National Antarctic Research Expedition (CHINARE) Lin Zhang, Chunhua Li, Qinghua Yang, Shang Meng, Ming Li, Qizhen Sun and Jiechen Zhao
AUTOMATIC EXTRACTION OF ALUVIAL FANS FROM ASTER L1 SATELLITE DATA AND A DIGITAL ELEVATION MODEL USING OBJECT-ORIENTED IMAGE ANALYSIS
 AUTOMATIC EXTRACTION OF ALUVIAL FANS FROM ASTER L1 SATELLITE DATA AND A DIGITAL ELEVATION MODEL USING OBJECT-ORIENTED IMAGE ANALYSIS Demetre P. Argialas, Angelos Tzotsos Laboratory of Remote Sensing, Department
Variance Reduction and Ensemble Methods
 Variance Reduction and Ensemble Methods Nicholas Ruozzi University of Texas at Dallas Based on the slides of Vibhav Gogate and David Sontag Last Time PAC learning Bias/variance tradeoff small hypothesis
A u s t r i a n A l p s
 Documentation of the glacier retreat in the eastern part of the Granatspitz Mountains (Austrian Alps) using aerial photographs V. Kaufmann*, R. Plösch**, S. Ritter*, J. Streber* * Institute of Remote Sensing
CICE: The LANL sea- ice model. Adrian Turner, Elizabeth Hunke, Nicole Jeffery
 CICE: The LANL sea- ice model Adrian Turner, Elizabeth Hunke, Nicole Jeffery Model overview Structured quadrilateral B grid Both components of velocity at verlces Ice concentralon and mass a cell centres
S (2.1)2.a Using an illustration, measure a physical property (e.g., length, temperature).
2.a Using an illustration, measure a physical property (e.g., length, temperature).") Morgan County School District Re-3 Science Fourth ***Not all units will be taught in the order suggested on this plan. August Measurement S (2.1)2 Measuring common physical properties of objects (for example,
Morgan County School District Re-3 Science Fourth ***Not all units will be taught in the order suggested on this plan. August Measurement S (2.1)2 Measuring common physical properties of objects (for example,
Landslide Classification: An Object-Based Approach Bryan Zhou Geog 342: Final Project
 Landslide Classification: An Object-Based Approach Bryan Zhou Geog 342: Final Project Introduction One type of natural hazard that people are familiar with is landslide. Landslide is a laymen term use
Arctic sea ice prediction from days to centuries
 21-26 January 2018 Arctic sea ice prediction from days to centuries Are we there yet? François Massonnet September 2007: the Arctic black swan Arctic sea ice prediction: an emerging area of research Number
Comparison between Land Surface Temperature Retrieval Using Classification Based Emissivity and NDVI Based Emissivity
 Comparison between Land Surface Temperature Retrieval Using Classification Based Emissivity and NDVI Based Emissivity Isabel C. Perez Hoyos NOAA Crest, City College of New York, CUNY, 160 Convent Avenue,
WATER BODIES V2 ALGORITHM
 26/03/2015 WATER BODIES V2 ALGORITHM USING PROBA-V 10 day mean composites multispectral data Water Bodies V2 PROBA-V µ-satellite, gap filler SPOT Sentinel PROBA-V S1-TOC synthesis products - full daily
IMPROVING REMOTE SENSING-DERIVED LAND USE/LAND COVER CLASSIFICATION WITH THE AID OF SPATIAL INFORMATION
 IMPROVING REMOTE SENSING-DERIVED LAND USE/LAND COVER CLASSIFICATION WITH THE AID OF SPATIAL INFORMATION Yingchun Zhou1, Sunil Narumalani1, Dennis E. Jelinski2 Department of Geography, University of Nebraska,
How Will Melting Ice Sheets Affect Us?
 PASSAGE 4 How Will Melting Ice Sheets Affect Us? Variation is normal. During the last ice age, for example, ice sheets also covered much of North America and Scandinavia. Why is what s happening now different
5th social studies geography (5thsocstud_geography)
") Name: Date: 1. Many of the Native Americans who lived on the Great Plains were nomadic people. Why did they move from place to place? A. They were finding new areas to mine. B. They were looking for fertile
Name: Date: 1. Many of the Native Americans who lived on the Great Plains were nomadic people. Why did they move from place to place? A. They were finding new areas to mine. B. They were looking for fertile
PRINCIPLES OF PHOTO INTERPRETATION
 PRINCIPLES OF PHOTO INTERPRETATION Photo Interpretation the act of examining photographic images for the purpose of identifying objects and judging their significance an art more than a science Recognition
Data Entry. Getting coordinates and attributes into our GIS
 Data Entry Getting coordinates and attributes into our GIS How we used to collect spatial data How we collect spatial data now DATA SOURCES, INPUT, AND OUTPUT Manually digitizing from image or map sources
THE GREENHOUSE EFFECT
 ASTRONOMY READER THE GREENHOUSE EFFECT 35.1 THE GREENHOUSE EFFECT Overview Planets are heated by light from the Sun. Planets cool off by giving off an invisible kind of light, longwave infrared light.
Atmosphere Weather and Climate
 Atmosphere Weather and Climate Weather and Climate Weather Atmospheric conditions at a particular time and place Climate Long-term average of weather conditions Often over decades or centuries Coastal
Feasibility study: Use of Sigma 0 and radar images to extract and classify roads in Central Africa. Progress Reports
 : Use of Sigma 0 and radar images to extract and classify roads in Central Africa Progress Reports Study supported by the Canadian Space Agency : Use of Sigma 0 and radar images to extract and classify
CHAPTER 6 & 7 VOCABULARY
 CHAPTER 6 & 7 VOCABULARY 1. Biome 2. Climate 3. Latitude 4. Altitude 5. Emergent layer 6. Epiphyte 7. Understory 8. Permafrost 9. Wetland 10.Plankton 11.Nekton 12.Benthos 13.Littoral zone 14.Benthic zone
Article Measuring Landscape Albedo Using Unmanned Aerial Vehicles
 Article Measuring Landscape Albedo Using Unmanned Aerial Vehicles Chang Cao 1, *, Xuhui Lee 1,2, *, Joseph Muhlhausen 3, Laurent Bonneau 4 and Jiaping Xu 5 1 Yale-NUIST Center on Atmospheric Environment
National Center for Atmospheric Research: Climate Discovery Teacher s Guide
 Lesson Summary Students use a photo of the Bhutan glaciers in order to investigate the different effects albedo has on solar absorption. Prior Knowledge & Skills Graphing skills Data collection skills
Chapter 1 Overview of Maps
 Chapter 1 Overview of Maps In this chapter you will learn about: Key points when working with maps General types of maps Incident specific maps Map legend and symbols Map sources A map is a navigational
Advanced Statistical Methods: Beyond Linear Regression
 Advanced Statistical Methods: Beyond Linear Regression John R. Stevens Utah State University Notes 3. Statistical Methods II Mathematics Educators Worshop 28 March 2009 1 http://www.stat.usu.edu/~jrstevens/pcmi
The Northern Hemisphere Sea ice Trends: Regional Features and the Late 1990s Change. Renguang Wu
 The Northern Hemisphere Sea ice Trends: Regional Features and the Late 1990s Change Renguang Wu Institute of Atmospheric Physics, Chinese Academy of Sciences, Beijing World Conference on Climate Change
Inaugural University of Michigan Science Olympiad Tournament
 Inaugural University of Michigan Science Olympiad Tournament The test may be taken apart. Ties will be broken based on predetermined questions and quality of response. Remote Sensing Test length: 50 Minutes
The Retreating Glaciers of Mt. Jefferson, Oregon. Using EET Methods in Student Research Projects
 The Retreating Glaciers of Mt. Jefferson, Oregon Using EET Methods in Student Research Projects Image Hemphill, 2006 Earth Exploration Toolbook: Chapters Used Measuring Distance and Area in Satellite Images
Update on CICE activities
 CLIMATE, OCEAN AND SEA ICE MODELING PROGRAM Update on CICE activities Elizabeth Hunke October 30, 2009 Outline 1 The Current State of the Model 2 Community Development Examples 3 LANL Development Outline
Urban land cover and land use extraction from Very High Resolution remote sensing imagery
 Urban land cover and land use extraction from Very High Resolution remote sensing imagery Mengmeng Li* 1, Alfred Stein 1, Wietske Bijker 1, Kirsten M.de Beurs 2 1 Faculty of Geo-Information Science and
Earth Science (Tarbuck, et al) 2009 Correlated to: Colorado Academic Standards Science (High School)
 2009 Correlated to: Colorado Academic Standards Science (High School)") Content Area: Science Standard: Earth Systems Science Prepared Graduates: Describe and interpret how Earth's geologic history and place in space are relevant to our understanding of the processes that
Content Area: Science Standard: Earth Systems Science Prepared Graduates: Describe and interpret how Earth's geologic history and place in space are relevant to our understanding of the processes that
Coupling of Waves, Turbulence and Thermodynamics across the Marginal Ice Zone
 DISTRIBUTION STATEMENT A. Approved for public release; distribution is unlimited. Coupling of Waves, Turbulence and Thermodynamics across the Marginal Ice Zone Tim Stanton and Bill Shaw Oceanography Department,
L.O: THE ANGLE OF INSOLATION ANGLE INSOLATION: THE ANGLE SUNLIGHT HITS THE EARTH
 L.O: THE ANGLE OF INSOLATION ANGLE INSOLATION: THE ANGLE SUNLIGHT HITS THE EARTH 1. The graph below shows air temperatures on a clear summer day from 7 a.m. to 12 noon at two locations, one in Florida
1 What Is Climate? TAKE A LOOK 2. Explain Why do areas near the equator tend to have high temperatures?
 CHAPTER 17 1 What Is Climate? SECTION Climate BEFORE YOU READ After you read this section, you should be able to answer these questions: What is climate? What factors affect climate? How do climates differ
Global Scene Representations. Tilke Judd
 Global Scene Representations Tilke Judd Papers Oliva and Torralba [2001] Fei Fei and Perona [2005] Labzebnik, Schmid and Ponce [2006] Commonalities Goal: Recognize natural scene categories Extract features
Statistical Machine Learning from Data
 Samy Bengio Statistical Machine Learning from Data 1 Statistical Machine Learning from Data Ensembles Samy Bengio IDIAP Research Institute, Martigny, Switzerland, and Ecole Polytechnique Fédérale de Lausanne
Himawari-8 True Color RGB
 Himawari-8 True Color RGB Meteorological Satellite Center, JMA Ver. 20150519 What s True Color RGB? R : B03(VS 0.64) G : B02(V2 0.51) 2015-03-17 00UTC B : B01(V1 0.46) Components of True Color RGB Channel
An Automated Object-Oriented Satellite Image Classification Method Integrating the FAO Land Cover Classification System (LCCS).
.") An Automated Object-Oriented Satellite Image Classification Method Integrating the FAO Land Cover Classification System (LCCS). Ruvimbo Gamanya Sibanda Prof. Dr. Philippe De Maeyer Prof. Dr. Morgan De
An Automated Object-Oriented Satellite Image Classification Method Integrating the FAO Land Cover Classification System (LCCS). Ruvimbo Gamanya Sibanda Prof. Dr. Philippe De Maeyer Prof. Dr. Morgan De
SEA ICE PREDICTION NETWORK (SIPN) Pan-Arctic Sea Ice Outlook Core Contributions July 2015 Report
 Pan-Arctic Sea Ice Outlook Core Contributions July 2015 Report") 1. Contributor Name(s)/Group SEA ICE PREDICTION NETWORK (SIPN) Pan-Arctic Sea Ice Outlook Core Contributions July 2015 Report Naval Research Laboratory (NRL), Stennis Space Center, MS The NRL Sea Ice Team
1. Contributor Name(s)/Group SEA ICE PREDICTION NETWORK (SIPN) Pan-Arctic Sea Ice Outlook Core Contributions July 2015 Report Naval Research Laboratory (NRL), Stennis Space Center, MS The NRL Sea Ice Team