Data Entry. Getting coordinates and attributes into our GIS
|
|
|
- Hector Carpenter
- 5 years ago
- Views:
Transcription
1 Data Entry Getting coordinates and attributes into our GIS

2 How we used to collect spatial data

3 How we collect spatial data now
4 DATA SOURCES, INPUT, AND OUTPUT Manually digitizing from image or map sources manually drawn maps legal records coordinate lists with associated tabular data Aerial photographs Field coordinate measurement Coordinate Surveying GPS Image data Manual or automated classification direct raster data entry


5 Field Measurement Coordinate Surveying GPS (courtesy NGS)


6 Satellite and Aerial Imagery Image Data Spatial Data in a GIS

 features Minimum Mapping Unit (MMU) On-screen, from")
7 Manual Digitizing Hardcopy Map On screen or on a digitizing tablet Connect the dots Digitize each point once Digitize each line segment once Combine line segments to create area (polygon) features Minimum Mapping Unit (MMU) On-screen, from digital image


8 Hardcopy Maps Fixed on Permanent Media
9 Some Preliminaries Map Parts
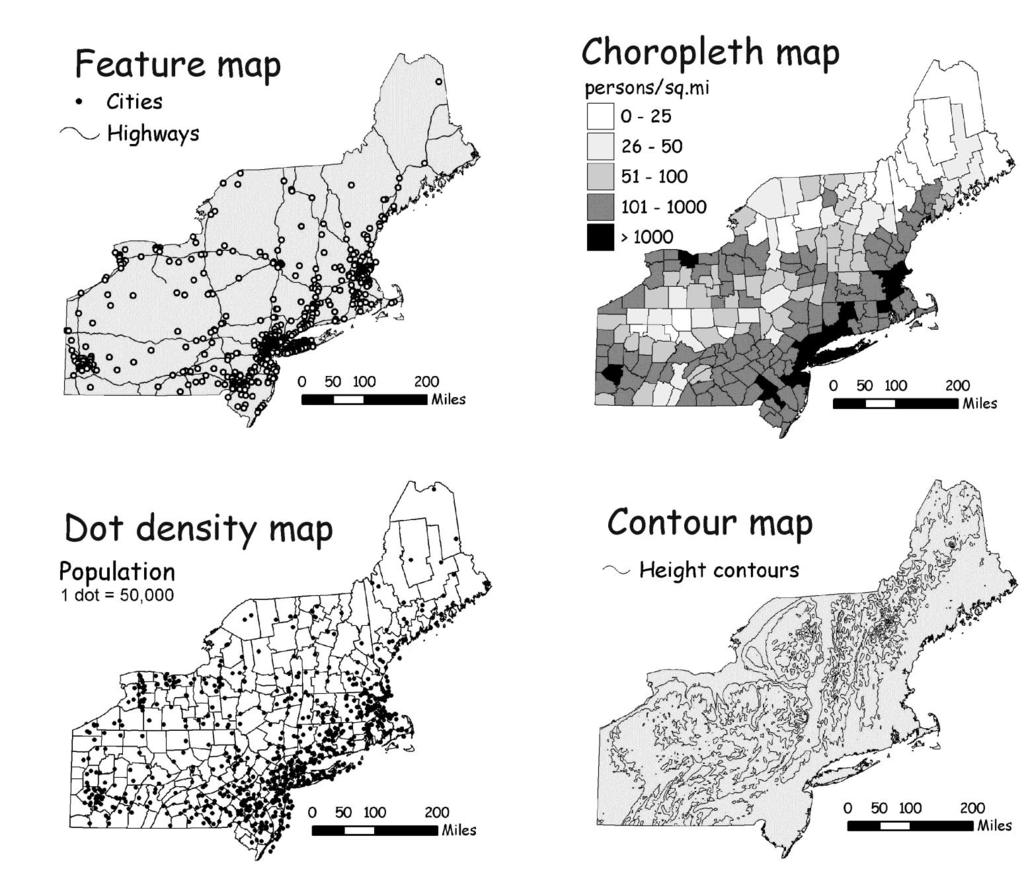
10 Map Type

11 Map Scale The ratio of : a distance on a map to a distance on the ground Commonly reported as a: Unitless ratio : 1: 100,000 Unit ratio : e.g., four inches to one mile Scale bar:
12 Common Map Scale Confusion People often say "large scale" map when they mean "large area". Map scale is a number, a ratio of sizes, that is a fraction, e.g., 1:100,000 scale. As a number this is A large scale map is one where the fraction is large. This happens when the denominator (bottom number) is small. Example: 1 to 1 million map scale (1:1,000,000) expressed as a fraction is ; a 1:200 map scale, expressed as a fraction, is Which is the larger scale, , or 0.005?
13 Common Map Scale Misperception If you have two map sheets which are 10 inches across, the 1:1,000,000 map (which is small scale) covers a distance of 10,000,000 inches The 1:200 map (large scale) covers about 200*10=2000 inches. Remember, larger scale maps cover less area, but show more detail.

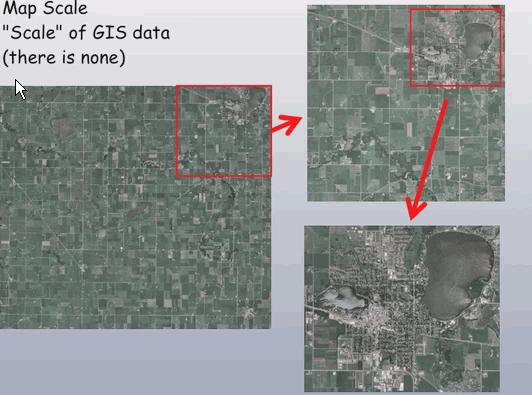
14 Which image has the larger scale?

15 Larger Scale View Smaller Scale View
16 Map Scale "Scale" of GIS data Digital spatial data have no scale. An input map had a scale, but many data don't come from maps, e.g., GPS data. Spatial data in a GIS may be displayed on-screen at a broad ranges of scales there is no one scale. We must think of a source scale, if it exists And A display scale, the ratio of ground to on screen size
17
18 Determining Scale on Source Materials If map scale is not available, the best method is to measure paired distances, e.g., the distance between two road intersections on the map is 4.3 cm, field measurements between the same two road intersections shows the distance to be 1220 meters. The scale of the map is then map distance / ground distance, or { 4.3cm *1m/100cm } / 1220 m or / 1,220 = 1 / 28,372
19 Concept of grain size or resolution of spatial data and the extent of spatial data Grain size is the small thing you can discern and geographically place in the data Extent is the area covered
20 Spatial Data Input from Hardcopy Sources Common Input Methods: manual digitizing, automatic map scanning, text scanning format conversion
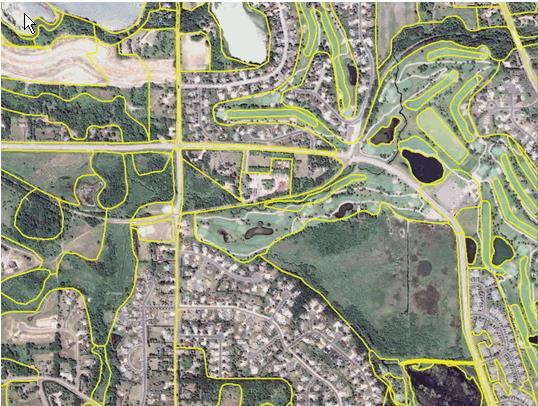
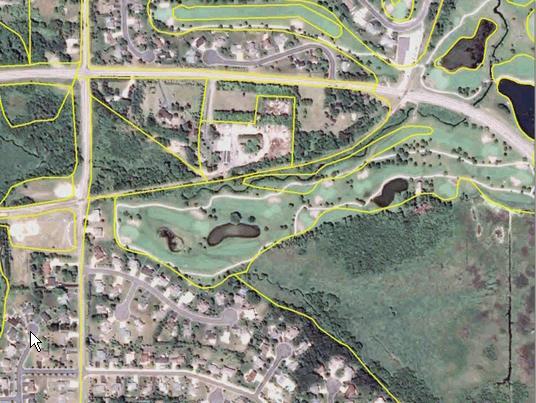
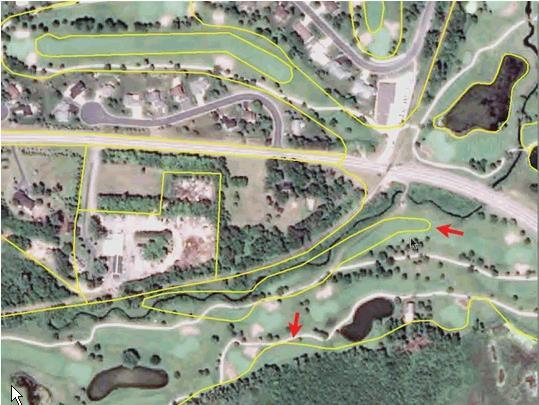
21 Manual Digitizing Tracing the location of important coordinates Done from an image or map source

22 Manual Digitization Connect the dots - lines or points with an electrically sensitized puck. Wire grid typically used to identify puck location on tablet Puck location recorded relative to an arbitrary table coordinate system Points locations are signaled by pressing buttons on the puck Accuracies of between 0.01 and inches
23 Manual Digitizing Process from digital image: 1. Scan map or image 2. If image not referenced, collect ground coordinates of control points 3. Digitize control points (tics, reference points, etc.) of known location 4. Transform (register) image to known coordinate system 5. Digitize feature boundaries in stream or point mode 6. Proof, edit linework 7. Re-edit, as necessary

24 Digitize Primarily from Cartometric Images Taken with specialized cameras, from specialized planes Control based on coordinate surveys
25 Digitize Primarily from Cartometric Maps Based on coordinate surveys Plotted and printed carefully
26 Manual Map Digitization, Pros and Cons Advantages low cost poor quality maps (much editing, interpretation) short training intervals ease in frequent quality testing device ubiquity Disdvantages upper limit on precision poor quality maps (much editing, interpretation) short training intervals ease in frequent quality testing device ubiquity
27 DATA SOURCES, INPUT, AND OUTPUT Problems with source maps: Dimensional stability (shrink, swell, folds) Boundary or tiling problems Maps are abstractions of Reality Features are generalized: classified (e.g., not all wetlands are alike) simplified (lakes, streams, and towns in a scale example) moved (offsets in plotting) exaggerated (buildings, line roadwidths, etc).

28 Map Generalization: An Example 1:24,000 scale map 1:250,000 scale map
29 Types of Map Generalization Truth Grouped Exaggerated True Scale Road Width Road Road Standard Symbol Road Width Offset Omitted Categorized water marsh water fen Road Road swamp fen water fen
30 Look for generalizations
31 Look for generalizations
32 Manual Digitizing nodes at line endpoints vertices define line shape
33 Digitizing Accuracy
34 Manual Digitizing common errors that require editing
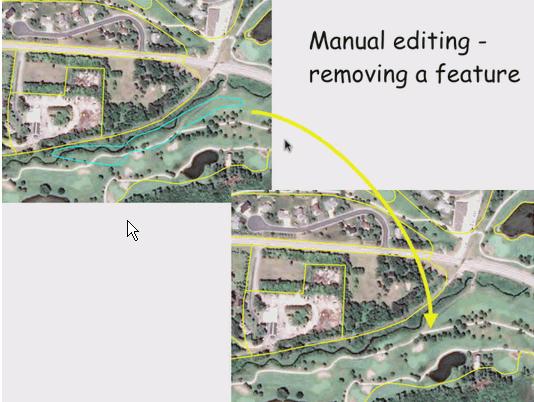
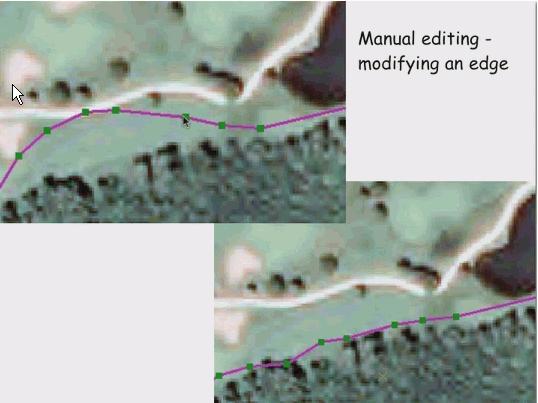
35 Editing Manual editing: Line and point locations are adjusted on a graphic display, pointing and clicking with a mouse or keyboard. Most controlled, most time-consuming. Interactive rubbersheeting: Anchor points are selected, again on the graphics screen, and other points selected and dragged around the screen. All lines and points except the anchor points are interactively adjusted.
36 Correcting errors
37
38
39 Editing Attribute consistency analysis: Identify contradictory theme types in different data layers, and resolve Line snapping: When a vertex or node is close to a line or end point, the lines are snapped together Point snapping: Points which fall within a specified distance of each other are snapped (typically, on point eliminated).
40 Snapping
41 Manual Digitizing Vertex Density
42 To Few Vertices Spline Interpolation Create smooth, curving lines by fitting piecewise polynomial functions
43 Line Thinning
44 Common problem: Features which occur on several different maps rarely have the same position on each map What to do? 1. Re-drafting the data from conflicting sources onto the same base map, or 2. Establish a "master" boundary, and redraft map or copy after digitizing
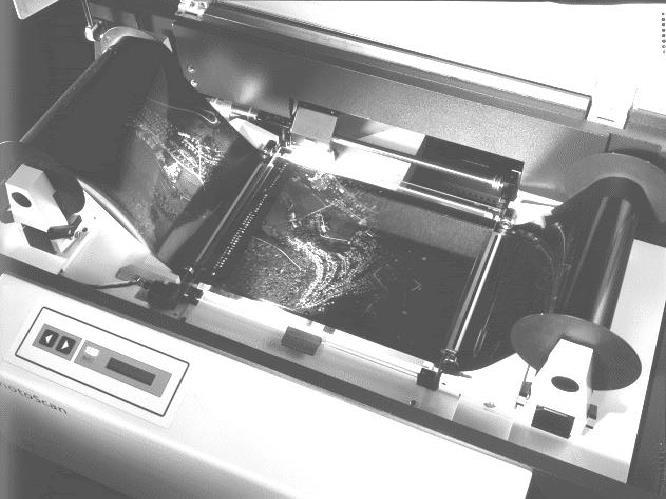
45 Digitizing Maps - Automated Scanners Main alternative to manual digitizing for hardcopy maps Range of scanner qualities, geometric fidelity should be verified Most maps are now available digitally however many began life as paper maps
46
47 Digitizing Maps - Automated Scanners Suitable threshholding allows determination of line or point features from the hardcopy map. Scanners work best when very clean map materials are available. Significant editing still required (thinning, removing unwanted features)

48 Cell Thinning and Vectorizing After Scan-Digitizing
49 Map Data Entry Summary Manual digitizing and scanning, Use cartometric maps at correct scale Ensure appropriate map type, generalization Line/node digitizing, with snapping, thinning, and editing
DATA SOURCES AND INPUT IN GIS. By Prof. A. Balasubramanian Centre for Advanced Studies in Earth Science, University of Mysore, Mysore
 DATA SOURCES AND INPUT IN GIS By Prof. A. Balasubramanian Centre for Advanced Studies in Earth Science, University of Mysore, Mysore 1 1. GIS stands for 'Geographic Information System'. It is a computer-based
Lecture 9: Reference Maps & Aerial Photography
 Lecture 9: Reference Maps & Aerial Photography I. Overview of Reference and Topographic Maps There are two basic types of maps? Reference Maps - General purpose maps & Thematic Maps - maps made for a specific
Projections & GIS Data Collection: An Overview
 Projections & GIS Data Collection: An Overview Projections Primary data capture Secondary data capture Data transfer Capturing attribute data Managing a data capture project Geodesy Basics for Geospatial
Photographs to Maps Using Aerial Photographs to Create Land Cover Maps
 Aerial photographs are an important source of information for maps, especially land cover and land use maps. Using ArcView, a map composed of points, lines, and areas (vector data) can be constructed from
GIS (GEOGRAPHIC INFORMATION SYSTEMS)
") GIS (GEOGRAPHIC INFORMATION SYSTEMS) 1 1. DEFINITION SYSTEM Any organised assembly of resources and procedures united and regulated by interaction or interdependence to complete a set of specific functions.
GIS (GEOGRAPHIC INFORMATION SYSTEMS) 1 1. DEFINITION SYSTEM Any organised assembly of resources and procedures united and regulated by interaction or interdependence to complete a set of specific functions.
Lab 1: Importing Data, Rectification, Datums, Projections, and Coordinate Systems
 Lab 1: Importing Data, Rectification, Datums, Projections, and Coordinate Systems Topics covered in this lab: i. Importing spatial data to TAS ii. Rectification iii. Conversion from latitude/longitude
Introduction to GIS - 2
 Introduction to GIS - 2 Outline Using GIS Representation of spatial objects in GIS Prof. D. Nagesh Kumar Department of Civil Engineering Indian Institute of Science Bangalore 560 012, India http://www.civil.iisc.ernet.in/~nagesh
INDOT Office of Traffic Safety
 Intro to GIS Spatial Analysis INDOT Office of Traffic Safety Intro to GIS Spatial Analysis INDOT Office of Traffic Safety Kevin Knoke Section 130 Program Manager Highway Engineer II Registered Professional
Geography 38/42:376 GIS II. Topic 1: Spatial Data Representation and an Introduction to Geodatabases. The Nature of Geographic Data
 Geography 38/42:376 GIS II Topic 1: Spatial Data Representation and an Introduction to Geodatabases Chapters 3 & 4: Chang (Chapter 4: DeMers) The Nature of Geographic Data Features or phenomena occur as
Introduction to GIS I
 Introduction to GIS Introduction How to answer geographical questions such as follows: What is the population of a particular city? What are the characteristics of the soils in a particular land parcel?
Lab 1: Importing Data, Rectification, Datums, Projections, and Output (Mapping)
") Lab 1: Importing Data, Rectification, Datums, Projections, and Output (Mapping) Topics covered in this lab: i. Importing spatial data to TAS ii. Rectification iii. Conversion from latitude/longitude to
Lab 1: Importing Data, Rectification, Datums, Projections, and Output (Mapping) Topics covered in this lab: i. Importing spatial data to TAS ii. Rectification iii. Conversion from latitude/longitude to
Chapter 02 Maps. Multiple Choice Questions
 Chapter 02 Maps Multiple Choice Questions 1. Every projection has some degree of distortion because A. a curved surface cannot be represented on a flat surface without distortion. B. parallels and meridians
LECTURE NOTES ON REMOTE SENSING & GIS IV B. Tech II semester (JNTU (A)-R13)
-R13)") LECTURE NOTES ON IV B. Tech II semester (JNTU (A)-R13) C.THEJASWINI VEENA Assistant Professor G.PULLAIAH COLLEGE OF ENGINEERING AND TECHNOLOGY CIVIL ENGINEERING BY C.THEJASWINI VEENA Page 1 OBJECTIVES:
LECTURE NOTES ON IV B. Tech II semester (JNTU (A)-R13) C.THEJASWINI VEENA Assistant Professor G.PULLAIAH COLLEGE OF ENGINEERING AND TECHNOLOGY CIVIL ENGINEERING BY C.THEJASWINI VEENA Page 1 OBJECTIVES:
Lecture 5. GIS Data Capture & Editing. Tomislav Sapic GIS Technologist Faculty of Natural Resources Management Lakehead University
 Lecture 5 GIS Data Capture & Editing Tomislav Sapic GIS Technologist Faculty of Natural Resources Management Lakehead University GIS Data Input Surveying/GPS Data capture Facilitate data capture Final
3 SHORELINE CLASSIFICATION METHODOLOGY
 3 SHORELINE CLASSIFICATION METHODOLOGY Introduction The ESI scale, as described in Section 2, categorizes coastal habitats in terms of their susceptibility to spilled oil, taking into consideration a number
Introduction-Overview. Why use a GIS? What can a GIS do? Spatial (coordinate) data model Relational (tabular) data model
 data model Relational (tabular) data model") Introduction-Overview Why use a GIS? What can a GIS do? How does a GIS work? GIS definitions Spatial (coordinate) data model Relational (tabular) data model intro_gis.ppt 1 Why use a GIS? An extension
Introduction-Overview Why use a GIS? What can a GIS do? How does a GIS work? GIS definitions Spatial (coordinate) data model Relational (tabular) data model intro_gis.ppt 1 Why use a GIS? An extension
Lecture 7: GIS Data Capture and Metadata
 Lecture 7: GIS Data Capture and Metadata Section I: Overview of GIS Data Capture As you read this lecture think about the type of data capture and how metadata can help with your final project. Introduction
An Introduction to Geographic Information System
 An Introduction to Geographic Information System PROF. Dr. Yuji MURAYAMA Khun Kyaw Aung Hein 1 July 21,2010 GIS: A Formal Definition A system for capturing, storing, checking, Integrating, manipulating,
What are the five components of a GIS? A typically GIS consists of five elements: - Hardware, Software, Data, People and Procedures (Work Flows)
") LECTURE 1 - INTRODUCTION TO GIS Section I - GIS versus GPS What is a geographic information system (GIS)? GIS can be defined as a computerized application that combines an interactive map with a database
LECTURE 1 - INTRODUCTION TO GIS Section I - GIS versus GPS What is a geographic information system (GIS)? GIS can be defined as a computerized application that combines an interactive map with a database
GIS Generalization Dr. Zakaria Yehia Ahmed GIS Consultant Ain Shams University Tel: Mobile:
 GIS Generalization Dr. Zakaria Yehia Ahmed GIS Consultant Ain Shams University Tel: 24534976 Mobile: 01223384254 zyehia2005@yahoo.com Abstract GIS Generalization makes data less-detailed and less-complex
INTRODUCTION TO GEOGRAPHIC INFORMATION SYSTEM By Reshma H. Patil
 INTRODUCTION TO GEOGRAPHIC INFORMATION SYSTEM By Reshma H. Patil ABSTRACT:- The geographical information system (GIS) is Computer system for capturing, storing, querying analyzing, and displaying geospatial
Data Creation and Editing
 11.520:A Workshop on Geographical Information Systems 1.188: Urban Planning and Social Science Laboratory Data Creation and Editing Based in part on notes by Prof. Joseph Ferreira and Michael Flaxman Lulu
NR402 GIS Applications in Natural Resources
 NR402 GIS Applications in Natural Resources Lesson 1 Introduction to GIS Eva Strand, University of Idaho Map of the Pacific Northwest from http://www.or.blm.gov/gis/ Welcome to NR402 GIS Applications in
Louisiana Transportation Engineering Conference. Monday, February 12, 2007
 Louisiana Transportation Engineering Conference Monday, February 12, 2007 Agenda Project Background Goal of EIS Why Use GIS? What is GIS? How used on this Project Other site selection tools I-69 Corridor
Give 4 advantages of using ICT in the collection of data. Give. Give 4 disadvantages in the use of ICT in the collection of data
 Give 4 advantages of using ICT in the collection of data can use a handheld GPS to get accurate location information which can be used to show data linked to specific locations within a GIS can collect
Electric Fields and Equipotentials
 Electric Fields and Equipotentials Note: There is a lot to do in this lab. If you waste time doing the first parts, you will not have time to do later ones. Please read this handout before you come to
Key Issue #1. How do geographers describe where things are? 2014 Pearson Education, Inc.
 Key Issue #1 How do geographers describe where things are? Learning Outcomes 1.1.1: Explain differences between early maps and contemporary maps. 1.1.2: Describe the role of map scale and projections and
GIS = Geographic Information Systems;
 What is GIS GIS = Geographic Information Systems; What Information are we talking about? Information about anything that has a place (e.g. locations of features, address of people) on Earth s surface,
Geographers Perspectives on the World
 What is Geography? Geography is not just about city and country names Geography is not just about population and growth Geography is not just about rivers and mountains Geography is a broad field that
ESRI* Object Models; Data Capture
 ESRI* Object Models; Data Capture * Environmental Systems Research Institute Feature Class (spatial table) Number Age_Ma 1_sigma Rx_Type Size_kg 123 124 125 142 1.5 B_schist 136 2.0 G_schist Object Class
The details represented in the map depends mostly on the scale at which the map is designed.
 Measurement IN GIS A map is a visual representation of an area a symbolic depiction highlighting relationships between elements of that space such as objects, region, themes. The details represented in
Map My Property User Guide
 Map My Property User Guide Map My Property Table of Contents About Map My Property... 2 Accessing Map My Property... 2 Links... 3 Navigating the Map... 3 Navigating to a Specific Location... 3 Zooming
ESRI Object Models and Data Capture 2/1/2018
 Number 123 124 125 ESRI* Object Models; Data Capture Feature Class (spatial table) Age_Ma 142 136 1_sigma 1.5 2.0 Rx_Type B_schist G_schist Object Class (nonspatial table) Size_kg 3.4 1.3 Y Control Point
Overview key concepts and terms (based on the textbook Chang 2006 and the practical manual)
") Introduction Geo-information Science (GRS-10306) Overview key concepts and terms (based on the textbook 2006 and the practical manual) Introduction Chapter 1 Geographic information system (GIS) Geographically
Introduction Geo-information Science (GRS-10306) Overview key concepts and terms (based on the textbook 2006 and the practical manual) Introduction Chapter 1 Geographic information system (GIS) Geographically
Welcome to NR502 GIS Applications in Natural Resources. You can take this course for 1 or 2 credits. There is also an option for 3 credits.
 Welcome to NR502 GIS Applications in Natural Resources. You can take this course for 1 or 2 credits. There is also an option for 3 credits. The 1st credit consists of a series of readings, demonstration,
Landmark LRM. MM and RefPts can be same or different
 1 2 This project began in the fall of 2005. At the time CDOT had three different business units maintaining different LRS s. That is, the beginning and ending reference points and the measured length of
The Shrinking Aral Sea
 The Shrinking Aral Sea Practical equipment: A4 Printed copies of satellite images of Aral Sea (15 images total) A4 transparency printed with 5mm grid squares (15 copies) Equipment for producing a graph
NR402 GIS Applications in Natural Resources. Lesson 9: Scale and Accuracy
 NR402 GIS Applications in Natural Resources Lesson 9: Scale and Accuracy 1 Map scale Map scale specifies the amount of reduction between the real world and the map The map scale specifies how much the
Digital Tax Maps Westport Island Project Summary
 Digital Tax Maps Westport Island Project Summary Presented to the: Mid-Coast Regional Planning Commission Creating GIS-Based Digital Tax Maps And Linked Assessment Records For Small Towns on a Budget Dennis
ESRI* Object Models; Data Capture
 ESRI* Object Models; Data Capture * Environmental Systems Research Institute Feature Class (spatial table) Number Age_Ma 1_sigma Rx_Type Size_kg 123 124 125 142 1.5 B_schist 136 2.0 G_schist Object Class
Techniques for Science Teachers: Using GIS in Science Classrooms.
 Techniques for Science Teachers: Using GIS in Science Classrooms. After ESRI, 2008 GIS A Geographic Information System A collection of computer hardware, software, and geographic data used together for
Geographic Information Systems. Introduction to Data and Data Sources
 Geographic Information Systems Introduction to Data and Data Sources Presented by John Showler, NJDA-SSCC NJ SCD GIS Training Session December 10, 209 The Objectives of this session are 3-fold: 1. Introduce
ESRI Object Models and Data Capture 9/18/ /18/2014 M. Helper GEO327G/386G, UT Austin 2. ESRI Arc/Info ArcView ArcGIS
 ESRI Object Models; Data Capture Conceptual Models Conceptual Models Characterized all features or phenomena as: Feature Class (spatial table) Number Age_Ma 1_sigma Rx_Type 123 142 1.5 B_schist 124 136
Week 8 Cookbook: Review and Reflection
 : Review and Reflection Week 8 Overview 8.1) Review and Reflection 8.2) Making Intelligent Maps: The map sheet as a blank canvas 8.3) Making Intelligent Maps: Base layers and analysis layers 8.4) ArcGIS
EXPLANATION OF G.I.S. PROJECT ALAMEIN FOR WEB PUBLISHING
 EXPLANATION OF G.I.S. PROJECT ALAMEIN FOR WEB PUBLISHING Compilato: Andrea De Felici Rivisto: Approvato: Daniele Moretto ARIDO S President Versione: 1.0 Distribuito: 28/06/2013 1 TABLE OF CONTENTS 1. INTRODUCTION..3
Field data acquisition
 Lesson : Primary sources Unit 3: Field data B-DC Lesson / Unit 3 Claude Collet D Department of Geosciences - Geography Content of Lesson Unit 1: Unit : Unit 3: Unit 4: Digital sources Remote sensing Field
Mapping Earth. How are Earth s surface features measured and modeled?
 Name Mapping Earth How are Earth s surface features measured and modeled? Before You Read Before you read the chapter, think about what you know about maps Record your thoughts in the first column Pair
INSTITUTE OF AERONAUTICAL ENGINEERING (Autonomous) Dundigal, Hyderabad
 Dundigal, Hyderabad") INSTITUTE OF AERONAUTICAL ENGINEERING (Autonomous) Dundigal, Hyderabad -00 0 CIVIL ENGINEERING TUTORIAL QUESTION BANK Course Name : Remote Sensing and GIS Course Code : A00 Class : IV B. Tech I Semester
INSTITUTE OF AERONAUTICAL ENGINEERING (Autonomous) Dundigal, Hyderabad -00 0 CIVIL ENGINEERING TUTORIAL QUESTION BANK Course Name : Remote Sensing and GIS Course Code : A00 Class : IV B. Tech I Semester
How many states. Record high temperature
 Record high temperature How many states Class Midpoint Label 94.5 99.5 94.5-99.5 0 97 99.5 104.5 99.5-104.5 2 102 102 104.5 109.5 104.5-109.5 8 107 107 109.5 114.5 109.5-114.5 18 112 112 114.5 119.5 114.5-119.5
Quality and Coverage of Data Sources
 Quality and Coverage of Data Sources Objectives Selecting an appropriate source for each item of information to be stored in the GIS database is very important for GIS Data Capture. Selection of quality
A Semi-Automatic Spatial Feature Extraction Tool for Minimising Errors in GIS Data Capture*
 A Semi-Automatic Spatial Feature Extraction Tool for Minimising Errors in GIS Data Capture* 1 S. Mantey and 1 N. D. Tagoe 1 University of Mines and Technology, Box 237, Tarkwa, Ghana Mantey, S. and Tagoe,
THE NEW TECHNOLOGICAL ADVANCES IN CARTOGRAPHY
 Distr.: LIMITED ECA/NRD/CART. 9/ETH. 6 October 1996 Original: ENGLISH Ninth United Nations Regional Cartographic Conference for Africa Addis Ababa, Ethiopia 11-15 November 1996 THE NEW TECHNOLOGICAL ADVANCES
Utilization and Provision of Geographical Name Information on the Basic Map of Japan*
 UNITED NATIONS WORKING PAPER GROUP OF EXPERTS NO. 1/9 ON GEOGRAPHICAL NAMES Twenty-eight session 28 April 2 May 2014 Item 9 of the Provisional Agenda Activities relating to the Working Group on Toponymic
Spacetime Diagrams Lab Exercise
 Spacetime Diagrams Lab Exercise The spacetime diagram (also known as a Minkowski diagram) is a tool that can used to graphically describe complex problems in special relativity. In many cases, with a properly
LAB 2 - ONE DIMENSIONAL MOTION
 Name Date Partners L02-1 LAB 2 - ONE DIMENSIONAL MOTION OBJECTIVES Slow and steady wins the race. Aesop s fable: The Hare and the Tortoise To learn how to use a motion detector and gain more familiarity
Chapter 3A -- Rectangular Coordinate System
 Fry Texas A&M University! Fall 2016! Math 150 Notes! Section 3A! Page61 Chapter 3A -- Rectangular Coordinate System A is any set of ordered pairs of real numbers. A relation can be finite: {(-3, 1), (-3,
USING GIS IN WATER SUPPLY AND SEWER MODELLING AND MANAGEMENT
 USING GIS IN WATER SUPPLY AND SEWER MODELLING AND MANAGEMENT HENRIETTE TAMAŠAUSKAS*, L.C. LARSEN, O. MARK DHI Water and Environment, Agern Allé 5 2970 Hørsholm, Denmark *Corresponding author, e-mail: htt@dhigroup.com
Copyright The McGraw-Hill Companies, Inc. Permission required for reproduction or display.
 CHAPTER 5 GIS DATA Acquisition 5.1 Existing GIS Data 5.1.1 Federal Geographic Data Committee 5.1.2 Geospatial One-Stop Box 5.1 Clearinghouse and Portal 5.1.3 U.S. Geological Survey 5.1.4 U.S. Census Bureau
Introduction to Uncertainty and Treatment of Data
 Introduction to Uncertainty and Treatment of Data Introduction The purpose of this experiment is to familiarize the student with some of the instruments used in making measurements in the physics laboratory,
Syllabus Reminders. Geographic Information Systems. Components of GIS. Lecture 1 Outline. Lecture 1 Introduction to Geographic Information Systems
 Syllabus Reminders Geographic Information s Lecture Introduction to Geographic Information s. Class Info: www.saigis.com/class/ 2. Office T / TH (8:00-9:30 a.m.) and (2:30 3:30pm) or Appt 3. Email: burgerpr@unk.edu
Raster Spatial Analysis Specific Theory
 RSATheory.doc 1 Raster Spatial Analysis Specific Theory... 1 Spatial resampling... 1 Mosaic... 3 Reclassification... 4 Slicing... 4 Zonal Operations... 5 References... 5 Raster Spatial Analysis Specific
Chapter 1. GIS Fundamentals
 1. GIS Overview Chapter 1. GIS Fundamentals GIS refers to three integrated parts. Geographic: Of the real world; the spatial realities, the geography. Information: Data and information; their meaning and
SPATIAL DATA QUALITY
 SPATIAL DATA QUALITY Tauqueer Ahmad I.A.S.R.I., New Delhi -110012 1. Introduction GIS developers and users have paid little attention to the problems caused by error, inaccuracy and imprecision in spatial
Teaching GIS for Land Surveying
 Teaching GIS for Land Surveying Zhanjing (John) Yu Evergreen Valley College, San Jose, California James Crossfield California State University at Fresno, Fresno California 7/13/2006 1 Outline of the Presentation
Lecture 2. A Review: Geographic Information Systems & ArcGIS Basics
 Lecture 2 A Review: Geographic Information Systems & ArcGIS Basics GIS Overview Types of Maps Symbolization & Classification Map Elements GIS Data Models Coordinate Systems and Projections Scale Geodatabases
GEO-DATA INPUT AND CONVERSION. Christos G. Karydas,, Dr. Lab of Remote Sensing and GIS Director: Prof. N. Silleos
 Christos G. Karydas,, Dr. xkarydas@agro.auth.gr http://users.auth.gr/xkarydas Lab of Remote Sensing and GIS Director: Prof. N. Silleos School of Agriculture Aristotle University of Thessaloniki, GR 1 0.
Theory, Concepts and Terminology
 GIS Workshop: Theory, Concepts and Terminology 1 Theory, Concepts and Terminology Suggestion: Have Maptitude with a map open on computer so that we can refer to it for specific menu and interface items.
not to be republished NCERT What is Spatial Information Technology?
 You know that the computers enhance our capabilities in data processing and in drawing graphs, diagrams and maps (Refer Chapter 4 of the present book). The disciplines that deals with the principles and
THE EVOLUTION OF RASTER PROCESSING TECHNOLOGY WITHIN THE CARTOGRAPHIC ENVIRONMENT
 THE EVOLUTION OF RASTER PROCESSING TECHNOLOGY WITHIN THE CARTOGRAPHIC ENVIRONMENT David A. Kolassa Synectics Corporation 310 E. Chestnut Street Rome, NY 13440 BIOGRAPHICAL SKETCH Mr. Kolassa received a
Digitization in a Census
 Topics Connectivity of Geographic Data Sketch Maps Data Organization and Geodatabases Managing a Digitization Project Quality and Control Topology Metadata 1 Topics (continued) Interactive Selection Snapping
Steve Pietersen Office Telephone No
 Steve Pietersen Steve.Pieterson@durban.gov.za Office Telephone No. 031 311 8655 Overview Why geography matters The power of GIS EWS GIS water stats EWS GIS sanitation stats How to build a GIS system EWS
Multiple Representations with Overrides, and their relationship to DLM/DCM Generalization. Paul Hardy Dan Lee
 Multiple Representations with Overrides, and their relationship to DLM/DCM Generalization Paul Hardy Dan Lee phardy@esri.com dlee@esri.com 1 Context This is a forward-looking presentation, and much of
WHAT IS GIS? Source: Longley et al (2005) Geographic Information Systems and Science. 2nd Edition. John Wiley and Sons Ltd.
 Geographic Information Systems and Science. 2nd Edition. John Wiley and Sons Ltd.") WHAT IS GIS? Geographical Information Systems (GIS) are a special class of information systems that keep track not only of events, activities, and things, but also of where these events, activities, and
WHAT IS GIS? Geographical Information Systems (GIS) are a special class of information systems that keep track not only of events, activities, and things, but also of where these events, activities, and
Lecture 9: Geocoding & Network Analysis
 Massachusetts Institute of Technology - Department of Urban Studies and Planning 11.520: A Workshop on Geographic Information Systems 11.188: Urban Planning and Social Science Laboratory Lecture 9: Geocoding
In this exercise we will learn how to use the analysis tools in ArcGIS with vector and raster data to further examine potential building sites.
 GIS Level 2 In the Introduction to GIS workshop we filtered data and visually examined it to determine where to potentially build a new mixed use facility. In order to get a low interest loan, the building
Catchment Delineation Workflow
 Catchment Delineation Workflow Slide 1 Given is a GPS point (Lat./Long.) for an outlet location. The outlet could be a proposed Dam site, a storm water drainage culvert on a rural highway, or any other
A BASE SYSTEM FOR MICRO TRAFFIC SIMULATION USING THE GEOGRAPHICAL INFORMATION DATABASE
 A BASE SYSTEM FOR MICRO TRAFFIC SIMULATION USING THE GEOGRAPHICAL INFORMATION DATABASE Yan LI Ritsumeikan Asia Pacific University E-mail: yanli@apu.ac.jp 1 INTRODUCTION In the recent years, with the rapid
Hydric Rating by Map Unit Ocean County, New Jersey (Larsen & N New Prospect Jackson Twp., NJ)
") 74 16' 14'' W Hydric Rating by Map Unit Ocean County, New Jersey ( ) 74 15' 50'' W 40 9' 17'' N 40 8' 53'' N 4444460 4444550 4444640 4444730 4444820 4444910 4445000 4445090 4445180 562120 562210 562300
74 16' 14'' W Hydric Rating by Map Unit Ocean County, New Jersey ( ) 74 15' 50'' W 40 9' 17'' N 40 8' 53'' N 4444460 4444550 4444640 4444730 4444820 4444910 4445000 4445090 4445180 562120 562210 562300
Lesson Plan 2 - Middle and High School Land Use and Land Cover Introduction. Understanding Land Use and Land Cover using Google Earth
 Understanding Land Use and Land Cover using Google Earth Image an image is a representation of reality. It can be a sketch, a painting, a photograph, or some other graphic representation such as satellite
Abstract. Keywords: Geographic information systems and digital data model. 1. Introduction
 Abstract GISMO - A Geographical Information System for a Municipality Office Ramzi A. Haraty and Youssef O. Kaddoura Lebanese American University P.O. Box 13-5053 Chouran Beirut, Lebanon 1102 2801 Email:
Wetland Mapping. Wetland Mapping in the United States. State Wetland Losses 53% in Lower US. Matthew J. Gray University of Tennessee
 Wetland Mapping Caribbean Matthew J. Gray University of Tennessee Wetland Mapping in the United States Shaw and Fredine (1956) National Wetlands Inventory U.S. Fish and Wildlife Service is the principle
1. Origins of Geography
 II. ORIGINS AND BRANCHES OF GEOGRAPHY My Notes A. Origins of Geography Unit One 6 Before carefully examining the tools of the geographer, it would be useful to examine the origins and roots of this ancient
THE QUALITY CONTROL OF VECTOR MAP DATA
 THE QUALITY CONTROL OF VECTOR MAP DATA Wu Fanghua Liu Pingzhi Jincheng Xi an Research Institute of Surveying and Mapping (P.R.China ShanXi Xi an Middle 1 Yanta Road 710054) (e-mail :wufh999@yahoo.com.cn)
THE DIGITAL TERRAIN MAP LIBRARY: AN EXPLORATIONIST S RESOURCE
 THE DIGITAL TERRAIN MAP LIBRARY: AN EXPLORATIONIST S RESOURCE By I.C.L. Webster, P.J. Desjardins and W.E. Kilby KEYWORDS: digital terrain maps, digital terrain stability maps, surficial geology, GIS, raster
Hydric Rating by Map Unit Harrison County, Mississippi
 89 6' 12'' W 89 5' 54'' W 30 28' 47'' N 30 28' 26'' N 3373210 3373290 3373370 3373450 3373530 3373610 3373690 3373770 3373850 298080 298160 298240 298320 298400 298480 298560 30 28' 47'' N Soil Map may
LRS Task Force June 13, REVISION HISTORY
 North Carolina Department of Transportation Geographic Information Systems (GIS) Unit LINEAR REFERENCING SYSTEM (LRS) PROJECT DEFINITION Version 1.0 REVISION HISTORY Date Document Manager Revision Purpose
GIS Data Conversion: Strategies, Techniques, and Management
 GIS Data Conversion: Strategies, Techniques, and Management Pat Hohl, Editor SUB G6ttlngen 208 494219 98 A11838 ONWORD P R E S S V Contents SECTION 1: Introduction 1 Introduction and Overview 3 Ensuring
Electric Fields and Potential
 General Physics Lab 2 Siena College Object Electric Fields and Potential This experiment further explores the electrostatic interaction between charged objects. The concepts of electric field and potential
Spatial Analysis with ArcGIS Pro STUDENT EDITION
 Spatial Analysis with ArcGIS Pro STUDENT EDITION Copyright 2018 Esri All rights reserved. Course version 2.0. Version release date November 2018. Printed in the United States of America. The information
 Boone County GIS has the right to inquire about and investigate the use of any requested products and deny access to anyone based on concerns relating to privacy, security, public health, public safety,
Watershed Modeling Orange County Hydrology Using GIS Data
 v. 10.0 WMS 10.0 Tutorial Watershed Modeling Orange County Hydrology Using GIS Data Learn how to delineate sub-basins and compute soil losses for Orange County (California) hydrologic modeling Objectives
Hydric Rating by Map Unit Harrison County, Mississippi. Web Soil Survey National Cooperative Soil Survey
 89 9' 7'' W 89 8' 38'' W 30 34' 13'' N 30 33' 57'' N 3383480 3383560 3383640 3383720 3383800 3383880 3383960 293640 293720 293800 293880 293960 294040 294120 294200 294280 294360 3383480 3383560 3383640
FNRM 3131 Introduction to GIS in Natural Resource Management
 FNRM 3131 Introduction to GIS in Natural Resource Management Instructors: Andrew C Jenks 215 Green Hall ajenks@umnedu, @acjenks Paul V Bolstad 301H Green Hall pbolstad@umnedu Course Topics Motivation:
Accuracy Input: Improving Spatial Data Accuracy?
 This file was created by scanning the printed publication. Errors identified by the software have been corrected; however, some errors may remain. GPS vs Traditional Methods of Data Accuracy Input: Improving
Electric Fields and Equipotentials
 OBJECTIVE Electric Fields and Equipotentials To study and describe the two-dimensional electric field. To map the location of the equipotential surfaces around charged electrodes. To study the relationship
Lauren Jacob May 6, Tectonics of the Northern Menderes Massif: The Simav Detachment and its relationship to three granite plutons
 Lauren Jacob May 6, 2010 Tectonics of the Northern Menderes Massif: The Simav Detachment and its relationship to three granite plutons I. Introduction: Purpose: While reading through the literature regarding
GEOGRAPHIC INFORMATION SYSTEMS
 GEOGRAPHIC INFORMATION SYSTEMS 4-H Round-Up Community Transitions Workshop Daniel Hanselka June 14, 2011 Goals of the Workshop Answer the question: What is GIS? Uses of GIS. Some of the Common Terminology
Student Activity Sheet- Denali Topo Map
 Student Activity Sheet- Denali Topo Map Directions: Follow the steps in order and answer the associated questions as you proceed through the activity. The first part of the activity will be guided by your
Lab 2. Electric Fields and Potentials
 Physics 2020, Fall 2005 Lab 2 page 1 of 8 Lab 2. Electric Fields and Potentials INTRODUCTION: In class we have learned about electric charges and the electrostatic force that charges exert on each other.
Basics of GIS. by Basudeb Bhatta. Computer Aided Design Centre Department of Computer Science and Engineering Jadavpur University
 Basics of GIS by Basudeb Bhatta Computer Aided Design Centre Department of Computer Science and Engineering Jadavpur University e-governance Training Programme Conducted by National Institute of Electronics