Algorithm User Guide:
|
|
|
- Eleanore Doyle
- 5 years ago
- Views:
Transcription
1 Algorithm User Guide: Nuclear Quantification Use the Aperio algorithms to adjust (tune) the parameters until the quantitative results are sufficiently accurate for the purpose for which you intend to use the algorithm. You will want to test the algorithm on a variety of images so its performance can be evaluated across the full spectrum of expected imaging conditions. To be successful, it is usually necessary to limit the field of application to a particular type of tissue and a specific histological preparation. A more narrowly defined application and consistency in slide preparation generally equates to a higher probability of success in obtaining satisfactory algorithms results. Aperio algorithms provided by Human Tissue Resource Center: Positive Pixel Count Colocalization Color Deconvolution Nuclear Quantification Membrane Quantification Microvessel Analysis Rare Event Detection The Nuclear algorithm detects the nuclear staining for target chromogen for individual cells and quantifies the intensity. It performs the same complex analysis as pathologists and is able to detect positive staining for individual nuclei. This algorithm quantifies nuclei by staining, intensity and provides automatic cytoplasmic stain removal. Each nucleus is classified as 0, 1+, 2+, or 3+. The first 6 input parameters on every macro should NOT be changed. The next 3 parameters (Classifier Neighborhood, Classifier, and Class Lists) are Genie parameters and should be changed. 1
2 1 Algorithm Input Parameters A. Input Parameters for Nuclear Algorithm Averaging Radius Radius (microns) for Noise Reduction [0 < Value < 100]. The radius of a smoothing filter, which reduces noise resulting in smoother object edges. Curvature Threshold Curvature threshold for nuclear de-clustering [0 < Value 25]. Segmentation Type Use nuclear stain, intensity, or cytoplasmic rejection to segment nuclei [0 Nuclear Stain Only, 1 Intensity, 2 Cytoplasmic Rejection]. Nuclear objects are identified using intensity. The staining components are combined into a single intensity image in one of three ways. o Nuclear stain uses the nuclear counter-stain only, after separating and removing other stain components. This works well if counter-staining is dark. o Intensity uses the total intensity, the sum of all staining components. This works best when the counterstaining is very light and cytoplasmic staining is also small. o Cytoplasmic rejection should be used when cytoplasmic staining is present. Analysis is performed on the statistics of the positive staining channel for a bimodal distribution and the lighter mode is removed. Threshold Type Threshold method [0 Amplitude Threshold Method, 1 Edge Threshold Method, 2 Manual Threshold]. A threshold must be applied to the intensity image in order to find the edges of the nuclei. Threshold type specifies the method to be used to determine the intensity thresholds. o The amplitude threshold method automatically adjusts the threshold according the mean intensity of all pixels. The threshold is set to one sigma above the mean, which is an approximation to reject background staining. o The edge threshold method automatically adjusts the threshold according to the mean of edge pixels. The algorithm uses an edge finding method to identify edge pixels and uses the average of these pixel values to determine the threshold. o The manual threshold method is the simplest method, which uses the prescribed intensity thresholds (lower and upper below) to eliminate unwanted background. This method will not automatically adjust to compensate for lighter or darker staining between slides. Note that an intensity value of 0 corresponds to black and a value of 255 to white (as bright as possible). Edge Trimming Trim light edges of objects [0 None, 1 Weighted, 2 Unweighted]. This parameter allows the light edges of nuclei with dark centers to be removed. Histogram analysis is done and a threshold is automatically set using bimodal analysis. o None disables the method and no edge trimming will be done. o Weighted weights the threshold by a quality factor which judges the quality of the analysis. Histograms which are not bimodal will then not do very much edge trimming. o Unweighted gives the largest effect and uses the full threshold estimate. Lower Threshold Lower limit for intensity thresholding [0 < Value 255]. This value can be changed when using the manual threshold type. Since very dark nuclei are possible, a value of 0 is usually used. Increasing this value will ignore very dark pixels. Upper Threshold Upper limit for intensity thresholding [0 < Value 255]. This value can be changed when using the manual threshold type. A large value (e.g., 240) represents very faintly stained pixels. Lowering this value to 200 will ignore faintly stained pixels and require nuclear pixels to have lower intensities (darker). Min Nuclear Size Minimum area for detectable nuclei (micron-squared) [Value > 0]. Nuclei smaller than this area limit will not be counted. Max Nuclear Size Maximum area for detectable nuclei (micron-squared) [Value > 0]. Nuclei larger than this area limit will not be counted. Min Roundness Nuclei with roundness less than this are not reported [0 Value 1]. Roundness is the ratio of the object area to the area of a circle that fully encloses that object. Circular objects will have a value of 1. Small values indicate non-circular objects. 2
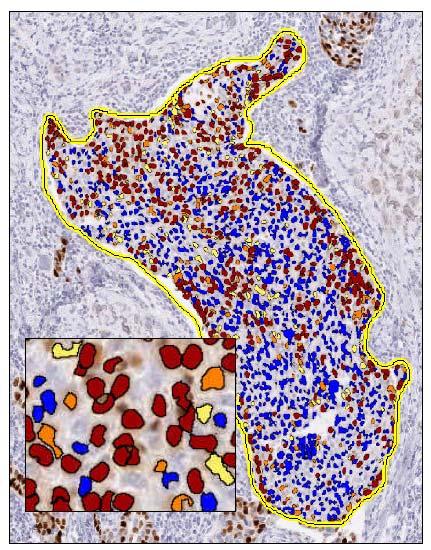
3 Min Compactness Nuclei with compactness less than this are not reported [0 Value 1]. Compactness is the ratio of area of the object to the area of a circle that has a circumference equal to the perimeter of the object. Circular objects will have a value of 1. Small values indicate noncircular objects. Min Elongation Nuclei with aspect ratios less than this are not reported [0 Value 1]. Remove Light Objects Value = 0 removes no nuclei, Value = 1 removes all nuclei [0.0 < Value < 1.0]. This parameter allows removal of light objects. A value of 0.0 causes no objects to be removed. A value of 1.0 will remove all objects. Values between these two limits define a dividing line between the lightest and darkest object found and removes objects with average intensity above this line (lighter objects). For example, value = 0.5 defines the dividing line at the midpoint between lightest and darkest object found. Clear Area Intensity Intensity of clear area [0 < Value 255]. Nuclear Stain (Red) OD for nuclear red [0.0 Value 1.0]. Nuclear Stain (Green) OD for nuclear green [0.0 Value 1.0]. Nuclear Stain (Blue) OD for nuclear blue [0.0 Value 1.0]. Positive Stain (Red) OD for positive red [0.0 Value 1.0]. Positive Stain (Green) OD for positive green [0.0 Value 1.0]. Positive Stain (Blue) OD for positive blue [0.0 Value 1.0]. 3rd Stain (Red) OD for color (3) red [0.0 Value 1.0]. 3rd Stain (Green) OD for color (3) green [0.0 Value 1.0]. 3rd Stain (Blue) OD for color (3) blue [0.0 Value 1.0]. Cytoplasmic Intensity Threshold Adjust the nuclear Intensity of Cytoplasm < Threshold. [0 Disables]. Weak(1+) Threshold Nuclear intensity threshold for weak (1+) [0 < Value 255]. Moderate(2+) Threshold Nuclear intensity threshold for moderate (2+) [0 < Value 255]. Strong(3+) Threshold Nuclear intensity threshold for strong (3+) [0 < Value 255]. Black Threshold Intensity threshold (lower limit) of strong positive nuclei [0 < Value 255]. Nuclei with positive intensity less than the black threshold are not counted. Usually this value is set to 0.0 and defines absolute black. Positive intensity is calculated as (R+G+B)/3 of the deconvolved positive channel. Use Mode Select Training or Analysis/Tuning Mode [0 Analysis/Tuning, 1- Training]. Mark-up Image Type Choose type of markup image [0 Tuning, 1 Analysis]. 2 Algorithm Results A. Understanding the Results Nuclear staining classified as 0, 1+, 2+ and 3+ is based on nuclear staining intensity. o A nucleus is classified 0 when it has no nuclear staining. o A nucleus is classified 1+ when it has weak nuclear staining. o A nucleus is classified 2+ when it has moderate nuclear staining. o A nucleus is classified 3+ when it has intense nuclear staining. Based on the percentages of 0, 1+, 2+ and 3+ nuclei, the percentage of positive stained nuclei as a percentage of 0 to 100% and the average staining intensity of the positive nuclei as a score of 0, 1+, 2+ or 3+ is determined. 3
 + (2 x percentage of moderately")
4 Note: The first section of the Layer Attributes pane displays the algorithm results; the second portion (labeled Algorithm Inputs ) repeats the input parameters you specified. B. Algorithm Output Parameters Percent Positive Nuclei Intensity Score The H Score: The score is obtained by the formula: (3 x percentage of strongly staining nuclei) + (2 x percentage of moderately staining nuclei) + (percentage of weakly staining nuclei), giving a range of 0 to 300. (3+) Percent Nuclei (2+) Percent Nuclei (1+) Percent Nuclei (0+) Percent Nuclei Average Positive Intensity Average Negative Intensity (3+) Nuclei (2+) Nuclei (1+) Nuclei (0+) Nuclei Total Nuclei Average Nuclear RGB Intensity Average Nuclear Size (Pixels) Average Nuclear Size (um 2 ) Area of Analysis (Pixels) Area of Analysis (mm 2 ) 3 Correcting Background Staining A. Background Staining Cytoplasmic or background staining can create problems for the correct quantification of the staining because it increases the overall staining intensity of the slide. Cytoplasmic or background staining can also create problems for image analysis algorithms because segmentation of the nuclei becomes more difficult. Positive nuclei have a dual stain and counter-stain co-localization problem which makes it difficult to truly determine the amount of positive stain on the nuclei, especially for faint positive staining. Color Deconvolution is used to calibrate the stain colors for more accurate quantitative data. 4

5 B. Stain Color Parameters Stain color parameters can be calculated using Color Deconvolution s stain calibration process. C. What Is Color Calibration? By defining the stain color vectors, you are identifying to the Color Deconvolution algorithm which color identifies which stain. The default color vector values are as follows: o Color 1 Hematoxylin o Color 2 Eosin o Color 3 DAB The color vector numbers must be changed if different stains are used. The color for each stain is calibrated separately. o If possible, use a separate control slide for each stain you want to analyze. o If this is not possible, look for several areas of the digital slide that are mostly stained with stain of interest and select them by using the ImageScope drawing tools. Pick an area of light staining of only this color. Avoid selecting darker, overstained areas. If you are using only two stains, not three, set the color vector values for the third color to zero. D. Performing Color Calibration Annotate the digital slide. Be sure to annotate an area on the slide stained ONLY by that particular color. Open the Analysis window and click Create. Select Color Deconvolution v9. Choose the appropriate layer and select Selected Annotation Layers. Click Run. Open the Annotations window. Search the results and look for the Average OD (optical density) values for Red, Green, Blue. Type these values into Input parameters corresponding color component for Color 1, 2, or 3. Repeat these steps for the other stains if necessary. 5

6 4 Nuclear Analysis A. Running Analysis Annotate the slide. Open the Analysis window and click Create. Select Nuclear v9. Adjust the input parameters. Select Selected Annotation Layer to analyze only selected areas of the image. Check the Generate Markup Image box. Click Run. Open the Annotations window to view results. 6
7 7
IncuCyte ZOOM NeuroTrack Fluorescent Processing
 IncuCyte ZOOM NeuroTrack Fluorescent Processing The NeuroTrack TM Software Module (Cat No 9600-0011) is used to measure the processes of neurons in monoculture or with fluorescent labeling in co-culture.
CS 4495 Computer Vision Binary images and Morphology
 CS 4495 Computer Vision Binary images and Aaron Bobick School of Interactive Computing Administrivia PS6 should be working on it! Due Sunday Nov 24 th. Some issues with reading frames. Resolved? Exam:
Photoelectric Photometry of the Pleiades Student Manual
 Name: Lab Partner: Photoelectric Photometry of the Pleiades Student Manual A Manual to Accompany Software for the Introductory Astronomy Lab Exercise Edited by Lucy Kulbago, John Carroll University 11/24/2008
Automatic detection and of dipoles in large area SQUID magnetometry
 Automatic detection and of dipoles in large area SQUID magnetometry Lisa Qian December 4, Introduction. Scanning SQUID magnetometry Scanning SQUID magnetometry is a powerful tool for metrology of individual
A domain-knowledge-inspired mathematical framework for the description and classification of H&E stained histopathology images
 A domain-knowledge-inspired mathematical framework for the description and classification of H&E stained histopathology images Melody L. Massar a, Ramamurthy Bhagavatula b, John A. Ozolek c, Carlos A.
Gaussian Process Based Image Segmentation and Object Detection in Pathology Slides
 Gaussian Process Based Image Segmentation and Object Detection in Pathology Slides CS 229 Final Project, Autumn 213 Jenny Hong Email: jyunhong@stanford.edu I. INTRODUCTION In medical imaging, recognizing
CLEA/VIREO PHOTOMETRY OF THE PLEIADES
 CLEA/VIREO PHOTOMETRY OF THE PLEIADES Starting up the program The computer program you will use is a realistic simulation of a UBV photometer attached to a small (diameter=0.4 meters) research telescope.
Physics 248, Spring 2009 Lab 6: Radiation and its Interaction with Matter
 Name Section Physics 48, Spring 009 Lab 6: Radiation and its Interaction with Matter Your TA will use this sheet to score your lab. It is to be turned in at the end of lab. To receive full credit you must
Introducing the Morphologi G3 ID The future of particle characterization
 Introducing the Morphologi G3 ID The future of particle characterization Dr Anne Virden, Product technical specialist diffraction and analytical imaging What is the Morphologi G3-ID? Advanced R&D particle
Photoelectric Photometry of the Pleiades Student Manual
 Photoelectric Photometry of the Pleiades Student Manual A Manual to Accompany Software for the Introductory Astronomy Lab Exercise Document SM 2: Version 1.1.1 lab Department of Physics Gettysburg College
Multimedia Databases. Previous Lecture. 4.1 Multiresolution Analysis. 4 Shape-based Features. 4.1 Multiresolution Analysis
 Previous Lecture Multimedia Databases Texture-Based Image Retrieval Low Level Features Tamura Measure, Random Field Model High-Level Features Fourier-Transform, Wavelets Wolf-Tilo Balke Silviu Homoceanu
Mimir NIR Spectroscopy Data Processing Cookbook V2.0 DPC
 Mimir NIR Spectroscopy Data Processing Cookbook V2.0 DPC - 20111130 1. Fetch and install the software packages needed a. Get the MSP_WCT, MSP_CCS, MSP_SXC packages from the Mimir/Software web site: http://people.bu.edu/clemens/mimir/software.html
Multimedia Databases. Wolf-Tilo Balke Philipp Wille Institut für Informationssysteme Technische Universität Braunschweig
 Multimedia Databases Wolf-Tilo Balke Philipp Wille Institut für Informationssysteme Technische Universität Braunschweig http://www.ifis.cs.tu-bs.de 4 Previous Lecture Texture-Based Image Retrieval Low
Measuring Colocalization within Fluorescence Microscopy Images
 from photonics.com: 03/01/2007 http://www.photonics.com/article.aspx?aid=39341 Measuring Colocalization within Fluorescence Microscopy Images Two-color fluorescence-based methods are uncovering molecular
Multimedia Databases. 4 Shape-based Features. 4.1 Multiresolution Analysis. 4.1 Multiresolution Analysis. 4.1 Multiresolution Analysis
 4 Shape-based Features Multimedia Databases Wolf-Tilo Balke Silviu Homoceanu Institut für Informationssysteme Technische Universität Braunschweig http://www.ifis.cs.tu-bs.de 4 Multiresolution Analysis
Application of Micro-Flow Imaging (MFI TM ) to The Analysis of Particles in Parenteral Fluids. October 2006 Ottawa, Canada
 to The Analysis of Particles in Parenteral Fluids. October 2006 Ottawa, Canada") Application of Micro-Flow Imaging (MFI TM ) to The Analysis of Particles in Parenteral Fluids October 26 Ottawa, Canada Summary The introduction of a growing number of targeted protein-based drug formulations
Application of Micro-Flow Imaging (MFI TM ) to The Analysis of Particles in Parenteral Fluids October 26 Ottawa, Canada Summary The introduction of a growing number of targeted protein-based drug formulations
Haas trunnions have more than one configuration. Thus, to make a program for the trunnion, you must know these facts:
 Haas Technical Documentation Trunnion Information Scan code to get the latest version of this document Translation Available Trunnion Features Haas trunnions have more than one configuration. Thus, to
ECE661: Homework 6. Ahmed Mohamed October 28, 2014
 ECE661: Homework 6 Ahmed Mohamed (akaseb@purdue.edu) October 28, 2014 1 Otsu Segmentation Algorithm Given a grayscale image, my implementation of the Otsu algorithm follows these steps: 1. Construct a
ncounter PlexSet Data Analysis Guidelines
 ncounter PlexSet Data Analysis Guidelines NanoString Technologies, Inc. 530 airview Ave North Seattle, Washington 98109 USA Telephone: 206.378.6266 888.358.6266 E-mail: info@nanostring.com Molecules That
Binary Image Analysis
 Binary Image Analysis Binary image analysis consists of a set of image analysis operations that are used to produce or process binary images, usually images of 0 s and 1 s. 0 represents the background
SPOTTED cdna MICROARRAYS
 SPOTTED cdna MICROARRAYS Spot size: 50um - 150um SPOTTED cdna MICROARRAYS Compare the genetic expression in two samples of cells PRINT cdna from one gene on each spot SAMPLES cdna labelled red/green e.g.
Photoelectric Photometry of the Pleiades
 Photoelectric Photometry of the Pleiades Student Manual A Manual to Accompany Software for the Introductory Astronomy Lab Exercise Document SM 2: Version 0.96lab Department of Physics Gettysburg College
Digital Image Processing COSC 6380/4393
 Digital Image Processing COSC 6380/4393 Lecture 7 Sept 11 th, 2018 Pranav Mantini Slides from Dr. Shishir K Shah and Frank (Qingzhong) Liu Today Review Binary Image Processing Opening and Closing Skeletonization
A&P 1 Cellular Anatomy, Division & Mitosis In-lab Guide Lab Exercises. In this "Lab Exercise", we will be looking at cellular anatomy and mitosis.
 A&P 1 Cellular Anatomy, Division & Mitosis In-lab Guide Lab Exercises In this "Lab Exercise", we will be looking at cellular anatomy and mitosis. Before trying to do these steps, we should have read the
Biomedical Image Analysis. Segmentation by Thresholding
 Biomedical Image Analysis Segmentation by Thresholding Contents: Thresholding principles Ridler & Calvard s method Ridler TW, Calvard S (1978). Picture thresholding using an iterative selection method,
Tutorial 8 Raster Data Analysis
 Objectives Tutorial 8 Raster Data Analysis This tutorial is designed to introduce you to a basic set of raster-based analyses including: 1. Displaying Digital Elevation Model (DEM) 2. Slope calculations
Using Bioinformatics to Study Evolutionary Relationships Instructions
 3 Using Bioinformatics to Study Evolutionary Relationships Instructions Student Researcher Background: Making and Using Multiple Sequence Alignments One of the primary tasks of genetic researchers is comparing
REX Evaluation Guide. American Micro Detection Systems Inc March Lane, Suite 200 Stockton, CA 95219
 REX Evaluation Guide American Micro Detection Systems Inc. 2800 March Lane, Suite 200 Stockton, CA 95219 I. INTRODUCTION REX (Real-time Elemental X-ray Fluorescence System) is the only instrument capable
Basic Math. Curriculum (358 topics additional topics)
") Basic Math This course covers the topics outlined below and is available for use with integrated, interactive ebooks. You can customize the scope and sequence of this course to meet your curricular needs.
Basic Math This course covers the topics outlined below and is available for use with integrated, interactive ebooks. You can customize the scope and sequence of this course to meet your curricular needs.
Agilent MassHunter Quantitative Data Analysis
 Agilent MassHunter Quantitative Data Analysis Presenters: Howard Sanford Stephen Harnos MassHunter Quantitation: Batch Table, Compound Information Setup, Calibration Curve and Globals Settings 1 MassHunter
Using ArcGIS for Hydrology and Watershed Analysis:
 Using ArcGIS 10.2.2 for Hydrology and Watershed Analysis: A guide for running hydrologic analysis using elevation and a suite of ArcGIS tools Anna Nakae Feb. 10, 2015 Introduction Hydrology and watershed
Energy Sources of the Far IR Emission of M33
 Energy Sources of the Far IR Emission of M33 Hinz, Reike et al., ApJ 154: S259 265 (2004). Presented by James Ledoux 24 µm 70 µm 160 µm Slide 1 M33 Properties Distance 840kpc = 2.7 Mlyr (1'' ~ 4 pc) Also
Automated trabecular and cortical bone selection
 Automated trabecular and cortical bone Method note Page 1 of 18 2 Introduction In practice, quantitative analysis of long bone morphology is subdivided into analysis of the trabecular bone and analysis
GS Analysis of Microarray Data
 GS01 0163 Analysis of Microarray Data Keith Baggerly and Kevin Coombes Section of Bioinformatics Department of Biostatistics and Applied Mathematics UT M. D. Anderson Cancer Center kabagg@mdanderson.org
Segmentation of Overlapping Cervical Cells in Microscopic Images with Superpixel Partitioning and Cell-wise Contour Refinement
 Segmentation of Overlapping Cervical Cells in Microscopic Images with Superpixel Partitioning and Cell-wise Contour Refinement Hansang Lee Junmo Kim Korea Advanced Institute of Science and Technology {hansanglee,junmo.kim}@kaist.ac.kr
Efficient Algorithms for Pulse Parameter Estimation, Pulse Peak Localization And Pileup Reduction in Gamma Ray Spectroscopy M.W.Raad 1, L.
 Efficient Algorithms for Pulse Parameter Estimation, Pulse Peak Localization And Pileup Reduction in Gamma Ray Spectroscopy M.W.Raad 1, L. Cheded 2 1 Computer Engineering Department, 2 Systems Engineering
Prep for the CSU ELM
 Prep for the CSU ELM This course covers the topics shown below. Students navigate learning paths based on their level of readiness. Institutional users may customize the scope and sequence to meet curricular
MassHunter Software Overview
 MassHunter Software Overview 1 Qualitative Analysis Workflows Workflows in Qualitative Analysis allow the user to only see and work with the areas and dialog boxes they need for their specific tasks A
Geography 281 Map Making with GIS Project Four: Comparing Classification Methods
 Geography 281 Map Making with GIS Project Four: Comparing Classification Methods Thematic maps commonly deal with either of two kinds of data: Qualitative Data showing differences in kind or type (e.g.,
Image Segmentation: Definition Importance. Digital Image Processing, 2nd ed. Chapter 10 Image Segmentation.
 : Definition Importance Detection of Discontinuities: 9 R = wi z i= 1 i Point Detection: 1. A Mask 2. Thresholding R T Line Detection: A Suitable Mask in desired direction Thresholding Line i : R R, j
A Laplacian of Gaussian-based Approach for Spot Detection in Two-Dimensional Gel Electrophoresis Images
 A Laplacian of Gaussian-based Approach for Spot Detection in Two-Dimensional Gel Electrophoresis Images Feng He 1, Bangshu Xiong 1, Chengli Sun 1, Xiaobin Xia 1 1 Key Laboratory of Nondestructive Test
GS Analysis of Microarray Data
 GS01 0163 Analysis of Microarray Data Keith Baggerly and Kevin Coombes Section of Bioinformatics Department of Biostatistics and Applied Mathematics UT M. D. Anderson Cancer Center kabagg@mdanderson.org
Numerical processing of sunspot images using the digitized Royal Greenwich Observatory Archive
 Numerical processing of sunspot images using the digitized Royal Greenwich Observatory Archive Andrey Tlatov 1 and Vladimir Ershov 2 1 Kislovodsk Mountain Solar Station,Pulkovo observatory 2 Mullard Space
Filtering and Edge Detection
 Filtering and Edge Detection Local Neighborhoods Hard to tell anything from a single pixel Example: you see a reddish pixel. Is this the object s color? Illumination? Noise? The next step in order of complexity
Relative Photometry with data from the Peter van de Kamp Observatory D. Cohen and E. Jensen (v.1.0 October 19, 2014)
") Relative Photometry with data from the Peter van de Kamp Observatory D. Cohen and E. Jensen (v.1.0 October 19, 2014) Context This document assumes familiarity with Image reduction and analysis at the Peter
Relative Photometry with data from the Peter van de Kamp Observatory D. Cohen and E. Jensen (v.1.0 October 19, 2014) Context This document assumes familiarity with Image reduction and analysis at the Peter
Pre Algebra. Curriculum (634 topics)
") Pre Algebra This course covers the topics shown below. Students navigate learning paths based on their level of readiness. Institutional users may customize the scope and sequence to meet curricular needs.
Pre Algebra This course covers the topics shown below. Students navigate learning paths based on their level of readiness. Institutional users may customize the scope and sequence to meet curricular needs.
Photometry of a Globular Cluster
 Name(s): Date: Course/Section: Grade: Photometry of a Globular Cluster Learning Objectives: Students will determine the age of a globular cluster using photometry. Checklist: Complete the pre- lab quiz
Clusters of galaxies
 Clusters of galaxies Most galaxies belong to some larger bound structure. Conventionally consider groups and clusters, with characteristic properties: Groups Clusters Core radius 250 h -1 kpc 250 h -1
Cover Page. The handle holds various files of this Leiden University dissertation
 Cover Page The handle http://hdl.handle.net/1887/41480 holds various files of this Leiden University dissertation Author: Tleis, Mohamed Title: Image analysis for gene expression based phenotype characterization
Quality Report Generated with Pix4Dmapper Pro version
 Quality Report Generated with Pix4Dmapper Pro version 3.0.13 Important: Click on the different icons for: Help to analyze the results in the Quality Report Additional information about the sections Click
PHYS133 Lab 7 The HR Diagram
 PHYS133 Lab 7 Goals: Measure brightness of various stars in the Pleiades star cluster in two different wavelength bands. Create an HR diagram based on the data taken. Use the distance modulus to determine
Histograms allow a visual interpretation
 Chapter 4: Displaying and Summarizing i Quantitative Data s allow a visual interpretation of quantitative (numerical) data by indicating the number of data points that lie within a range of values, called
Pre Algebra and Introductory Algebra
 Pre Algebra and Introductory Algebra This course covers the topics outlined below and is available for use with integrated, interactive ebooks. You can customize the scope and sequence of this course to
Local Histograms for Per-Pixel Classification
 Air Force Institute of Technology AFIT Scholar Theses and Dissertations 3-22-2012 Local Histograms for Per-Pixel Classification Melody R. Massar Follow this and additional works at: https://scholar.afit.edu/etd
Polink TS-GMR-Hu B Kit for Immunohistochemistry Staining
 Polink TS-GMR-Hu B Kit for Immunohistochemistry Staining Polymer-HRP & AP triple staining kit to detect goat, mouse and rabbit primary antibodies on human tissue with DAB(Brown), GBI-Permanent Red(Red),
Biology 160 Cell Lab. Name Lab Section: 1:00pm 3:00 pm. Student Learning Outcomes:
 Biology 160 Cell Lab Name Lab Section: 1:00pm 3:00 pm Student Learning Outcomes: Upon completion of today s lab you will be able to do the following: Properly use a compound light microscope Discuss the
All Ions MS/MS: Targeted Screening and Quantitation Using Agilent TOF and Q-TOF LC/MS Systems
 All Ions MS/MS: Targeted Screening and Quantitation Using Agilent TOF and Q-TOF LC/MS Systems Technical Overview Introduction All Ions MS/MS is a technique that is available for Agilent high resolution
IE 316 Exam 1 Fall 2011
 IE 316 Exam 1 Fall 2011 I have neither given nor received unauthorized assistance on this exam. Name Signed Date Name Printed 1 1. Suppose the actual diameters x in a batch of steel cylinders are normally
Mathematics Kindergarten
 Kindergarten describe and sort and count measureable attributes identify and describe compose and model Shapes and space Representing quantity Whole numbers count sequence cardinality count instant recognition
Significant Figures and an Introduction to the Normal Distribution
 Significant Figures and an Introduction to the Normal Distribution Object: To become familiar with the proper use of significant figures and to become acquainted with some rudiments of the theory of measurement.
Module 2: Foundations in biology
 alevelbiology.co.uk Module 2: Foundations in biology SPECIFICATION 2.1.1 Cell structure Learners should be able to demonstrate and apply their knowledge and understanding of: (a) The use of microscopy
Chapter 2 Polynomial and Rational Functions
 SECTION.1 Linear and Quadratic Functions Chapter Polynomial and Rational Functions Section.1: Linear and Quadratic Functions Linear Functions Quadratic Functions Linear Functions Definition of a Linear
Lightcloud Application
 Controlling Your Lightcloud System Lightcloud Application Lightcloud Application Navigating the Application Devices Device Settings Organize Control Energy Scenes Schedules Demand Response Power Up State
Approval Block. Prepared by: Signature Date Evan Parnell 08 NOV Reviewed by: Signature Date. Approved by: Signature Date
 ATS-SOI-3660 Page: 1 of 6 Approval Block Prepared by: Signature Date Evan Parnell 08 NOV 2013 Reviewed by: Signature Date Brian Flynn 08 NOV 2013 Approved by: Signature Date Kristal Jewell 08 NOV 2013
2010 Autodesk, Inc. All rights reserved. NOT FOR DISTRIBUTION.
 Wastewater Profiles 2010 Autodesk, Inc. All rights reserved. NOT FOR DISTRIBUTION. The contents of this guide were created for Autodesk Topobase 2011. The contents of this guide are not intended for other
EXPLORING CHORDS. Q1. Draw and label a radius on the circle. How does a chord compare with a radius? What are their similarities and differences?
 EXPLORING CHORDS Name: Date: In this activity you will be using Geogebra to explore some properties associated with chords within a circle. Please answer each question throughout the activity marked Q#
IE 316 Exam 1 Fall 2011
 IE 316 Exam 1 Fall 2011 I have neither given nor received unauthorized assistance on this exam. Name Signed Date Name Printed 1 1. Suppose the actual diameters x in a batch of steel cylinders are normally
Problem Session #5. EE368/CS232 Digital Image Processing
 Problem Session #5 EE368/CS232 Digital Image Processing 1. Solving a Jigsaw Puzzle Please download the image hw5_puzzle_pieces.jpg from the handouts webpage, which shows the pieces of a jigsaw puzzle.
High Density Area Boundary Delineation
 High Density Area Boundary Delineation John Hathaway, John Wilson, and Brent Pulsipher (PNNL) Sean A. McKenna and Barry Roberts (SNL) 2008 Partners in Environmental Technology Technical Symposium & Workshop
Measurments with Michelson interferometers
 Please do not remove this manual from from the lab. It is available at www.cm.ph.bham.ac.uk/y2lab Optics Measurments with Michelson interferometers Objectives In this experiment you will: Understand the
A Guide to Reticle Design on the Autostep 200 Edward Tang 6/4/04
 A Guide to Reticle Design on the Autostep 200 Edward Tang 6/4/04 1 Table of Contents Introduction Section 1 Reticle Management System (RMS): Introduction Section 2- Global Alignment System Global Scan
Pi: The Ultimate Ratio
 Pi: The Ultimate Ratio Exploring the Ratio of Circle Circumference to Diameter 1 WARM UP Scale up or down to determine an equivalent ratio. 1. 18 miles 3 hours 5? 1 hour 2. $750 4 days 3. 4. 12 in. 1 ft
Introduction. Name: Basic Features of Sunspots. The Solar Rotational Period. Sunspot Numbers
 PHYS-1050 Tracking Sunspots Spring 2013 Name: 1 Introduction Sunspots are regions on the solar surface that appear dark because they are cooler than the surrounding photosphere, typically by about 1500
Data Reduction - Optical / NIR Imaging. Chian-Chou Chen Ph319
 Data Reduction - Optical / NIR Imaging Chian-Chou Chen (T.C.) @ Ph319 Images at different wavelengths... Images at different wavelengths... However, the raw data are always not as pretty Why? The total
Detecting Dark Matter Halos Sam Beder, Brie Bunge, Adriana Diakite December 14, 2012
 Detecting Dark Matter Halos Sam Beder, Brie Bunge, Adriana Diakite December 14, 2012 Introduction Dark matter s gravitational pull affects the positions of galaxies in the universe. If galaxies were circular,
Math Literacy. Curriculum (457 topics)
") Math Literacy This course covers the topics shown below. Students navigate learning paths based on their level of readiness. Institutional users may customize the scope and sequence to meet curricular
Math Literacy This course covers the topics shown below. Students navigate learning paths based on their level of readiness. Institutional users may customize the scope and sequence to meet curricular
LAB 6- Mitosis & Meiosis
 Bio 101 Name _ LAB 6- Mitosis & Meiosis OBJECTIVES To observe the stages of mitosis in prepared slides of whitefish blastula and onion root tips. To gain a better understanding of the process of mitosis
HubVis: Software for Gravitational Lens Estimation and Visualization from Hubble Data
 HubVis: Software for Gravitational Lens Estimation and Visualization from Hubble Data Sam L. Shue, Andrew R. Willis, and Thomas P. Weldon Dept. of Electrical and Computer Engineering University of North
RADIOACTIVITY IN THE AIR
 RADIOACTIVITY IN THE AIR REFERENCES M. Sternheim and J. Kane, General Physics (See the discussion on Half Life) Evans, The Atomic Nucleus, pp. 518-522 Segre, Nuclei and Particles, p. 156 See HEALTH AND
... [1] [2] A yeast cell can continue producing new cells until its surface is covered by scars.
![... [1] [2] A yeast cell can continue producing new cells until its surface is covered by scars.](/thumbs/95/124831107.jpg "... [1] [2] A yeast cell can continue producing new cells until its surface is covered by scars.") 1 (a) Fig. 2.1, on the insert, shows a yeast cell with scars resulting from its reproductive process. (i) Name the process of asexual reproduction in yeast. Outline the process of asexual reproduction
1 (a) Fig. 2.1, on the insert, shows a yeast cell with scars resulting from its reproductive process. (i) Name the process of asexual reproduction in yeast. Outline the process of asexual reproduction
LoG Blob Finding and Scale. Scale Selection. Blobs (and scale selection) Achieving scale covariance. Blob detection in 2D. Blob detection in 2D
 Achieving scale covariance. Blob detection in 2D. Blob detection in 2D") Achieving scale covariance Blobs (and scale selection) Goal: independently detect corresponding regions in scaled versions of the same image Need scale selection mechanism for finding characteristic region
Achieving scale covariance Blobs (and scale selection) Goal: independently detect corresponding regions in scaled versions of the same image Need scale selection mechanism for finding characteristic region
Nonparametric Methods Lecture 5
 Nonparametric Methods Lecture 5 Jason Corso SUNY at Buffalo 17 Feb. 29 J. Corso (SUNY at Buffalo) Nonparametric Methods Lecture 5 17 Feb. 29 1 / 49 Nonparametric Methods Lecture 5 Overview Previously,
Archdiocese of Washington Catholic Schools Academic Standards Mathematics
 6 th GRADE Archdiocese of Washington Catholic Schools Standard 1 - Number Sense Students compare and order positive and negative integers*, decimals, fractions, and mixed numbers. They find multiples*
Map My Property User Guide
 Map My Property User Guide Map My Property Table of Contents About Map My Property... 2 Accessing Map My Property... 2 Links... 3 Navigating the Map... 3 Navigating to a Specific Location... 3 Zooming
Understanding the Differences between LS Algorithms and Sequential Filters
 Understanding the Differences between LS Algorithms and Sequential Filters In order to perform meaningful comparisons between outputs from a least squares (LS) orbit determination algorithm and orbit determination
Physics 476LW Advanced Physics Laboratory Atomic Spectroscopy
 Physics 476LW Atomic Spectroscopy 1 Introduction The description of atomic spectra and the Rutherford-Geiger-Marsden experiment were the most significant precursors of the so-called Bohr planetary model
Unit 2: The Structure and function of Organisms. Section 2: Inside Cells
 Unit 2: The Structure and function of Organisms Section 2: 42 Essential Question: Are all cells the same? - Vocabulary 1. 2. 3. 4. 5. 6. 7. 8. Eukaryotic Prokaryotic Organelle Plant Cell Animal Cell Chloroplast
Review for Exam 1. Erik G. Learned-Miller Department of Computer Science University of Massachusetts, Amherst Amherst, MA
 Review for Exam Erik G. Learned-Miller Department of Computer Science University of Massachusetts, Amherst Amherst, MA 0003 March 26, 204 Abstract Here are some things you need to know for the in-class
THE CRYSTAL BALL FORECAST CHART
 One-Minute Spotlight THE CRYSTAL BALL FORECAST CHART Once you have run a simulation with Oracle s Crystal Ball, you can view several charts to help you visualize, understand, and communicate the simulation
Polar alignment in 5 steps based on the Sánchez Valente method
 1 Polar alignment in 5 steps based on the Sánchez Valente method Compared to the drift alignment method, this one, allows you to easily achieve a perfect polar alignment in just one step. By "perfect polar
In this Issue Feature Article DISCOVERY Yellow Did you know? Technical Tips Thank you! New Products DISCOVERY Teal Beta Testing Begins
 ISSUE 02 In this Issue Feature Article Yellow Did you know? Technical Tips Thank you! New Products Teal Beta Testing Begins Yellow Detection Kit By Adrian Murillo, Development Scientist We are very pleased
MassHunter TOF/QTOF Users Meeting
 MassHunter TOF/QTOF Users Meeting 1 Qualitative Analysis Workflows Workflows in Qualitative Analysis allow the user to only see and work with the areas and dialog boxes they need for their specific tasks
CS Sampling and Aliasing. Analog vs Digital
 CS 112 - Sampling and Aliasing Aditi Majumder, CS 112, Winter 2007 Slide 1 Analog vs Digital God has created the world analog Man has created digital world Aditi Majumder, CS 112, Winter 2007 Slide 2 1
The Hydrogen Atom Student Guide
 Name: The Hydrogen Atom Student Guide Background Material Carefully read the background pages entitled Energy Levels, Light, and Transitions and answer the following questions to check your understanding.
Zeeman Effect Physics 481
 Zeeman Effect Introduction You are familiar with Atomic Spectra, especially the H- atom energy spectrum. Atoms emit or absorb energies in packets, or quanta which are photons. The orbital motion of electrons
BHS Astronomy: Galaxy Classification and Evolution
 Name Pd Date BHS Astronomy: Galaxy Classification and Evolution This lab comes from http://cosmos.phy.tufts.edu/~zirbel/ast21/homework/hw-8.pdf (Tufts University) The word galaxy, having been used in English
Lecture 6: Edge Detection. CAP 5415: Computer Vision Fall 2008
 Lecture 6: Edge Detection CAP 5415: Computer Vision Fall 2008 Announcements PS 2 is available Please read it by Thursday During Thursday lecture, I will be going over it in some detail Monday - Computer
Exam 1 January 31, 2012
 Exam 1 Instructions: You have 60 minutes to complete this exam. This is a closed-book, closed-notes exam. You are allowed to use a calculator during the exam. Usage of mobile phones and other electronic
Agilent MassHunter Quantitative Data Analysis
 Agilent MassHunter Quantitative Data Analysis Presenters: Howard Sanford Stephen Harnos MassHunter Quantitation: Batch and Method Setup Outliers, Data Review, Reporting 1 MassHunter Quantitative Analysis
1 The Preliminary Processing
 AY 257 Modern Observational Techniques...23 1 The Preliminary Processing Frames must be corrected for a bias level and quantum efficiency variations on all scales. For a minority of CCDs and most near-ir