San Francisco State University Department of Earth & Climate Sciences Fall 2017
|
|
|
- Leonard Norman
- 5 years ago
- Views:
Transcription
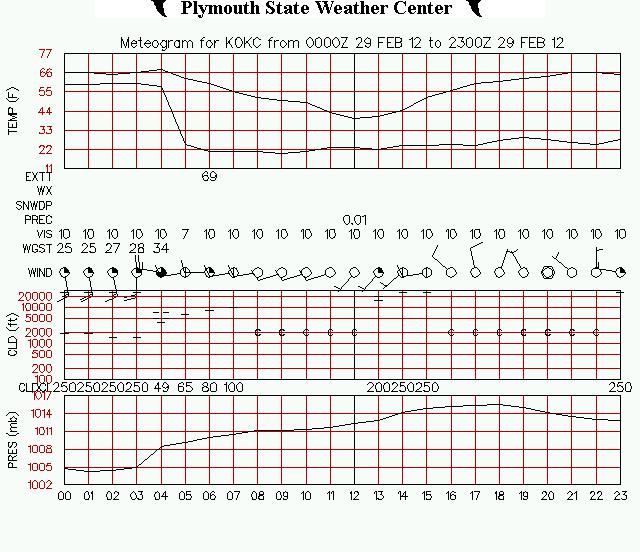
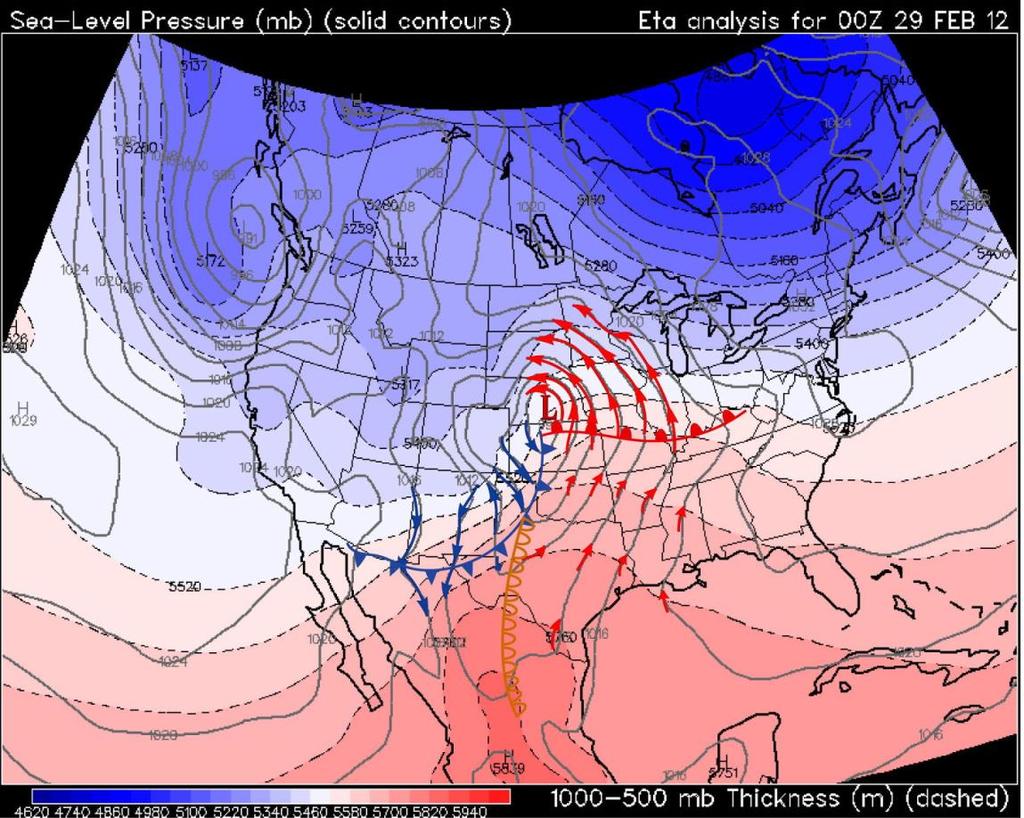
1 San Francisco State University Name Department of Earth & Climate Sciences Fall 2017 Part 1: Fronts Final Inclass Exercise (Inclass Exercise 11) Diagnosing Fronts and Upper Tropospheric Divergence Patterns (200 pts; Due Last Day of Class 12 December 2017) You are provided with (a) 0000 UTC 29 Feburary 2012 plot of surface isobars and mb thickness; (b) a plot of surface observations at 1449 UTC 29 February 2012; (c) 0000 UTC 29 Feburary 2012 Skew-T Plot for Davenport IA (KDVN); (d) 1200 UTC 29 Feburary 2012 Skew-T Plot for Oklahoma City (KOUN); (e) Analysis of 850 mb temperature advection (K o s -1 ) Exercises 1. You will obtain from the Plymouth State University Weather Center Archive at Meteograms for Oklahoma City (KOKC) and Davenport IA (KDVN); (0000 UTC Start Time 29 February 2012). (12 pts) 1
2 2
 and (b), using standard")
3 2. Each person will analyze the provided charts (a) (midsection of country only) and (b), using standard techniques (40 pts) 3
4 4

5 3. Each person will compare/contrast his/her analysis of (a) with the actual 850 mb 1 temperature advection analysis given in (e) (8 pts) While the geostrophic temperature advection analysis on nam_thick shows strong cold advection in eastern New Mexico and north of the warm front in Iowa, Minnesota, and Wisconsin in the same locations as shown by the 850 mb temperature advection plot, there were some significant differences. The actual temperature advection plot shows very strong cold advection northwest of the surface low in eastern Wyoming and northwestern Nebraska and strong warm advection ahead of the dryline in central Texas that my analysis did NOT show mb is roughly at the surface in this area. 5
6 4. Each person will examine the provided soundings in (c) and (d) to find evidence that backs the frontal analyses in (a) and (b). (10 pts) The KDVN sounding indicates strong veering of the wind, consistent with strong warm advection on the cold air side of a warm front. The strongest veering is coincident with the inversion that is quite low in the troposphere, at around 850 mb. This indicates that the warm front is quite nearby, and consistent with my positioning of the warm front in southern Iowa/northern Missouri. The KOKC sounding shows strong backing of the wind with height, particularly from around 600 mb up through 300 mb, consistent with the cold advection area on the cold air side of a cold front. The inversion at around 700 mb indicates that the surface cold front passed OKC some hours ago and would be southeast of OKC. And both of these observations are consistent with the projected position of the cold front that would be southeast of OKC. 5. Each person will write one paragraph describing how your findings in (2) and (3) just above are supported by the information in the Meteograms. (20 pts) The meteogram for KDVN indicates a wind shift from southeast to southwest and a temperature rise around 11 UTC, which is in the middle of the night. This is consistent with a warm front passage, which one would expect given the surface analysis showing the warm front moving northward, just on the Iowa-Missouri border. The meteogram for KOKC shows a temperature fall around 02 UTC, an abrupt dew point fall, and a marked wind shift from southerly to westerly at around that time, indicating a cold frontal passage. At 01 UTC, the surface analysis indicates a cold front northwest of OKC, moving southeastward. Hence, this analysis is consistent with the passage of that front over the OKC area in several hours. Presentations (~2 minutes each) (10 pts) 1. (2a) Juliana 2. (2b) Drew 3. (3) Jonathen 4. (4) Tianny 5. (5) Natalie 6
7 Figure (a): 0000 UTC 29 Feburary 2012 plot of surface isobars and mb thickness; 7

8 Figure (b) plot of surface observations at 1449 UTC 29 February
;")
9 Figure (c): 0000 UTC 29 Feburary 2012 Skew-T Plot for Davenport IA (KDVN); 9
;")
10 Figure (d): 1200 UTC 29 Feburary 2012 Skew-T Plot for Oklahoma City (KOUN); 10
")
11 Figure (e): 0000 UTC Analysis of 850 mb Temperature Advection (K o s -1 ) 11
 0000 UTC 29 Feburary 2012 plot of 300 mb heights (m) and absolute vorticity (X 10-5 s -1 ). (h) 0000 UTC 29 Feburary 2012 plot of 300 mb convergence (X 10-5 s -1 ). Exercises 6.")
12 Part 2: Divergence Patterns Diagnosed from Vorticity Patterns You are provided with (f) 0000 UTC 29 Feburary 2012 plot of 300 mb heights (m). (g) 0000 UTC 29 Feburary 2012 plot of 300 mb heights (m) and absolute vorticity (X 10-5 s -1 ). (h) 0000 UTC 29 Feburary 2012 plot of 300 mb convergence (X 10-5 s -1 ). Exercises 6. Each person will analyze troughs and ridges on (f) and, using ERTH 260 reasoning, make a first guess on divergence/convergence patterns at 300 mb for the middle third of the country; (20 pts) Divergence should be occurring broadly between the main trough acis over western TX to Wyoming to the ridge axis over the Mississippi River Valley. But there is a second short wave coming into the area over Utah that should have some divergence ahead of it too. 12
 light brown shading for areas of negative absolute vorticity advection. Now, deduce where divergence and convergence areas are on this chart.")
13 7. Each person will shade in the absolute vorticity advection areas you deduce on (g) using the following convention: (i) light green shading for areas of positive (cyclonic) absolute vorticity advection; (ii) light brown shading for areas of negative absolute vorticity advection. Now, deduce where divergence and convergence areas are on this chart. (One paragraph) (40 pts) Divergence areas should be in the areas of cyclonic (positive) vorticity advection and convergence in the area of anticyclonic (negative) vorticity advection. 8. Each person will examine the plot of 300 mb convergence patterns given in (h) and compare and contrast the results you got in (6) with the actual patterns given in (h) (30 pts The major areas of actual divergence over western Oklahoma and the Texas Panhandle and convergence over Colorado and northern New Mexico agree with my estimates. Also, the prong of convergence over west TX between the two divergence areas was captured well. However, there are significant areas of disagreement. The second area 13
 (10 pts) 9. (6) Juliana 10. (7) Drew and Tianny 11.")
14 of divergence associated with the second shortwave was actually much further north than my estimate from the vorticity advection areas. Presentations (~2 minutes each) (10 pts) 9. (6) Juliana 10. (7) Drew and Tianny 11. (8) Jonathen and Natalie Figure (f): 0000 UTC 29 Feburary 2012 plot of 300 mb heights (m). 14
 and absolute vorticity (X 10-5 s -1 ).")
15 Figure (g): 0000 UTC 29 Feburary 2012 plot of 300 mb heights (mm) and absolute vorticity (X 10-5 s -1 ). 15
.")
16 Figure (h): 0000 UTC 29 Feburary 2012 plot of 300 mb convergence (X 10-5 s -1 ). 16
Department of Earth & Climate Sciences San Francisco State University
 Department of Earth & Climate Sciences San Francisco State University Name ERTH 260: Inclass Exercise #5 Working With Weather Maps and Soundings: Finding Pressure Features and Fronts Due Wednesday 28 February
Synoptic Meteorology II: Frontogenesis Examples Figure 1
 Synoptic Meteorology II: Frontogenesis Examples The below images, taken from the 1200 UTC 17 January 2019 GFS forecast run, provide examples of the contributions of deformation and divergence to frontogenesis.
Summary of November Central U.S. Winter Storm By Christopher Hedge
 Summary of November 12-13 2010 Central U.S. Winter Storm By Christopher Hedge Event Overview The first significant snowfall of the 2010-2011 season affected portions of the plains and upper Mississippi
ANSWER KEY. Part I: Synoptic Scale Composite Map. Lab 12 Answer Key. Explorations in Meteorology 54
 ANSWER KEY Part I: Synoptic Scale Composite Map 1. Using Figure 2, locate and highlight, with a black dashed line, the 500-mb trough axis. Also, locate and highlight, with a black zigzag line, the 500-mb
ERTH 260 In-class Exercise 3 Key: Weather Map Features Introduction to Boundaries
 San Francisco State University Name Department of Earth & Climate Sciences Spring 2018 ERTH 260 In-class Exercise 3 Key: Weather Map Features Introduction to Boundaries 100 points Due Wednesday 14 February
A Detailed Analysis of a Long-Tracked Supercell. Jason T. Martinelli and Andrew Elliott. Fred Glass
 A Detailed Analysis of a Long-Tracked Supercell Jason T. Martinelli and Andrew Elliott Department of Atmospheric Sciences, Creighton University, Omaha, Nebraska Fred Glass National Weather Service Forecast
Synoptic Meteorology II: Petterssen-Sutcliffe Development Theory Application March 2015
 Synoptic Meteorology II: Petterssen-Sutcliffe Development Theory Application 10-12 March 2015 In our lecture on Petterssen-Sutcliffe Development Theory, we outlined the principle of selfdevelopment in
11B.1 INFLUENCE OF DIABATIC POTENTIAL VORTICITY ANOMALIES UPON WARM CONVEYOR BELT FLOW. PART I: FEBRUARY 2003
 INFLUENCE OF DIABATIC POTENTIAL VORTICITY ANOMALIES UPON WARM CONVEYOR BELT FLOW. PART I: 14-15 FEBRUARY 2003 Philip N. Schumacher, NOAA/NWS, Sioux Falls, SD Joshua M. Boustead, NOAA/NWS, Valley, NE Martin
True or false: The atmosphere is always in hydrostatic balance. A. True B. False
 Clicker Questions and Clicker Quizzes Clicker Questions Chapter 7 Of the four forces that affect the motion of air in our atmosphere, which is to thank for opposing the vertical pressure gradient force
Vertical structure. To conclude, we will review the critical factors invloved in the development of extratropical storms.
 Vertical structure Now we will examine the vertical structure of the intense baroclinic wave using three visualization tools: Upper level charts at selected pressure levels Vertical soundings for selected
Mesoscale Meteorology Assignment #3 Q-G Theory Exercise. Due 23 February 2017
 Mesoscale Meteorology Assignment #3 Q-G Theory Exercise 1. Consider the sounding given in Fig. 1 below. Due 23 February 2017 Figure 1. Skew T-ln p diagram from Tallahassee, FL (TLH). The observed temperature
DEPARTMENT OF EARTH & CLIMATE SCIENCES Name SAN FRANCISCO STATE UNIVERSITY Nov 29, ERTH 360 Test #2 200 pts
 DEPARTMENT OF EARTH & CLIMATE SCIENCES Name SAN FRANCISCO STATE UNIVERSITY Nov 29, 2018 ERTH 360 Test #2 200 pts Each question is worth 4 points. Indicate your BEST CHOICE for each question on the Scantron
ERTH 465 Fall Lab 5. Absolute Geostrophic Vorticity. 200 points.
 Name Date ERTH 465 Fall 2015 Lab 5 Absolute Geostrophic Vorticity 200 points. 1. All labs are to be kept in a three hole binder. Turn in the binder when you have finished the Lab. 2. Show all work in mathematical
Metr 201 Quiz #4 Key 100 pts. A. Short Answer and Definitions. (3 points each for a total of 18 points in this section).
.") Department of Earth & Climate Sciences Name San Francisco State University March 30, 2015 Metr 201 Quiz #4 Key 100 pts. A. Short Answer and Definitions. (3 points each for a total of 18 points in this
Department of Earth & Climate Sciences Name San Francisco State University March 30, 2015 Metr 201 Quiz #4 Key 100 pts. A. Short Answer and Definitions. (3 points each for a total of 18 points in this
A Cyclogenesis south of the Alps. Manfred Kurz Neustadt/Weinstraße
 A Cyclogenesis south of the Alps Manfred Kurz Neustadt/Weinstraße A cyclogenesis south of the Alps Surface maps 06-11-99, 00 UTC The occluded frontal system of a quasi-stationary low above the North Sea
Metr 201 Quiz #2 100 pts. A. Short Answer and Definitions. (4 points each for a total of 28 points in this section).
.") Department of Earth & Climate Sciences Name San Francisco State University February 23, 2015 Metr 201 Quiz #2 100 pts. A. Short Answer and Definitions. (4 points each for a total of 28 points in this section).
Department of Earth & Climate Sciences Name San Francisco State University February 23, 2015 Metr 201 Quiz #2 100 pts. A. Short Answer and Definitions. (4 points each for a total of 28 points in this section).
and 24 mm, hPa lapse rates between 3 and 4 K km 1, lifted index values
 3.2 Composite analysis 3.2.1 Pure gradient composites The composite initial NE report in the pure gradient northwest composite (N = 32) occurs where the mean sea level pressure (MSLP) gradient is strongest
Current Weather Studies 4 TEMPERATURE AND AIR MASS ADVECTION
 CWS 4-1 SP19 Current Weather Studies 4 TEMPERATURE AND AIR MASS ADVECTION Reference: Chapter 4 in the Weather Studies textbook. Complete the introductory and other appropriate sections of Investigations
Anthony A. Rockwood Robert A. Maddox
 Anthony A. Rockwood Robert A. Maddox An unusually intense MCS produced large hail and wind damage in northeast Kansas and northern Missouri during the predawn hours of June 7 th, 1982. Takes a look at
Fall 2015 Laboratory 7 Quasigeostrophic Forcing Functions 300 points. You are provided with the following for 12 UTC 12/4/12 (a) WRF-NAM
 WRF-NAM") ERTH 465 Fall 2015 Laboratory 7 NAME Quasigeostrophic Forcing Functions 300 points. You are provided with the following for 12 UTC 12/4/12 (a) WRF-NAM initialization of SLP and 1000-500 mb thickness; (b)
ERTH 465 Fall 2015 Laboratory 7 NAME Quasigeostrophic Forcing Functions 300 points. You are provided with the following for 12 UTC 12/4/12 (a) WRF-NAM initialization of SLP and 1000-500 mb thickness; (b)
Chapter 12 Fronts & Air Masses
 Chapter overview: Anticyclones or highs Air Masses o Classification o Source regions o Air masses of North America Fronts o Stationary fronts o Cold fronts o Warm fronts o Fronts and the jet stream o Frontogenesis
4/29/2011. Mid-latitude cyclones form along a
 Chapter 10: Cyclones: East of the Rocky Mountain Extratropical Cyclones Environment prior to the development of the Cyclone Initial Development of the Extratropical Cyclone Early Weather Along the Fronts
1. INTRODUCTION. For brevity times are referred to in the format of 20/1800 for 20 August UTC. 3. RESULTS
 Heavy rains and precipitable water anomalies 20-23 August 2010-Draft By Jason Krekeler And Richard Grumm National Weather Service State College, PA 16803 1. INTRODUCTION Heavy rain fell across the central
WEATHER MAPS NAME. Temperature: Dew Point: Wind Direction: Wind Velocity: % of Sky Covered: Current Pressure:
 NAME WEATHER MAPS For decades hundreds of weather stations throughout the United States have been making standard observations of temperature, moisture, air pressure and winds. The data are collected centrally
Talking points for Water Vapor Imagery Analysis for Severe Thunderstorm Forecasting.
 Talking points for Water Vapor Imagery Analysis for Severe Thunderstorm Forecasting. 1. Title. 2. Learning objectives. These are the topics we ll consider during this training session, the goal of the
Synoptic Meteorology I: Isoplething Example. From page 15 of Meteorological Data and an Introduction to Synoptic Analysis,
 Synoptic Meteorology I: Isoplething Example Overview On the following pages, isoplethed analyses of sea-level pressure (every 4 hpa; Figure 1), 2-m temperature (every 5 F; Figure 2), 2-m dew point temperature
 http://www.ssec.wisc.edu/data/composites.html Red curve: Incoming solar radiation Blue curve: Outgoing infrared radiation. Three-cell model of general circulation Mid-latitudes: 30 to 60 latitude MID-LATITUDES
Fronts in November 1998 Storm
 Fronts in November 1998 Storm Much of the significant weather observed in association with extratropical storms tends to be concentrated within narrow bands called frontal zones. Fronts in November 1998
Refer to Figure 1 and what you have learned so far in this course when responding to the following:
 Refer to Figure 1 and what you have learned so far in this course when responding to the following: 1.Looking down on a Northern Hemisphere extratropical cyclone, surface winds blow [(clockwise and outward)(counterclockwise
Correction to Spatial and temporal distributions of U.S. winds and wind power at 80 m derived from measurements
 JOURNAL OF GEOPHYSICAL RESEARCH, VOL. 109,, doi:10.1029/2004jd005099, 2004 Correction to Spatial and temporal distributions of U.S. winds and wind power at 80 m derived from measurements Cristina L. Archer
Mid-Latitude Cyclones and Fronts. Lecture 12 AOS 101
 Mid-Latitude Cyclones and Fronts Lecture 12 AOS 101 Homework 4 COLDEST TEMPS GEOSTROPHIC BALANCE Homework 4 FASTEST WINDS L Consider an air parcel rising through the atmosphere The parcel expands as it
ERTH 465 Fall Lab 5. Absolute Geostrophic Vorticity. 200 points.
 Name Date ERTH 465 Fall 2015 Lab 5 Absolute Geostrophic Vorticity 200 points. 1. All labs are to be kept in a three hole binder. Turn in the binder when you have finished the Lab. 2. Show all work in mathematical
Examination #3 Wednesday, 28 November 2001
 Name & Signature Dr. Droegemeier Student ID Meteorology 1004 Introduction to Meteorology Fall, 2001 Examination #3 Wednesday, 28 November 2001 BEFORE YOU BEGIN!! Please be sure to read each question CAREFULLY
Module 9 Weather Systems
 Module 9 Weather Systems In this module the theory of atmospheric dynamics is applied to different weather phenomena. The first section deals with extratropical cyclones, low and high pressure areas of
Weather report 28 November 2017 Campinas/SP
 Weather report 28 November 2017 Campinas/SP Summary: 1) Synoptic analysis and pre-convective environment 2) Verification 1) Synoptic analysis and pre-convective environment: At 1200 UTC 28 November 2017
DEPARTMENT OF GEOSCIENCES SAN FRANCISCO STATE UNIVERSITY. Metr Fall 2012 Test #1 200 pts. Part I. Surface Chart Interpretation.
 DEPARTMENT OF GEOSCIENCES SAN FRANCISCO STATE UNIVERSITY NAME Metr 356.01 Fall 2012 Test #1 200 pts Part I. Surface Chart Interpretation. Figure 1. Surface Chart for 1500Z 7 September 2007 1 1. Pressure
Cyclones and Anticyclones, Ridges and Troughs
 Cyclones and Anticyclones, Ridges and Troughs Isobars on surface maps often have a closed appearance (as illustrated) Areas of low pressure are called cyclones, while areas with high pressure are called
MET 3502 Synoptic Meteorology. Lecture 8: September 16, AIRMASSES, FRONTS and FRONTAL ANALYSIS (2)
") MET 3502 Synoptic Meteorology Lecture 8: September 16, 2010 AIRMASSES, FRONTS and FRONTAL ANALYSIS (2) Identifying a cold front on a surface weather map: 1. Surface front is located at the leading edge
MET 3502 Synoptic Meteorology Lecture 8: September 16, 2010 AIRMASSES, FRONTS and FRONTAL ANALYSIS (2) Identifying a cold front on a surface weather map: 1. Surface front is located at the leading edge
DEPARTMENT OF EARTH & CLIMATE SCIENCES SAN FRANCISCO STATE UNIVERSITY. Metr Fall 2014 Test #1 September 30, 2014
 DEPARTMENT OF EARTH & CLIMATE SCIENCES SAN FRANCISCO STATE UNIVERSITY NAME Metr 302.02 Fall 2014 Test #1 September 30, 2014 200 pts (4 pts each answer) Part I. Surface Chart Interpretation. Questions 1
Impacts of the April 2013 Mean trough over central North America
 Impacts of the April 2013 Mean trough over central North America By Richard H. Grumm National Weather Service State College, PA Abstract: The mean 500 hpa flow over North America featured a trough over
WISCONSIN TORNADO OUTBREAK OF 18 AUGUST 2005: AN EXAMINATION OF THE VIOLA, WISCONSIN TORNADO
 WISCONSIN TORNADO OUTBREAK OF 18 AUGUST 2005: AN EXAMINATION OF THE VIOLA, WISCONSIN TORNADO Charles D. Koch University of Wisconsin Madison AOS 453: Mesoscale Meteorology Professor Greg Tripoli 13 May
WEATHER PATTERNS NAME DATE. VOCABULARY: Synoptic weather map- Isotherm- Barometric Pressure- Isobar- Convergence- Divergence- Cyclone- Anticyclone-
 NAME DATE VOCABULARY: Synoptic weather map- WEATHER PATTERNS Isotherm- Barometric Pressure- Isobar- Convergence- Divergence- Cyclone- Anticyclone- Air mass- Source region- Front- OBJECTIVE: Construct a
Activity: A Satellite Puzzle
 Activity: A Satellite Puzzle Introduction Satellites provide unique views of Earth. The imagery acquired by these space platforms reveal weather systems and broad-scale circulation patterns that can be
Summary of High Wind Event of 7 March 2004
 Summary of High Wind Event of 7 March 2004 This event was characterized by a very strong jet streak that developed over North Carolina by 00 UTC 8 March, as seen in the Eta model analysis at 300 mb, with
P12.6 Multiple Modes of Convection in Moderate to High Wind Shear Environments
 P12.6 Multiple Modes of Convection in Moderate to High Wind Shear Environments Adam J. French and Matthew D. Parker North Carolina State University, Raleigh, North Carolina 1. INTRODUCTION A principle
Synoptic Meteorology I: Lab 1 Discussion. 25 September From page 14 of Meteorological Data and an Introduction to Synoptic Analysis,
 Synoptic Meteorology I: Lab 1 Discussion 25 September 2014 Overview On the following pages, isoplethed analyses of sea-level pressure (every 4 hpa; Figure 1), 2-m temperature (every 5 F; Figure 2), 2-m
ERTH 360 Test #2 Key Fall pts
 DEPARTMENT OF EARTH & CLIMATE SCIENCES SAN FRANCISCO STATE UNIVERSITY Nov 29, 2016 ERTH 360 Test #2 Key Fall 2016 200 pts Each question is worth 4 points. Indicate your BEST CHOICE for each question on
Final Examination, MEA 443 Fall 2008, Lackmann
 Place an X here to count it double! Name: Final Examination, MEA 443 Fall 2008, Lackmann If you wish to have the final exam count double and replace your midterm score, place an X in the box above. As
Chapter 1 Anatomy of a Cyclone
 Chapter 1 Anatomy of a Cyclone The Beast in the East 15-17 February 2003 Extra-tropical cyclone an area of low pressure outside of the tropics Other names for extra-tropical cyclones: Cyclone Mid-latitude
CASE STUDY OF THE NOVEMBER WINDSTORM IN SOUTH CENTRAL COLORADO
 32 CASE STUDY OF THE 12-13 NOVEMBER WINDSTORM IN SOUTH CENTRAL COLORADO Paul Wolyn * NOAA/NWS Pueblo, CO 1. INTRODUCTION During the evening and early morning of 12-13 November 2011, a damaging downslope
THE MAP ROOM. BAND ON THE RUN Chasing the Physical Processes Associated with Heavy Snowfall
 THE MAP ROOM BAND ON THE RUN Chasing the Physical Processes Associated with Heavy Snowfall BY CHARLES E. GRAVES, JAMES T. MOORE, MARC J. SINGER, AND SAM NG AFFILIATIONS: GRAVES, MOORE, AND NG Department
THE DEEPENING OF A LOW-LEVEL TROUGH AS INDICATED BY DUST ALOFT IN GOES ' INFRARED PICTURES
 REFERENCES Baughman, R. G., and C. W. Schmid, Jr.: Lightning Storm Characteristics. U.S. Service, Intermountain Forest and Range ment Station, Research Paper in press. Davis, L. S., and R. W. Cooper, 1963:
u g z = g T y (1) f T Margules Equation for Frontal Slope
 f T Margules Equation for Frontal Slope") Margules Equation for Frontal Slope u g z = g f T T y (1) Equation (1) is the thermal wind relation for the west wind geostrophic component of the flow. For the purposes of this derivation, we assume that
Margules Equation for Frontal Slope u g z = g f T T y (1) Equation (1) is the thermal wind relation for the west wind geostrophic component of the flow. For the purposes of this derivation, we assume that
Department of Earth & Climate Sciences Spring 2016 Meteorology 260
 Department of Earth & Climate Sciences Spring 2016 Meteorology 260 Name Laboratory #9 Key: Joplin Tornado Day Subsynoptic, Thermodynamic, and Wind Shear Setting Part A: 1600 UTC Surface Chart Subsynoptic
Department of Geosciences San Francisco State University Spring Metr 201 Monteverdi Quiz #5 Key (100 points)
") Department of Geosciences Name San Francisco State University Spring 2012 Metr 201 Monteverdi Quiz #5 Key (100 points) 1. Fill in the Blank or short definition. (3 points each for a total of 15 points)
Department of Geosciences Name San Francisco State University Spring 2012 Metr 201 Monteverdi Quiz #5 Key (100 points) 1. Fill in the Blank or short definition. (3 points each for a total of 15 points)
P3.17 THE DEVELOPMENT OF MULTIPLE LOW-LEVEL MESOCYCLONES WITHIN A SUPERCELL. Joshua M. Boustead *1 NOAA/NWS Weather Forecast Office, Topeka, KS
 P3.17 THE DEVELOPMENT OF MULTIPLE LOW-LEVEL MESOCYCLONES WITHIN A SUPERCELL Joshua M. Boustead *1 NOAA/NWS Weather Forecast Office, Topeka, KS Philip N. Schumacher NOAA/NWS Weather Forecaster Office, Sioux
Example of the "Vorticity Advection" Pitfall
 Example of the "Vorticity Advection" Pitfall NOGAPS 60 h Forecast for 500 mb Heights and Absolute Vorticity The 500 mb chart with absolute vorticity overlain is the first chart most operational meteorologists
Class exercises Chapter 3. Elementary Applications of the Basic Equations
 Class exercises Chapter 3. Elementary Applications of the Basic Equations Section 3.1 Basic Equations in Isobaric Coordinates 3.1 For some (in fact many) applications we assume that the change of the Coriolis
Answers to Clicker Questions
 Answers to Clicker Questions Chapter 1 What component of the atmosphere is most important to weather? A. Nitrogen B. Oxygen C. Carbon dioxide D. Ozone E. Water What location would have the lowest surface
May 2005 Climate Summary
 Ashley Brooks (765) 494-6574 Jun 7, 2005 http://iclimate.org May 2005 Climate Summary May 1-5 Early May was characterized by an upper-level trough that was in place over Indiana that brought in very cool
ESCI 1010 Lab 6 Midlatitude Cyclones and Thunderstorms
 ESCI 1010 Lab 6 Midlatitude Cyclones and Thunderstorms Before Lab: Review pages 244-324 in your Weather and Climate textbook. Pay special attention to the sections entitled Fronts, Life Cyclone of a Midlatitude
Oakfield, WI Tornado of July 18 th, 1996: "Everything in its Right Place"
 Oakfield, WI Tornado of July 18 th, 1996: "Everything in its Right Place" Arian Sarsalari Department of Atmospheric and Oceanic Sciences, University of Wisconsin Madison ABSTRACT This paper will serve
April 13, 2006: Analysis of the Severe Thunderstorms that produced Hail in Southern Wisconsin
 April 13, 2006: Analysis of the Severe Thunderstorms that produced Hail in Southern Wisconsin Danielle Triolo UW Madison Undergraduate 453 Case Study May 5, 2009 ABSTRACT On April 13, 2006 the states of
WEATHER FORECASTING Acquisition of Weather Information WFO Regions Weather Forecasting Tools Weather Forecasting Tools Weather Forecasting Methods
 1 2 3 4 5 6 7 8 WEATHER FORECASTING Chapter 13 Acquisition of Weather Information 10,000 land-based stations, hundreds of ships and buoys; four times a day, airports hourly Upper level: radiosonde, aircraft,
DEPARTMENT OF EARTH & CLIMATE SCIENCES NAME SAN FRANCISCO STATE UNIVERSITY Fall ERTH FINAL EXAMINATION KEY 200 pts
 DEPARTMENT OF EARTH & CLIMATE SCIENCES NAME SAN FRANCISCO STATE UNIVERSITY Fall 2016 Part 1. Weather Map Interpretation ERTH 365.02 FINAL EXAMINATION KEY 200 pts Questions 1 through 9 refer to Figure 1,
>>>>>>>>WHEN YOU FINISH <<<<<<<< Hand in the answer sheet separately.
 Instructor: Prof. Seiberling PHYSICS DEPARTMENT MET 1010 3rd Midterm Exam December 9, 2002 Name (print, last rst): Signature: On my honor, I have neither given nor received unauthorized aid on this examination.
1. Which weather map symbol is associated with extremely low air pressure? A) B) C) D) 2. The diagram below represents a weather instrument.
 B) C) D) 2. The diagram below represents a weather instrument.") 1. Which weather map symbol is associated with extremely low air pressure? 2. The diagram below represents a weather instrument. Which weather variable was this instrument designed to measure? A) air pressure
1. Which weather map symbol is associated with extremely low air pressure? 2. The diagram below represents a weather instrument. Which weather variable was this instrument designed to measure? A) air pressure
Joshua M. Boustead *1 NOAA/NWS WFO Omaha/Valley, NE. Philip N. Schumacher NOAA/NWS WFO Sioux Falls, SD
 11B.2 Influence of Diabatic Potential Vorticity Anomalies upon Warm Conveyor Belt Flow. Part II: 3-5 January 2005 Joshua M. Boustead *1 NOAA/NWS WFO Omaha/Valley, NE Philip N. Schumacher NOAA/NWS WFO Sioux
The Greensburg, KS Tornado
 J2.4 The Greensburg, KS Tornado Daniel McCarthy NOAA Storm Prediction Center Norman, OK Larry Ruthi and Jeff Hutton NWS Weather Forecast Office Dodge City, KS 1. Background The tornado that moved through
Meteorology Lecture 15
 Meteorology Lecture 15 Robert Fovell rfovell@albany.edu 1 Important notes These slides show some figures and videos prepared by Robert G. Fovell (RGF) for his Meteorology course, published by The Great
Lab Exploration #5: The Weather Complicates Things Further. Learning Objectives. After completing this activity, you should be able to:
 METR 104: Our Dynamic Weather (w/lab) Lab Exploration #5: The Weather Complicates Things Further Dr. Dave Dempsey, Department of Earth & Climate Sciences, SFSU, Spring 2014 (5 points) (Thursday, April
Observation Homework Due 11/24. Previous Lecture. Midlatitude Cyclones
 Lecture 21 Midlatitude Cyclones Observation Homework Due 11/24 1 2 Midlatitude Cyclones Midlatitude Cyclone or Winter Storm Cyclogenesis Energy Source Life Cycle Air Streams Vertical Structure Storm Hazards
Cloud-to-Ground Lightning Production in Strongly Forced, Low- Instability Convective Lines
 Cloud-to-Ground Lightning Production in Strongly Forced, Low- Instability Convective Lines Matthew S. Van Den Broeke National Weather Center Research Experiences for Undergraduates, and Valparaiso University
Monthly Long Range Weather Commentary Issued: APRIL 18, 2017 Steven A. Root, CCM, Chief Analytics Officer, Sr. VP,
 Monthly Long Range Weather Commentary Issued: APRIL 18, 2017 Steven A. Root, CCM, Chief Analytics Officer, Sr. VP, sroot@weatherbank.com MARCH 2017 Climate Highlights The Month in Review The average contiguous
A case study of a heat low over central Australia
 A case study of a heat low over central Australia Martin Preissler Meteorological Institute, University of Munich, Germany Michael J. Reeder 1 School of Mathematical Sciences, Monash University, Australia
Winter Storm of 15 December 2005 By Richard H. Grumm National Weather Service Office State College, PA 16803
 Winter Storm of 15 December 2005 By Richard H. Grumm National Weather Service Office State College, PA 16803 1. INTRODUCTION A complex winter storm brought snow, sleet, and freezing rain to central Pennsylvania.
8.5 DIAGNOSIS AND PREDICTION OF THE 3-4 JUNE 2002 IOWA-ILLINOIS FLOOD
 8.5 DIAGNOSIS AND PREDICTION OF THE 3-4 JUNE 2002 IOWA-ILLINOIS FLOOD James T. Moore Ray A. Wolf Brad L. Mickelson Jeff A. Zogg Charles E. Graves Saint Louis University Earth and Atmospheric Sciences St.
Determining Environmental Parameters Most Important for Significant Cool Season Tornadoes across the Gulf Coastal States
 Determining Environmental Parameters Most Important for Significant Cool Season Tornadoes across the Gulf Coastal States Kar retta Venable Jackson State University, Jackson, MS Mentors David Imy NOAA/NWS/NCEP/Storm
severe VOLUME 5, NUMBER 1, FEBRUARY 1980
 severe VOLUME 5, NUMBER 1, FEBRUARY 1980 TORNADIC THUNDERSTORM DEVELOPMENT IN WEST TEXAS 27 MAY 1978 by Richard E. Peterson Atmospheric Science Group Texas University Lubbock, TX and Alan Johnson National
BENSON, MINNESOTA CONVECTIVE SYSTEM ON JUNE 11, 2001
 BENSON, MINNESOTA CONVECTIVE SYSTEM ON JUNE 11, 2001 Steve Froehlich Department of Atmospheric and Oceanic Sciences, University of Wisconsin at Madison Abstract On June 11, 2001 a strong convective cell
Updated 12 Sep 2002 Talking Points for VISITview Lesson Fog Detection and Analysis With Satellite Data Gary Ellrod (NOAA/NESDIS) 1.
 1.") Updated 12 Sep 2002 Talking Points for VISITview Lesson Fog Detection and Analysis With Satellite Data Gary Ellrod (NOAA/NESDIS) 1. Title 2. Fog has a major impact on air safety and efficiency, and may
Updated 12 Sep 2002 Talking Points for VISITview Lesson Fog Detection and Analysis With Satellite Data Gary Ellrod (NOAA/NESDIS) 1. Title 2. Fog has a major impact on air safety and efficiency, and may
The 13 April 2006 Severe Thunderstorm and Large Hail Event in Iowa & Wisconsin:A Case Study
 The 13 April 2006 Severe Thunderstorm and Large Hail Event in Iowa & Wisconsin:A Case Study David M. DeMeuse Undergraduate University of Wisconsin Department of Atmospheric & Oceanic Science Mesoscale
P2.9 Use of the NOAA ARL HYSPLIT Trajectory Model For the Short Range Prediction of Stratus and Fog
 Ellrod, G. P., 2013: Use of the NOAA ARL HYSPLIT Trajectory Model for the Short Range Prediction of Stratus and Fog. Extended Abstract, 38 th National Weather Association Annual Meeting, Charleston, SC,
Dryline Convective Case Study: May 5th 2003 Severe Storm Outbreak
 Dryline Convective Case Study: May 5th 2003 Severe Storm Outbreak Abstract During the spring, thunderstorms develop ahead of a boundary called the dryline. This was the case with the May 4rd, 2003 Outbreak.
Chapter 9. Weather Patterns & Midlatitude Cyclones
 Chapter 9 Weather Patterns & Midlatitude Cyclones Frontal Weather Fronts are boundary surfaces between different air masses. Warm front Cold front Stationary front Occluded front Drylines Frontal Weather
Chapter 7 Properties of the Atmosphere
 14. Day Breezes H L Chapter 7 Properties of the Atmosphere Questions Pages 177 179 1. (3) 2. (4) 3. (4) 4. (3) 5. (2) 6. (3) 7. (2) 8. (2) 9. (3) 10. (1) 11. (4) 12. (2) Questions Pages 186 188 13. (3)
Synoptic Environments Associated with Significant Tornadoes in the Contiguous United States
 Synoptic Environments Associated with Significant Tornadoes in the Contiguous United States Jayson A. Prentice Iowa State Department of Geological & Atmospheric Sciences, Ames, IA Mentor: Jeremy S. Grams
Case Study 3: Dryline in TX and OK 3 May 1999
 Case Study 3: Dryline in TX and OK 3 May 1999 Brandy Lumpkins Department of Atmospheric and Oceanic Sciences University of Wisconsin Madison 8 May 2006 ABSTRACT A massive tornadic outbreak swept across
Multi-day severe event of May 2013
 Abstract: Multi-day severe event of 18-22 May 2013 By Richard H. Grumm and Charles Ross National Weather Service State College, PA A relatively slow moving Trough over the western United States and a ridge
Chapter 10: Mid-latitude Cyclones Mid-Latitude Cyclones
 Chapter 10: Mid-latitude Cyclones Mid-Latitude Cyclones Mid-latitude cyclones form along a boundary separating polar air from warmer air to the south. Life Cycle of Cyclone Cyclone Structures Steering
Chapter 10: Mid-latitude Cyclones
 Chapter 10: Mid-latitude Cyclones Life Cycle of Cyclone Cyclone Structures Steering of Cyclone Mid-Latitude Cyclones Mid-latitude cyclones form along a boundary separating polar air from warmer air to
Mid Atlantic Severe Event of 1 May 2017 Central Pennsylvania QLCS event By Richard H. Grumm National Weather Service, State College, PA 16803
 1. Overview Mid Atlantic Severe Event of 1 May 2017 Central Pennsylvania QLCS event By Richard H. Grumm National Weather Service, State College, PA 16803 A strong upper-level wave (Fig.1) moving into a
Erik Kabela and Greg Carbone, Department of Geography, University of South Carolina
 Downscaling climate change information for water resources Erik Kabela and Greg Carbone, Department of Geography, University of South Carolina As decision makers evaluate future water resources, they often
Science Olympiad Meteorology Quiz #1 Page 1 of 7
 1) What is generally true about the stratosphere: a) Has turbulent updrafts and downdrafts. b) Has either a stable or increasing temperature profile with altitude. c) Where the auroras occur. d) Both a)
3A.4 AN ANALYSIS OF THE ELEVATED MIXED LAYER DURING THE SUPER TUESDAY OUTBREAK
 3A.4 AN ANALYSIS OF THE ELEVATED MIXED LAYER DURING THE SUPER TUESDAY OUTBREAK Christina C. Crowe* & John R. Mecikalski University of Alabama - Huntsville, Huntsville, Alabama 1. INTRODUCTION 1.1. Elevated
Mesoscale Convective System and heat episode July 2005 by Richard H. Grumm and Mathew Steinbugl
 Mesoscale Convective System and heat episode 25-27 July 2005 by Richard H. Grumm and Mathew Steinbugl 1. INTRODUCTION A strong upper-level ridge brought unseasonably high temperatures to the Midwest and
Dynamic Meteorology 1
 Dynamic Meteorology 1 Lecture 14 Sahraei Department of Physics, Razi University http://www.razi.ac.ir/sahraei Buys-Ballot rule (Northern Hemisphere) If the wind blows into your back, the Low will be to
ESCI 344 Tropical Meteorology Lesson 8 Tropical Weather Systems
 ESCI 344 Tropical Meteorology Lesson 8 Tropical Weather Systems References: Tropical Climatology (2 nd Ed.), McGregor and Nieuwolt Climate and Weather in the Tropics, Riehl Climate Dynamics of the Tropics,
Diagnostic Study of a Severe Thunderstorm over Jeddah
 Atmospheric and Climate Sciences, 2013, 3, 150-164 http://dx.doi.org/10.4236/acs.2013.31017 Published Online January 2013 (http://www.scirp.org/journal/acs) Diagnostic Study of a Severe Thunderstorm over
P1.20 AN ANALYSIS OF SYNOPTIC PATTERNS ASSOCIATED WITH STRONG NORTH TEXAS COLD FRONTS DURING THE COLD SEASON
 P1.20 AN ANALYSIS OF SYNOPTIC PATTERNS ASSOCIATED WITH STRONG NORTH TEXAS COLD FRONTS DURING THE 2005-06 COLD SEASON Stacie Hanes* and Gregory R. Patrick NOAA/NWS Weather Forecast Office Fort Worth, TX